

Key Points
GA focusing on physical function and depression improves the power of survival prediction models for older patients with AML.
Cognitive and physical impairments are associated with nonfatal toxicities during induction chemotherapy in older patients with AML.

Abstract
Given that there are only a few prospective studies with conflicting results, we investigated the prognostic value of multiparameter geriatric assessment (GA) domains on tolerance and outcomes after intensive chemotherapy in older adults with acute myeloid leukemia (AML). In all, 105 newly diagnosed patients with AML who were older than age 60 years and who received intensive chemotherapy consisting of cytarabine and idarubicin were enrolled prospectively. Pretreatment GA included evaluations for social and nutritional support, cognition, depression, distress, and physical function. The median age was 64 years (range, 60-75 years), and 93% had an Eastern Cooperative Oncology Group performance score <2. Between 32.4% and 69.5% of patients met the criteria for impairment for each domain of GA. Physical impairment by the Short Physical Performance Battery (SPPB) and cognitive dysfunction by the Mini-Mental State Examination in the Korean version of the Consortium to Establish a Registry for Alzheimer’s Disease (CERAD) Assessment Packet (MMSE-KC) were significantly associated with nonfatal toxicities, including grade 3 to 4 infections (SPPB, P = .024; MMSE-KC, P = .044), acute renal failure (SPPB, P = .013), and/or prolonged hospitalization (≥40 days) during induction chemotherapy (MMSE-KC, P = .005). Reduced physical function by SPPB and depressive symptoms by the Korean version of the short form of geriatric depression scales (SGDS-K) were significantly associated with inferior survival (SPPB, P = .027; SGDS-K, P = .048). Gait speed and sit-and-stand speed were the most powerful measurements for predicting survival outcomes. Notably, the addition of SPPB and SGDS-K, gait speed and SGDS-K, or sit-and-stand speed and SGDS-K significantly improved the power of existing survival prediction models. In conclusion, GA improved risk stratification for treatment decisions and may inform interventions to improve outcomes for older adults with AML. This study was registered at the Clinical Research Information Service as #KCT0002172.
Medscape Continuing Medical Education online
In support of improving patient care, this activity has been planned and implemented by Medscape, LLC and the American Society of Hematology. Medscape, LLC is jointly accredited by the Accreditation Council for Continuing Medical Education (ACCME), the Accreditation Council for Pharmacy Education (ACPE), and the American Nurses Credentialing Center (ANCC), to provide continuing education for the healthcare team.
Medscape, LLC designates this Journal-based CME activity for a maximum of 1.00 AMA PRA Category 1 Credit(s)™. Physicians should claim only the credit commensurate with the extent of their participation in the activity.
Successful completion of this CME activity, which includes participation in the evaluation component, enables the participant to earn up to 1.0 MOC points in the American Board of Internal Medicine's (ABIM) Maintenance of Certification (MOC) program. Participants will earn MOC points equivalent to the amount of CME credits claimed for the activity. It is the CME activity provider's responsibility to submit participant completion information to ACCME for the purpose of granting ABIM MOC credit.
All other clinicians completing this activity will be issued a certificate of participation. To participate in this journal CME activity: (1) review the learning objectives and author disclosures; (2) study the education content; (3) take the post-test with a 75% minimum passing score and complete the evaluation at http://www.medscape.org/journal/blood; and (4) view/print certificate. For CME questions, see page 1773.
Disclosures
Editor Selina M. Luger Received research funding from the following ineligible companies: Celgene Corporation; Kura Oncology, Inc; Onconova Therapeutics, Inc. Consultant or advisor for the following ineligible companies: Bristol-Myers Squibb Company (former); Loxo Oncology (former); Pluristem Therapeutics Inc (former). CME questions author Laurie Barclay owns stock, stock options, or bonds from the following ineligible company: AbbVie Inc (former).
Learning objectives
Upon completion of this activity, participants will:
- 1.
Describe the prognostic value of geriatric assessment (GA) measures regarding treatment tolerance during induction chemotherapy in newly diagnosed older adults with acute myeloid leukemia (AML), according to a single-institution prospective cohort study
- 2.
Determine the prognostic value of GA measures regarding survival outcomes after induction chemotherapy in newly diagnosed older adults with AML, according to a single-institution prospective cohort study
- 3.
Identify improvement of existing survival prediction models by GA measures among newly diagnosed older adults with AML, and other clinical implications of this single-institution prospective cohort study
Release date: March 17, 2022; Expiration date: March 17, 2023
Introduction
Acute myeloid leukemia (AML) is a disease of the elderly with a median age at diagnosis between 68 and 72 years.1,2 Older adults with AML (usually defined as age ≥60) have worse survival outcomes than younger patients with AML because they have different biology and more frequently have unfavorable cytogenetics, a decline in performance status, and acquired comorbidities.3 The mutational spectrum in older adults with AML also differs from that in younger patients,4 and differentiated mutational patterns could aid precise prognostication.5 Selected cases of older adults with AML can benefit from intensive chemotherapy, including that containing anthracycline and cytarabine, despite the risk for increased toxicity from treatment.3,6,7 Several prognostic models have been developed to identify patients at high risk of early death (ED), treatment resistance, or poor survival after conventional intensive AML therapy.8 However, they were limited by low accuracy and the need for reassessment to reflect changes resulting from continuous improvement in supportive care.8
Chronological age, performance status, and comorbidities are commonly used to determine fitness for intensive treatment. These variables are relatively easy to assess but are limited in capturing the heterogeneity of older patients with hematologic malignancies.9-11 Therefore, additional assessment tools are needed to better characterize fitness in the context of therapy and to capture the frailty that arises from “decreased reserves in multiple organ systems, which are initiated by disease, lack of activity, inadequate nutritional intake, stress, and/or the physiologic changes by aging.”10,11 Among various frailty assessments, multiparameter geriatric assessment (GA) offers more comprehensive evaluations, including functional ability, physical health, cognition, psychological health, nutritional status, and social support.10,11 Despite the growing evidence that GA can detect unrecognized vulnerabilities in patients with hematologic malignancies to help predict treatment tolerance and survival, GA is limited by lack of standardization and consensus regarding its prognostic value in older adults with AML.10,11 Two previous prospective studies of GA in older adults with AML had conflicting results regarding the role of physical performance measures as survival predictors, suggesting the need for further prospective validation of GAs.12,13 Furthermore, the degree to which preexisting survival prediction models, such as web-based prediction models for AML (AML scores),14 Ferrara criteria,15 or Wheatley index,16 can be improved by integrating components of GA still needs to be determined.8 Here, we report the results of a single-institution prospective cohort study that included newly diagnosed older adults with AML who received homogeneous intensive induction chemotherapy to determine which patient-related characteristics assessed by GA predict treatment tolerance and outcomes and how much they can improve survival prediction tools.
Methods
Study design and population
We performed a single-center prospective cohort study enrolling adults age 60 years or older newly diagnosed with AML between November 2016 and December 2019 who underwent intensive induction chemotherapy. Inclusion criteria were as follows: newly diagnosed AML, age between 60 and 75 years, Eastern Cooperative Oncology Group performance score (ECOG PS) ≤2, plan for intensive induction chemotherapy, and ability to provide written informed consent and answer various questionnaires. Exclusion criteria were the presence of another active malignancy, acute promyelocytic leukemia, AML involving the central nervous system, active infection or uncontrolled bleeding, or impaired organ function such as severe renal, hepatic, or cardiac dysfunction. All patients received induction chemotherapy consisting of idarubicin (12 mg/m2) for 3 days plus cytarabine (100 mg/m2) for 7 days.17 Sixty-one patients (58%) underwent allogeneic stem cell transplantation with suitable donors after 1 or 2 cycles of consolidation.17 The Institutional Review Board of The Catholic Medical Center approved this study. All analyses were performed according to the Institutional Review Board guidelines and the tenets of the Declaration of Helsinki.
GA measures
GAs were performed in the inpatient ward at enrollment by a study nurse who followed published procedures for administration and scoring of each assessment. We performed objective physical performance measurements of handgrip strength and the Short Physical Performance Battery (SPPB). Handgrip strength (in kilograms) was measured by using a hydraulic grip strength dynamometer and was performed by a professional rehabilitation medicine doctor.18 SPPB reliably predicts future disability, hospitalizations, and mortalities among elderly patients, consisting of a gait speed test (distance of 4 meters), sit-and-stand speed test (standing from a chair maneuvers repeated 5 times), and balance tests (subdivided into side-by-side stand, semi-tandem stand, and tandem stand balancing for 10 seconds each); each measurement was scored from 0 to 4 (0 is unable to complete the test and 4 is the highest performance level), with a total score ranging from 0 to 12.19 SPPB, gait speed, and sit-and-stand speed were analyzed as categorical variables using cutoffs of ≤8, ≤3, and ≤3, respectively, for impairment. Cognitive function was assessed using the Mini-Mental State Examination in the Korean version of the Consortium to Establish a Registry for Alzheimer’s Disease (CERAD) Assessment Packet (MMSE-KC), which has been used widely and validated in the Korean population to measure cognitive impairment.20 MMSE-KC comprehensively evaluates different subsets of cognitive status, including attention, language, memory, orientation, and visuospatial proficiency. We also used the Korean version of the Nursing Delirium Symptom Checklist (KNU-DESC), a recently developed accurate but straightforward and sensitive screening instrument for detecting cognitive impairment, especially early delirium. KNU-DSEC consists of 5 categories of assessment: disorientation, inappropriate behavior, inappropriate communication, illusions or hallucinations, and psychomotor retardation.21 For psychological function, we used 2 scales of the Korean version of the Short-Form Geriatric Depression Scale (SGDS-K), which focuses on depressive symptoms in elderly populations, and Patient Health Questionnaire-9 (PHQ-9), more generalized screening tools of depression and related psychologic diagnoses.22,23 In addition, we used the National Comprehensive Cancer Network’s Distress Thermometer (NCCN-DT) screening measure to identify and address psychological distress.24 Social support was assessed by using Older Americans Resources and Services (OARS), and nutritional support was evaluated with the Mini Nutritional Assessment (MNA).25,26 Nutritional support and bedside or ambulatory physical training programs were provided by expert therapists based on referral. Psychiatrists were involved in treatment only when referred for psychological symptoms. Cutoff values for other categorical variables were as follows: MMSE-KC (≤23), KNU-DESC (≥2), SGDS-K (≥6), PHQ-9 (≥6), NCCN-DT (≥3), OARS (≥18), and MNA (≥23.5).
Covariates
Patient-specific variables (echocardiogram, pulmonary function test, and body temperature) and AML-specific variables (white blood cell count, platelet count, lactate dehydrogenase level, previous myelodysplastic syndrome or history of other malignancies, cytogenetic abnormalities, and genetic mutations screened by real time-quantitative polymerase chain reaction or next-generation sequencing panel customized for acute leukemia27) were collected from medical records. The attending physician’s estimate of ECOG PS at admission was recorded and categorized as good functional status (score ≤1) or poor functional status (score >1). Comorbidity burden was scored using the Hematopoietic Cell Transplantation Comorbidity Index (HCT-CI).28 Those variables were used to categorize patients using preexisting survival prediction models: AML scores,14 Ferrara criteria,15 Wheatley index,16 and European LeukemiaNet 2017 (ELN 2017) risk classification.29
Outcomes and definitions
The primary outcome was overall survival (OS) defined as the date of diagnosis to the date of death or last follow-up for censored patients. The secondary outcomes were ED,12 defined as death within 60 days after induction chemotherapy, complete remission (CR), and nonrelapse mortality (NRM). We defined CR as a morphologic leukemia-free state with <5% blasts in the bone marrow and no persistent extramedullary disease. NRM was empirically defined as death for any reason without evidence of disease recurrence and was calculated by cumulative incidence estimation, treating relapse as a competing risk. The adverse events were evaluated by the National Cancer Institute’s Common Terminology Criteria for Adverse Events (version 4.0), in which nonfatal toxicities were grades 1 to 4, and fatal toxicity was grade 5.
Statistical analysis
The categorical variables were compared using a χ2 analysis and Fisher’s exact test, and continuous variables were assessed using Student t test and the Wilcoxon rank-sum test. OS was estimated using Kaplan-Meier analysis, and the difference in survival between the groups was compared using a log-rank analysis. NRM was assessed using a cumulative incidence estimation method, and comparisons of NRM between the groups were based on Gray’s competing risk method. Multivariable logistic regression was used to examine baseline GA measurements as predictors of adverse events during induction chemotherapy, including infection, acute renal failure, hepatotoxicity, gastrointestinal complications, and prolonged hospitalization longer than 40 days. We also examined survival (OS and NRM) predictors by comparing available clinical variables such as baseline characteristics, GA measurements, and preexisting survival prediction models. Variables found to be significant in univariable models were included in multivariable models. Highly correlated variables were evaluated by the correlation coefficient of each predictor. We designed separate multivariable models for highly correlated variables. Multivariable models were derived using stepwise selection among candidate variables with the Wald test for overall P value for factors with >2 levels and a value of P < .05 to warrant inclusion in the model. To assess the incremental impact of score variables on predicting survival, we used Integrated Discrimination Improvement (IDI) as described for survival analysis by Chambless et al.30 Statistical significance was determined as a P < .05 (2-tailed). All statistical analyses were conducted using SPSS, version 13.0 (SPSS, Chicago, IL) and R software (version 3.4.1; R Foundation for Statistical Computing, 2017).
Results
Demographics
The screening and enrollment of the potentially eligible participants are illustrated in supplemental Figure A (available on the Blood Web site). A total of 202 patients were diagnosed during the study period, 125 patients were eligible, and 105 patients agreed to participate. Ineligible patients received nonintensive chemotherapy (n = 60; decitabine, n = 53; low-dose cytarabine, n = 3; azacitidine, n = 3; and gilteritinib, n = 1) or best supportive care (n = 17; poor ECOG PS, n = 12; refusal of any chemotherapy, n = 5). The baseline characteristics are described in Table 1. Among the 105 enrolled patients, the median age was 64 years (range, 60-75 years), and 61.9% were male. Based on the ELN 2017 risk classification, 30.5% of the patients exhibited poor risk features, and 30.5% had secondary AML. We classified patients by using the existing survival prediction models (Table 1). The Wheatley index is a model used for predicting survival of older adults with AML by large cohorts of the Medical Research Council AML11 and the Leukemia Research Fund AML 14 trials.16 By the Wheatley index, 21.9% had poor survival risk. AML scores through a web-based application for risk assessment of intensive chemotherapy in older adults with AML were available to predict the probability of CR and the risk of ED along with survival.14 Median AML scores for CR and ED were 61.3% (range, 14.5%-90.6%) and 18.9% (range, 6.1%-52.4%), respectively. Ferrara criteria,15 which includes 9 covariates to classify fitness for intensive chemotherapy based on risks for ED and OS, classified 26.7% of patients as unfit.
Baseline characteristics of the study cohort (N = 105)
| Characteristic | No. | % | Median (range) |
|---|---|---|---|
| Age at diagnosis, y | 64 (60-75) | ||
| 60-64 | 54 | 51.4 | |
| 65-70 | 37 | 35.3 | |
| 71-75 | 14 | 13.3 | |
| Sex | |||
| Male | 65 | 61.9 | |
| Female | 40 | 38.1 | |
| AML disease type | |||
| De novo | 73 | 69.5 | |
| Secondary | 32 | 30.5 | |
| ELN 2017 criteria | |||
| Favorable | 24 | 22.9 | |
| Intermediate | 49 | 46.7 | |
| Poor | 32 | 30.5 | |
| Genetic mutation | |||
| Biallelic CEBPA | 6 | 5.7 | |
| NPM1 without FLT3- ITD or with FLT3-ITD (low) | 13 | 12.4 | |
| NPM1 with FLT3-ITD (high) | 10 | 9.5 | |
| FLT3-ITD (high) without NPM1 | 9 | 8.6 | |
| RUNX1 | 10 | 9.5 | |
| ASXL1 | 9 | 8.6 | |
| TP53 | 2 | 1.9 | |
| Laboratory findings at baseline | |||
| WBC × 109/L | 3.8 (0.3-345.7) | ||
| Hemoglobin | 9.1 (5.2-13.0) | ||
| Platelet count × 109/L | 68.0 (9.0-827.0) | ||
| Creatinine, mg/dL | 0.9 (0.5-1.7) | ||
| Albumin, g/dL | 3.8 (2.8-5.0) | ||
| Fibrinogen, mg/dL | 344.0 (57.0-500.0) | ||
| Lactate dehydrogenase, U/L | 471.0 (184.0-13 200.0) | ||
| Basic assessment | |||
| Cardiac function, LVEF (%) | 64.0 (52.0-74.2) | ||
| Pulmonary function | |||
| FEV-1 (%) | 88.0 (57.0-115.0) | ||
| Adjusted DLCO (%) | 77.0 (42.0-119.0) | ||
| ECOG PS | |||
| 0-1 | 98 | 93.3 | |
| 2 | 7 | 6.7 | |
| HCT-CI | |||
| ≥3 | 24 | 22.9 | |
| ≥4 | 15 | 14.3 | |
| ≥5 | 9 | 8.6 | |
| Wheatley index* | |||
| Score | 7 (4-14) | ||
| Good risk (4-6) | 52 | 49.5 | |
| Standard risk (7-8) | 30 | 28.6 | |
| Poor risk (≥9) | 23 | 21.9 | |
| AML scores† | |||
| ED score, % | 18.9 (6.1-52.4) | ||
| 1st quartile | 26 | 24.8 | |
| 2nd quartile | 26 | 24.8 | |
| 3rd quartile | 24 | 22.9 | |
| 4th quartile | 29 | 27.6 | |
| CR score, % | 61.3 (14.5-90.6) | ||
| 1st quartile | 27 | 25.7 | |
| 2nd quartile | 26 | 24.8 | |
| 3rd quartile | 28 | 26.7 | |
| 4th quartile | 24 | 22.8 | |
| Ferrara criteria† | |||
| Age 75 years or older | 1 | ||
| ECOG PS ≥3 | 0 | ||
| Heart (LVEF ≤50%) | 0 | ||
| Lungs (DLCO ≤65% or FEV-1 ≤65%) | 21 | ||
| Kidney (on dialysis) | 3 | ||
| Liver (LFT >3× normal values) | 4 | ||
| Infection (resistant to anti-infective therapy) | 0 | ||
| Mental illness or uncontrolled cognitive status | 0 | ||
| Any other comorbidity that the physician judged to be incompatible with chemotherapy | 0 | ||
| Unfit‡ | 28 | 26.7 |
DLCO, diffusing capacity of lungs for carbon monoxide; FEV-1, forced expiratory volume at 1 second; ITD, internal tandem duplication; LFT, liver function test; LVEF, left ventricular ejection fraction; WBC, white blood cell count.
Wheatley risk score comprises cytogenetic risk group, WBC group, ECOG PS, age group, and AML type.16
AML scores calculate the probability of CR or ED (%) with appropriate formula, including initial body temperature, hemoglobin, platelet count, fibrinogen level, lactate dehydrogenase level, age, cytogenetic/molecular risk classification, and AML type.14
Ferrara operation criteria define unfitness for intensive chemotherapy in AML. The definition of unfitness for intensive chemotherapy should require the fulfillment of ≥1 of 9 criteria.44
GA measures
All enrolled patients participated in GAs and answered various questionnaires; there were no missing data. The median time from admission to administration of GAs was 3 days (range, 2-7 days), and approximately 40 minutes (a minimum of 30 minutes to a maximum of 1 hour) was spent evaluating each patient with a GA. Induction chemotherapy started 1 day after completion of GA measurements. The baseline GA scores are presented in Table 2. Almost all patients (92.4%) had various impairments in physical function (57.6%), nutritional status (33.3%), social support (32.4%), cognitive function (34.0%), and psychological function (depressive symptoms or distress; 69.5%). Regarding physical function, 35.2% exhibited impairment by objectively measured SPPB, whereas 9.5% of the Korean version of the modified Barthel index (K-MBI) and 29.5% of the Korean version of Instrumental Activities of Daily Living (K-IADL) self-reported measures captured recalled function status. Correlation analysis (supplemental Table A) revealed that impairments in SPPB were correlated with all other measures of physical function. Domains of physical function were commonly correlated with impairments in cognition (MMSE-KC), depression (SGDS-K and PHQ-9), and nutrition (MNA).
Baseline GA measures for the study cohort (N = 105)
| GA category | Score | No. | % | Median (range) |
|---|---|---|---|---|
| Physical function assessment | ||||
| K-MBI as ADL measurement | 105 (24-05) | |||
| Impaired K-MBI | ≤100 | 10 | 9.5 | |
| K-IADL | 10 (10-28) | |||
| Impaired K-IADL | ≥12 | 31 | 29.5 | |
| SPPB | 10 (3-12) | |||
| Impaired SPPB | ≤8 | 37 | 35.2 | |
| Standing balance consists of 3 subsequent balance tests | ≤3 points | |||
| Side-by-side stand <10 s | 0 points | 0 | ||
| Semitandem stand <10 s | 0 points | 3 | 2.9 | |
| Tandem stand <10 s | 18 | 17.2 | ||
| 3.0-9.9 s | 1 point | 9 | 50.0 | |
| >3.0 s or cannot perform | 0 points | 9 | 50.0 | |
| Gait speed assessment (4 meters), ≥4.82 s | ||||
| <4.82 s | 4 points | 48 | 45.7 | |
| 4.82-6.20 s | 3 points | 27 | 25.7 | |
| 6.21-8.70 s | 2 points | 14 | 13.3 | |
| >8.70 s | 1 point | 6 | 5.7 | |
| Cannot perform | 0 points | 10 | 9.5 | |
| Sit-and-stand speed, 5 times (≥11.19 s) | ||||
| <11.19 s | 4 points | 46 | 43.8 | |
| 11.19-13.69 s | 3 points | 21 | 20.0 | |
| 13.70-16.69 s | 2 points | 17 | 16.2 | |
| >16.7 s | 1 point | 9 | 8.6 | |
| <60 s or cannot perform | 0 points | 12 | 11.4 | |
| Handgrip strength | ||||
| Dominant hand strength, kg | 28 (12-46) | |||
| Male | 34 (12-46) | |||
| Female | 21 (13-28) | |||
| Impaired handgrip strength, dominant hand (≤4th quartile) | 24 | 22.9 | ||
| Male | 10 | |||
| Female | 14 | |||
| Nutritional status assessment | ||||
| MNA | 25.5 (10.5-33.0) | |||
| Impaired MNA | ≤23.5 | 35 | 33.3 | |
| Social support assessment | ||||
| OARS | 16 (8-24) | |||
| Impaired OARS | ≥18 | 34 | 32.4 | |
| Cognition function assessment | ||||
| MMSE-KC | 26 (15-30) | |||
| Impaired MMSE-KC | ≤23 | 35 | 33.3 | |
| No cognitive impairment | 24-30 | 70 | 66.7 | |
| Mild cognitive impairment | 18-23 | 31 | 29.5 | |
| Severe cognitive impairment | 0-17 | 4 | 3.8 | |
| KNU-DESC | 0 (0-3) | |||
| Impaired KNU-DESC | ≥2 | 2 | 1.9 | |
| Psychological function assessment | ||||
| SGDS-K | 2 (0-15) | |||
| Impaired SGDS-K, moderate depressive symptom | ≥6 | 19 | 18.1 | |
| No depression | 0-5 | 86 | 81.9 | |
| Moderate depressive symptom | 6-9 | 9 | 8.6 | |
| Major depression | ≥10 | 10 | 9.5 | |
| PHQ-9 | 5 (0-27) | |||
| Impaired PHQ-9, mild depression | ≥6 | 50 | 47.6 | |
| No depression | 0-5 | 55 | 52.4 | |
| Mild depression | 6-8 | 18 | 17.1 | |
| Moderate depression | 9-14 | 19 | 18.1 | |
| Severe depression | ≥15 | 13 | 12.4 | |
| NCCN distress thermometer | 3 (0-10) | |||
| Impaired NCCN distress thermometer | ≥3 | 64 | 61.0 | |
ADL, activity of daily living.
Treatment tolerance during induction chemotherapy according to GA measures
Clinical outcomes and adverse events during induction chemotherapy are listed in supplemental Table B. The median recovery period was 26 days (range, 24-29 days) for neutrophil counts and 30 days (range, 29-34 days) for platelet counts during induction chemotherapy. The median hospitalization for induction chemotherapy was 32 days (range, 16-104 days). In our cohort, 65.7% achieved first CR (CR1), 4.8% experienced ED within 60 days, and 58.1% underwent transplantation. Clinical outcomes and adverse events according to baseline characteristics and GA measures are listed in supplemental Table C. Among the baseline characteristics, poor ECOG PS was associated with grade 3 to 4 acute renal failure (21.1% vs 3.5%; P = .019) and high HCT-CI scores were associated with gastrointestinal complications (impaired vs unimpaired; 29.7% vs 12.2%; P = .037). Among the GA measures, impairments in physical function as measured by SPPB (impaired vs unimpaired; 72.9% vs 58.8%; P = .021) and K-IADL (impaired vs unimpaired; 80.6% vs 60.8%; P = .049) and cognitive impairment measured by MMSE-KC (impaired vs unimpaired; 80.0% vs 60.0%; P = .040) were associated with grade 3 to 4 infection. Physical dysfunction measured by SPPB was also associated with grade 3 to 4 acute renal failure (impaired vs unimpaired; 32.4% vs 10.3%; P = .005). Prolonged hospitalization from various adverse events was defined as longer than 40 days (75th percentile) and was associated with poor ECOG PS (impaired vs unimpaired; 17.4% vs 3.7%; P = .040) and impairment in MMSE-KC (impaired vs unimpaired; 40.0% vs 12.9%; P = .002). On multivariable analysis adjusted for age, ECOG PS, and HCT-CI (Figure 1), impairments in MMSE-KC (odds ratio [OR], 2.7; 95% confidence interval, 1.0-6.9; P = .044), and SPPB (OR, 3.0; 95% confidence interval, 1.2-7.8; P = .024) were associated with grade 3 to 4 infection, and SPPB was associated with grade 3 to 4 acute renal failure (OR, 3.9; 95% confidence interval, 1.3-11.4; P = .013). The MMSE-KC score was significantly associated with prolonged hospitalization (OR, 4.2; 95% confidence interval, 1.5-4.2; P = .005). Indeed, among 35 patients who had cognitive impairment on MMSE-KC, 13 developed delirium during induction chemotherapy, which was more frequent than in nonimpaired patients (37.1% vs 12.9%; P = .004).

Forest plot of odds ratios for variables associated with treatment tolerance during induction chemotherapy. Variables that were significant on univariable analysis were adjusted by age, ECOG PS, and HCT-CI. Impairments in MMSE-KC and SPPB were associated with grade 3 to 4 infection, and SPPB was associated with grade 3 to 4 acute renal failure. The MMSE-KC was significantly associated with prolonged hospitalization. *P < .05; **P < .01.
Forest plot of odds ratios for variables associated with treatment tolerance during induction chemotherapy. Variables that were significant on univariable analysis were adjusted by age, ECOG PS, and HCT-CI. Impairments in MMSE-KC and SPPB were associated with grade 3 to 4 infection, and SPPB was associated with grade 3 to 4 acute renal failure. The MMSE-KC was significantly associated with prolonged hospitalization. *P < .05; **P < .01.
Survival outcomes according to GA measures
With a median follow-up of 13.7 months (range, 0.2-48.3 months), the cohort median OS was 24.9 months. However, median NRM was not reached in this study. The 2-year estimated OS was 52.2% (95% confidence interval, 41.5%-61.8%), and the estimated NRM was 36.5% (95% confidence interval, 26.9%-46.2%). Among the GA measures, physical function (SPPB; gait speed and sit-and-stand speed test as a part of SPPB), psychological function (SGDS-K), and nutrition (MNA) were significantly associated with OS and/or NRM on univariable analysis (Figure 2; supplemental Table D). Because of the significant correlations between those measures (supplemental Table A), we performed multivariable analysis of each GA measure with other significant covariates (Figure 3). In multivariable analysis model 1, patients with impaired physical function by SPPB had a higher risk of death (1.9-fold; 95% confidence interval, 1.1- to 3.4-fold; P = .027) and a higher risk of NRM (2.0-fold; 95% confidence interval, 1.1- to 3.9-fold; P = .033). Patients with impaired gait (model 2) had a 2.8-fold (95% confidence interval, 1.5- to 5.2-fold; P = .002) higher risk of death; those with impaired sit-and-stand speed (model 3) had a 3.6-fold (95% confidence interval, 1.9- to 7.0-fold; P < .001) higher risk of death. Patients with impaired gait (model 2) had a 2.5-fold (95% confidence interval, 1.2- to 4.9-fold; P = .011) higher risk of NRM; those with impaired sit-and-stand speed (model 3) had a 3.8-fold (95% confidence interval, 1.8- to 8.2-fold; P < .001) higher risk of NRM. Patients with depressive symptoms based on the SGDS-K (model 4) exhibited a 1.9-fold (95% confidence interval, 1.0- to 3.6-fold; P = .048) higher risk of death and a trend toward higher risk of NRM (hazard ratio, 1.8; 95% confidence interval, 0.9-3.5; P = .097). Overall, 48 patients were referred to psychiatrists because of psychological symptoms during treatment, and 15 patients were confirmed with major depressive disorder (MDD) during the postremission treatment course. All patients with MDD died, mostly as a result of NRM (71.1%). Among 19 patients with impairment measured by SGDS-K, 6 developed MDD, which was more frequent than in patients who were not impaired (31.6% vs 10.5%; P = .028). Nutrition impairment measured by MNA (model #5) was significantly associated with a 2.1-fold (95% confidence interval, 1.1- to 4.0-fold; P = .024) higher risk of NRM.

Kaplan-Meier survival curves according to GA measures. Kaplan-Meier survival curves according to GA measures for physical function with SPPB (A), gait speed (B), and sit-and-stand speed (C) as part of SPPB and for depression with SGDS-K scores (D). Impairments in physical and psychological health were associated with inferior OS.
Kaplan-Meier survival curves according to GA measures. Kaplan-Meier survival curves according to GA measures for physical function with SPPB (A), gait speed (B), and sit-and-stand speed (C) as part of SPPB and for depression with SGDS-K scores (D). Impairments in physical and psychological health were associated with inferior OS.
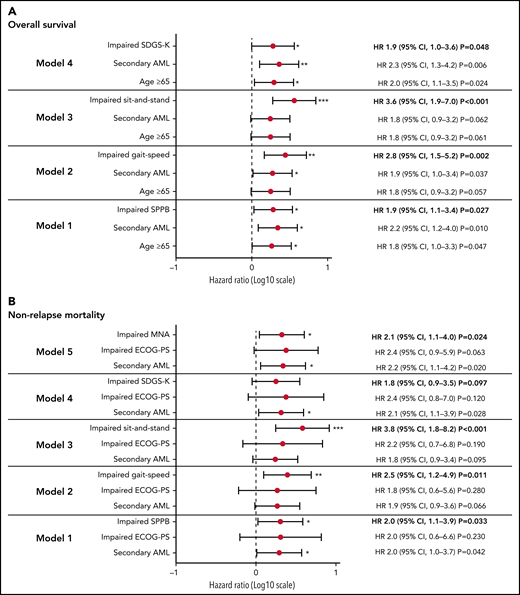
Forest plot of hazard ratio (HR) for variables associated with survival outcomes. We performed multivariable analysis for survival outcomes with variables that were significant on univariable analysis. (A) Among GA measures, SPPB, gait speed, sit-and-stand speed, and SGDS-K impairment were significantly associated with inferior OS. (B) SPPB, gait speed, sit-and-stand speed, and MNA impairment were significantly associated with higher NRM. *P < .05; **P < .01; ***P < .001.
Forest plot of hazard ratio (HR) for variables associated with survival outcomes. We performed multivariable analysis for survival outcomes with variables that were significant on univariable analysis. (A) Among GA measures, SPPB, gait speed, sit-and-stand speed, and SGDS-K impairment were significantly associated with inferior OS. (B) SPPB, gait speed, sit-and-stand speed, and MNA impairment were significantly associated with higher NRM. *P < .05; **P < .01; ***P < .001.
Improvement of existing survival prediction models by GA measures
We evaluated the prognostic values of the existing survival prediction models (supplemental Table E). The Wheatley index and AML scores were significantly associated with worse OS. Figure 4 and supplemental Table F show the explanatory power of survival prediction models and GA measures for OS. The IDI can be interpreted as the proportion of variance explained by the model, similar to r2, which is a measure of how well a regression line fits the data points in linear regression. The Wheatley index score explained 32.1% of the variability in OS. The addition of SPPB and SGDS-K explained an additional 10.1%. Adding gait speed and SGDS-K or sit-and-stand speed and SGDS-K explained 14.8% or 19.1% of the variability of the Wheatley index score. Another prediction model of AML scores for ED exhibited similar results. The addition of SPPB and SGDS-K, gait speed and SGDS-K, or sit-and-stand speed and SGDS-K explained an additional 10.0%, 17.5%, or 23.2% of variability, respectively. Conversely, AML scores for CR demonstrated an additional 10.5% or 13.7% explanatory power when gait speed and SGDS-K or sit-and-stand speed and SGDS-K were added. However, adding SPPB and SGDS-K did not significantly improve the explanatory power.
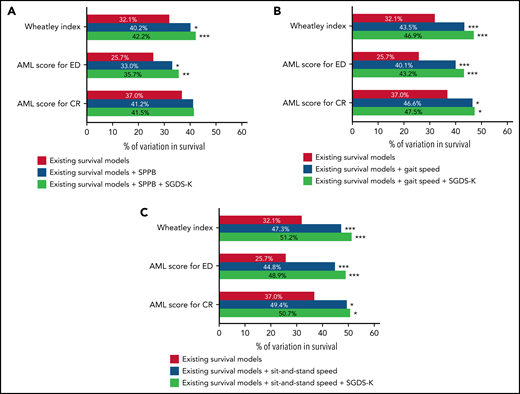
Explanatory power of known prognostic scoring systems to predict OS. (A) The addition of SPPB and SGDS-K improved the power of existing survival prediction models of the Wheatley index (without to with SPPB+SGDS-K; 32.1% to 42.2%; P < .001) and AML score for ED (without to with SPPB+SGDS-K; 25.7% to 35.7%; P = .007) but not in AML score for CR (without to with SPPB+SGDS-K; 37.0% to 41.5%; P = .093). (B) Adding gait speed and SGDS-K improved the prediction power of the Wheatley index (without to with gait speed+SGDS-K; 32.1% to 46.9%; P < .001), AML score for ED (without to with gait speed+SGDS-K; 25.7% to 43.2%; P < .001), and AML score for CR (without to with gait speed+SGDS-K; 37.0% to 47.5%; P = .013). (C) Adding sit-and-stand speed and SGDS-K improved the prediction power of the Wheatley index (without to with sit-and-stand speed+SGDS-K; 32.1% to 51.2%; P < .001), AML score for ED (without to with sit-and-stand speed+SGDS-K; 25.7% to 48.9%; P < .001), and AML score for CR (without to with sit-and-stand speed+SGDS-K; 37.0% to 50.7%; P = .027). *P < .05; **P < .01; ***P < .001.
Explanatory power of known prognostic scoring systems to predict OS. (A) The addition of SPPB and SGDS-K improved the power of existing survival prediction models of the Wheatley index (without to with SPPB+SGDS-K; 32.1% to 42.2%; P < .001) and AML score for ED (without to with SPPB+SGDS-K; 25.7% to 35.7%; P = .007) but not in AML score for CR (without to with SPPB+SGDS-K; 37.0% to 41.5%; P = .093). (B) Adding gait speed and SGDS-K improved the prediction power of the Wheatley index (without to with gait speed+SGDS-K; 32.1% to 46.9%; P < .001), AML score for ED (without to with gait speed+SGDS-K; 25.7% to 43.2%; P < .001), and AML score for CR (without to with gait speed+SGDS-K; 37.0% to 47.5%; P = .013). (C) Adding sit-and-stand speed and SGDS-K improved the prediction power of the Wheatley index (without to with sit-and-stand speed+SGDS-K; 32.1% to 51.2%; P < .001), AML score for ED (without to with sit-and-stand speed+SGDS-K; 25.7% to 48.9%; P < .001), and AML score for CR (without to with sit-and-stand speed+SGDS-K; 37.0% to 50.7%; P = .027). *P < .05; **P < .01; ***P < .001.
Discussion
The role of physical performance measures as predictors of survival has been controversial in intensively treated older adults with AML. Klepin et al12 reported the first prospective data to investigate the predictive value of GA measures in older adults with AML (median age, 69 years; 10.8% were age 80 years or older; 78.1% had an ECOG PS ≤1) showing physical function as a predictor for survival. However, another prospective study by Timilshina et al13 of selected older adults with AML (median age, 68 years; none were age 80 years or older; 85.6% had ECOG PS ≤1) showed that physical performance measures were not good predictors of OS. Those studies had differences in patient selection and were limited by relatively small cohorts and lack of information about mutational status (which requires further validation). Given that previous studies for GA measures in older adults with AML pertain to Western countries, GA must be validated in non-Western countries on the basis of varied outcomes by region because of differences in referral systems,31 genetic background,32,33 and socioeconomic status.34,35 Our Korean cohort was characterized by relatively younger age (median age, 64 years; none were age 80 years or older), good performance status (ECOG PS ≤1; 93.3%), and data about mutational status compared with the aforementioned prospective studies.12,13 Among the GA measures, objectively measured physical dysfunction by SPPB was significantly associated with worse OS and NRM, suggesting that physical function is a good predictor for survival, even in relatively younger patients with better ECOG PS. Of note, gait speed among the SPPB battery was the single measure associated with worse OS and NRM in our cohort, which is in line with a recent prospective study in patients with hematologic malignancies age 75 years or older who had treatment of various intensities.36 In addition, sit-and-stand speed, another component of SPPB, had a prognostic impact on OS and NRM similar to that of gait speed. These results clarified the role of physical function as survival predictors in intensively treated older adults with AML and highlighted the potential of gait speed and sit-and-stand speed as simple measures for frailty.
Our study also highlights the prognostic significance of depressive symptoms for survival. There were reports of an association between depression and mortality in various cancer types, but few in AML.37,38 Klepin et al39 reported that depressive symptom burdens at remission were associated with functional decline after induction chemotherapy and also mortality.40 However, they did not find an association between depression before treatment and mortality partly because of the small cohort.12,39,40 In our cohort, baseline depressive symptoms measured by SGDS-K were associated with worse survival. SGDS-K is a screening tool specialized for measuring depression in the elderly population. To the best of our knowledge, this is the first prospective study demonstrating the prognostic value of baseline emotional health in older adults with AML. Our data showed that patients with increased depressive symptom burden measured by SGDS-K were more frequently diagnosed with MDD during the postremission treatment course. Indeed, all patients diagnosed with MDD during the treatment course died, mostly as a result of NRM. Depression could influence cancer mortality through a pathophysiological effect via neuroendocrine and immunologic functions or from weakening adherence to preventive screening procedures, AML treatments, or recommendations for maintaining health.37 Depressive symptoms can be a proxy for disease severity because of similarity to the adverse effects of treatment or cancer symptoms. Therefore, screening for depression should be conducted routinely, and referrals to mental health specialists should be considered. Prognostic significance of dynamic changes in depressive symptoms should be evaluated further by repeat GA at each step of the treatment course in larger cohorts. Moreover, our data suggest the necessity for further studies to determine whether interventions targeting emotional as well as functional health can improve survival outcomes.
It is notable that cognitive impairment was not associated with worse survival in our cohort, in contrast to data from Klepin et al.12 The proportion of patients with cognitive dysfunction was similar between the 2 studies despite the difference in age distribution. Cognitive test scores can identify patients who either have or are at risk for delirium, which is a known risk factor for mortality among hospitalized older patients with other medical conditions.41 Our data showed the relationship between baseline cognitive performance and subsequent development of delirium during the treatment course. However, delirium was not associated with survival outcomes in our cohort. Given the inclusion of an older population with worse ECOG PS in the cohort of Klepin et al, the influence of baseline cognitive impairment on survival might be more significant in older populations with AML, suggesting heterogeneity among the older AML population, which should be confirmed through a large-scale study. Conversely, our data suggest that cognitive impairment was associated with treatment tolerance or resilience. We observed that patients with cognitive impairment were exposed to increased risk for grade 3 to 4 infectious complications and had prolonged hospitalization during induction chemotherapy, which might be related to increased incidence of delirium during induction chemotherapy. In addition, impaired physical function measured by SPPB was associated with grade 3 to 4 acute renal failure and infection. The association between these nonfatal toxicities and patient characteristics has received little attention.8 Our data suggest that cognitive and functional measures by GAs are available to identify patients at risk of severe toxicities after intensive chemotherapy in older adults with AML, with those patients possibly being preferred candidates for low-intensity combined therapies.42 Additional large studies are warranted to confirm the feasibility of GA measures as predictors of nonfatal toxicities.
Among existing survival prediction models,14-1643 AML scores14 and the Wheatley index16 were useful in our cohort. Of note, our data showed that the addition of SPPB and SGDS-K, gait speed and SGDS-K, or sit-and-stand speed and SGDS-K significantly improved the predictive power of those survival prediction models, with 10% to 23% of absolute additional variability. These results are strong evidence for the need to incorporate GA into validated survival prediction models to determine initial treatment, such as intensive induction chemotherapy or low-intensity therapies, in practice and in clinical trials with older adults with AML. For example, older adults with AML may be offered combination therapy with venetoclax and hypomethylating agents with its proven safety profile and outcome42 rather than intensive chemotherapy if the GA combined model-based risk of death is high.
The strengths of our study include its prospective nature, a high participation rate, and the scarcity of GA research conducted in Asian cohorts. In particular, our cohort included patients with AML between age 60 and 75 years who were the main subjects of intensive induction chemotherapy. Such a cohort is more practical and applicable than those in previous prospective studies that included patients with AML older than age 75 years, even as old as 80 years or older.10,11 In addition, we reassessed the existing prognostic models with a cohort of mutational profiles representing recent advances in supportive care, and we objectively demonstrated how much the GA measures improved predictability. Nonetheless, the modest size of the cohort and data from a single institution could limit its generalizability, warranting larger prospective studies from multiple institutions.
In summary, we prospectively demonstrated the prognostic value of physical and psychological GAs for survival outcomes in intensively treated older adults with AML. Particularly, gait speed or sit-and-stand speed were the most powerful measures for identifying frailty and predicting survival. Measurements of cognitive and physical impairments helped identify nonfatal toxicities during intensive chemotherapy. Our data will facilitate incorporation of GA measures into validated survival prediction models for determining the initial treatment of older adults with AML in routine clinical care and clinical trials. Further studies are warranted to determine the best ways to adjust the care provided for frail patients to improve treatment tolerance and outcomes.
Acknowledgments
This research was supported by grants from Green Cross (KC16OISI0771; GC Pharma, Yongin, South Korea) and the National Research Foundation of Korea funded by Medical School Information Technology (Korean government) (2018R1D1A1B07043395). Statistical consultation was supported by a grant from the Catholic Research Coordinating Center of the Korea Health 21 R&D Project (A070001) (Ministry of Health and Welfare, Republic of Korea). The statistical analyses performed in this article were advised by Catholic Medical Center Clinical Research Coordinating Center.
Authorship
Contribution: B.-S.C. conceived and designed the study; B.-S.C. and G.-J.M. developed the methodology; B.-S.C., G.-J.M., K.-S.E., Y.-J.K., S.L., C.-K.M., S.-G.C., D.-W.K., J.W.L., and H.-J.K. acquired the data; B.-S.C., G.-J.M., and H.-J.K. analyzed (statistical analysis, biostatistics, computational analysis) and interpreted the data; B.-S.C. and G.-J.M. wrote, reviewed, and/or revised the manuscript; S.-H.S., S.-A.Y., S.P., S.-S.P., Y.-W.J., J.-H.Y., and S.-E.L. provided administrative, technical, or material support (reporting or organizing data, constructing databases); and B.-S.C. supervised the study.
Conflict-of-interest disclosure: The authors declare no competing financial interests.
Correspondence: Byung-Sik Cho, Department of Hematology, Catholic Hematology Hospital, Leukemia Research Institute, College of Medicine, The Catholic University of Korea, 222, Banpo-daero, Seocho-gu, Seoul 06591, Republic of Korea; e-mail: cbscho@catholic.ac.kr.
Requests for data sharing may be submitted to Byung-Sik Cho (cbscho@catholic.ac.kr).
The online version of this article contains a data supplement.
There is a Blood Commentary on this article in this issue.
The publication costs of this article were defrayed in part by page charge payment. Therefore, and solely to indicate this fact, this article is hereby marked “advertisement” in accordance with 18 USC section 1734.

This feature is available to Subscribers Only
Sign In or Create an Account Close Modal