

Key Points
We report a large-scale genome-wide association study on blood CD34+ cell levels, identifying 9 significant and 2 suggestive variants.
The most significant associations map to CXCR4 and PPM1H, the latter a potential inhibition target for stem cell mobilization.

Abstract
Stem cell transplantation is a cornerstone in the treatment of blood malignancies. The most common method to harvest stem cells for transplantation is by leukapheresis, requiring mobilization of CD34+ hematopoietic stem and progenitor cells (HSPCs) from the bone marrow into the blood. Identifying the genetic factors that control blood CD34+ cell levels could reveal new drug targets for HSPC mobilization. Here we report the first large-scale, genome-wide association study on blood CD34+ cell levels. Across 13 167 individuals, we identify 9 significant and 2 suggestive associations, accounted for by 8 loci (PPM1H, CXCR4, ENO1-RERE, ITGA9, ARHGAP45, CEBPA, TERT, and MYC). Notably, 4 of the identified associations map to CXCR4, showing that bona fide regulators of blood CD34+ cell levels can be identified through genetic variation. Further, the most significant association maps to PPM1H, encoding a serine/threonine phosphatase never previously implicated in HSPC biology. PPM1H is expressed in HSPCs, and the allele that confers higher blood CD34+ cell levels downregulates PPM1H. Through functional fine-mapping, we find that this downregulation is caused by the variant rs772557-A, which abrogates an MYB transcription factor–binding site in PPM1H intron 1 that is active in specific HSPC subpopulations, including hematopoietic stem cells, and interacts with the promoter by chromatin looping. Furthermore, PPM1H knockdown increases the proportion of CD34+ and CD34+90+ cells in cord blood assays. Our results provide the first large-scale analysis of the genetic architecture of blood CD34+ cell levels and warrant further investigation of PPM1H as a potential inhibition target for stem cell mobilization.
Introduction
Human hematopoiesis is defined by the outgrowth of mature blood cells through successive proliferation and differentiation of hematopoietic stem and progenitor cells (HSPCs).1 In blood, HSPCs constitute a tiny (∼0.1%) subset of mononuclear white blood cells. Circulating HSPCs express the surface protein CD34, allowing quantification by flow cytometry.2 Epidemiologic studies3,4 indicate that blood CD34+ cell levels are partly genetically determined. However, the underlying DNA sequence variants and genes remain unknown, and no genome-wide significant associations have been reported.3
To identify DNA sequence variants that influence blood CD34+ cell levels, we conducted a genome-wide association study (GWAS). We identified 9 significant and 2 suggestive association signals, including 4 independent associations with CXCR4 and an association with PPM1H. Notably, PPM1H encodes a serine/threonine phosphatase previously not implicated in HSPC biology. Relative to other blood cell types, PPM1H is preferentially expressed in HSPCs. The allele that confers higher blood CD34+ cell levels downregulates PPM1H in CD34+ cells due to loss of an MYB transcription factor–binding site. Our results provide new insight into the regulation of blood CD34+ cell levels and warrant further studies of PPM1H as a potential inhibition target to facilitate stem cell mobilization.
Methods
The methods and materials are described in detail in the supplemental Methods (available on the Blood Web site).
Sample collection
We collected 16 931 peripheral blood samples from blood donors (n = 7773) and primary care patients (n = 9158) in 3 phases: November 2015 to April 2016 (Phase I); January 2017 to November 2017 (Phase II); and August 2018 to April 2019 (Phase III) (Lund University Ethical Review Board; dnr 2018/2) (supplemental Table 1; supplemental Figure 1). Information about sex was available for all participants and age for 8251 participants. After quality control, 13 167 unique individuals remained.
Flow cytometry phenotyping
After red blood cell lysis, white blood cells were washed twice, stained with antibody cocktail containing anti–CD45-APC-H7 and either anti–CD34-PerCP-Cy5.5 or anti–CD34-PE-CF594 (supplemental Table 2), and analyzed by using a BD FACS Canto II (Phase I), BD LSR Fortessa (Phase II), or Bio-Rad ZE5 (Phase III) (supplemental Table 3). Samples were processed within 36 hours of blood draw.
Gating of flow cytometry data for association study
To quantify blood CD34+ cell levels, we gated singlet peripheral blood mononuclear cells (PBMCs) based on forward scatter area, forward scatter height, and side scatter area, and then CD34+45low cells and CD45+ cells within PBMCs. The CD34+ level was defined as the number of CD34+45low cells divided by the number of CD45+ PBMCs (supplemental Figure 2).
To facilitate analysis of the large volume of flow cytometry data, we developed pattern recognition software (AliGater; https://github.com/LudvigEk/AliGater; gating strategies at https://github.com/LudvigEk/HSPC-regulators-in-human-blood) (supplemental Methods; supplemental Figure 3). Phase I and II samples were gated by using AliGater; Phase III samples were gated manually by using FlowJo (FlowJo LLC). Minor differences in CD34+ levels were observed between phases (median, 9.11 × 10⁻⁴ CD34+ per CD45+PBMCs in Phase I; 9.66 × 10⁻⁴ in Phase II and 1.0 × 10⁻³ in Phase III; Kruskal-Wallis test, P = 4.0 × 10−88) (supplemental Table 3), likely because of the use of different flow cytometers and antibody panels.
Genotyping and association analysis
Samples were genotyped by using Illumina OmniExpress-24 and Global Screening single-nucleotide polymorphism (SNP) microarrays. For imputation, we used pre-existing whole-genome sequence data for 17 408 individuals of European origin, including 3704 Swedish individuals. Using ancestry analysis, the association data were partitioned into a discovery set of 10 949 individuals of Swedish ancestry and a follow-up set of 2218 individuals of non-Swedish European ancestry. Association testing was performed by using linear regression in the discovery and follow-up sets separately; the results were combined through meta-analysis using a fixed effects inverse variance method.5 To adjust for multiple testing, class-based Bonferroni significance thresholds were used.6 To identify underlying independent signals, we used step-wise conditional analysis. To define the 99% credible set of plausible causal variants for each association signal, we used a Bayesian refinement approach.7
Chromatin accessibility data
To identify candidate causal regulatory variants, we used Assay for Transposase-Accessible Chromatin using sequencing (ATAC-seq) data for sorted blood cell types.8,9 To screen for genomic regions that drive candidate gene expression, these data were integrated with messenger RNA–sequencing (RNA-seq) data for the same cell types, by testing for correlation across blood cell types between gene expression and ATAC-seq signal intensity (averaged across a 100-bp sliding window positioned at every 50 bp). To map chromatin accessibility in MOLM13 cells, ATAC-seq was performed on 50 000 cells10 (raw sequencing data in Sequence Read Archive, accession number PRJNA761267). To test for allele-dependent accessibility at rs772557, we used publicly available ENCODE DNase-sequencing data for primary adult CD34+ cells from a single heterozygous individual.11
Heritability estimation
Total narrow-sense heritability was estimated with the linkage disequilibrium score regression (LDSC) software.12,13 To estimate cell type–specific partitioned heritability based on chromatin accessibility, we used LD scores based on ATAC-seq data for sorted blood cell types available for LDSC.12 This was extended with LD scores for myeloid and plasmacytoid dendritic cells computed by using LDSC from published ATAC-seq data8 (National Center for Biotechnology Information Gene Expression Omnibus accession number GSE119453).
Promoter capture Hi-C data analysis
To identify variants that interact with gene promoters, we used published promoter capture Hi-C (PCHi-C) data for CD34+ cells (ArrayExpress accession number E-MTAB-2323).14
Chromatin immunoprecipitation–sequencing data
Expression quantitative trait locus analysis in blood CD34+ cells
We purified CD34+ cells from 155 blood donors using immunomagnetic bead enrichment followed by fluorescence-activated cell sorting within 8 hours of blood draw (14 000 to 358 000 cells per sample; average, 122 000). After RNA extraction and complementary DNA synthesis, samples were sequenced on an Illumina NovaSeq 6000 sequencer. To test for associations between variants and gene expression, we used linear modeling with the variant genotype as independent variable and 10 expression principal component covariates. For CXCR4, the 3 common variants were included as independent variables in the same model. P values were calculated by using Student t test for the independent variables. The sequencing data and counts of Fragments Per Kilobase of transcript per Million mapped reads are available from the European Genome Archive repository (accession numbers EGAS00001005655 and EGAD00001008194).
Gene expression data and analysis
To map candidate gene expression, we used single-cell RNA-seq data for 35 582 mononuclear cells from blood and bone marrow,17 and bulk RNA-seq data for sorted blood cell types.8 In addition, we used single-cell Cellular Indexing of Transcriptomes and Epitopes by Sequencing data on 4905 CD34+ cells from adult bone marrow.18 For dimension reduction, we used Uniform Manifold Approximation and Projection19 and imputed gene expression using MAGIC were used.20
CRISPR/Cas9 perturbation of variant regions
We used dual-single guide RNA (sgRNA) CRISPR/Cas9 to delete the regions harboring the 4 candidate causal variants at CXCR4, and an allele-specific single-sgRNA CRISPR/Cas9 approach to perturb rs772557 at PPM1H (supplemental Table 4). sgRNAs were cloned into the pSpCas9(BB)-2A-GFP PX458 vector and transfected into MOLM13 cells (CXCR4 variants) or K562 cells (PPM1H rs772557 variant). At 24 hours posttransfection, green fluorescent protein–positive cells were isolated by fluorescence-activated cell sorting. Deletion in MOLM13 cells was verified by polymerase chain reaction and electrophoresis in a 1% agarose gel. Deletion efficiency was estimated as the intensity of the deletion band divided by the sum of the intensity of the deletion band and the intensity of the wild-type band. For allele-specific CRISPR/Cas9 toward rs772557 in K562 cells, perturbation was verified by using Sanger sequencing and the Tracking of Indels by Decomposition (TIDE, https://tide.nki.nl/). As control, we used sgRNAs targeting a random noncoding region on a different chromosome. CXCR4 and PPM1H expression after CRISPR/Cas9 perturbation was quantified by using quantitative polymerase chain reaction.
Luciferase experiments
For the PPM1H variants, 200-bp sequences representing the reference and alternative allele of rs772555, rs772556, rs772557, and rs772559 in their genomic contexts were synthesized as gBlocks and cloned into the pGL3-Basic plasmid using KpnI and BglII restriction sites.
Sequences were centered on the variant, and the 2 constructs differed only for the variant. Renilla luciferase constructs were cotransfected with firefly construct into K562 cells. At 24 hours postelectroporation, luciferase and Renilla activities were measured. Based on the readings, log2 scores were calculated for each variant reflecting the luciferase activity of the alternative allele relative to the reference allele. For coelectroporation experiments with MYB small interfering RNA (siRNA), luciferase plasmids were cotransfected with Qiagen FlexiTube siRNA solution targeting MYB or Qiagen Negative Control siRNA. Lysates for luciferase activity measurement and Western blot were collected simultaneously, 24 hours after electroporation. Knockdown was confirmed by western blot using a recombinant c-Myb antibody.
Motif analysis
For motif analysis, we used PERFECTOS-APE (http://opera.autosome.ru/perfectosape) with the HOCOMOCO-10, JASPAR, HT-SELEX, SwissRegulon, and HOMER motif databases.
shRNA-knockdown in umbilical cord blood cells
Umbilical cord blood samples were obtained from newborns at Skåne University Hospital (Lund and Malmö, Sweden) and Helsingborg Hospital (Helsingborg, Sweden), in compliance with regulations set by the regional ethical committee and informed consent. Mononuclear cells were isolated by density gradient centrifugation within 48 hours of sample collection and kept at −80°C. Thawed cord blood–derived CD34+ cells were sorted, lentivirally transduced with PPM1H-targeting or nontargeting (control) shRNA, and maintained in serum-free expansion medium supplemented with stem cell factor, thrombopoietin, and FMS-like tyrosine kinase 3 ligand. Using flow cytometry, the percentages and absolute counts (using CountBright beads; Thermo Fisher Scientific) of CD34+ and CD34+90+ cells at days 7, 14, and 21 were measured. Cell enrichment was calculated by dividing CD34+ and CD34+90+ counts at each time point by initial cell counts, and then normalizing the enrichment values to the control shRNA-transduced cells at the same time point. At each time point, 3 transduction replicates were recorded. The experiment was repeated 3 times.
For statistical analysis, we compared normalized enrichment values at days 7, 14, and 21 for shRNA-transduced cells vs nontargeting shRNA control. To ensure a conservative analysis, we first averaged the transduction replicates for each experiment, then calculated P values using permutation testing with day 7, 14, and 21 data for the same experiment being permuted within each day stratum (100 000 permutations).
Results
Genome-wide association study
Blood CD34+ cell levels were analyzed in 13 167 blood donors and primary care patients from southern Sweden (aged 18-71 years) (Figure 1A; supplemental Table 1; supplemental Figure 1). In each sample, we analyzed up to 1 million white blood cells and defined the CD34+ cell level as the number of CD34+ cells divided by the number of CD45+ mononuclear cells (supplemental Tables 2 and 3; supplemental Figures 2 and 3). To assess reproducibility, 660 individuals were sampled twice, with 3 to 36 months between samplings; significant correlation was found between replicates (Spearman P = 1.3 × 10−84; r2 = 0.44) (supplemental Figure 4). Higher blood CD34+ cell levels were observed in male subjects than in female subjects (supplemental Figure 5), but no association with age was noted.
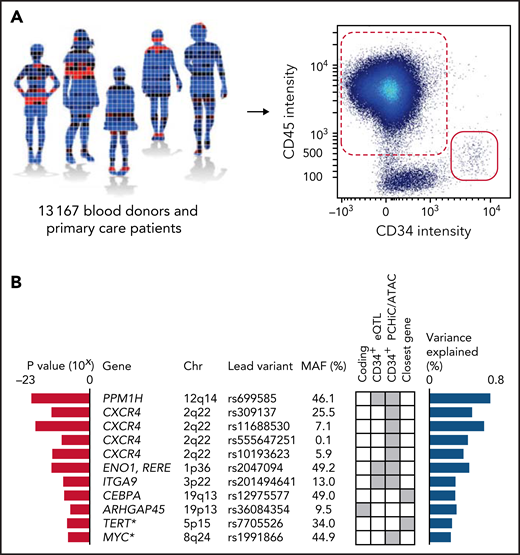
GWAS. (A) A GWAS was performed on blood CD34+ cell levels in 13 167 individuals, including 10 949 of Swedish ancestry and 2218 of non-Swedish European ancestry. The CD34+ level was defined as the number of CD34+ cells (red solid) divided by the number of CD45+ mononuclear cells (red dashed) (supplemental Figure 2). (B) In a combined analysis of the individuals of Swedish ancestry and the individuals of non-Swedish European ancestry, 9 significant and 2 suggestive (asterisks) associations (having P values within one order of magnitude from Bonferroni thresholds) were identified (supplemental Tables 5-8). The listed variants are the most significant (lead) variants for each association. Red bars indicate P values for association with blood CD34+ cell levels for the lead variants in the combined analysis. Blue bars indicate proportion of variance explained. Gene names indicate the likely candidate genes of each association. Genes were prioritized as candidate genes if they: (1) had a coding variant within the 99% credible set of probable causal variants (supplemental Table 9); (2) had a cis-eQTL in CD34+ cells (supplemental Table 10); or (3) the credible set contained a regulatory variant that maps either to the promoter or to a region with a chromatin looping interaction with the promoter in CD34+ cells. If none of these criteria were fulfilled, the closest gene was prioritized. The criterion used to call each gene a candidate gene is indicated by gray squares in the matrix. MAF, minor allele frequency.
GWAS. (A) A GWAS was performed on blood CD34+ cell levels in 13 167 individuals, including 10 949 of Swedish ancestry and 2218 of non-Swedish European ancestry. The CD34+ level was defined as the number of CD34+ cells (red solid) divided by the number of CD45+ mononuclear cells (red dashed) (supplemental Figure 2). (B) In a combined analysis of the individuals of Swedish ancestry and the individuals of non-Swedish European ancestry, 9 significant and 2 suggestive (asterisks) associations (having P values within one order of magnitude from Bonferroni thresholds) were identified (supplemental Tables 5-8). The listed variants are the most significant (lead) variants for each association. Red bars indicate P values for association with blood CD34+ cell levels for the lead variants in the combined analysis. Blue bars indicate proportion of variance explained. Gene names indicate the likely candidate genes of each association. Genes were prioritized as candidate genes if they: (1) had a coding variant within the 99% credible set of probable causal variants (supplemental Table 9); (2) had a cis-eQTL in CD34+ cells (supplemental Table 10); or (3) the credible set contained a regulatory variant that maps either to the promoter or to a region with a chromatin looping interaction with the promoter in CD34+ cells. If none of these criteria were fulfilled, the closest gene was prioritized. The criterion used to call each gene a candidate gene is indicated by gray squares in the matrix. MAF, minor allele frequency.
The participants were genotyped for 18 million variants by using SNP microarrays and imputation. For association analysis, the data were partitioned into a discovery set of 10 949 individuals of Swedish ancestry and a follow-up set of 2218 individuals of other European ancestry (supplemental Table 1; supplemental Figures 6 and 7). To correct for multiple testing, variants were partitioned into 5 classes based on genomic annotations, and weighted Bonferroni adjustment was applied, taking into account the predicted functional impact of variants within each class (supplemental Methods).6
In a combined analysis of the 2 data sets, 6 association signals reached significance, and 2 were suggestive (within one order of magnitude from Bonferroni thresholds). Conditional analysis uncovered an additional 3 independent signals at the 2q22 locus, increasing the number of significant signals to 9 (Figure 1B), whereas no additional signals were detected at the other loci after accounting for their respective lead variants. No heterogeneity was detected in effect estimates between the discovery and follow-up data sets (Bonferroni-adjusted Cochran’s Q Phet = not significant for all lead variants) (supplemental Table 5), nor between the different sample collection phases (Bonferroni-adjusted Phet = not significant for all lead variants) (supplemental Table 6); only the rare variant rs555647251 displayed significant heterogeneity between blood donors and primary care patients (Bonferroni-adjusted Phet = 0.046) (supplemental Table 7). The identified lead variants were polymorphic in all geographic ancestry super-populations in the 1000 Genomes Phase III compendium.21 The exception was rs555647251, which was only polymorphic in the European (EUR) and American (AMR) super-populations (supplemental Table 8). The proportion of variance explained by the lead variants of the 9 significant signals was 4.6% in the combined data set. Using LD score regression,12 the total SNP heritability was estimated at 12.7%. We detected enrichments of heritability in chromatin regions accessible in HSPCs8,9 (Figure 2A), indicating that we preferentially identify variants that act by altering gene regulation intrinsically in these cell types.
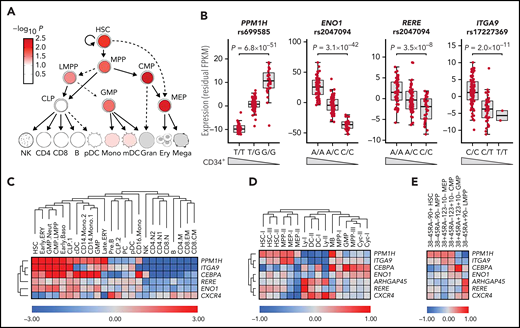
Effects on gene expression in HSPCs. (A) LD score regression shows enrichments of heritability in regions with accessible chromatin in HSPC subpopulations (red nuance indicates –log10P value). (B) cis-eQTLs at PPM1H, ENO1, RERE, and ITGA9 identified RNA-seq data for CD34+ cells from 155 blood donors (supplemental Table 10). Data are residual fragments per kilobase of transcript per million mapped reads (FPKM) values after correction for 10 expression principal components. Wedges indicate directions of effects on blood CD34+ cell levels for the same variant. (C) Candidate gene expression in single-cell messenger RNA-seq data from 35 582 blood and bone marrow mononuclear cells17 (supplemental Figures 9 and 10). ARHGAP45 was not represented in this data set. (D-E) Average expression of candidate genes across different cell clusters in single-cell Cellular Indexing of Transcriptomes and Epitopes by Sequencing data for 4905 lineage-negative CD34+ cells from adult bone marrow.18 In panel D, the 4905 cells have been clustered according to RNA-seq pattern (supplemental Figure 11). In panel E, the cells were instead clustered by gating using the sequence counts for the tags derived from antibodies to the CD38, CD45RA, CD90, CD123, and CD10 cell surface markers, as indicated at the upper edge of the heatmap (supplemental Figure 12). B, B cells; Baso, basophil; CD4, CD4+ T cells; CD8, CD8+ T cells; CLP, common lymphoid progenitors; Cyc, cycling cells; DC, dendritic cells; ERY, erythroid progenitors; GMP, granulocyte-monocyte progenitors; LMPP, lymphoid-primed multipotent progenitors; Mono, monocyte; PC, plasma cells; PreB, pre–B cells; Neut, neutrophil; NK, natural killer cells.
Effects on gene expression in HSPCs. (A) LD score regression shows enrichments of heritability in regions with accessible chromatin in HSPC subpopulations (red nuance indicates –log10P value). (B) cis-eQTLs at PPM1H, ENO1, RERE, and ITGA9 identified RNA-seq data for CD34+ cells from 155 blood donors (supplemental Table 10). Data are residual fragments per kilobase of transcript per million mapped reads (FPKM) values after correction for 10 expression principal components. Wedges indicate directions of effects on blood CD34+ cell levels for the same variant. (C) Candidate gene expression in single-cell messenger RNA-seq data from 35 582 blood and bone marrow mononuclear cells17 (supplemental Figures 9 and 10). ARHGAP45 was not represented in this data set. (D-E) Average expression of candidate genes across different cell clusters in single-cell Cellular Indexing of Transcriptomes and Epitopes by Sequencing data for 4905 lineage-negative CD34+ cells from adult bone marrow.18 In panel D, the 4905 cells have been clustered according to RNA-seq pattern (supplemental Figure 11). In panel E, the cells were instead clustered by gating using the sequence counts for the tags derived from antibodies to the CD38, CD45RA, CD90, CD123, and CD10 cell surface markers, as indicated at the upper edge of the heatmap (supplemental Figure 12). B, B cells; Baso, basophil; CD4, CD4+ T cells; CD8, CD8+ T cells; CLP, common lymphoid progenitors; Cyc, cycling cells; DC, dendritic cells; ERY, erythroid progenitors; GMP, granulocyte-monocyte progenitors; LMPP, lymphoid-primed multipotent progenitors; Mono, monocyte; PC, plasma cells; PreB, pre–B cells; Neut, neutrophil; NK, natural killer cells.
Identification of candidate genes
To identify candidate genes based on HSPC-intrinsic effects, we generated expression quantitative trait locus (eQTL) data for sorted CD34+ cells from 155 blood donors using RNA-seq. In addition, we retrieved promoter capture Hi-C (PCHi-C) data14 for CD34+ cells, and ATAC-seq data for sorted blood cells, including 7 HSPC populations.8
We defined the 99% credible sets of probable causal variants (supplemental Table 9) and prioritized genes as candidate genes if they: (1) had a non-synonymous coding variant within the credible set; (2) had a cis-eQTL in CD34+ cells (Figure 2B; supplemental Table 10); or (3) the credible set contained a regulatory variant in the promoter region, or in a region with a chromatin looping interaction with the promoter in CD34+ cells14 (supplemental Figure 8). As regulatory variants, variants in regions with accessible chromatin in HSPCs were considered.8 Strikingly, the identified candidate genes include both known HSPC-relevant genes (CXCR4 and CEBPA) and genes never previously implicated in HSPC biology (PPM1H, ENO1, RERE, and ARHGAP45) or only minimally studied in this area (ITGA9)22 (Figure 1B).
Genetic overlap with human diseases and traits
To investigate further the impact of the identified variants, we questioned if these variants associate with other traits and diseases. Hence, we searched for coincident associations among variants in LD (r2 > 0.8) with the lead variants in the UK Biobank and the GWAS Catalog.23-27 We detected coincident associations with variants known to associate with mature blood cell traits (6 of the significant variants, at 2q22/CXCR4, 12q14/PPM1H, 1p36/ENO1-RERE, 19p13/ARHGAP45, 19q13/CEBPA), and hematologic malignancies and autoimmune disorders (variants at 2p22/CXCR4 and 19p13/CEBPA) (supplemental Tables 11 and 12). Of note, 2 of the significant candidate genes underlie autosomal-dominant disorders defined by aberrant HSPC regulation: WHIM (warts, hypogammaglobulinemia, immunodeficiency and myelokathexis) syndrome (CXCR4)28,29 and familial acute myeloid leukemia (CEBPA).30 Furthermore, somatic mutations in CXCR4 and CEBPA have been reported in blood malignancies.31-33
Gene expression in human hematopoiesis
We next explored the expression of the candidate genes across hematopoietic cell types. We observed enrichments of expression in HSPC vs non-HSPC populations, both in single-cell RNA-seq data for 35 582 mononuclear blood and bone marrow cells17 (one-sided Wilcoxon rank sum test, P = 2.1 × 10⁻¹⁰) (Figure 2C; supplemental Figure 9) and in bulk RNA-seq data8 (one-sided Wilcoxon rank-sum test, P = 7.1 × 10⁻⁵) (supplemental Figure 10).
To map expression within the CD34+ compartment, we used single-cell Cellular Indexing of Transcriptomes and Epitopes by Sequencing data for 4905 lineage-negative CD34+ bone marrow cells.18 This revealed distinct expression biases for the different candidate genes (Figure 2D-E; supplemental Figures 11 and 12; supplemental Table 13), including greater than fourfold enrichments in hematopoietic stem cells (HSCs), multi-potential progenitors (MPPs), megakaryocyte-erythrocyte progenitors (MEPs), and mast cell/basophil progenitors (MBs) for PPM1H (5.86- to 14.1-fold enrichment; one-sided Wilcoxon rank sum test, P = 2.01 × 10⁻⁴ to 1.35 × 10⁻¹¹); in HSC, MPP, and MEP populations for ITGA9 (4.74- to 11.1-fold; P = 1.98 × 10⁻³ to 2.38 × 10⁻¹⁰); in MB, dendritic cell, and lymphoid (Ly) precursors for CXCR4 (4.00- to 9.79-fold; P = 1.56 × 10⁻¹⁸ to 6.17 × 10−67); in Ly populations for RERE (4.28-fold; P = 6.40 × 10⁻⁷); and in MPP, MB, dendritic cell, Ly, and granulocyte-monocyte progenitor populations for CEBPA (4.38- to 24.3-fold; P = 2.55 × 10⁻³ to 2.32 × 10−80). In addition, we observed greater than twofold enrichment of expression in MPPs for ENO1 (2.18- to 2.23-fold; P = 2.98 × 10−95 to 1.25 × 10−101) and in Ly for ARHGAP45 (2.28- to 2.99-fold; P = 4.96 × 10⁻⁵ to 1.16 × 10⁻⁵) (supplemental Table 13). These data further support that the identified candidate genes are relevant to HSPCs.
Associations with CXCR4
Four signals map to CXCR4 (C-X-C chemokine receptor type 4) at 2q22. This receptor binds stromal-derived factor-1 (SDF-1; also known as CXCL12). Internalization of CXCR4 is required for HSPC egression from the bone marrow.34 In the WHIM syndrome, gain-of-function mutations in the C-terminal region prevent internalization after stimulation, leading to retention of HSPCs and other white blood cells in the bone marrow.35 CXCR4 inhibitors are one of the current methods for mobilizing CD34+ cells for leukapheresis.36 The fact that we identify association with CXCR4 provides proof-of-principle for our idea that regulators of blood CD34+ cell levels can be exposed in vivo in humans through genetic variation.
The CXCR4 signals represent 3 common and 1 rare variant (Figure 1B). Within each of their credible sets (supplemental Table 9), we identified a single regulatory variant that either maps to, or has a looping interaction with, the CXCR4 promoter, making them plausible causal variants (Figure 3A; supplemental Figure 8A). In the sets of rs11688530 and rs555647251, rs59222832 and rs770321415 were identified as regulatory promoter variants. In the other 2 sets, the lead variants rs309137 and rs10193623 were identified as likely causal based on looping interactions.

Associations with CXCR4. (A) Four independent associations were detected at 2q22. Credible sets (supplemental Table 9) indicated in red (lead variant rs309137), green (rs11688530), cyan (rs555647251), and blue (rs10193623). Using ATAC-seq and PCHi-C data, a single plausible causal variant was identified within each set. rs59222832 (“V2”; in credible set of rs11688530) and rs770321415 (“V3”; in credible set of rs555647251) map to the CXCR4 promoter region, 4.7 and 1.3 kb upstream of the transcription start site, respectively. In the other 2 credible sets, the lead variants rs309137 (“V1”) and rs10193623 (“V4”) were identified as likely causal based on looping interactions with the promoter (red and blue arches; y-axis indicates PCHi-C P-score). (B) Chromatin accessibility at putative causal variants in 18 blood cell types (y-axis indicates ATAC-seq signal): HSCs, MPPs, lymphoid-primed multipotent progenitors (LMPP), common lymphoid progenitors (CLP), common myeloid progenitors (CMP), granulocyte-monocyte progenitors (GMPs), MEPs, monocyte (MONO), megakaryocyte (MEGA), CD4+ T cells (CD4 TCELL), CD8+ T-cells (CD8 TCELL), B cells (BCELL), natural killer cells (NK), myeloid and plasmacytoid dendritic cells (mDC and pDC, respectively), and plasma cells (PC). (C) Conditional CXCR4 cis-eQTLs for the 3 common variants in our CD34+ cell RNA-seq data (n = 155). Wedges indicate directions of effects on blood CD34+ cell levels. Data are residual Fragments Per Kilobase of transcript per Million mapped reads (FPKM) values after correction for the 2 covariate lead variants and 10 principal components. P values for multivariable regression, one-sided in the direction opposite the effect on blood CD34+ cell levels of the illustrated variant. (D) CXCR4 expression in MOLM13 cells subjected to CRISPR/Cas9 editing with empty vector (Vec), a nontargeting sgRNA pair (Ctrl), or sgRNA pairs designed to delete 587 to 1421 bp regions harboring the 4 putative causal variants (3-4 biological replicates per condition) (supplemental Table 4; supplemental Figure 14). a.u., arbitrary units; mRNA, messenger RNA; n.s., not significant; **P < .01.
Associations with CXCR4. (A) Four independent associations were detected at 2q22. Credible sets (supplemental Table 9) indicated in red (lead variant rs309137), green (rs11688530), cyan (rs555647251), and blue (rs10193623). Using ATAC-seq and PCHi-C data, a single plausible causal variant was identified within each set. rs59222832 (“V2”; in credible set of rs11688530) and rs770321415 (“V3”; in credible set of rs555647251) map to the CXCR4 promoter region, 4.7 and 1.3 kb upstream of the transcription start site, respectively. In the other 2 credible sets, the lead variants rs309137 (“V1”) and rs10193623 (“V4”) were identified as likely causal based on looping interactions with the promoter (red and blue arches; y-axis indicates PCHi-C P-score). (B) Chromatin accessibility at putative causal variants in 18 blood cell types (y-axis indicates ATAC-seq signal): HSCs, MPPs, lymphoid-primed multipotent progenitors (LMPP), common lymphoid progenitors (CLP), common myeloid progenitors (CMP), granulocyte-monocyte progenitors (GMPs), MEPs, monocyte (MONO), megakaryocyte (MEGA), CD4+ T cells (CD4 TCELL), CD8+ T-cells (CD8 TCELL), B cells (BCELL), natural killer cells (NK), myeloid and plasmacytoid dendritic cells (mDC and pDC, respectively), and plasma cells (PC). (C) Conditional CXCR4 cis-eQTLs for the 3 common variants in our CD34+ cell RNA-seq data (n = 155). Wedges indicate directions of effects on blood CD34+ cell levels. Data are residual Fragments Per Kilobase of transcript per Million mapped reads (FPKM) values after correction for the 2 covariate lead variants and 10 principal components. P values for multivariable regression, one-sided in the direction opposite the effect on blood CD34+ cell levels of the illustrated variant. (D) CXCR4 expression in MOLM13 cells subjected to CRISPR/Cas9 editing with empty vector (Vec), a nontargeting sgRNA pair (Ctrl), or sgRNA pairs designed to delete 587 to 1421 bp regions harboring the 4 putative causal variants (3-4 biological replicates per condition) (supplemental Table 4; supplemental Figure 14). a.u., arbitrary units; mRNA, messenger RNA; n.s., not significant; **P < .01.
Because CXCR4 is a known negative regulator of HPSC regression, we looked for effects of the identified variants on CXCR4 expression in CD34+ cells in the direction opposite their effects on blood CD34+ cell levels. Indeed, multivariable analysis of our CD34+ cell RNA-seq data for blood donors unveiled conditional CXCR4 cis-eQTLs for the 3 common variants (one-sided linear regression, P = 5.4 × 10⁻³ to 1.8 × 10⁻²) (Figure 3B), although the rare variant rs555647251 was not polymorphic in this data set. Furthermore, using CRISPR/Cas9, we deleted the 4 putative causal variants in MOLM13 acute myeloid leukemia cells (supplemental Table 4; supplemental Figures 13 and 14), yielding CXCR4 downregulation (Figure 3C). These data suggest that the 2q22 associations are caused by genetic variation in genomic regions required for CXCR4 expression in HSPCs.
Association with PPM1H
Our most significant association maps to PPM1H (protein phosphatase, Mg2+/Mn2+ dependent 1H), encoding an evolutionarily conserved serine/threonine phosphatase.37,38 The few studies that have been performed suggest that PPM1H could be involved in cell signaling,39-41 trastuzumab resistance,42 lupus,43 and colon cancer.44 Notably, our cis-eQTL analysis revealed an anticorrelation between PPM1H expression and CD34+ cell levels (Figure 2B).
The PPM1H credible set contains 32 variants in intron 1 (Figure 4A; supplemental Table 9). The associated region has looping interactions, both with the standard promoter and an internal promoter (Figure 4A; supplemental Figure 8B). By integrating ATAC- and RNA-seq data for sorted blood cell types,45 a positive correlation was found between PPM1H expression and chromatin accessibility in an ∼500-bp-long segment within the associated region (one-sided Pearson correlation, P = 4.2 × 10⁻⁹; false discovery rate = 2.5 × 10⁻⁵) (Figure 4A). Consistent with the gene expression data analysis (Figure 2C-E), this segment is accessible in HSCs, MPPs, MEPs, and common myeloid progenitors (CMPs) (Figure 4B).
![Association with PPM1H. (A) Top: close-up of the 12q14 signal. Middle: chromatin looping interactions in CD34+ cells with standard and internal promoter (red arches; y-axis indicates PCHi-C P-score). Bottom: positive correlation between PPM1H expression across sorted blood cell populations and ATAC-seq signal45 (100 bp sliding window) in an ∼500-bp-long chromosomal segment in intron 1 (red peak)45 (y-axis indicates false discovery rate for Pearson correlation). (B) Four credible set variants (supplemental Table 9) map to the identified segment, which is accessible in HSCs, MPPs, CMPs, and MEPs (y-axis indicates ATAC-seq signal). (C) Luciferase activities of the 4 candidate causal variants in K562 cells (3 biological replicates). P values for one-sided Student t test in the cis-eQTL direction. Data normalized to empty vector control (Ctrl). (D) MYB motif logo; rs772557[A>G] alters a critical recognition base. (E) Chromatin immunoprecipitation with massively parallel DNA sequencing for MYB in Jurkat cells (rs772557-heterozygous) showing exclusive pull-down of rs772557-G reads. (F) siRNA knockdown of MYB in K562 cells attenuates rs772557-G luciferase activity (3-4 biological replicates). P value is for one-sided Student t test. (G) CRISPR/Cas9 disruption of rs772557 (supplemental Figure 16) in K562 cells (5 biological targeting replicates; 7 biological control replicates). P values are for one-sided Student t test. (H) Coexpression of PPM1H and MYB across blood cell types. Data are bulked single-cell messenger RNA-seq data from 35 582 blood and bone marrow mononuclear cells.17 (I-J) CD34+ cell RNA-seq data revealed stronger correlation between MYB and PPM1H expression in rs772557-G homozygotes (n = 27) than in rs772557-A homozygotes (n = 37). Data are log2-transformed fragments per kilobase of transcript per million mapped reads (FPKM) values, median-centered per genotype group. P and r values are for Pearson correlation. a.u., arbitrary units; B, B cells; Baso, basophil; CD4, CD4+ T cells; CD8, CD8+ T cells; CLP, common lymphoid progenitors; Cyc, cycling cells; DC, dendritic cells; ERY, erythroid progenitors; GMP, granulocyte-monocyte progenitors; LMPP, lymphoid-primed multipotent progenitors; mDC, myeloid dendritic cells; Mono, monocyte; n.s., not significant; PC, plasma cells; pDC, plasmacytoid dendritic cells; PreB, pre–B cells; Neut, neutrophil; NK, natural killer cells.](https://ash.silverchair-cdn.com/ash/content_public/journal/blood/139/11/10.1182_blood.2021013220/5/m_bloodbld2021013220f4.png?Expires=1769098888&Signature=UHaQSugFNfhMr5NeeRtcW3cmaPaDJB-0SdxSc6kdmLZoB7utfwA9mAkdc68gFAqRc0iSLrpHhd-4HZgRfROReSFeo1JRSqmj~RSeLUUtAqEPCmnujVsreIbjy4Ee1KvThlsXVBtqEhw787HXYMPrZFhB0XwByeYcR~FmTK6yirazWSf8ntuvECEG4AuPEkDZrdo-d0E~5sKNRMtWxDBREd-40DEI497kELd~GyMCqBXcCvvFPqo5c0P1pTrXkuzEio2U1CrNpfYFHSicIB52ErF0tMRLZzlMTOr~DXieRUYLgtv5PNadzig-suvR9l9MJNwa~XupfxqJdj4dsXGtZg__&Key-Pair-Id=APKAIE5G5CRDK6RD3PGA)
Association with PPM1H. (A) Top: close-up of the 12q14 signal. Middle: chromatin looping interactions in CD34+ cells with standard and internal promoter (red arches; y-axis indicates PCHi-C P-score). Bottom: positive correlation between PPM1H expression across sorted blood cell populations and ATAC-seq signal45 (100 bp sliding window) in an ∼500-bp-long chromosomal segment in intron 1 (red peak)45 (y-axis indicates false discovery rate for Pearson correlation). (B) Four credible set variants (supplemental Table 9) map to the identified segment, which is accessible in HSCs, MPPs, CMPs, and MEPs (y-axis indicates ATAC-seq signal). (C) Luciferase activities of the 4 candidate causal variants in K562 cells (3 biological replicates). P values for one-sided Student t test in the cis-eQTL direction. Data normalized to empty vector control (Ctrl). (D) MYB motif logo; rs772557[A>G] alters a critical recognition base. (E) Chromatin immunoprecipitation with massively parallel DNA sequencing for MYB in Jurkat cells (rs772557-heterozygous) showing exclusive pull-down of rs772557-G reads. (F) siRNA knockdown of MYB in K562 cells attenuates rs772557-G luciferase activity (3-4 biological replicates). P value is for one-sided Student t test. (G) CRISPR/Cas9 disruption of rs772557 (supplemental Figure 16) in K562 cells (5 biological targeting replicates; 7 biological control replicates). P values are for one-sided Student t test. (H) Coexpression of PPM1H and MYB across blood cell types. Data are bulked single-cell messenger RNA-seq data from 35 582 blood and bone marrow mononuclear cells.17 (I-J) CD34+ cell RNA-seq data revealed stronger correlation between MYB and PPM1H expression in rs772557-G homozygotes (n = 27) than in rs772557-A homozygotes (n = 37). Data are log2-transformed fragments per kilobase of transcript per million mapped reads (FPKM) values, median-centered per genotype group. P and r values are for Pearson correlation. a.u., arbitrary units; B, B cells; Baso, basophil; CD4, CD4+ T cells; CD8, CD8+ T cells; CLP, common lymphoid progenitors; Cyc, cycling cells; DC, dendritic cells; ERY, erythroid progenitors; GMP, granulocyte-monocyte progenitors; LMPP, lymphoid-primed multipotent progenitors; mDC, myeloid dendritic cells; Mono, monocyte; n.s., not significant; PC, plasma cells; pDC, plasmacytoid dendritic cells; PreB, pre–B cells; Neut, neutrophil; NK, natural killer cells.
Association with PPM1H. (A) Top: close-up of the 12q14 signal. Middle: chromatin looping interactions in CD34+ cells with standard and internal promoter (red arches; y-axis indicates PCHi-C P-score). Bottom: positive correlation between PPM1H expression across sorted blood cell populations and ATAC-seq signal45 (100 bp sliding window) in an ∼500-bp-long chromosomal segment in intron 1 (red peak)45 (y-axis indicates false discovery rate for Pearson correlation). (B) Four credible set variants (supplemental Table 9) map to the identified segment, which is accessible in HSCs, MPPs, CMPs, and MEPs (y-axis indicates ATAC-seq signal). (C) Luciferase activities of the 4 candidate causal variants in K562 cells (3 biological replicates). P values for one-sided Student t test in the cis-eQTL direction. Data normalized to empty vector control (Ctrl). (D) MYB motif logo; rs772557[A>G] alters a critical recognition base. (E) Chromatin immunoprecipitation with massively parallel DNA sequencing for MYB in Jurkat cells (rs772557-heterozygous) showing exclusive pull-down of rs772557-G reads. (F) siRNA knockdown of MYB in K562 cells attenuates rs772557-G luciferase activity (3-4 biological replicates). P value is for one-sided Student t test. (G) CRISPR/Cas9 disruption of rs772557 (supplemental Figure 16) in K562 cells (5 biological targeting replicates; 7 biological control replicates). P values are for one-sided Student t test. (H) Coexpression of PPM1H and MYB across blood cell types. Data are bulked single-cell messenger RNA-seq data from 35 582 blood and bone marrow mononuclear cells.17 (I-J) CD34+ cell RNA-seq data revealed stronger correlation between MYB and PPM1H expression in rs772557-G homozygotes (n = 27) than in rs772557-A homozygotes (n = 37). Data are log2-transformed fragments per kilobase of transcript per million mapped reads (FPKM) values, median-centered per genotype group. P and r values are for Pearson correlation. a.u., arbitrary units; B, B cells; Baso, basophil; CD4, CD4+ T cells; CD8, CD8+ T cells; CLP, common lymphoid progenitors; Cyc, cycling cells; DC, dendritic cells; ERY, erythroid progenitors; GMP, granulocyte-monocyte progenitors; LMPP, lymphoid-primed multipotent progenitors; mDC, myeloid dendritic cells; Mono, monocyte; n.s., not significant; PC, plasma cells; pDC, plasmacytoid dendritic cells; PreB, pre–B cells; Neut, neutrophil; NK, natural killer cells.
The identified segment overlaps 4 credible set variants (rs772555, rs772556, rs772557, and rs772559). For functional fine-mapping, we conducted luciferase experiments with constructs representing their reference and alternative alleles in K562 erythroleukemia cells. Significantly higher luciferase activity was observed with the rs772557-G construct than with the rs772557-A construct (one-sided Student t test, P = 9.8 × 10⁻³) (Figure 4C), consistent with the cis-eQTL direction (rs772557[A>G] is in LD with rs669585[T>G]; r2 = 0.98). We also found higher accessibility at rs772557-G than at rs772557-A in DNase-sequencing data46 for heterozygous adult CD34+ cells (125 vs 47 reads; binomial test, P = 2.0 × 10⁻⁸).
Motif analysis predicted that the rs772557-G allele contains an MYB transcription factor–binding site that is abrogated by the rs772557-A allele (Figure 4D; supplemental Table 14). Consistent with this finding, chromatin immunoprecipitation sequencing for MYB in Jurkat cells (heterozygous for rs772557) showed exclusive pull-down of rs772557-G (Figure 4E; supplemental Figure 15). In addition, luciferase experiments with cotransfected MYB siRNA showed selective attenuation of signal from rs772557-G construct but had no impact on signal from rs772557-A construct (one-sided Student t test, P = 2.7 × 10⁻⁴ for MYB siRNA-treated cells vs controls) (Figure 4F).
For further functional validation, we perturbed rs772557 by CRISPR/Cas9 in K562 cells, which are triploid-heterozygous for rs772557, having 2 copies of the rs772557-G allele and 1 copy of the rs772557-A allele. Serendipitously, we identified sgRNA sequences that overlap rs772557 and enable allele-specific disruption by cutting DNA only 1 bp upstream of rs772557 (supplemental Figure 16; supplemental Table 4). We observed PPM1H downregulation with rs772557-G sgRNA (one-sided Student t test, P = 2.3 × 10⁻³ for rs772577-G-sgRNA–treated vs sgRNA-control–treated cells; P = 7.1 × 10⁻³ for rs772557-G-sgRNA–treated vs rs772557-A-sgRNA-treated cells) (Figure 4G). In addition, MYB and PPM1H are coexpressed across blood cell types (Figure 4H), and, in our CD34+ cell RNA-seq data for blood donors, stronger positive correlation was observed between MYB and PPM1H expression among 27 rs772557-G homozygotes (Pearson correlation r = 0.74; P = 1.2 × 10⁻⁵) (Figure 4I) than among 37 rs772557-A homozygotes (Pearson correlation r = 0.51; P = 1.1 × 10⁻³) (Figure 4J), with a borderline-significant difference between the 2 correlation coefficients (one-sided Fisher Z test, P = .08). Consistent with an additive allele dose effect, an intermediate correlation was observed among 85 rs772557-A/G heterozygotes (Pearson correlation r = 0.56; P = 2.3 × 10⁻⁸). Finally, shRNA-knockdown of PPM1H in primary CD34+ umbilical cord blood cells resulted in higher proportions of CD34+ and CD34+90+ cells relative to control (supplemental Figures 17 and 18). These data identify rs772557 as a causal variant and further support a functional anticorrelation between PPM1H expression and blood CD34+ cell levels.
Additional associations
Among the remaining significant associations, 1p36/ENO1-RERE and 3p22/ITGA9 exhibit cis-eQTLs in CD34+ cells (Figure 2B). ENO1 encodes the glycolytic enzyme α-enolase 1; a shorter isoform binds the MYC promoter as a tumor suppressor.47RERE encodes a transcription factor that binds the retinoic acid receptor.48 The credible set contains a candidate causal regulatory variant between ENO1 and RERE that interacts with both promoters (supplemental Figure 8C; supplemental Table 9). ITGA9 encodes integrin α-9, which is expressed in HSPCs,49 but its role remains unclear. The identified association maps to ITGA9 introns 3 and 4, with four regulatory variants in intron 3 looping to the promoter (supplemental Figure 8D; supplemental Table 9). Finally, the 19p13 signal tags a missense variant in ARHGAP45, encoding minor histocompatibility protein HA-1, a regulator of T- and B-cell migration.50 Interestingly, recent mouse data suggest that Arhgap45 also regulates HSPC engraftment in bone marrow.51
Among the suggestive associations, the 8q24 signal maps to CCDC26, but PCHi-C analysis revealed a long-distance looping interaction with the MYC promoter, 1.86 Mb away (supplemental Figure 8H). Interestingly, the identified signal corresponds to the Blood ENhancer Cluster (BENC), an evolutionarily conserved “super-enhancer” required for Myc expression in mouse HSPCs.52 The BENC comprises 8 enhancer modules (denoted A to H). Our signal spans module D. Deletion of this module in mice affects Myc expression in HSCs and MPPs. Finally, the second suggestive signal maps to TERT. Mutations in TERT cause dyskeratosis congenita, in which impaired telomere maintenance leads to problems with HSPC regeneration and increased risk of myelodysplastic syndrome.53 Somatic mutations in TERT and MYC have also been reported in blood malignancies.33
Discussion
We report the first large-scale GWAS on blood CD34+ cell levels. We identify 9 significant association signals explaining approximately one-third of the total estimated SNP heritability (4.6% of 12.7%). This study represents the first successful GWAS on a stem cell trait, and the results provide proof-of-principle for the idea that HSPC regulators can be identified in vivo in humans through genetic variation.
We identified associations with known regulators of blood CD34+ cell levels, as well as with 5 novel regulators (PPM1H, ENO1, RERE, ITGA9, and ARHGAP45). Understanding the mechanisms and molecular pathways that underlie these associations poses intriguing challenges. The clinical efficacy of CXCR4 antagonists in the context of stem cell mobilization, and our data (Figure 3), suggest that the rate of egression of CD34+ cells is the key variable in the case of the CXCR4 associations. At the same time, variation in blood CD34+ cell levels can reflect variation in several physiological variables, including egression rate, time spent in the bloodstream, and stem cell pool size. Potentially, the identified variants and genes could affect either, or several, of these variables.
Today, the most common method to harvest stem cells for transplantation is by leukapheresis, requiring mobilization of HSPCs into the blood. Current mobilization regimens include cyclophosphamide, granulocyte colony-stimulating factor, and CXCR4 inhibitors. Intriguingly, for the most significant locus, we discovered an anticorrelation between PPM1H expression and CD34+ levels, supported by cis-eQTL, functional fine-mapping, and shRNA-knockdown data (Figures 2B and 4). This finding suggests that PPM1H could be used as an inhibition target to facilitate stem cell harvesting by leukapheresis, although further studies are needed to understand the biology of PPM1H and to identify pharmacologic inhibitors. Regarding potential side effects of such inhibitors, PPM1H has not been associated with any severe disease according to GWAS Catalog and UK Biobank data.27,54 Although the gene is conserved against loss-of-function variants relative to synonymous coding variants (observed/expected score 0.18 vs 0.98 in the Genome Aggregation Database, gnomAD55), the UK Biobank database contains 32 individuals with loss-of-function PPM1H variants (https://www.ukbiobank.ac.uk and https://azphewas.com), all of whom were aged >40 years at recruitment, with >10 years of follow-up.26 Moreover, the effects of any inhibitor, when used in the context of stem cell mobilization, will likely be short term. Other notable findings include ENO1 as a regulatory enzyme with links to the MYC pathway, RERE as a transcription factor with links to retinoic acid signaling, and ITGA9 as a cell surface marker with a functional role in the regulation of blood CD34+ cell levels. In all, we report the first large-scale analysis of the genetic architecture of blood CD34+ cell levels, with potential implications for stem cell harvesting and transplantation.
Acknowledgments
The authors are indebted to Ellinor Jonsson and the personnel at the Clinical Chemistry and Clinical Immunology and Transfusion Medicine in Region Skåne for their assistance, and the patients and blood donors who participated in the study.
This work was supported by grants from the European Research Council (CoG-770992), the Knut and Alice Wallenberg Foundation (2014.0071 and 2017.0436), the Swedish Research Council (2017-02023 and 2018-00424), the Swedish Cancer Society (2017/265 and 20.0694), the Swedish Children’s Cancer Fund (PR2018-0118 and TJ2017-0042), and the Inga Britt & Arne Lundberg Research Foundation (2017-0055).
Authorship
Contribution: A.L.d.L.P., U.T., J.L., K.S., and B.N. conceived the study; A.L.d.L.P., L.E., C.C., Z.A., M.P., K.Ž., G.N., U.T., J.L., K.S., and B.N. designed experiments; A.L.d.L.P., C.C., and N.M. developed flow cytometry protocols; L.E. and A.L.A. developed AliGater; A.L.d.L.P., L.E., C.C., Z.A., N.M., N.U.D., and D.B. performed the phenotyping; A.L.d.L.P., C.C., G.T., M.P., U.T., and K.S. performed genetic analyses; C.C., Z.A. N.M., and K.Ž. conducted functional experiments; A.L.d.L.P., L.E., C.C., Z.A., N.M., G.T., K.Ž., A.L.A., M.T., M.P., P.D., E.B., A.N., V.G.S., G.K., and B.N. performed data analyses; and A.L.d.L.P., L.E., C.C., Z.A., and B.N. drafted the manuscript. All authors contributed to the final manuscript.
Conflict-of-interest disclosure: G.T., G.N., U.T., and K.S. are employed by deCODE genetics/Amgen Inc. V.G.S. serves as an advisor to and/or has equity in Branch Biosciences, Ensoma, Novartis, Forma, and Cellarity, all unrelated to this work. The remaining authors declare no competing financial interests.
Correspondence: Björn Nilsson, Hematology and Transfusion Medicine, Department of Laboratory Medicine, BMC B13, 221 84 Lund, Sweden; e-mail: bjorn.nilsson@med.lu.se.
The sequencing data and counts of fragments per kilobase of transcript per million mapped reads are available from the European Genome Archive repository (accession numbers EGAS00001005655 and EGAD00001008194).
The online version of this article contains a data supplement.
The publication costs of this article were defrayed in part by page charge payment. Therefore, and solely to indicate this fact, this article is hereby marked “advertisement” in accordance with 18 USC section 1734.

Comments
ITGA9 plays an important role in HSC mobilisation