

Key Points
Whole-genome CRISPR library screening identified therapeutic targets including CDK6 in ATLL.
CDK6 inhibitor palbociclib alone and in combination with an mTORC1 inhibitor may be an effective strategy to treat ATLL.

Abstract
Adult T-cell leukemia/lymphoma (ATLL) is an aggressive T-cell malignancy with a poor prognosis with current therapy. Here we report genome-wide CRISPR-Cas9 screening of ATLL models, which identified CDK6, CCND2, BATF3, JUNB, STAT3, and IL10RB as genes that are essential for the proliferation and/or survival of ATLL cells. As a single agent, the CDK6 inhibitor palbociclib induced cell cycle arrest and apoptosis in ATLL models with wild-type TP53. ATLL models that had inactivated TP53 genetically were relatively resistant to palbociclib owing to compensatory CDK2 activity, and this resistance could be reversed by APR-246, a small molecule activator of mutant TP53. The CRISPR-Cas9 screen further highlighted the dependence of ATLL cells on mTORC1 signaling. Treatment of ATLL cells with palbociclib in combination with mTORC1 inhibitors was synergistically toxic irrespective of the TP53 status. This work defines CDK6 as a novel therapeutic target for ATLL and supports the clinical evaluation of palbociclib in combination with mTORC1 inhibitors in this recalcitrant malignancy.
Introduction
Adult T-cell leukemia/lymphoma (ATLL) is an aggressive hematological malignancy associated with infection by the retrovirus human T-cell lymphotropic virus type I (HTLV-I).1 Clinical outcomes using currently available chemotherapies are generally inferior, with a long-term survival rate of less than 20%.2 Therefore, there is an urgent need to identify new therapeutic approaches to target essential pathways in ATLL that regulate the proliferation and survival of these cancer cells. Previous studies have used next-generation sequencing technology to identify mutated genes that may be pivotal in the pathogenesis of ATLL.3,4 Substantial progress in understanding the considerable genetic and epigenetic heterogeneity of ATLL has been made in recent years.3-5 This heterogeneity presents a formidable challenge to the development of therapeutic regimens that are broadly effective in ATLL.
Functional genomic screening enables the identification of molecular dependencies in cancer, including pathways that maintain cancer cell proliferation and viability.6-12 We previously performed short hairpin RNA (shRNA) library-mediated functional genomic screens in ATLL models and identified BATF3 and IRF4 as genes essential for proliferation and survival.5 BATF3 serves as a master regulatory transcription factor that, together with IRF4, coordinates super-enhancer function throughout the ATLL genome. Importantly, this regulatory module is augmented by the HTLV-1 HBZ protein, which is also essential for ATLL cell viability.5
This shRNA screening effort used a subgenomic library targeting 1051 genes, raising the possibility that other essential genes in ATLL remain to be discovered. The clustered regularly interspaced short palindromic repeats (CRISPR)-associated endonuclease 9 (Cas9) system is a genome editing technology by which targeted genes can be inactivated efficiently and specifically, thereby enabling genome-wide functional genomic screening.8-12 In recent studies, CRISPR-Cas9 screens have successfully identified essential genes involved in cancer cell viability.8,9 In this study, we performed unbiased genome-wide CRISPR-Cas9 screens in multiple ATLL models with the goal of identifying new therapeutic strategies for this aggressive malignancy.
Materials and methods
See supplemental Experimental procedures for details, available on the Blood Web site.
Cell lines and cell culture
All lines were cultured with RPMI media containing 10% fetal calf serum, penicillin, and streptomycin and were maintained in a humidified, 5% CO2 incubator at 37°C.
Whole-genome CRISPR-Cas9 screen analysis
Single-guide RNA (sgRNA) library screening was performed as previously described.5 Cell lines were transduced in duplicate with the Brunello CRISPR knockout pooled library (gift of David Root and John Doench; Addgene 73178). Cells were cultured for 4 weeks, and starting/endpoint cell aliquots were harvested for genomic DNA extraction. sgRNA sequences were amplified and sequenced using NEXTSeq500 (Illumina). The sgRNA read count and log2 fold change (day 28/day 0) were analyzed by MAGeCK algorithm.13
Human ATLL samples
Written informed consent was obtained in accordance with the Declaration of Helsinki and was approved by the Institutional Review Board of the National Cancer Institute and of Hokkaido University Faculty of Medicine. Peripheral blood (PB) mononuclear cells were isolated from ATLL patients by Ficoll-Hypaque.
Mice
All animal experiments were approved by the National Cancer Institute Animal Care and Use Committee (NCI ACUC) and were performed in accordance with NCI ACUC guidelines. Female NOD/SCID γ mice were subcutaneously injected with 1 × 10⁷ of ATL43Tb(-) cells in the flanks. When the average tumor volume reaches 50 mm3, drugs were administrated intraperitoneally 3 days per week (12.5 mg/kg for palbociclib and 2.5 mg/kg for everolimus). The tumor growth was calculated from caliper measurements.
Results
Genome-wide loss-of-function CRISPR screening identified 9 essential genes in ATLL cell lines
We conducted a genome-wide loss-of-function CRISPR screen targeting 19 114 genes in 3 ATLL cell lines (KK1, ST1, and Su9T01) engineered to express a Cas9 gene (Figure 1A). The “Brunello” lentiviral sgRNA expression library that we used included 4 different sgRNAs per gene. ATLL cell lines were transduced with this library in duplicate, and cells were then cultured for 4 weeks. Gene essentiality was evaluated by comparing the abundance of each sgRNA in the cell populations at 4 weeks with that of the starting cell pool. Control nontargeting sgRNAs were not toxic, whereas sgRNAs targeting core fitness genes, which are essential in most human cell lines,10-12 were essential in all ATLL lines tested (Figure 1B).

Genome-wide loss-of-function CRISPR screening identifies 9 essential genes in ATLL cell lines. (A) Outline of the workflow of the genome-wide loss-of-function CRISPR screening in this study. (B) Violin plot indicating the distribution of log2 fold change values for core fitness gene targeting sgRNAs colored in red or for nontarget control sgRNA colored in blue. Black horizontal lines indicate median values. (C) Essential gene selection flowchart. (D) Log2 fold change values for 9 essential genes identified in whole-genome CRISPR library screen. sgRNAs with at least a log2 fold change of 0.5 with at least 2 sgRNAs per gene in all 3 ATLL lines were selected. Data were shown as average fold changes from duplicated assays in 3 ATLL cell lines.
Genome-wide loss-of-function CRISPR screening identifies 9 essential genes in ATLL cell lines. (A) Outline of the workflow of the genome-wide loss-of-function CRISPR screening in this study. (B) Violin plot indicating the distribution of log2 fold change values for core fitness gene targeting sgRNAs colored in red or for nontarget control sgRNA colored in blue. Black horizontal lines indicate median values. (C) Essential gene selection flowchart. (D) Log2 fold change values for 9 essential genes identified in whole-genome CRISPR library screen. sgRNAs with at least a log2 fold change of 0.5 with at least 2 sgRNAs per gene in all 3 ATLL lines were selected. Data were shown as average fold changes from duplicated assays in 3 ATLL cell lines.
We identified 1278 essential genes whose knockout was toxic, as indicated by a decrease in average abundance of gene-targeting sgRNAs of at least 0.5 log2 fold in at least 2 sgRNAs per gene in all 3 ATLL lines tested (Figure 1C; supplemental Table 1). To identify potential therapeutic targets that are selectively essential in ATLL cells, we excluded 964 core fitness genes from this gene set from further consideration (Figure 1C). We also excluded the 305 essential genes identified in CRISPR-Cas9 screens of 2 mantle cell lymphoma (MCL) cell lines (Jeko1 and UPN1) (305 genes; Figure 1C; supplemental Table 2). After these filters, 9 essential genes were identified as potential molecular targets with specificity for ATLL (Figure 1C-D). These genes implicated diverse regulatory pathways in the pathobiology in ATLL, including genes encoding AP-1-family transcription factors (BATF3 and JUNB), regulators of the G1-S phase cell cycle phase transition (CDK6 and CCND2), components of the JAK/STAT pathway (STAT3 and IL10RB), RNA binding proteins (SYNCRIP and ZFP36L2), and a protein prenyltransferase subunit (PTAR1).
BATF3 and JUNB are essential AP-1 factors in ATLL cells
We previously demonstrated that BATF3 and IRF4 cooperatively direct gene expression in ATLL cells by binding to composite AP-1/IRF4 DNA motifs.5 As expected, both factors were essential in ATLL as judged by the CRISPR-Cas9 screens, but IRF4 was removed from our ATLL-specific essential gene set due to its essentiality in MCL lines. In follow-up experiments, sgRNAs targeting BATF3 or IRF4 (sgBATF3 or sgIRF4) were specifically toxic for all 5 ATLL cell lines tested (Figure 2A; supplemental Figure 1A).

BATF3 and JUNB are essential AP-1 factors in ATLL cells. (A) The indicated cell lines were infected with a lentivirus expressing sgBATF3_1 and sgIRF4_1 together with GFP. Shown is the fraction of GFP-positive cells over time relative to the GFP-positive fraction on day 3. (B) Immunoblot analysis of JUNB protein in sgJUNB-transduced ST1. (C) Toxicity assay using sgJUNB_1 was done as in Figure 2A. (D) Immunoblot analysis of JUNB, c-JUN, and JUND proteins in ATLL and MCL cell lines. (E) Immunoblot analysis of JUNB, c-JUN, and JUND proteins in ST1 ATLL cells transduced with indicated cDNA-expressing vectors. (F) ST1 cells were transduced with retroviruses expressing an sgRNA-resistant JUNB, JUN, JUND together with puromycin-resistance gene or with an empty vector expressing puromycin-resistance gene. After puromycin selection of transduced cells, cells were subsequently transduced with lentiviruses coexpressing GFP and either sgJUNB_1 or sgJUNB_2. sgAAVS1 and sgRPL6 were used as a negative and positive control sgRNA, respectively. The GFP-positive cell fraction was monitored as in Figure 2A. (G) Coimmunoprecipitation assay was performed by using anti-BATF3 antibody or anti-JUNB antibody. Immunoprecipitates were analyzed by immunoblot with anti-HBZ, anti-BATF3, anti-JUNB, or anti-IRF4 antibodies. Error bars represent the SEM of replicates (A,C,F).
BATF3 and JUNB are essential AP-1 factors in ATLL cells. (A) The indicated cell lines were infected with a lentivirus expressing sgBATF3_1 and sgIRF4_1 together with GFP. Shown is the fraction of GFP-positive cells over time relative to the GFP-positive fraction on day 3. (B) Immunoblot analysis of JUNB protein in sgJUNB-transduced ST1. (C) Toxicity assay using sgJUNB_1 was done as in Figure 2A. (D) Immunoblot analysis of JUNB, c-JUN, and JUND proteins in ATLL and MCL cell lines. (E) Immunoblot analysis of JUNB, c-JUN, and JUND proteins in ST1 ATLL cells transduced with indicated cDNA-expressing vectors. (F) ST1 cells were transduced with retroviruses expressing an sgRNA-resistant JUNB, JUN, JUND together with puromycin-resistance gene or with an empty vector expressing puromycin-resistance gene. After puromycin selection of transduced cells, cells were subsequently transduced with lentiviruses coexpressing GFP and either sgJUNB_1 or sgJUNB_2. sgAAVS1 and sgRPL6 were used as a negative and positive control sgRNA, respectively. The GFP-positive cell fraction was monitored as in Figure 2A. (G) Coimmunoprecipitation assay was performed by using anti-BATF3 antibody or anti-JUNB antibody. Immunoprecipitates were analyzed by immunoblot with anti-HBZ, anti-BATF3, anti-JUNB, or anti-IRF4 antibodies. Error bars represent the SEM of replicates (A,C,F).
The BATF3 BZIP transcription factor binds to AP-1 motifs by forming heterodimers with other BZIP family members, but the relevant BATF3-interacting subunit in ATLL is unknown. We noted that 3 sgRNAs targeting the BZIP protein JUNB were highly toxic for ATLL cell lines in the CRISPR-Cas9 screens while MCL cell lines were unaffected (Figure 1D). The immunohistochemical analysis of primary biopsy samples revealed that JUNB protein was expressed in all ATLL cases (supplemental Figure 1B-C), suggesting a role for JUNB in ATLL pathogenesis. In confirmatory experiments, transduction of ATLL cells with sgRNAs targeting JUNB resulted in the near-total reduction in protein levels (Figure 2B), and 2 JUNB sgRNAs were strongly toxic for all ATLL lines tested but not for MCL lines (Figure 2C; supplemental Figure 1A). Although all 3 JUN family members (JUN [c-JUN], JUNB, and JUND) were expressed in ATLL cells by immunoblot analysis (Figure 2D), JUN and JUND were not essential genes in the ATLL CRISPR-Cas9 screens, demonstrating that JUNB performs a nonredundant, essential function in ATLL cells. Accordingly, the ectopic expression of JUN or JUND coding regions failed to rescue ATLL cells from sgJUNB-mediated toxicity while expression of JUNB was effective (Figure 2E-F; supplemental Figure 1D).
In normal T cells, JUNB forms heterodimers with BATF3 and acts as an AP-1 transcription factor that cooperatively binds with IRF4 to composite AP-1/IRF DNA motifs.14,15 JUNB can also heterodimerize with the HTLV-I-encoded transcription factor HBZ,15 an indispensable molecule in ATLL pathobiology.1,5 An antibody against JUNB efficiently immunoprecipitated both BATF3 and HBZ in ATLL cell lines (Figure 2G). Together, these findings suggest that JUNB, BATF3, HBZ, and IRF4 control an essential regulatory network in ATLL, and as such, are worthy, while challenging, candidates for therapeutic targeting.
Essential genes in the JAK/STAT pathway
As indicated by the CRISPR-Cas9 screens (Figure 1D), knockout of STAT3 by 2 sgRNAs (sgSTAT3) was toxic for all ATLL lines tested but not for the MCL lines (Figure 3A-B). In KK1 ATLL cells, the toxicity of STAT3 knockout was reversed by the ectopic expression of a wild-type (WT) STAT3 coding region that was engineered to be resistant to the STAT3 sgRNA (Figure 3C). This was not the case in ST1 ATLL cells, which harbored a STAT3D556N mutation, which is a hotspot somatic mutation in the DNA binding domain, which has been observed previously in ATLL,3 extranodal NK-T-cell lymphoma,16 peripheral T-cell lymphoma not otherwise specified (PTCL-NOS),17 and diffuse large B-cell lymphoma18-21 (Figure 3D). Given that STAT3 mutations are present in 21.4% of primary ATLL tumors, many of which have been shown to be gain-of-function,3 we suspected that this may also be true of STAT3D556N. The ectopic expression of an sgSTAT3-resistant STAT3 coding region bearing the D556N mutation almost completely rescued ST1 cells from sgSTAT3-mediated toxicity (Figure 3D). In contrast, the ectopic expression of sgSTAT3-resistant cDNAs encoding STAT3Y640F or STAT3D661Y, 2 highly recurrent gain-of-function STAT3 mutations in SH2 domain,22 only partially rescued ST1 cells from STAT3 knockout (Figure 3D), indicating that these cells had acquired a strong and selective dependence on STAT3D556N. Immunoblot analysis revealed that STAT3 was phosphorylated in 75% of ATLL lines tested, with roughly equivalent levels in KK1 cells, which are STAT3 WT, and ST1 cells, which express STAT3D556N (Figure 3E). Interestingly, ectopic expression of STAT3Y640F or STAT3D661Y in ST1 cells strongly increased STAT3 phosphorylation while STAT3D556N had a more subtle effect, emphasizing the functional diversity of STAT3 mutations in ATLL (Figure 3F). More generally, these data validate STAT3 as a potential therapeutic target in ATLL that awaits the development of a clinically available and effective STAT3 inhibitor.
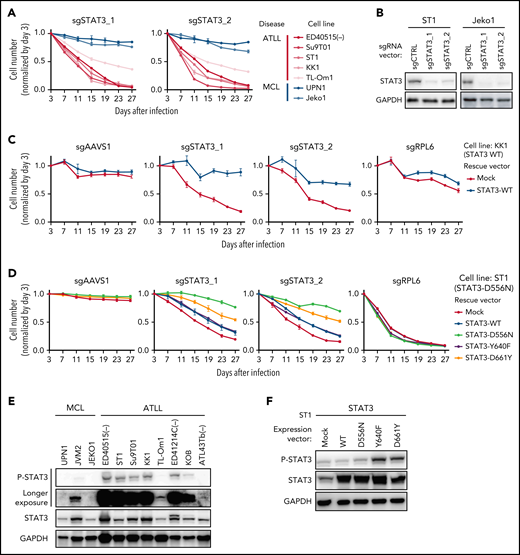
STAT3 is an essential molecule in JAK/STAT signaling in ATLL. (A) The indicated cell lines were infected with a lentivirus expressing sgSTAT3_1 and sgSTAT3_2 together with GFP. The GFP-positive cell fraction was monitored as in Figure 2A. (B) Immunoblot analysis of STAT3 protein in sgSTAT3-transduced ST1 and Jeko1. (C-D) KK1 cells were transduced with retroviruses expressing an sgRNA-resistant STAT3-WT or with empty vector (C). ST1 cells were transduced with lentiviruses expressing an sgRNA-resistant STAT3-WT, STAT3-D556N, STAT3-Y640F, STAT3-D661Y together with puromycin-resistance gene or with an empty vector expressing puromycin-resistance gene. (D) After puromycin selection of transduced cells, cells were subsequently transduced with lentiviruses coexpressing GFP and either sgSTAT3_1 or sgSTAT3_2. sgAAVS1 and sgRPL6 were used as a negative and positive control sgRNA, respectively. The GFP-positive cell fraction was monitored as in Figure 2A. (E) Immunoblot analysis of STAT3 protein in ATLL and MCL cell lines. (F) Immunoblot analysis of STAT3 protein in ST1 ATLL cells transduced with indicated cDNA-expressing vectors. Error bars represent the SEM of replicates (A,C-D).
STAT3 is an essential molecule in JAK/STAT signaling in ATLL. (A) The indicated cell lines were infected with a lentivirus expressing sgSTAT3_1 and sgSTAT3_2 together with GFP. The GFP-positive cell fraction was monitored as in Figure 2A. (B) Immunoblot analysis of STAT3 protein in sgSTAT3-transduced ST1 and Jeko1. (C-D) KK1 cells were transduced with retroviruses expressing an sgRNA-resistant STAT3-WT or with empty vector (C). ST1 cells were transduced with lentiviruses expressing an sgRNA-resistant STAT3-WT, STAT3-D556N, STAT3-Y640F, STAT3-D661Y together with puromycin-resistance gene or with an empty vector expressing puromycin-resistance gene. (D) After puromycin selection of transduced cells, cells were subsequently transduced with lentiviruses coexpressing GFP and either sgSTAT3_1 or sgSTAT3_2. sgAAVS1 and sgRPL6 were used as a negative and positive control sgRNA, respectively. The GFP-positive cell fraction was monitored as in Figure 2A. (E) Immunoblot analysis of STAT3 protein in ATLL and MCL cell lines. (F) Immunoblot analysis of STAT3 protein in ST1 ATLL cells transduced with indicated cDNA-expressing vectors. Error bars represent the SEM of replicates (A,C-D).
Given the essential role of STAT3 and IL10RB in ATLL models, we interrogated our CRISPR screen data for other essential genes in the JAK/STAT signaling pathway (supplemental Figure 2A). KK1, which is IL-2-dependent, displayed the expected dependency on components of the IL2 signaling machinery (IL2RA, IL2RB, IL2RG, JAK1, JAK3, and STAT5B). In addition, KK1 depended on the IL-10 receptor subunits IL10RA and IL10RB, as well as STAT3. Since this ATLL line also expressed high levels of IL10 mRNA (supplemental Figure 2B, left panel), these results suggest that this line depends on autocrine IL-10 signaling. By contrast, the IL-2-independent lines ST1 and Su9T01 depended on the IL-22 receptor subunits IL22RA1 and IL10RB, as well as STAT3. Notably, ST1 and Su9T01 are the only ATLL cell lines tested that expressed high mRNA levels of IL22, suggesting that these lines acquired a dependence on autocrine IL-22 signaling (supplemental Figure 2B, right panel).
The IL-22 receptor activates STAT3 through JAK1 and TYK2 in normal T cells.23 In the CRISPR-Cas9 screen, KK1 and Su9T01 cells were strongly dependent on both of these kinases, whereas ST1 cells had only a moderate dependence on JAK1. Although the JAK1/2 inhibitor ruxolitinib was able to kill IL-2-dependent ATLL lines, which depend on JAK1, this agent had little if any effect in IL2-independent ATLL lines, including Su9T01 and ST1 (supplemental Figure 2C). In Su9T01 cells, this could be due to compensatory TYK2 activity, whereas in ST1 cells, the gain-of-function STAT3D556N mutation may have blunted the effect of the drug.
CDK6 and CCND2 are essential for the G1/S cell cycle transition in ATLL cells
Four sgRNAs targeting CDK6 were highly toxic for ATLL cell lines in the CRISPR-Cas9 screens, as were 2 CCND2 sgRNAs (Figure 1D). CCND1, CCND2, and CCND3 are G1/S-phase-specific cyclins that interact with CDK4 or CDK6 to form an active kinase, which promotes the G1-S phase cell cycle transition by phosphorylating and inactivating the retinoblastoma (Rb) protein.24,25 In confirmatory experiments, ATLL cells were transduced with a CDK6-targeting sgRNA (sgCDK6), thereby reducing levels of CDK6 and phosphorylated Rb by immunoblot analysis (Figure 4A). sgCDK6 caused time-dependent toxicity in all 5 ATLL cell lines but did not affect control MCL lines (Figure 4B; supplemental Figure 3A). By contrast, 4 of these ATLL lines were unaffected by an sgRNA targeting CDK4 (sgCDK4), whereas MCL lines were CDK4-dependent (supplemental Figure 3A). ATLL cells were rescued from the toxicity of sgCDK6 by ectopic expression of a CDK6 coding region that was engineered to be sgCDK6-resistant, whereas expression of CDK4 only rescued partially (Figure 4C; supplemental Figure 3B-C). As expected, knockout of CDK6 in ATLL cells caused a pronounced G1-phase arrest (Figure 4D; supplemental Figure 3D). Surprisingly, CDK6 knockout also induced apoptosis in a time-dependent manner (Figure 4E-F; supplemental Figure 3E-F), which may account for the strong cytotoxicity of sgCDK6 in ATLL cell lines. The immunohistochemical analysis of primary biopsy samples revealed that 93% of ATLL cases expressed CDK6 protein (supplemental Figure 3G-H), further indicating a pathogenic role for CDK6 in ATLL.

CDK6 and CCND2 are essential molecules in G1/S transition in ATLL cells. (A) Immunoblot analysis of CDK6 and RB protein in sgCDK6-transduced ST1. (B) The indicated cell lines were infected with a lentivirus that expresses sgCDK6_1 and sgCCND2_1 together with GFP. The GFP-positive cell fraction was monitored as in Figure 2A. (C) ST1 cells were transduced with retroviruses expressing an sgRNA-resistant CDK6, CDK4 together with puromycin-resistance gene or with an empty vector expressing puromycin-resistance gene. After puromycin selection of the transduced cells, cells were subsequently transduced with lentiviruses coexpressing GFP and either sgCDK6_1 or sgCDK6_2. sgAAVS1 and sgRPL6 were used as a negative and positive control sgRNA, respectively. The GFP-positive cell fraction was monitored as in Figure 2A. (D) Su9T01 cells were transduced with vectors coexpressing GFP and either sgCDK6_1 and sgCCND2_1. DNA content was analyzed in the GFP-positive fraction (blue, the cells have sgRNA) and GFP-negative cell fraction (red, the cells don’t have sgRNA) on day 5 after sgRNA transduction. (E) The percentages of apoptotic cells were detected by analyzing Annexin V and propidium iodide (PI) on flowcytometry on day 5 after sgRNA transduction. (F) The ratio of PI(-)Annexin V(+) cells/PI(-) Su9T01 cells transduced with indicated sgRNAs were monitored over time. (G) ST1 cells were transduced with retroviruses expressing an sgRNA-resistant CCND2, CCND1, CCND3 together with puromycin-resistance gene or with an empty vector expressing puromycin-resistance gene. After puromycin selection of the transduced cells, cells were subsequently transduced with lentiviruses coexpressing GFP and either sgCCND2_1 or sg CCND2_2. sgAAVS1 and sgRPL6 were used as a negative and positive control sgRNA, respectively. The GFP-positive cell fraction was monitored as in Figure 2A. (H) Immunoblot analysis of CCND1, CCND2, CCND3, CDK4, and CDK6 proteins in ATLL and MCL cell lines. (I) CCND1, CCND2, CCND3, CDK4, and CDK6 mRNA expression values on indicated Affymetrix microarray probe in primary ATLL, ALK+ALCL, and PTCL-NOS samples. Error bars represent mean with the SD. Error bars represent the SEM of replicates (B-C,F-G). *P < .05, **P < .01, ***P < .001.
CDK6 and CCND2 are essential molecules in G1/S transition in ATLL cells. (A) Immunoblot analysis of CDK6 and RB protein in sgCDK6-transduced ST1. (B) The indicated cell lines were infected with a lentivirus that expresses sgCDK6_1 and sgCCND2_1 together with GFP. The GFP-positive cell fraction was monitored as in Figure 2A. (C) ST1 cells were transduced with retroviruses expressing an sgRNA-resistant CDK6, CDK4 together with puromycin-resistance gene or with an empty vector expressing puromycin-resistance gene. After puromycin selection of the transduced cells, cells were subsequently transduced with lentiviruses coexpressing GFP and either sgCDK6_1 or sgCDK6_2. sgAAVS1 and sgRPL6 were used as a negative and positive control sgRNA, respectively. The GFP-positive cell fraction was monitored as in Figure 2A. (D) Su9T01 cells were transduced with vectors coexpressing GFP and either sgCDK6_1 and sgCCND2_1. DNA content was analyzed in the GFP-positive fraction (blue, the cells have sgRNA) and GFP-negative cell fraction (red, the cells don’t have sgRNA) on day 5 after sgRNA transduction. (E) The percentages of apoptotic cells were detected by analyzing Annexin V and propidium iodide (PI) on flowcytometry on day 5 after sgRNA transduction. (F) The ratio of PI(-)Annexin V(+) cells/PI(-) Su9T01 cells transduced with indicated sgRNAs were monitored over time. (G) ST1 cells were transduced with retroviruses expressing an sgRNA-resistant CCND2, CCND1, CCND3 together with puromycin-resistance gene or with an empty vector expressing puromycin-resistance gene. After puromycin selection of the transduced cells, cells were subsequently transduced with lentiviruses coexpressing GFP and either sgCCND2_1 or sg CCND2_2. sgAAVS1 and sgRPL6 were used as a negative and positive control sgRNA, respectively. The GFP-positive cell fraction was monitored as in Figure 2A. (H) Immunoblot analysis of CCND1, CCND2, CCND3, CDK4, and CDK6 proteins in ATLL and MCL cell lines. (I) CCND1, CCND2, CCND3, CDK4, and CDK6 mRNA expression values on indicated Affymetrix microarray probe in primary ATLL, ALK+ALCL, and PTCL-NOS samples. Error bars represent mean with the SD. Error bars represent the SEM of replicates (B-C,F-G). *P < .05, **P < .01, ***P < .001.
Knockout of CCND2 in ATLL lines phenocopied CDK6 knockout, inducing both cell cycle arrest and apoptosis (Figure 4B,D-F; supplemental Figure 3A,D-F,I). By contrast, ATLL cell lines were unaffected by sgRNAs targeting CCND1 or CCND3 (supplemental Figure 3A). These findings are consistent with the fact that ATLL cell lines had considerably higher levels of CCND2 protein than CCND1 or CCND3 (Figure 4H). Further, CCND2 mRNA levels were higher in biopsy samples from patients with ATLL than in ALK-positive anaplastic large-cell lymphoma (ALK+ALCL) biopsies and roughly equivalent to those in PTCL-NOS biopsies (Figure 4I). By contrast, CCND1 and CCND3 mRNA levels were lower in ATLL than in ALK+ALCL and PTCL-NOS. The toxicity of CCND2 knockout was efficiently reversed by ectopic expression of an sgRNA-resistant CCND2 coding region, but also by the CCND1 and CCND3 coding regions (Figure 4G; supplemental Figure 3J-K), indicating that 3 d-type cyclins have similar functions in these cells. Of note in this regard, knockout of CCND2 in ST1 cells led to an upregulation of CCND3, likely blunting the toxic effect of sgCCND2 in this cell line (supplemental Figure 3I).
The CDK4/6 inhibitor palbociclib inhibits ATLL proliferation and survival
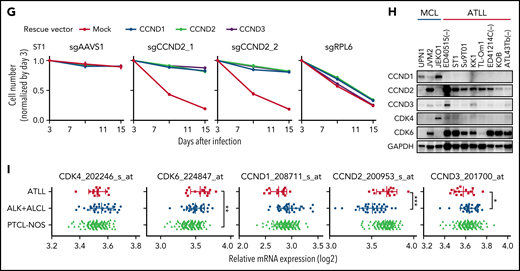
Given that CDK6/CCND2 controls cell cycle progression in ATLL and that CDK6 knockout induced apoptosis in ATLL cells, we explored the potential of CDK6 as a therapeutic target in ATLL. For this, we evaluated palbociclib, an inhibitor of CDK4 and CDK6 that has been FDA-approved for advanced breast cancer and has shown preliminary clinical activity in MCL.26 Treatment of 11 ATLL cell lines with palbociclib for 4 days substantially reduced the numbers of viable cells, with an average IC50 (1.776 μM) that was comparable to that observed in MCL cell lines (1.770 μM) (Figure 5A). Palbociclib treatment of ATLL lines induced a dose-dependent decrease in the phosphorylation of Rb (Figure 5B), a G1-phase cell cycle arrest, and a time-dependent increase of apoptosis (Figure 5C-E; supplemental Figure 4A-C).
CDK4/6 inhibitor palbociclib inhibits ATLL cell proliferation and survival. (A) Viable cells were measured by the MTS assay for the indicated ATLL, ALK+ALCL, and MCL cell lines treated with palbociclib for 4 days. (B) Immunoblot analysis of phosphorylated Rb protein in ST1 and Su9T01 cells treated with palbociclib for 24 hours is shown. (C) DNA content was analyzed in ST1 ATLL cells treated with 1 μM of palbociclib for 24 hours. (D) Apoptotic cells were detected by analyzing Annexin V and propidium iodide (PI) on flowcytometry on day 4 after palbociclib treatment with 1 μM. (E) The ratio of PI(-)Annexin V(+) cells/PI(-) cells was monitored over time. (F) IC50 values for palbociclib in TP53-altered and TP53-intact ATLL cell lines are shown. (G) Viable cells were measured by the MTS assay for the indicated ATLL cell lines treated with the indicated concentrations of palbociclib and APR-246 for 4 days. (H) Cells were infected with a lentivirus expressing sgTP53 together with GFP, followed by treatment with palbociclib at the indicated concentrations. Shown is the fraction of GFP-positive cells at indicated time points normalized to day 0. (I) Cells were infected with a lentivirus expressing sgTP53 or control sgAAVS1 together with GFP, then treated with 1 μM of palbociclib for 24 hours. DNA content was analyzed in the GFP-positive fraction (blue, the cells have sgRNA) and GFP-negative cell fraction (red, the cells don’t have sgRNA). (J-K) Cells were infected with a lentivirus that expresses sgTP53 or control sgAAVS1 together with puromycin-resistant gene. After puromycin selection of the transduced cells, cells were grown in the culture media without puromycin for several days to recover the cell condition well. Then the cells were treated with 1 μM of palbociclib, and apoptotic cells were detected by analyzing Annexin V and propidium iodide (PI) on flowcytometry over time (J). Representative density plot illustrating the apoptotic cells on day 6 after palbociclib treatment (K). (L) Immunoblot analysis of p21 and p27 proteins in sgCDK6-transduced ST1. (M) Immunoblot analysis of p21 and p27 proteins in palbociclib-treated ATLL cell lines. TP53 status for each line is shown below the cell line name. (N) KK1 cells were infected with a lentivirus that expresses sgCDK2 or control sgAAVS1 together with GFP, followed by treatment with palbociclib (0.25 μM). Shown is the fraction of GFP-positive cells over time relative to the GFP-positive fraction on day 0. (O) ST1 cells were infected with a lentivirus expressing sgTP53 or control sgAAVS1 together with puromycin-resistance gene. After puromycin selection, cells were infected with a lentivirus expressing sgCDK2 or control sgAAVS1 together with GFP, followed by treatment with palbociclib (0.25 μM). Shown is the fraction of GFP-positive cells over time relative to the GFP-positive fraction on day 0. Error bars represent the SEM of replicates (A,E-H,J,N-O). **P < .01.
CDK4/6 inhibitor palbociclib inhibits ATLL cell proliferation and survival. (A) Viable cells were measured by the MTS assay for the indicated ATLL, ALK+ALCL, and MCL cell lines treated with palbociclib for 4 days. (B) Immunoblot analysis of phosphorylated Rb protein in ST1 and Su9T01 cells treated with palbociclib for 24 hours is shown. (C) DNA content was analyzed in ST1 ATLL cells treated with 1 μM of palbociclib for 24 hours. (D) Apoptotic cells were detected by analyzing Annexin V and propidium iodide (PI) on flowcytometry on day 4 after palbociclib treatment with 1 μM. (E) The ratio of PI(-)Annexin V(+) cells/PI(-) cells was monitored over time. (F) IC50 values for palbociclib in TP53-altered and TP53-intact ATLL cell lines are shown. (G) Viable cells were measured by the MTS assay for the indicated ATLL cell lines treated with the indicated concentrations of palbociclib and APR-246 for 4 days. (H) Cells were infected with a lentivirus expressing sgTP53 together with GFP, followed by treatment with palbociclib at the indicated concentrations. Shown is the fraction of GFP-positive cells at indicated time points normalized to day 0. (I) Cells were infected with a lentivirus expressing sgTP53 or control sgAAVS1 together with GFP, then treated with 1 μM of palbociclib for 24 hours. DNA content was analyzed in the GFP-positive fraction (blue, the cells have sgRNA) and GFP-negative cell fraction (red, the cells don’t have sgRNA). (J-K) Cells were infected with a lentivirus that expresses sgTP53 or control sgAAVS1 together with puromycin-resistant gene. After puromycin selection of the transduced cells, cells were grown in the culture media without puromycin for several days to recover the cell condition well. Then the cells were treated with 1 μM of palbociclib, and apoptotic cells were detected by analyzing Annexin V and propidium iodide (PI) on flowcytometry over time (J). Representative density plot illustrating the apoptotic cells on day 6 after palbociclib treatment (K). (L) Immunoblot analysis of p21 and p27 proteins in sgCDK6-transduced ST1. (M) Immunoblot analysis of p21 and p27 proteins in palbociclib-treated ATLL cell lines. TP53 status for each line is shown below the cell line name. (N) KK1 cells were infected with a lentivirus that expresses sgCDK2 or control sgAAVS1 together with GFP, followed by treatment with palbociclib (0.25 μM). Shown is the fraction of GFP-positive cells over time relative to the GFP-positive fraction on day 0. (O) ST1 cells were infected with a lentivirus expressing sgTP53 or control sgAAVS1 together with puromycin-resistance gene. After puromycin selection, cells were infected with a lentivirus expressing sgCDK2 or control sgAAVS1 together with GFP, followed by treatment with palbociclib (0.25 μM). Shown is the fraction of GFP-positive cells over time relative to the GFP-positive fraction on day 0. Error bars represent the SEM of replicates (A,E-H,J,N-O). **P < .01.
The sensitivity of ATLL cell lines to palbociclib varied over a wide IC50 range (9 to 6500 nM), with some lines relatively insensitive to this drug. A previous study reported that TP53 mutation is associated with relative insensitivity to another CDK4/CDK6 inhibitor (abemaciclib) in various cancer types.27 Given that somatic mutation and genomic deletion in TP53 are frequent events in ATLL,3,28 we sequenced the TP53 exonic regions in 11 ATLL cell lines, revealing TP53 mutations in 4 lines [MT1, KK1, TL-Om1, and ATL43Tb(-)], WT TP53 in 4 lines [ED41214C(-), S1T, ST1, and KOB], and a TP53-null phenotype based on the lack of a detectable RT-PCR product [ED40515(-), ATL-55T(+), and Su9T01] (supplemental Table 3). ATLL cell lines with genetically altered TP53 (mutated and null phenotype) tended to be insensitive to palbociclib compared with cell lines harboring intact TP53 (P = .058) (Figure 5F).
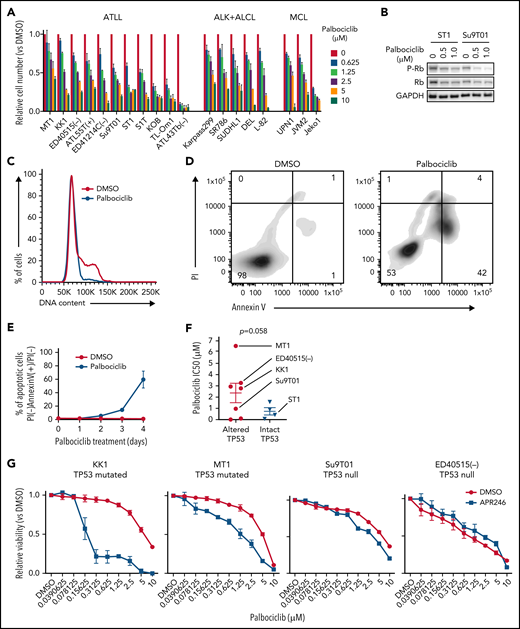
To functionally evaluate whether TP53 inactivation alters the sensitivity to palbociclib, ATLL cell lines carrying mutated TP53 were treated with APR-246 (PRIMA-1MET), a small molecule that can restore transcriptional activation by mutant TP53 isoforms.29 Indeed, APR-246 treatment rendered TP53-mutated ATLL cells sensitive to palbociclib but had no effect in TP53-null cells (Figure 5G). To directly link TP53 status to palbociclib sensitivity, we transduced ST1 ATLL cells, which are TP53 WT, with a lentivirus coexpressing an sgRNA targeting TP53 (sgTP53) and a GFP reporter gene, resulting in a cell pool in which roughly half of the transduced cells were GFP+. Over an 8-day treatment course with palbociclib, the GFP+/TP53–knockout population outgrew the GFP– population in a time- and dose-dependent manner (Figure 5H; supplemental Figure 4D). This TP53 knockout-mediated resistance to palbociclib was also evident in assays of cell proliferation, cell cycle progression, and apoptosis (Figure 5I-K). Taken together, these results indicate that loss-of-function TP53 genetic alterations confer insensitivity to palbociclib in ATLL.
TP53 prevents the G1/S cell cycle transition by inducing expression of p21 (CDKN1A), which binds and inhibits the activity of CDK2/Cyclin E.30,31 Notably, inactivation of CDK6 or palbociclib treatment of ST1 ATLL cells increased expression of p21 as well as another CDK2 inhibitor, p27, but this was not observed in ATLL lines with genetic inactivation of TP53 (Figure 5L-M), suggesting that the suppression of CDK2 might be necessary for an optimal response of ATLL cells to palbociclib. To test this hypothesis, we transduced TP53-mutated KK1 and TP53-null Su9T01 ATLL cells with a lentivirus coexpressing an sgRNA targeting CDK2 (sgCDK2) with a GFP reporter gene and monitored the ratio of the GFP+/sgCDK2+ cell population to the GFP–nontransduced population. The CDK2-knockout population decreased in abundance during palbociclib treatment in a time-dependent manner, but this was not the case in cells transduced with a control sgRNA (sgAAVS1) (Figure 5N; supplemental Figure 4E-F). In another test of this hypothesis, we stably inactivated TP53 in ST1 cells using a TP53 sgRNA or transduced the cells with a control sgRNA (sgAAVS1). After transduction of the TP53 knockout ST1 cells with the sgCDK2/GFP expression vector, we exposed the cells to palbociclib and observed a time-dependent decrease in the GFP+/sgCDK2+ population, an effect that did not occur in the control ST1 cells (Figure 5O). Taken together, these data demonstrate that optimal sensitivity to palbociclib in ATLL requires TP53 to inhibit CDK2 function, suggesting that monotherapy with this drug is likely to work preferentially against ATLL tumors with WT TP53.
mTORC1 is a targetable vulnerability in ATLL
To identify additional therapeutic targets in ATLL, we interrogated our whole-genome CRISPR screen data for dependencies of ATLL cells on signaling and regulatory pathways that have been associated with T-cell malignancy.3,17,32,33 We noted a dependency on MTOR and other components of the mTORC1 pathway (Figure 6A), which we validated by sgRNA-mediated knockout of MTOR in multiple ATLL lines (Figure 6B-C; supplemental Figure 5A). mTORC1 directly phosphorylates 4EBP1 and S6 kinase, which in turn phosphorylates ribosomal protein S6, thereby stimulating mRNA translation and mitochondrial activity/biogenesis.34 By immunoblot analysis, both 4EBP1 and S6 were phosphorylated in ST1 ATLL cells (Figure 6D).

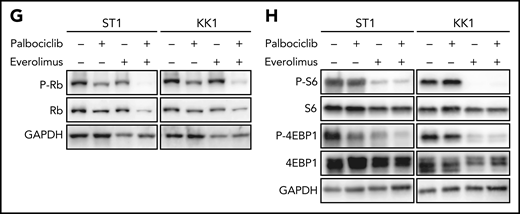
MTOR is a targetable vulnerability in ATLL, and the combination of palbociclib with mTORC1 inhibitors is synergistically toxic for ATLL cells. (A) Heatmap of gene essentialities identified in genome-wide CRISPR library screening. The genes were manually selected among genes in T-cell lymphoma-related molecular pathway. (B) Immunoblot analysis of MTOR proteins in sgMTOR-transduced ST1 cells. (C) The indicated cell lines were infected with a lentivirus expressing sgMTOR or control sgAAVS1 together with GFP. The GFP-positive cell fraction was monitored as in Figure 2A. (D) Immunoblot analysis of phosphorylated S6 and phosphorylated 4EBP1 proteins in sgTP53-transduced ST1 cells treated with palbociclib (1 μM) for 4 hours. (E) Upper panel: viable cells were measured by the MTS assay for the indicated ATLL cell lines treated with the indicated concentrations of palbociclib and everolimus for 4 days. Lower panel: a combination index is shown. Lower than 1.0 indicates a synergistic effect. (F) Upper panel: viable cells were measured by the MTS assay for sgTP53- or control sgAAVS1-transduced ST1 cells treated with the indicated concentrations of palbociclib and everolimus for 4 days. Lower panel: a combination index is shown. Lower than 1.0 indicates a synergistic effect. (G,H) Immunoblot analysis of phosphorylated Rb (G), phosphorylated S6 (H), and phosphorylated 4EBP1 proteins (H) in ST1 and KK1 cells treated with palbociclib (0.5 μM and 1.25 μM, respectively) and everolimus (2.5 μM) for 24 hours. Error bars represent the SEM of replicates (C,E-F).
MTOR is a targetable vulnerability in ATLL, and the combination of palbociclib with mTORC1 inhibitors is synergistically toxic for ATLL cells. (A) Heatmap of gene essentialities identified in genome-wide CRISPR library screening. The genes were manually selected among genes in T-cell lymphoma-related molecular pathway. (B) Immunoblot analysis of MTOR proteins in sgMTOR-transduced ST1 cells. (C) The indicated cell lines were infected with a lentivirus expressing sgMTOR or control sgAAVS1 together with GFP. The GFP-positive cell fraction was monitored as in Figure 2A. (D) Immunoblot analysis of phosphorylated S6 and phosphorylated 4EBP1 proteins in sgTP53-transduced ST1 cells treated with palbociclib (1 μM) for 4 hours. (E) Upper panel: viable cells were measured by the MTS assay for the indicated ATLL cell lines treated with the indicated concentrations of palbociclib and everolimus for 4 days. Lower panel: a combination index is shown. Lower than 1.0 indicates a synergistic effect. (F) Upper panel: viable cells were measured by the MTS assay for sgTP53- or control sgAAVS1-transduced ST1 cells treated with the indicated concentrations of palbociclib and everolimus for 4 days. Lower panel: a combination index is shown. Lower than 1.0 indicates a synergistic effect. (G,H) Immunoblot analysis of phosphorylated Rb (G), phosphorylated S6 (H), and phosphorylated 4EBP1 proteins (H) in ST1 and KK1 cells treated with palbociclib (0.5 μM and 1.25 μM, respectively) and everolimus (2.5 μM) for 24 hours. Error bars represent the SEM of replicates (C,E-F).
As the combinatorial benefit of CDK and mTORC inhibitors was previously reported in several cancer types,35 we hypothesized that partial pharmacological inhibition of the mTORC1 pathway might synergize with palbociclib in killing ATLL cells irrespective of TP53 status. We treated TP53 WT (ST1) and TP53 mutant (KK1) ATLL cells with a fixed concentration of the mTORC1 inhibitor (2.5 μM) or DMSO along with a range of concentrations of palbociclib. At all palbociclib concentrations, concurrent inhibition of mTORC1 with everolimus significantly reduced viable cell numbers compared with treatment with palbociclib alone (Figure 6E; supplemental Figure 5B). Of note, the 2 drugs synergized in both TP53 WT and TP53 mutant ATLL lines, as indicated by a combination index below 1 (see “Materials and methods”; Figure 6E; supplemental Figure 5B). As mentioned above, knockout of TP53 in ST1 cells rendered the cells relatively resistant to palbociclib alone, but combined treatment with everolimus resulted in synergistic toxicity (Figure 6F). These synergistic effects were also evident in experiments combining palbociclib and AZD8055, a dual mTORC1 and mTORC2 inhibitor (supplemental Figure 5C). Combined palbociclib/everolimus treatment decreased phosphorylation of Rb to a greater degree than observed with either agent alone (Figure 6G), as was also true for the combination of palbociclib and AZD8055 (supplemental Figure 5D). Phosphorylation of S6 and 4EBP1 was fully suppressed by everolimus or AZD8055, alone or in combination with palbociclib, as expected (Figure 6H; supplemental Figure 5E).
We next investigated the effect of inhibiting CDK6 and/or mTORC1 in primary ATLL patient samples. All patients had intact TP53 except for the presence of a common single-nucleotide polymorphism (P72R). Consistent with ATLL cell line data, palbociclib treatment inhibited the proliferation of primary ATLL cells in a dose-dependent manner (Figure 7A-B). Moreover, the combination of palbociclib with everolimus or AZD8055 inhibited cell proliferation to a greater degree in treatment with either agent alone in primary ATLL cells from 5 patients (Figure 7A-B). Notably, these treatments did not suppress the proliferation of normal bystander CD4 T cells, CD8 T cells, and monocytes except for mTORC1 inhibitor-treated B cells in PBMNC from ATLL patients (supplemental Figure 6A). Furthermore, cell proliferation of healthy donor-derived T cells was also not affected (supplemental Figure 6B-C). To explore the efficacy and tolerability of this combination in vivo, we used a mouse xenograft model created using the ATL43Tb(-) ATLL cell line. Treatment of xenografted mice with palbociclib or everolimus monotherapy inhibited tumor growth compared with vehicle control. Combined treatment with both drugs markedly inhibited tumor growth to a greater degree than either drug alone (Figure 7C-E). Of note, there was no significant difference in systemic toxicity among the 4 groups of mice during drug treatment, as judged by body weight (Figure 7F). These results were also confirmed by another xenograft model created using the Su9T01 ATLL cell line (Figure 7G-H; supplemental Figure 6D).
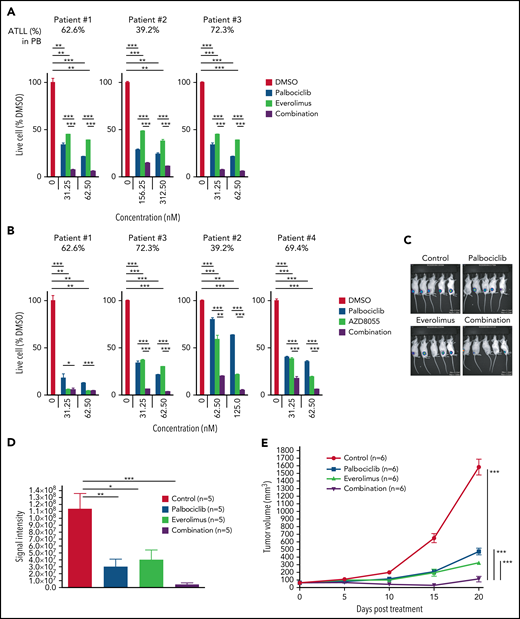
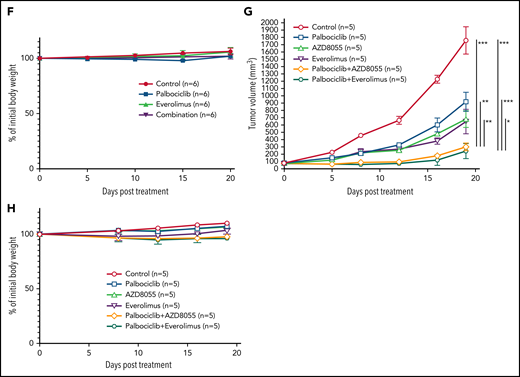
Combination with palbociclib and MTOR inhibitors is effective in patient samples in vitro and xenograft in vivo. (A-B) Viable primary ATLL cells were measured by the 3H-thymidine incorporation assay following treatment with palbociclib and everolimus (A) or AZD8055 (B) for 6 days. Count was normalized to DMSO-treated cells. (C-F) ATL43Tb(-) xenografts were treated with control, palbociclib (12.5 mg/kg body weight), everolimus (2.5 mg/kg body weight), or a combination of palbociclib and everolimus with same doses for 3 days per week for 3 weeks by intraperitoneal injection. (C) Representative IVIS imaging of the treated mice. (D) Quantification of tumor volumes obtained by bioluminescent signals using IVIS. (E) Tumor growth curves were obtained by caliper measurement in the tumor-bearing mice. (F) Normalized values of body weight of the treated mice. (G) Tumor growth curves measured by calipers in Su9T01 tumor-bearing mice. (H) Normalized body weight measurements of mice treated with indicated inhibitors in (G). Error bars represent the SEM of replicates (A-B,E-H). *P < .05, **P < .01, ***P < .001.
Combination with palbociclib and MTOR inhibitors is effective in patient samples in vitro and xenograft in vivo. (A-B) Viable primary ATLL cells were measured by the 3H-thymidine incorporation assay following treatment with palbociclib and everolimus (A) or AZD8055 (B) for 6 days. Count was normalized to DMSO-treated cells. (C-F) ATL43Tb(-) xenografts were treated with control, palbociclib (12.5 mg/kg body weight), everolimus (2.5 mg/kg body weight), or a combination of palbociclib and everolimus with same doses for 3 days per week for 3 weeks by intraperitoneal injection. (C) Representative IVIS imaging of the treated mice. (D) Quantification of tumor volumes obtained by bioluminescent signals using IVIS. (E) Tumor growth curves were obtained by caliper measurement in the tumor-bearing mice. (F) Normalized values of body weight of the treated mice. (G) Tumor growth curves measured by calipers in Su9T01 tumor-bearing mice. (H) Normalized body weight measurements of mice treated with indicated inhibitors in (G). Error bars represent the SEM of replicates (A-B,E-H). *P < .05, **P < .01, ***P < .001.
Discussion
To discover essential genes and potential new therapeutic targets in ATLL, we performed unbiased genome-wide CRISPR/Cas9 library screening. The resulting dataset provides a blueprint of ATLL biology, including some known dependencies as well as additional essential pathways that can be attacked using targeted agents that are clinically available. Our in-depth analysis of CDK6 as a molecular target in ATLL led us to discover a therapeutic synergy between the CDK6 inhibitor palbociclib and mTORC1 inhibitors, a combination that can now be tested in clinical trials.
Previous work identified BATF3 and IRF4 as essential transcription factors in ATLL,5 but the present work revealed that ATLL cells depend equally on the B-ZIP factor JUNB, which heterodimerizes with BATF3 to form an AP-1 DNA binding transcription factor. Importantly, JUNB also coimmunoprecipitated with HBZ, an essential HTLV1-encoded B-ZIP factor that drives expression of BATF3 and its extensive transcriptional network in ATLL,5 suggesting that JUNB is a key component of a feed-forward regulatory loop that sustains ATLL viability.5 Although transcription factors have been traditionally challenging as therapeutic targets, they are increasingly accessible as targets using PROTAC technology to target them for proteolytic degradation.36
The importance of the JAK/STAT signaling pathway in ATLL first became evident with the discovery of recurrent gain-of-function STAT3 mutations in 21.4% of ATLL cases.3 Unexpectedly, our CRISPR screens revealed that autocrine signaling by IL-22 or IL-10 may provide additional mechanisms by which STAT3 can be activated in ATLL. Recently, it was reported that transgenic expression of HBZ in a mouse model promotes autocrine IL-10 signaling in normal mouse T cells, which may be potentiated by the interaction of HBZ with STAT3.37 Thus, the essential transcription factor network in ATLL may intersect with JAK/STAT signaling, perhaps explaining the frequent acquisition of STAT3 mutations in ATLL. Therapeutic strategies to target the JAK/STAT pathway in ATLL will have to contend with the mechanistic diversity by which this pathway is engaged in ATLL. For instance, successful therapeutic strategies to attack JAK/STAT signaling in ATLL will need to consider which JAK family kinases are engaged in a particular ATLL tumor as well as the presence of gain-of-function STAT3 mutations, which likely render ATLL cells independent of upstream signals from JAK family kinases. In particular, ATLL lines with autocrine IL-22 signaling can activate both JAK1 and TYK2, potentially explaining why the JAK1/JAK2 inhibitor ruxolitinib was ineffective against these lines. These observations may also explain why clinical efficacy of ruxolitinib has been limited to the IL-2-dependent phase of ATLL.38,39
Our study revealed CDK6 as an attractive molecular target in ATLL. Loss of the endogenous CDK4/6 inhibitor CDKN2A (p16) is common in ATLL (24% to 26%),3,40 suggesting that deregulation of the G1/S cell cycle transition is deeply implicated in ATLL pathobiology. Pharmacological inhibition of CDK6 by palbociclib suppressed ATLL cell proliferation and survival, although the toxicity was suboptimal in some ATLL cells. We discovered that the resistance to palbociclib was at least in part due to the loss of TP53 function in a subset of ATLL lines. Somatic mutation in TP53 and genomic deletion of chromosome 17p13.1, harboring the TP53 locus, are frequent genetic events in ATLL, occurring in 17.8% and 26% of patients, respectively.3,28 Given the above, the TP53 status of ATLL tumors should be considered as a potential biomarker of response in future clinical trials of palbociclib in ATLL.
To overcome the insensitivity to palbociclib of ATLL lines with inactive TP53, we developed a rational combination of palbociclib with mTORC1 inhibitors. These agents were synergistically toxic in multiple ATLL models owing, in part, to concerted suppression of Rb phosphorylation. Importantly, this therapeutic combination not only induced cell cycle arrest but also triggered apoptosis in ATLL cells, irrespective of TP53 status. Treatment of mice bearing ATLL xenografts with palbociclib plus everolimus reduced tumor growth significantly and was apparently well tolerated, with no change in body weight. These findings lay a strong mechanistic foundation for clinical investigations of this combinatorial strategy for the treatment of ATLL.
Acknowledgments
The authors thank Y. Yamada, T. Hata, N. Arima, K. Sugamura for ATLL cell lines; J.D. Phelan and S. Roulland for discussions and comments; C. Yokoyama for technical assistance; and the hematologists and pathologists who were involved in North Japan Hematology Study Group for patient care. This research was supported by Japan Society for the Promotion of Science Grants-in-Aid for Scientific Research (JSPS KAKENHI) grants JP18K08313 and JP21H02775, a grant from SENSHIN Medical Research Foundation and Takeda Science Foundation (M.N.), the EU Transcan-2 consortium ERANET-PLL (implementation of [epi]genetic and metabolic networks in the targeting of T-cell prolymphocytic leukemia project) (E.R.), National Institutes of Health/National Cancer Institute grant CA100730 (P.L.G.), and by the Intramural Research Program of the National Institutes of Health, National Cancer Institute, Center for Cancer Research (L.M.S. and T.A.W.).
Authorship
Contribution: T.I. designed, performed experiments, analyzed data, and wrote the manuscript; S.K., J.S., A.D., S.D., and Y.L. designed, performed experiments, and analyzed data; B.B., M.N.P., Yandan Yang, and Y.H. performed experiments; E.B., D.W.H., H.G., T.E., T.Y., K.C.H., S.T., Y.M., Yibin Yang, S.H., and T.T. analyzed data; P.L.G., M.M., and H.H. synthesized reagents; T.A.W. and L.M.S. designed and supervised research; and M.N. designed, performed experiments, analyzed data, wrote the manuscript, and supervised research.
Conflict-of-interest disclosure: The authors declare no competing financial interests.
Correspondence: Masao Nakagawa, Department of Hematology, Hokkaido University Faculty of Medicine, Kita 15, Nishi 7, Kita-ku, Sapporo 060-8638, Japan; e-mail: nakagawam@med.hokudai.ac.jp.
The online version of this article contains a data supplement.
There is a Blood Commentary on this article in this issue.
The publication costs of this article were defrayed in part by page charge payment. Therefore, and solely to indicate this fact, this article is hereby marked “advertisement” in accordance with 18 USC section 1734.

This feature is available to Subscribers Only
Sign In or Create an Account Close Modal