

Key Points
RNF217 functions as a novel E3 ubiquitin ligase, mediating the degradation of the iron exporter FPN and regulating iron homeostasis.
Rnf217 expression is upregulated by Tet1-mediated demethylation; loss of Tet1 stabilizes FPN and impairs the response to iron overload.

Abstract
Ferroportin (FPN), the body’s sole iron exporter, is essential for maintaining systemic iron homeostasis. In response to either increased iron or inflammation, hepatocyte-secreted hepcidin binds to FPN, inducing its internalization and subsequent degradation. However, the E3 ubiquitin ligase that underlies FPN degradation has not been identified. Here, we report the identification and characterization of a novel mechanism involving the RNF217-mediated degradation of FPN. A combination of 2 different E3 screens revealed that the Rnf217 gene is a target of Tet1, mediating the ubiquitination and subsequent degradation of FPN. Interestingly, loss of Tet1 expression causes an accumulation of FPN and an impaired response to iron overload, manifested by increased iron accumulation in the liver together with decreased iron in the spleen and duodenum. Moreover, we found that the degradation and ubiquitination of FPN could be attenuated by mutating RNF217. Finally, using 2 conditional knockout mouse lines, we found that knocking out Rnf217 in macrophages increases splenic iron export by stabilizing FPN, whereas knocking out Rnf217 in intestinal cells appears to increase iron absorption. These findings suggest that the Tet1-RNF217-FPN axis regulates iron homeostasis, revealing new therapeutic targets for FPN-related diseases.
Introduction
Maintaining physiologically relevant iron concentrations is essential for proper cellular and tissue function. At the systemic level, iron homeostasis is tightly regulated by the absorption, utilization, and recycling of iron.1,2 Despite access to various sources of iron, nearly all mammalian cell types, including enterocytes, macrophages, hepatocytes, and erythrocytes, use the hepcidin–ferroportin axis to regulate iron homeostasis.3-6 In iron-exporting cells, the rate of iron export is determined by the level and function of the iron exporter ferroportin (FPN) at the plasma membrane, whereas the trafficking of FPN to the plasma membrane is regulated by vacuolar fusion protein MON1 homolog A.7 The expression of FPN is tightly regulated at the transcriptional, posttranscriptional, and posttranslational levels.8 In particular, the hormone hepcidin (encoded by the HAMP1 gene) controls cellular iron homeostasis and plasma iron concentrations by binding to FPN, inducing its internalization and subsequent degradation.9,10 Although hepcidin-induced FPN internalization is a well-characterized mechanism with respect to regulating iron homeostasis,11-13 the role of E3 ubiquitin ligases in FPN degradation is unknown.
Epigenetic modification via the methylation of genomic DNA is a robust mechanism for modulating chromatin structure, regulating gene expression, and maintaining cellular identity.14,15 Global DNA demethylation is mediated by the enzymatic activity of the ten-eleven translocation (TET) methylcytosine dioxygenase family of enzymes (Tet1 through Tet3), which convert 5-methylcytosine (5-mC) into 5-hydroxymethylcytosine (5-hmC).16 A growing body of evidence suggests that TET proteins play a critical role in a wide range of biological processes, including the differentiation of pluripotent stem cells, hematopoiesis, gastrulation, and zygotic epigenetic reprogramming.17 However, whether TET proteins, which themselves require iron for their activity, play a role in iron homeostasis has yet to be investigated.
Here, we report a novel epigenetic mechanism that regulates the stability of FPN via Tet1-mediated demethylation of the Rnf217 promoter; moreover, we characterize the functional role of this mechanism with respect to maintaining systemic iron homeostasis. Specifically, we found that Tet1 knockout mice accumulate FPN protein and have abnormal iron metabolism under high-iron conditions; moreover, these mice have reduced iron levels in the spleen and duodenum, but increased iron in the liver, compared with littermate controls. Several rounds of functional screening revealed that the Rnf217 gene is a substrate of Tet1 and encodes an E3 ubiquitin ligase that mediates the poly-ubiquitination and subsequent degradation of FPN. In addition, we found that knocking out Rnf217 selectively in macrophages increases FPN levels and facilitates iron depletion in splenic macrophages and bone marrow‒derived macrophages (BMDMs). Finally, we found that knocking out Rnf217 selectively in intestinal enterocytes may promote FPN-mediated iron absorption. Taken together, these findings suggest that RNF217 plays a key role in maintaining intracellular iron levels by stabilizing FPN; moreover, our in vivo data indicate that the Tet1-RNF217-FPN axis is important for maintaining iron homeostasis under high iron conditions.
Materials and methods
Animals
All animal experiments were approved by the Institutional Animal Care and Use Committee of Zhejiang University. Tet1flox/+ mice were obtained from Tongji University School of Medicine,18 backcrossed to the C57BL/6J background for more than 5 generations, and crossed with CMV-Cre transgenic mice to generate global Tet1 knockout (Tet1−/−) mice. The gene-targeting strategy used to conditionally excise exon 1 in the mouse Rnf217 gene is shown in supplemental Figure 8A, available on the Blood Web site, yielding the Rnf217flox allele (Shanghai Biomodel Organism, Shanghai, China). Heterozygous Rnf217flox/+ offspring were crossed with Lysm-Cre or Villin-Cre transgenic mice to generate macrophage-specific Rnf217 (Rnf217Lysm/Lysm) and intestinal enterocyte‒specific Rnf217 (Rnf217Villlin/Villin) knockout mice, respectively. Unless otherwise stated, the mice were fed a standard AIN-76A diet containing 50 mg iron/kg (Research Diets, Inc, New Brunswick, NJ). Age- and sex-matched control littermates were used in Figures 1-3, 4A-D,H-K, 6,7, and related supplemental Figures. For animal genotyping, genomic DNA was extracted from mouse tail biopsies using the Easy Tissue & Blood DNA Extraction Kit (Zhejiang Easy-Do Biotech Co, Ltd; #DR0301250) and analyzed using the primer pairs listed in supplemental Table 3.

Excess iron upregulates Tet1 and increases 5-hmC. (A) Heatmap showing the fold change in differentially expressed epigenetic regulators in the liver of wild-type C57B/6J mice analyzed using RNA-seq data (n = 3 mice per group). (B-D) RT-PCR analysis of Tet1 mRNA measured in the indicated tissues and cells of mice fed the indicated diets (for the liver and spleen, n = 5-6 mice per group; for enterocytes, n = 5-6 mice per group; for BMDMs, n = 3-4 mice per group). (C) Fold change in 5-hmC measured in BMDMs vs FAC concentration (n = 4-5 mice per group). (D) Example 5-hmC immunofluorescence images of untreated (Con) BMDMs and BMDMs treated with either FAC or desferrioxamine (DFO); scale bars, 100 μm (images are representative of 3 experiments per group). In panels B and C, groups labeled without a common letter were significantly different (P < .05; 1-way ANOVA).
Excess iron upregulates Tet1 and increases 5-hmC. (A) Heatmap showing the fold change in differentially expressed epigenetic regulators in the liver of wild-type C57B/6J mice analyzed using RNA-seq data (n = 3 mice per group). (B-D) RT-PCR analysis of Tet1 mRNA measured in the indicated tissues and cells of mice fed the indicated diets (for the liver and spleen, n = 5-6 mice per group; for enterocytes, n = 5-6 mice per group; for BMDMs, n = 3-4 mice per group). (C) Fold change in 5-hmC measured in BMDMs vs FAC concentration (n = 4-5 mice per group). (D) Example 5-hmC immunofluorescence images of untreated (Con) BMDMs and BMDMs treated with either FAC or desferrioxamine (DFO); scale bars, 100 μm (images are representative of 3 experiments per group). In panels B and C, groups labeled without a common letter were significantly different (P < .05; 1-way ANOVA).

Global loss of Tet1 causes an altered response to iron overload. (A) Serum iron levels and transferrin saturation (TS) were measured in HID-fed control (Tet1+/+) and Tet1−/− mice (n = 10-12 mice per group). (B) Nonheme iron concentration was measured in the indicated tissues of HID-fed Tet1+/+ and Tet1−/− mice (n = 8-12 mice per group). (C) Perls’ Prussian blue staining and quantification of iron measured in duodenum, spleen, and liver sections obtained from HID-fed Tet1+/+ and Tet1−/− mice (n = 4 mice per group). (D) RT-PCR analysis of hepatic Hamp1 mRNA in SID- and HID-fed Tet1+/+ and Tet1−/− mice (n = 6-7 mice per group). (E) RT-PCR analysis of Fpn, Dmt1, Tfr1, and Fth mRNA in the liver, enterocytes, and spleen of HID-fed Tet1+/+ and Tet1−/− mice (n = 6-8 mice per group). (F) FPN immunohistochemistry and quantification of duodenum, spleen, and liver sections obtained from HID-fed Tet1+/+ and Tet1−/− mice (n = 4 mice per group). Scale bars, 100 μm (C,F). *P < .05 and **P < .01 (Student t test).
Global loss of Tet1 causes an altered response to iron overload. (A) Serum iron levels and transferrin saturation (TS) were measured in HID-fed control (Tet1+/+) and Tet1−/− mice (n = 10-12 mice per group). (B) Nonheme iron concentration was measured in the indicated tissues of HID-fed Tet1+/+ and Tet1−/− mice (n = 8-12 mice per group). (C) Perls’ Prussian blue staining and quantification of iron measured in duodenum, spleen, and liver sections obtained from HID-fed Tet1+/+ and Tet1−/− mice (n = 4 mice per group). (D) RT-PCR analysis of hepatic Hamp1 mRNA in SID- and HID-fed Tet1+/+ and Tet1−/− mice (n = 6-7 mice per group). (E) RT-PCR analysis of Fpn, Dmt1, Tfr1, and Fth mRNA in the liver, enterocytes, and spleen of HID-fed Tet1+/+ and Tet1−/− mice (n = 6-8 mice per group). (F) FPN immunohistochemistry and quantification of duodenum, spleen, and liver sections obtained from HID-fed Tet1+/+ and Tet1−/− mice (n = 4 mice per group). Scale bars, 100 μm (C,F). *P < .05 and **P < .01 (Student t test).

Iron dextran injection facilitates iron export in Tet1−/− macrophages and increases FPN protein levels. (A) Hepatic and splenic nonheme iron concentration was measured in Tet1+/+ and Tet1−/− mice 7 days after a single intraperitoneal injection of iron dextran (250 µg/g body weight) (n = 6 mice per group). (B) RT-PCR analysis of hepatic Hamp1 mRNA in untreated and iron dextran‒injected Tet1+/+ and Tet1−/− mice (n = 4-6 mice per group). (C-D) RT-PCR analysis of Fpn, Dmt1, Tfr1, and Fth mRNA in the liver and spleen of iron dextran‒injected Tet1+/+ and Tet1−/− mice (n = 6-7 mice per group). (E) Western blot analysis and quantification of FPN protein measured in iron dextran‒injected Tet1+/+ and Tet1−/− mice (n = 7 mice per group). (F) Perls’ Prussian blue staining of iron and FPN immunohistochemical staining and (G) quantification of spleen sections obtained from Tet1+/+ and Tet1−/− mice 3 and 7 days after iron dextran injection (n = 4 mice per group). (H) Western blot analysis and quantification of FPN protein measured in the indicated BMDMs treated as indicated (n = 5 mice per group). Scale bars, 100 μm (F-G). *P < .05 and **P < .01 (Student t test).
Iron dextran injection facilitates iron export in Tet1−/− macrophages and increases FPN protein levels. (A) Hepatic and splenic nonheme iron concentration was measured in Tet1+/+ and Tet1−/− mice 7 days after a single intraperitoneal injection of iron dextran (250 µg/g body weight) (n = 6 mice per group). (B) RT-PCR analysis of hepatic Hamp1 mRNA in untreated and iron dextran‒injected Tet1+/+ and Tet1−/− mice (n = 4-6 mice per group). (C-D) RT-PCR analysis of Fpn, Dmt1, Tfr1, and Fth mRNA in the liver and spleen of iron dextran‒injected Tet1+/+ and Tet1−/− mice (n = 6-7 mice per group). (E) Western blot analysis and quantification of FPN protein measured in iron dextran‒injected Tet1+/+ and Tet1−/− mice (n = 7 mice per group). (F) Perls’ Prussian blue staining of iron and FPN immunohistochemical staining and (G) quantification of spleen sections obtained from Tet1+/+ and Tet1−/− mice 3 and 7 days after iron dextran injection (n = 4 mice per group). (H) Western blot analysis and quantification of FPN protein measured in the indicated BMDMs treated as indicated (n = 5 mice per group). Scale bars, 100 μm (F-G). *P < .05 and **P < .01 (Student t test).

Loss of Tet1 reduces FPN degradation and Rnf217 promoter demethylation. (A) BMDMs from Tet1+/+ and Tet1−/− mice were pretreated for 20 hours either with or without FAC (100 µM), then treated for 2 hours with CHX (75 µM) followed by hepcidin (0.5 µM, 5 hours); FPN was then measured using western blot analysis (n = 4 mice per group). (B) BMDMs from Tet1+/+ and Tet1−/− mice were pretreated with FAC (100 µM, 20 hours), then treated for 4 hours with CHX (75 µM), CHX + MG132 (10 µM), or CHX + CQ (100 µM), after which FPN was measured using western blot analysis (n = 4 mice per group). (C) BMDMs from Tet1+/+ and Tet1−/− mice were pretreated for 20 hours with FAC (100 µM), followed by MG132 (10 µM, 4.5 hours); the cells were then treated with hepcidin (1 mg/mL) for 0, 20, or 40 minutes. The cell lysates were immunoprecipitated using an anti-FPN antibody and immunoblotted using the FK2 anti-polyubiquitin antibody. The red asterisk labels the polyubiquitinated FPN (C). (D) Quantification of FPN ubiquitination (n = 4 per group). (E) Schematic diagram depicting the main steps in screening for potential E3 ligase genes. (F) Interaction between FPN and RNF217 measured using the Y2H screening, indicated by survival of the harboring colonies in SD-4 medium (lacking Ura, His, Leu, and Trp) and SD-2 medium (lacking Ura and His). AD, activation domain; BD, binding domain. (G) Co-IP assay to identify the putative interaction between Flag-tagged RNF217 and Myc-tagged FPN expressed in HEK293T cells. Red asterisks indicate the expected size of Myc-tagged FPN (top) and Flag-tagged RNF217 (bottom). (H) Relative mRNA levels of the indicated E3 ligase genes were measured in BMDMs (n = 4 per group) and the duodenum (n = 5-8 mice per group) of Tet1+/+ and Tet1−/− mice under iron-overload conditions. (I) Relative Rnf217 mRNA levels were measured in Tet1+/+ and Tet1−/− BMDMs treated for the indicated times with 100 µM FAC (n = 3 per group). (J) Relative levels of 5-hmC at 3 regions in the Rnf217 promoter in Tet1+/+ and Tet1−/− BMDMs treated with FAC (100 µM) (n = 4 per group). (K) Methylation in the Rnf217 promoter was measured using bisulfite Sanger sequencing in FAC-treated Tet1+/+ and Tet1−/− BMDMs (n = 4 per group). Closed circles indicate methylated sites. *P < .05 and **P < .01 (Student t test).
Loss of Tet1 reduces FPN degradation and Rnf217 promoter demethylation. (A) BMDMs from Tet1+/+ and Tet1−/− mice were pretreated for 20 hours either with or without FAC (100 µM), then treated for 2 hours with CHX (75 µM) followed by hepcidin (0.5 µM, 5 hours); FPN was then measured using western blot analysis (n = 4 mice per group). (B) BMDMs from Tet1+/+ and Tet1−/− mice were pretreated with FAC (100 µM, 20 hours), then treated for 4 hours with CHX (75 µM), CHX + MG132 (10 µM), or CHX + CQ (100 µM), after which FPN was measured using western blot analysis (n = 4 mice per group). (C) BMDMs from Tet1+/+ and Tet1−/− mice were pretreated for 20 hours with FAC (100 µM), followed by MG132 (10 µM, 4.5 hours); the cells were then treated with hepcidin (1 mg/mL) for 0, 20, or 40 minutes. The cell lysates were immunoprecipitated using an anti-FPN antibody and immunoblotted using the FK2 anti-polyubiquitin antibody. The red asterisk labels the polyubiquitinated FPN (C). (D) Quantification of FPN ubiquitination (n = 4 per group). (E) Schematic diagram depicting the main steps in screening for potential E3 ligase genes. (F) Interaction between FPN and RNF217 measured using the Y2H screening, indicated by survival of the harboring colonies in SD-4 medium (lacking Ura, His, Leu, and Trp) and SD-2 medium (lacking Ura and His). AD, activation domain; BD, binding domain. (G) Co-IP assay to identify the putative interaction between Flag-tagged RNF217 and Myc-tagged FPN expressed in HEK293T cells. Red asterisks indicate the expected size of Myc-tagged FPN (top) and Flag-tagged RNF217 (bottom). (H) Relative mRNA levels of the indicated E3 ligase genes were measured in BMDMs (n = 4 per group) and the duodenum (n = 5-8 mice per group) of Tet1+/+ and Tet1−/− mice under iron-overload conditions. (I) Relative Rnf217 mRNA levels were measured in Tet1+/+ and Tet1−/− BMDMs treated for the indicated times with 100 µM FAC (n = 3 per group). (J) Relative levels of 5-hmC at 3 regions in the Rnf217 promoter in Tet1+/+ and Tet1−/− BMDMs treated with FAC (100 µM) (n = 4 per group). (K) Methylation in the Rnf217 promoter was measured using bisulfite Sanger sequencing in FAC-treated Tet1+/+ and Tet1−/− BMDMs (n = 4 per group). Closed circles indicate methylated sites. *P < .05 and **P < .01 (Student t test).
Animal experiments
Where indicated, mice were fed a high-iron diet (HID) or standard-iron diet (SID) containing 8.3 g or 0.9 mg carbonyl iron/kg, respectively (Research Diets, Inc). For iron dextran treatment, 8-week-old mice received a single intraperitoneal injection of iron dextran (250 µg/g body weight) and were examined 3 or 7 days after injection.
For hepcidin treatment, 8-week-old male Rnf217flox/flox mice and Rnf217Lysm/Lysm mice were first fed a low-iron diet for 2 weeks to suppress endogenous hepcidin levels. The mice then received an intraperitoneal injection of hepcidin (20 µg in 0.1 mL saline; Peptides International), followed by a second injections 20 hours later.19-21 The control group received saline injections. The animals were euthanized 24 hours after the first injection, and the blood and spleen were collected for further analysis. For in vivo inflammation, 7-week-old male Rnf217flox/flox and Rnf217Lysm/Lysm mice received an intraperitoneal injection of lipopolysaccharide (LPS; 5 µg/g body weight; Sigma-Aldrich)22-25 ;12 hours after injection, the animals were euthanized and the spleen and blood were collected for analysis.5
Isolation of enterocytes from small intestinal villi
Mouse proximal small intestines (3 cm) were isolated immediately after blood collection, opened longitudinally, and washed with cold Hanks balanced salt solution (HBSS). The isolated intestinal tissue was cut into 3- to 5-mm pieces and incubated in 30 mM EDTA in HBSS for 20 minutes in an ice bath. The samples were then washed 3 times and incubated in HBSS for an additional 10 minutes at 4°C with gentle rotation to release enterocytes, then the crypt cells were removed by passing the samples through a 70-µm cell strainer and the lamina propria and the muscularis mucosa were discarded. After flushing the samples from the strainer with HBSS, the villus enterocytes were collected by centrifugation at 700 rpm for 5 minutes at 4°C. The isolated enterocytes were then lysed with TRIzol reagent (Invitrogen) or RIPA buffer for subsequent RNA or protein extraction, respectively.26-28
Immunoprecipitation and western blot analysis
Coimmunoprecipitation (co-IP) experiments were performed as previously described.29 Fpn was cloned into the pCMV-3Tag-9 vector with a Myc tag, and Rnf217 was cloned into the pCMV-3Tag-3A vector with a Flag tag. The constructs were coexpressed in HEK293T cells; 48 hours after transfection, the cell lysates were prepared and immunoprecipitated using protein A/G beads conjugated with Myc or Flag antibodies to pull-down FPN or RNF217, respectively, followed by immunoblotting with the other antibody. Immunoglobulin G was used as a negative control, and the input was used a positive control. Ubiquitinated FPN-Myc expressed in HEK293T cell lines and endogenous ubiquitinated FPN in BMDMs were measured as described previously.13 In brief, BMDMs and HEK293T cells were treated as indicated. Cell lysates were immunoprecipitated using an anti-FPN antibody and immunoblotted using the FK2 anti-poly-Ub antibody. Western blot analysis to detect FPN was performed as described previously.5 The following primary antibodies were used for the co-IP and western blot analysis: anti-Flag (1:1000; Cell Signaling Technology), anti-Myc (1:1000; Cell Signaling Technology), anti-Ferroportin (1:1000, Alpha Diagnostics), anti-Ub (1:1000; Enzo Life Sciences), anti-Ferritin Heavy Chain (1:1000; Abcam), and anti- GAPDH (1:10000; Bioworld).
Y2H screening
Yeast 2-hybrid (Y2H) screening was performed as previously described30,31 using human FPN as the bait protein. Both pDEST32-FPN and the human ORFeome library (pDEST22 backbone) were cotransformed into the yeast strain Mav203 (Thermo Fisher Scientific) to screen for candidate E3 ubiquitin ligases that target FPN. The binding of interacted fragments activates the expression of Gal4, a transcriptional activator required for the expression of genes encoding enzymes that use galactose; thus, an interaction between E3 ligase and FPN was indicated by colony formation on yeast SD-4 selection media lacking Leu, Trp, His, and Ura.32
RNA sequencing and DNA methylation analyses
Details of sequencing and methylation analyses can be found in supplemental Methods.
Statistical analyses
All summary data are presented as the mean ± standard error of the mean. All experiments were performed in triplicate, with at least 3 replicates in each experiment. The n values have been specified in related figure legends. Where indicated, groups were compared using the Student t test or 1-way analysis of variance (ANOVA) with Tukey’s post hoc test, and differences with a value of P < .05 were considered statistically significant. All statistical analyses were performed using the R software package.
Results
Increased Tet1 expression following high-iron stimulation induces global changes in gene methylation status
To address the functional significance of epigenetic modifications in iron homeostasis, we fed wild-type C57B/6J mice a SID or either a HID or a low-iron diet (LID) to induce systemic iron overload or deficiency, respectively. Whole-genome bisulfate sequencing was then performed in the livers of SID-, HID-, and LID-fed mice. After excluding the results that were not significant (P > .05), we found that the overall level of CpG methylation was significantly altered in the liver of HID-fed mice, specifically in the promoter regions (4% of the epigenetic changes), introns (42.3%), exons (9.4%), 5′ UTRs (8.1%), and 3′ UTRs (3.8%) (supplemental Figure 1A). Unexpectedly, the remaining 32.4% of changes induced by iron overload were at intergenic CpGs (defined as ≥5 kb from any known genes), possibly because of reactivation of DNA methylation–silenced retrotransposons in these intergenic regions.33,34 Previous DNA methylation analyses focused primarily on CpG islands, highly clustered groups of CpGs often located in promoter regions.35,36 To further examine the mechanism underlying these HID-induced methylation changes, we performed Gene Ontology analyses of the genes with methylation changes in their promoter regions and found a significant enrichment of genes implicated in transcriptional regulation and various developmental processes in the HID-fed mice compared with SID-fed mice (supplemental Figure 1B).
To identify the epigenetic regulators involved in iron metabolism, we then performed RNA-sequencing (RNA-seq) analysis to compare hepatic expression among the HID-, SID-, and LID-fed groups. We identified 10 epigenetic genes that were upregulated under high-iron conditions. Tet1, which encodes a member of the TET family of dioxygenases and induces DNA demethylation by catalyzing the oxidation of 5-mC, was 1 of 5 closely related genes that were significantly upregulated under high-iron conditions (Figure 1A). This upregulation of Tet1 in HID-fed mice was confirmed by performing reverse transcriptase polymerase chain reaction (RT-PCR) in several tissues that regulate iron metabolism, including the liver, enterocytes in small intestinal villi, and the spleen (Figure 1B); similarly, Tet1 was upregulated in BMDMs treated with ferric ammonium citrate (FAC) to induce iron overload (Figure 1B); in contrast, the other 4 upregulated genes (Alkbh1, Sirt5, Setd6, and Setd7) were upregulated in the liver of HID-fed mice, but the results varied in the other tissues and in BMDMs (supplemental Figure 1C-F). Moreover, the genes encoding the other 2 known TET proteins (Tet2 and Tet3) were not significantly upregulated in these tissues in HID-fed mice (supplemental Figure 1G-H), suggesting that Tet1 may have a privileged role in mediating iron overload in these tissues. Consistent with this role, treating BMDMs with FAC increased TET enzyme activity, measured as an increase in the demethylation product 5-hmC (Figure 1C-D). Taken together, these results indicate that iron overload induces global changes in DNA methylation mediated, at least in part, by Tet1.
Global Tet1 knockout mice have an altered response to iron overload
Next, we investigated the role of Tet1 in iron homeostasis using Tet1 knockout (Tet1−/−) mice. When fed either a SID or LID, Tet1−/− mice maintained normal serum iron and tissue nonheme iron levels (supplemental Figure 2A-D). In contrast, HID-fed Tet1−/− mice have disrupted iron metabolism, reflected by increased serum iron levels and increased transferrin saturation compared with HID-fed control (Tet1+/+) littermates (Figure 2A). In addition, HID-fed Tet1−/− mice developed an accumulation of nonheme iron in the liver, lungs, and pancreas, as well as decreased nonheme iron in the spleen (Figure 2B). Moreover, Perls’ Prussian blue staining and quantification analysis showed increased iron clustered in the liver periportal, as well as decreased iron in both the duodenum and spleen, of HID-fed Tet1−/− mice (Figure 2C), indicating that the accumulated hepatic iron in HID-fed Tet1−/− mice may be attributed to increased dietary iron intake.
This phenotype seen in HID-fed Tet1−/− mice is reminiscent of hereditary hemochromatosis (HH). Given that mouse models of HH have increased dietary iron absorption and iron efflux from macrophages,37,38 we measured expression of the Hamp1 gene, which encodes hepcidin, the principal trigger underlying altered iron metabolism in both patients with HH and mouse models of HH. We found increased hepatic Hamp1 expression in both HID-fed Tet1−/− mice and control littermates, with higher expression in the Tet1−/− mice because of hepatic iron loading (Figure 2D); this finding suggests that iron-regulating proteins and/or pathways other than hepcidin likely contribute to the impaired iron homeostasis in HID-fed Tet1−/− mice. We therefore measured the expression of other iron-related genes, including Tfr1, Dmt1, Fth, and Fpn (which encode transferrin receptor 1, divalent metal transporter 1, ferritin H, and ferroportin, respectively), in the enterocytes of small intestinal villi, spleen, and liver of HID-fed Tet1−/− mice and control littermates. We found that the changes in Tfr1, Dmt1, Fth, and Fpn expression were generally consistent with the altered iron distribution in the Tet1−/− mice, with the exception of no significant change in Fpn expression in the intestinal villus enterocytes (Figure 2E); in contrast, we found increased levels of FPN protein in the duodenum, spleen, and liver of HID-fed Tet1−/− mice compared with HID-fed control littermates (Figure 2F). The iron depletion in the duodenum of Tet1−/− mice appears to be associated with an accumulation of FPN at the basolateral side of the enterocytes, in contrast with the stronger apical FPN immunostaining in HID-fed control mice.39 Surprisingly, we found stronger staining of intracellular FPN in Tet1−/− mice, similar to mice homozygous for the C326S mutation in FPN,40 suggesting that FPN may be resistant to degradation in HID-fed Tet1−/− mice. Taken together, these data suggest that the loss of Tet1 may increase iron absorption from duodenum enterocytes and may increase the export of iron from macrophages into the plasma, possibly mediated by an accumulation of FPN protein.
Tet1−/− mice have decreased iron in their macrophages because of FPN accumulation
Given the prominent role that Tet1 plays in the response to iron overload, it is reasonable to speculate that Tet1−/− mice have altered iron recycling. To examine the role of Tet1 in iron recycling in macrophages, we used another mouse model of iron overload in which we injected mice with iron dextran. Following iron dextran injection, Tet1−/− mice showed lower levels of splenic nonheme iron compared with control littermates, as well as increased levels of nonheme iron in the liver, lungs, and pancreas (Figure 3A). Consistent with our findings observed in HID-fed Tet1−/− mice, iron dextran‒injected Tet1−/− mice also had increased hepatic Hamp1 expression compared with iron dextran‒injected control mice (Figure 3B); in contrast, Hamp1 messenger RNA (mRNA) levels were similar between untreated Tet1−/− mice and untreated controls (Figure 3B) because there was no significant difference in tissue or serum iron levels between these mice (supplemental Figure 2A-B). Moreover, decreased levels of hepatic Dmt1 and Tfr1 mRNA, as well as significantly increased splenic Tfr1 mRNA levels, were found in the iron dextran‒injected Tet1−/− mice, possibly because of compensatory mechanisms (Figure 3C-D). However, although hepatic Hamp1 expression was increased in iron dextran‒injected Tet1−/− mice (Figure 3B), these mice had increased levels of FPN protein in their splenic macrophages (Figure 3E), consistent with decreased dextran-derived iron in these macrophages. Moreover, although FPN accumulated in the liver of iron dextran‒treated Tet1−/− mice, we also found increased levels of SLC39A14 protein in the liver of these mice, which may partially account for the increase in hepatic iron (supplemental Figure 3A).41,42
In addition, compared with Tet1+/+ mice, Tet1−/− mice had significantly less splenic iron (measured using Perls’ Prussian blue staining) and increased splenic FPN protein (measured using immunohistochemistry) both 3 days and 7 days after iron dextran injection (Figure 3F-G), suggesting that the loss of Tet1 may facilitate iron export from macrophages via an increase in FPN protein levels. Next, we treated Tet1+/+ and Tet1−/− BMDMs with either FAC to induce iron overload or desferrioxamine to chelate iron and found that FAC treatment increased FPN protein levels in both Tet1+/+ and Tet1−/− BMDMs, with more FPN protein in FAC-treated Tet1−/− BMDMs compared with FAC-treated Tet1+/+ cells (Figure 3H), possibly contributed to reduced levels of FTH protein in the FAC-treated Tet1−/− BMDMs (Figure 3H). As expected, FAC treatment significantly increased Fpn mRNA levels in both Tet1+/+ and Tet1−/− BMDMs (supplemental Figure 3B), accompanied by compensatory changes in Fth, Ftl, Dmt1, and Tfr1 mRNA levels (supplemental Figure 3C-F), suggesting that transcription-independent regulation of FPN may contribute to the increased FPN protein levels in the absence of Tet1. Taken together, these results indicate that the global loss of Tet1 leads to an accumulation of FPN in the spleen, potentially increasing iron export from splenic macrophages.
RNF217 is a putative E3 ubiquitin ligase targeting the FPN protein
Although FPN expression is regulated at the transcriptional and translational levels by a variety of mechanisms, the functional activity of this transporter at the cell membrane is regulated predominantly at the posttranslational level by hepcidin.8 Our data support the notion that posttranslational changes may play a key role in iron overload‒sensitive Tet1−/− mice. We therefore explored the possible mechanisms by which FPN expression may be regulated by Tet1. Tet1+/+ and Tet1−/− BMDMs were treated with FAC to induce FPN expression, and the cells were treated with cycloheximide (CHX) to block translation and/or hepcidin to induce FPN degradation; we then measured FPN protein using western blot analysis. We found that FPN in FAC-treated Tet1+/+ BMDMs was reduced via a translation-independent process; hepcidin reduced FPN levels even further (Figure 4A; supplemental Figure 4A). To investigate the mechanism by which Tet1 mediates FPN degradation, we measured FPN protein levels in BMDMs treated with the proteasome inhibitor MG132 and the lysosome inhibitor chloroquine (CQ). We found that both inhibitors prevented the reduction in FPN levels, indicating that FPN may be degraded via both proteasomes and lysosomes in Tet1+/+ BMDMs; in contrast, proteasome-dependent degradation of FPN was diminished in Tet1−/− BMDMs (Figure 4B; supplemental Figure 4B).
To further test the role of Tet1 in FPN degradation, we measured ubiquitinated FPN in Tet1+/+ and Tet1−/− BMDMs treated with hepcidin in the presence of MG132. We found that hepcidin rapidly increased the levels of polyubiquitinated FPN in both Tet1+/+ and Tet1−/− BMDMs; however, at both time points, the levels of polyubiquitinated FPN were significantly lower in hepcidin-treated Tet1−/− BMDMs compared with hepcidin-treated Tet1+/+ BMDMs (Figure 4C-D). This reduction in FPN ubiquitination may explain, at least in part, the increased levels of FPN protein measured in Tet1−/− BMDMs.
To understand the mechanism underlying Tet1-dependent FPN regulation, we used a bidirectional strategy to screen for candidate E3 ubiquitin ligases that target FPN and are epigenetically regulated by Tet1 (Figure 4E). We first performed a Y2H screen to identify candidate E3 ubiquitin ligases that interact with FPN and therefore drive its ubiquitination.31,43 In this screen, we used FPN as the bait to screen FPN-interacting proteins in a complementary DNA library encoding >400 known E3 ubiquitin ligases, or their substrate-binding subunits, as previously described.30 Positive colonies were selected, revealing the prey vector expressing human RNF217 (Figure 4F), a putative E3 ubiquitin ligase that targets proteins containing a RING-in-between-RING (RBR) domain.44,45 To confirm the putative interaction between FPN and RNF217, we performed reciprocal co-IP experiments and found that Myc-tagged FPN and Flag-tagged RNF217 interact with each other when expressed in HEK293T cells (Figure 4G). Because of the transmembrane localization of FPN, it is prone to be detected under 37°C lysis conditions.5
In parallel with the Y2H screen, we also performed an E3 ligase screen using published RNA-seq data from Tet1 knockout systems,14,46-49 including Tet1−/− deficient cells and mice, identifying 22 differentially expressed E3 ligase genes that may undergo epigenetic regulation by Tet1 (supplemental Table 1). To examine whether these E3 ligase genes are regulated by Tet1 under iron-overload conditions, we measured the mRNA levels of these 22 genes in FAC-treated BMDMs and in the enterocytes of HID-fed mice. We found that 7 of these 22 genes were significantly downregulated in Tet1−/− BMDMs compared with Tet1+/+ BMDMs (Figure 4H, top). A similar expression screen in enterocytes taken from both HID-fed Tet1−/− mice and HID-fed control mice revealed 2 genes that were significantly downregulated in the Tet1−/− mice (Figure 4H, bottom). Interestingly, we found that 1 gene, Rnf217, was significantly downregulated both in the FAC-treated Tet1−/− BMDMs and in the enterocytes of HID-fed Tet1−/− mice.
The Rnf217 gene is demethylated by Tet1
We found that Rnf217 expression was significantly decreased in both untreated and FAC-treated Tet1−/− BMDMs (Figure 4I) and in the enterocytes of both SID-fed and HID-fed Tet1−/− mice (supplemental Figure 4C) compared with their respective Tet1+/+ groups, indicating that Rnf217 expression may be regulated by Tet1 both under physiological conditions and under iron-overload conditions. Furthermore, a methylation modification analysis revealed that the levels of 5-hmC (the product of Tet1-mediated oxidation of 5-mC) were significantly lower in 3 separate regions of the Rnf217 promoter in Tet1−/− BMDMs (Figure 4J) and enterocytes (supplemental Figure 4D). In addition, bisulfate sequencing confirmed that the Rnf217 promoter is considerably more methylated in Tet1−/− BMDMs compared with Tet1+/+ BMDMs (14.5% vs 2.5%, respectively; Figure 4K). Thus, the loss of Tet1 leads to increased methylation of the Rnf217 promoter, and the resulting downregulation of RNF217 expression may explain the increase in FPN protein levels in Tet1−/− cells.
RNF217 mediates the polyubiquitination and degradation of FPN
Next, we examined whether RNF217 can directly mediate the ubiquitination and subsequent degradation of FPN. We found that RNF217 facilitated the degradation of FPN protein in vitro, without significantly affecting either TFR1 or divalent metal transporter 1 (DMT1) protein levels (Figure 5A-B; supplemental Figure 5A-C), suggesting that RNF217 causes the specific degradation of FPN. Moreover, RNF217 increased the levels of polyubiquitinated FPN, regardless of whether the cells were treated with hepcidin (Figure 5C-D). We showed previously that both the lysosome and proteasome pathways contribute to FPN degradation. To examine the role of RNF217 in this process, we examined whether RNF217 induces the degradation of FPN in the presence MG132 and CQ. We found that both inhibitors reduced RNF217-mediated degradation of FPN, and cotreating cells with both inhibitors further increased FPN protein levels, suggesting that both pathways are involved in the RNF217-mediated degradation of FPN (supplemental Figure 5D). These results were supported by additional Lys-48- and Lys-63-linked polyubiquitin chains (ubiquitin mutation) experiments, showing specific inhibition of proteasomal degradation by K48R or only retained proteasomal degradation by K48, and K63R mutant ubiquitin proteins, which lack lysosome-mediated degradation, respectively (supplemental Figure 5E).
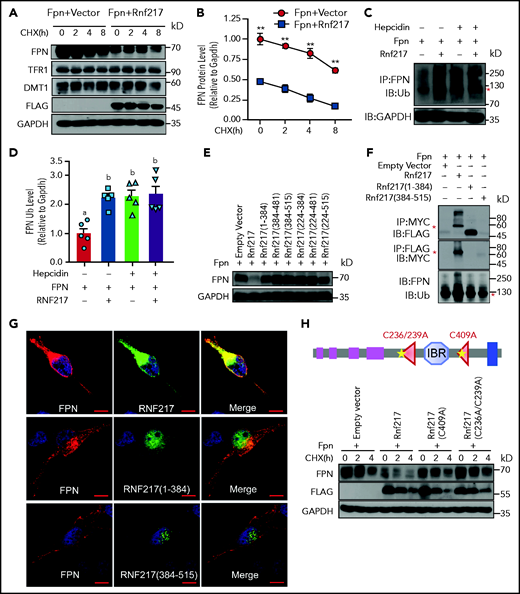
RNF217 interacts with FPN and promotes FPN degradation. HEK293T cells were transiently transfected with FPN-Myc together with either an empty vector or RNF217-Flag, and then treated with CHX (75 µM) for the indicated times; (A) FPN, TFR1, and DMT1 were then measured using western blot analysis; (B) the quantification of FPN (n = 4 experiments per group). (C-D) HEK293T cells were transiently transfected with FPN-Myc and HA-tagged ubiquitin (Ub) together with either an empty vector or RNF217-Flag, then treated either with or without hepcidin (1 mg/mL) for 30 minutes. Cell lysates were then immunoprecipitated using an anti-FPN antibody and blotted using an anti–poly-Ub antibody to detect ubiquitinated FPN. (C) Red asterisk labeles the polyubiquitinated FPN. (D) The quantification of ubiquitinated FPN (n = 5 experiments per group). (E) HEK293T cells were transfected with FPN-Myc together with either an empty vector or the indicated RNF217-Flag constructs; the cells were then treated with CHX (75 µM, 2 hours), and FPN was measured using western blot analysis (n = 3 experiments per group). (F) Top and center panels: HEK293T cells were transiently transfected with FPN-Myc together with either an empty vector or the indicated Flag-tagged RNF217 constructs, and cell lysates were immunoprecipitated using the respective antibodies to pull down FPN or RNF217, followed by western blot analysis (top 2 panels). Red asterisks indicate the expected size of Myc-tagged FPN and Flag-tagged RNF217. Bottom panel: duplicate samples were transfected with FPN-Myc and HA-ubiquitin together with either an empty vector or the indicated Flag-tagged RNF217 constructs; cell lysates were then immunoprecipitated using an anti-FPN antibody and immunoblotted using an anti–poly-Ub antibody to measure ubiquitinated FPN (n = 4 experiments per group). (G) Red asterisk labels the polyubiquitinated FPN. HeLa cells were transfected with FPN-Myc together with the indicated RNF217 constructs, treated with FAC (100 µM) for 12 hours, then analyzed using immunofluorescence. (H) HEK293T cells were cotransfected with FPN together with Flag-tagged wild-type, C409A, or C275/277A RNF217; the cells were treated with CHX (75 µM) for the indicated times, and FPN was measured using western blot analysis (n = 3 experiments per group). Scale bars, 10 μm (G). **P < .01 (Student t test). In panel D, groups labeled without a common letter were significantly different (P < .05; 1-way ANOVA).
RNF217 interacts with FPN and promotes FPN degradation. HEK293T cells were transiently transfected with FPN-Myc together with either an empty vector or RNF217-Flag, and then treated with CHX (75 µM) for the indicated times; (A) FPN, TFR1, and DMT1 were then measured using western blot analysis; (B) the quantification of FPN (n = 4 experiments per group). (C-D) HEK293T cells were transiently transfected with FPN-Myc and HA-tagged ubiquitin (Ub) together with either an empty vector or RNF217-Flag, then treated either with or without hepcidin (1 mg/mL) for 30 minutes. Cell lysates were then immunoprecipitated using an anti-FPN antibody and blotted using an anti–poly-Ub antibody to detect ubiquitinated FPN. (C) Red asterisk labeles the polyubiquitinated FPN. (D) The quantification of ubiquitinated FPN (n = 5 experiments per group). (E) HEK293T cells were transfected with FPN-Myc together with either an empty vector or the indicated RNF217-Flag constructs; the cells were then treated with CHX (75 µM, 2 hours), and FPN was measured using western blot analysis (n = 3 experiments per group). (F) Top and center panels: HEK293T cells were transiently transfected with FPN-Myc together with either an empty vector or the indicated Flag-tagged RNF217 constructs, and cell lysates were immunoprecipitated using the respective antibodies to pull down FPN or RNF217, followed by western blot analysis (top 2 panels). Red asterisks indicate the expected size of Myc-tagged FPN and Flag-tagged RNF217. Bottom panel: duplicate samples were transfected with FPN-Myc and HA-ubiquitin together with either an empty vector or the indicated Flag-tagged RNF217 constructs; cell lysates were then immunoprecipitated using an anti-FPN antibody and immunoblotted using an anti–poly-Ub antibody to measure ubiquitinated FPN (n = 4 experiments per group). (G) Red asterisk labels the polyubiquitinated FPN. HeLa cells were transfected with FPN-Myc together with the indicated RNF217 constructs, treated with FAC (100 µM) for 12 hours, then analyzed using immunofluorescence. (H) HEK293T cells were cotransfected with FPN together with Flag-tagged wild-type, C409A, or C275/277A RNF217; the cells were treated with CHX (75 µM) for the indicated times, and FPN was measured using western blot analysis (n = 3 experiments per group). Scale bars, 10 μm (G). **P < .01 (Student t test). In panel D, groups labeled without a common letter were significantly different (P < .05; 1-way ANOVA).
To test whether RNF217 specifically causes the degradation of FPN, we generated several truncated versions of RNF217 (supplemental Figure 6A) and found that coexpressing FPN with these truncated RNF217 domains failed to cause the degradation and ubiquitination of FPN (Figure 5E-F; supplemental Figure 6B-C). To confirm the putative interaction between FPN and RNF217, we performed co-IP and coimmunofluorescence experiments. We found that the truncated versions of RNF217 lacking the RBR domain did not colocalize or interact with FPN (Figure 5F-G; supplemental Figure 6D-F). Additional experiments revealed that expressing RNF217 containing either the C409A single mutation or the C236A/C239A double mutation (residues conserved in the RBR domain required for E3 ubiquitin ligase activity) had reduced degradation of FPN compared with cells expressing wild-type RNF217 (Figure 5H; supplemental Figure 7A), indicating that the E3 ubiquitin ligase activity of RNF217 is required for FPN degradation. Interestingly, however, using coimmunofluorescence we found that FPN interacts with the mutant RNF217 proteins similarly as wild-type RNF217 (supplemental Figure 7B), suggesting that the E3 ubiquitin ligase activity of RNF217 is not required for the interaction with FPN. Taken together, our in vitro results suggest that RNF217 could induce the degradation of FPN, whereas RNF217 mutants reduce the ubiquitination and degradation of FPN, indicating that RNF217 may play a role in iron homeostasis.
Macrophage-specific Rnf217 knockout mice have increased iron export and altered hepcidin-mediated FPN degradation
Next, we examined the role of RNF217 in regulating iron metabolism in macrophages by generating Rnf217Lysm/Lysm mice in which Rnf217 is knocked out selectively in macrophages; Rnf217flox/flox mice served as controls (supplemental Figure 8A-B). Nonheme iron analysis revealed a slight but not significant decrease of spleen iron in Rnf217Lysm/Lysm mice at 2 months of age; this difference reaches statistical significance in 5-month-old Rnf217Lysm/Lysm mice compared with age-matched controls, it seems that the reduction trend was more clearly realized with time (Figure 6A). The reduced iron levels in splenic macrophages obtained from 5-month-old Rnf217Lysm/Lysm mice was confirmed using Perls’ Prussian iron staining (supplemental Figure 8C) and the iron-sensitive fluorophore calcein (supplemental Figure 8D). Consistent with reduced degradation of FPN in these cells, we observed an accumulation of FPN protein in splenic sections taken from Rnf217Lysm/Lysm mice, but not in Rnf217flox/flox mice (Figure 6B; supplemental Figure 8E-F).

Rnf217−/− macrophages have FPN accumulation and impaired iron homeostasis. (A) Hepatic and splenic nonheme iron concentration was measured in 2- and 5-month-old Rnf217flox/flox and Rnf217Lysm/Lysm mice (n = 6-7 mice per group). (B) Spleen sections were prepared from 2- and 5-month-old Rnf217flox/flox and Rnf217Lysm/Lysm mice and immunostained for FPN (n = 4 mice per group). (C) Intracellular iron was measured in Calcein-AM‒loaded BMDMs treated as indicated (n = 3 mice per group). The indicated BMDMs were pretreated with FAC (100 µM, 12 hours) and then treated with CHX (75 µM) for the indicated times; (D) FPN was then measured using western blot analysis and (E) quantified (n = 3 mice per group). (F) Rnf217flox/flox and Rnf217Lysm/Lysm mice were fed a high-iron diet for 6 weeks followed by a low-iron diet for 5 weeks, after which hepatic and splenic nonheme iron concentration were measured (n = 6-8 mice per group). (G) Western blot analysis and (H) quantification of FPN measured in spleen samples prepared from Rnf217flox/flox and Rnf217Lysm/Lysm mice injected with either saline or hepcidin (n = 5-6 mice per group). (I) Serum iron was measured in Rnf217flox/flox and Rnf217Lysm/Lysm mice injected with either saline or hepcidin (n = 4-5 mice per group). (J) Serum iron was measured in Rnf217flox/flox and Rnf217Lysm/Lysm mice injected with either saline or LPS (5 µg/g body weight) (n = 3-5 mice per group). (K) Western blot analysis and (L) quantification of FPN measured in spleen samples prepared from Rnf217flox/flox and Rnf217Lysm/Lysm mice injected with either saline or LPS (n = 4-6 mice per group). Scale bars, 100 μm (B). *P < .05; **P < .01 (Student t test); in panels E, H-J, and L, groups labeled without a common letter were significantly different (P < .05; 1-way ANOVA).
Rnf217−/− macrophages have FPN accumulation and impaired iron homeostasis. (A) Hepatic and splenic nonheme iron concentration was measured in 2- and 5-month-old Rnf217flox/flox and Rnf217Lysm/Lysm mice (n = 6-7 mice per group). (B) Spleen sections were prepared from 2- and 5-month-old Rnf217flox/flox and Rnf217Lysm/Lysm mice and immunostained for FPN (n = 4 mice per group). (C) Intracellular iron was measured in Calcein-AM‒loaded BMDMs treated as indicated (n = 3 mice per group). The indicated BMDMs were pretreated with FAC (100 µM, 12 hours) and then treated with CHX (75 µM) for the indicated times; (D) FPN was then measured using western blot analysis and (E) quantified (n = 3 mice per group). (F) Rnf217flox/flox and Rnf217Lysm/Lysm mice were fed a high-iron diet for 6 weeks followed by a low-iron diet for 5 weeks, after which hepatic and splenic nonheme iron concentration were measured (n = 6-8 mice per group). (G) Western blot analysis and (H) quantification of FPN measured in spleen samples prepared from Rnf217flox/flox and Rnf217Lysm/Lysm mice injected with either saline or hepcidin (n = 5-6 mice per group). (I) Serum iron was measured in Rnf217flox/flox and Rnf217Lysm/Lysm mice injected with either saline or hepcidin (n = 4-5 mice per group). (J) Serum iron was measured in Rnf217flox/flox and Rnf217Lysm/Lysm mice injected with either saline or LPS (5 µg/g body weight) (n = 3-5 mice per group). (K) Western blot analysis and (L) quantification of FPN measured in spleen samples prepared from Rnf217flox/flox and Rnf217Lysm/Lysm mice injected with either saline or LPS (n = 4-6 mice per group). Scale bars, 100 μm (B). *P < .05; **P < .01 (Student t test); in panels E, H-J, and L, groups labeled without a common letter were significantly different (P < .05; 1-way ANOVA).
To test whether the accumulation of FPN in Rnf217Lysm/Lysm macrophages increases iron export, we obtained BMDMs from Rnf217flox/flox and Rnf217Lysm/Lysm mice and treated the cells with FAC for 24 hours to upregulate FPN, followed by fresh iron-free medium for an additional 12 hours to drive iron export. Although both the Rnf217flox/flox and Rnf217Lysm/Lysm BMDMs took up iron during FAC treatment, the Rnf217Lysm/Lysm BMDMs had increased iron export compared with Rnf217flox/flox cells, reflected by increased intracellular calcein staining (Figure 6C) and reduced levels of ferritin H protein (supplemental Figure 8G), possibly because of the reduced degradation of FPN in the Rnf217Lysm/Lysm cells compared with Rnf217flox/flox cells (Figure 6D-E; supplemental Figure 8H).
Next, we examined iron mobilization by feeding 3-week-old Rnf217flox/flox and Rnf217Lysm/Lysm mice a high-iron diet for 6 weeks, followed by a low-iron diet for 5 weeks. Rnf217Lysm/Lysm mice displayed a significant decrease in hepatic iron based on quantification of Perls' blue staining in the liver compared with those littermate controls, whereas the lower nonheme iron was more pronounced in the spleen of Rnf217Lysm/Lysm mice (Figure 6F; supplemental Figure 9A-B), suggesting that splenic macrophages are the primary target of FPN degradation.20,21 Consistent with this finding, we found that splenic FPN protein levels were higher in the Rnf217Lysm/Lysm mice (supplemental Figure 9C-D).
We also examined the ability of macrophages to recover from acute iron load by injecting iron dextran into 2-month-old Rnf217flox/flox and Rnf217Lysm/Lysm mice. We found that significantly less iron was retained in the spleen and splenic macrophages of Rnf217Lysm/Lysm mice compared with the Rnf217flox/flox mice (supplemental Figure 10A-D), resulting in higher serum iron and transferrin saturation levels in the iron dextran‒treated Rnf217Lysm/Lysm mice (supplemental Figure 10E) because of higher levels of FPN protein (supplemental Figure 10F-G). Taken together, these results indicate that RNF217 plays an important role in regulating iron export in macrophages by driving the degradation of FPN.
Given that hepcidin-induced internalization is essential for the degradation of FPN, particularly in macrophages,20 we examined the role of hepcidin-mediated, RNF217-dependent FPN degradation in vivo by injecting hepcidin into 10-week-old Rnf217flox/flox and Rnf217Lysm/Lysm mice that had been fed a LID for 2 weeks to suppress endogenous hepcidin.21 We found that 2 injections of hepcidin19 led to higher levels of both splenic FPN (Figure 6G-H; supplemental Figure 11A) and serum iron levels (Figure 6I) in the Rnf217Lysm/Lysm mice compared with hepcidin-treated Rnf217flox/flox mice, suggesting that hepcidin-mediated FPN degradation is at least partially dependent on RNF217. In addition, the LPS-induced hypoferremia50 in Rnf217flox/flox mice was less severe in Rnf217Lysm/Lysm mice (Figure 6J), in part because of reduced FPN degradation (Figure 6K-L; supplemental Figure 11B).
Loss of RNF217 in intestinal enterocytes can lead to increased FPN-mediated iron absorption
Next, we examined the role of RNF217 in regulating iron absorption by generating Rnf217Villin/Villin mice lacking Rnf217 expression selectively in intestinal enterocytes (Figure 7A). At 2 months of age, we saw no difference between control (Rnf217flox/flox) and Rnf217Villin/Villin mice with respect to nonheme iron levels in the liver or duodenum (Figure 7B-C). However, by 6 months of age, the Rnf217Villin/Villin mice had reduced nonheme iron levels in the duodenum (Figure 7B) and increased nonheme iron in the liver compared with age-matched Rnf217flox/flox mice (Figure 7B-C). The finding of impaired iron balance measured in 6-month-old Rnf217Villin/Villin mice was supported by increased iron staining (Figure 7D; supplemental Figure 12A) and increased FPN protein levels in the duodenal epithelium enterocytes of Rnf217Villin/Villin mice (Figure 7E; supplemental Figure 12B-D), suggesting that the loss of RNF217 selectively in intestinal enterocytes causes an accumulation of FPN in these cells, thereby may increasing iron absorption in Rnf217Villin/Villin mice. In addition, we found that nonheme iron accumulated in the Rnf217flox/flox mice by 6 months of age (Figure 7B,D); this finding may be attributed, at least in part, to increased hepcidin expression (measured as an increase in Hamp1 mRNA) in the liver (supplemental Figure 12E-F).
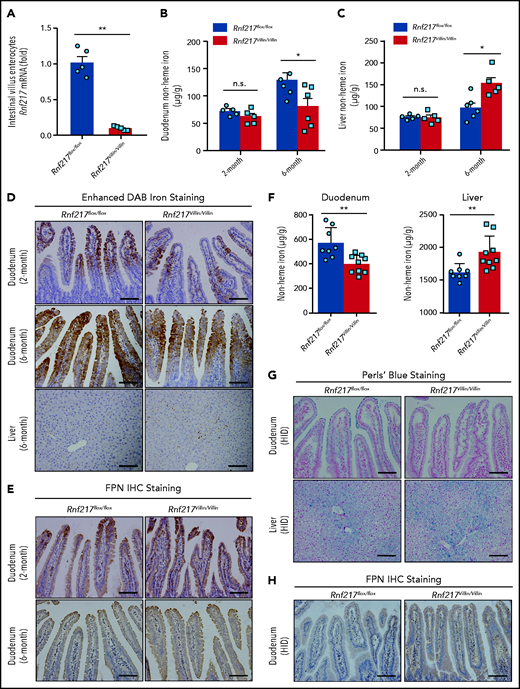
Intestinal enterocyte‒specific Rnf217 knockout mice have increased FPN in the intestinal epithelium and increased iron absorption. (A) RT-PCR analysis of Rnf217 mRNA measured in the small intestine of control (Rnf217flox/flox) and Rnf217Villin/Villin mice (n = 5 mice per group). (B-C) Hepatic and duodenum nonheme iron concentration was measured in 2-month-old and 6-month-old Rnf217flox/flox and Rnf217Villin/Villin mice (n = 5-6 mice per group). (D) Enhanced DAB iron staining of duodenum and liver sections, and (E) FPN immunostaining staining of duodenum sections obtained from Rnf217flox/flox and Rnf217Villin/Villin mice at the indicated ages (n = 4 mice per group). (F) Nonheme iron concentration was measured in the duodenum and liver of HID-fed Rnf217flox/flox and Rnf217Villin/Villin mice (n = 8-9 mice per group). (G) Perls’ Prussian blue staining of duodenum and liver sections, and (H) FPN immunostaining of duodenum sections obtained from HID-fed Rnf217flox/flox and Rnf217Villin/Villin mice (n = 4 mice per group). Scale bars, 100 μm (D-E,G,H). *P < .05 and **P < .01 (Student t test).
Intestinal enterocyte‒specific Rnf217 knockout mice have increased FPN in the intestinal epithelium and increased iron absorption. (A) RT-PCR analysis of Rnf217 mRNA measured in the small intestine of control (Rnf217flox/flox) and Rnf217Villin/Villin mice (n = 5 mice per group). (B-C) Hepatic and duodenum nonheme iron concentration was measured in 2-month-old and 6-month-old Rnf217flox/flox and Rnf217Villin/Villin mice (n = 5-6 mice per group). (D) Enhanced DAB iron staining of duodenum and liver sections, and (E) FPN immunostaining staining of duodenum sections obtained from Rnf217flox/flox and Rnf217Villin/Villin mice at the indicated ages (n = 4 mice per group). (F) Nonheme iron concentration was measured in the duodenum and liver of HID-fed Rnf217flox/flox and Rnf217Villin/Villin mice (n = 8-9 mice per group). (G) Perls’ Prussian blue staining of duodenum and liver sections, and (H) FPN immunostaining of duodenum sections obtained from HID-fed Rnf217flox/flox and Rnf217Villin/Villin mice (n = 4 mice per group). Scale bars, 100 μm (D-E,G,H). *P < .05 and **P < .01 (Student t test).
Last, we examined iron absorption by feeding Rnf217flox/flox and Rnf217Villin/Villin mice a HID. Although both groups accumulated iron in the liver, the Rnf217Villin/Villin mice had significantly lower iron in the duodenum and significantly higher iron in the liver compared with Rnf217flox/flox mice (Figure 7F-G; supplemental Figure 12G), as well as increased levels of FPN in the duodenal epithelium (Figure 7H; supplemental Figure 12H-I). These results indicate that RNF217 expressed in intestinal enterocytes may play an important role in FPN-mediated iron absorption, particularly under chronic iron-overload conditions.
Discussion
A growing body of evidence suggests that epigenetic regulation plays an important role in maintaining iron homeostasis. For example, we previously reported that the methyl-CpG‒binding protein MBD5 and the histone deacetylase 1 inhibitor entinostat (also known as MS-275) regulate iron metabolism via finely controlled mechanisms.51,52 Although studies indicate that histone acetylation/deacetylation plays a role in maintaining iron homeostasis, the precise role of DNA methylation in this process is poorly understood. Here, we report that the epigenetic modifier Tet1 modulates iron metabolism via the RNF217-mediated ubiquitination and subsequent degradation of the iron export protein FPN.
Using various mouse models of impaired iron homeostasis, we found that iron overload‒induced changes in global DNA methylation appear to be Tet1-dependent. Interestingly, loss of Tet1 alters the response to iron overload, but has no apparent effect under normal iron or low-iron conditions. Recent structural analyses revealed that the binding between hepcidin and FPN is coupled to iron binding, with iron significantly increasing the binding affinity, thus explaining why only iron-loaded FPN molecules are targeted for degradation.10,53 Moreover, our results obtained using BMDMs revealed that loss of Tet1 reduces the ubiquitination and degradation of FPN in the presence of hepcidin and iron. Together, these findings support the notion that hepcidin is primed for driving the degradation of FPN under high-iron conditions to maintain iron homeostasis, and this process is perturbed when Tet1 is knocked out, thus reducing FPN degradation.
In duodenal enterocytes, transcription of the Fpn gene, which encodes ferroportin, is regulated by iron and hypoxia to increase the absorption of dietary iron during iron deficiency and anemia.8,54 In this respect, it is somewhat surprising that all isoforms of the Fpn transcript are unaffected in the duodenal enterocytes of HID-fed Tet1−/− mice, given the presence of alternative transcriptional regulation for Fpn in the duodenum in the iron-deficient anemia and hypoxia.55,56 Nevertheless, under systemic iron-overload conditions, duodenal Fpn mRNA levels were reportedly unaffected in Hfe knockout mice, patients with hereditary hemochromatosis, and individuals with secondary iron overload,57-60 suggesting that a nontranscriptional mechanism may regulate FPN in our Tet1−/− mice.
Previous studies found that hepcidin binding induces the endocytosis and subsequent ubiquitination of FPN, followed by degradation predominantly in lysosomes.9,11-13 However, recent studies found that many metal transporters at the plasma membrane, including DMT1, SLC39A14, and SLC30A1, can also be degraded in proteasomes.61-63 Using lysosome and proteasome inhibitors, we found that FPN can be degraded in both lysosomes and proteasomes, suggesting that this essential iron exporter is regulated by multiple pathways. Interestingly, in the presence of Tet1, FPN can be degraded via both pathways; thus, the alternative lysosomal degradation pathway may at least partially account for the difference in ubiquitination levels measured between Tet1−/− and Tet1+/+ BMDMs.
Identifying the specific ubiquitin ligase that mediates the degradation of FPN has been an important question. Using a Y2H library, published RNA-seq data, and our co-IP and coimmunofluorescence data, we identified RNF217 as the putative E3 ubiquitin ligase that is epigenetically regulated by Tet1 and interacts with FPN. Specifically, we found that loss of Tet1 expression decreases the expression of RNF217, possibly because of reduced demethylation and subsequent transcriptional repression of the Rnf217 gene. RNF217 is a member of the RBR-containing family of proteins, and the RBR domain in RNF217 plays an important role in regulating the protein’s E3 ubiquitin ligase activity and physiological functions.45 Furthermore, mechanistic studies support the notion that RNF217-induced FPN degradation is mediated by both the proteasomal and lysosomal pathways, similar to other membrane transporters such as ZNT1 and DMT1.62,63 Notably, overexpressed FPN proteins may accumulate in the endoplasmic reticulum (ER), endosomes, or other organelles, whereas RNF217 may accumulate in the cytosol as in the plasma membrane. Nevertheless, whether FPN is ubiquitinated by RNF217 at the plasma membrane, ER, or endosome is an open question that warrants further investigation.
Our in vivo experiments involving conditional Rnf217 knockout mice provide additional evidence in support of the notion that the RNF217-mediated degradation of FPN plays an important role in maintaining iron homeostasis. Knocking out RNF217 selectively in macrophages delays the degradation of FPN, resulting in increased iron export. Unexpectedly, however, FPN was eventually degraded in these macrophages despite the near-complete loss of RNF217. One possible explanation for this finding may be that each E3 ubiquitin ligase can interact with several substrates to regulate a broad range of biological processes; alternatively, a given protein can be recognized by several E3 ubiquitin ligases.64,65 It is therefore possible that several E3 ubiquitin ligases are involved in regulating FPN.
An interesting finding from our study is that overexpressing RNF217 in vitro induced the robust polyubiquitination of FPN, even in the absence of hepcidin. Therefore, RNF217 may function independently of hepcidin-mediated FPN ubiquitination in vitro; alternatively, we cannot rule out the possibility that residual amounts of hepcidin present in the culture medium might have been sufficient to induce the internalization of FPN. In vivo, we found that injecting hepcidin in Rnf217Lysm/Lysm mice did not cause the same degree of FPN degradation compared with control (Rnf217flox/flox) mice, highlighting the functional importance of RNF217 in the hepcidin-FPN axis. In addition, our finding that LPS increases FPN degradation supports the notion that degradation of FPN via hepcidin and RNF217 plays a role in the setting of inflammation. Thus, the consequences of hepcidin-induced, RNF217-dependent FPN degradation on the inflammatory response warrant further investigation.
Knocking out Rnf217 selectively in intestinal enterocytes led to increased FPN levels in the duodenal epithelial cells and increased hepatic iron under chronic iron-overload conditions, providing a valuable new model for studying FPN-mediated iron absorption. Interestingly, we found that duodenal iron accumulated in these mice by 6 months of age, but not by 2 months of age. Consistent with a previous report,66 we found that the hepatic expression of Hamp1 (which encodes hepcidin) increases in mice with age, possibly explaining the accumulation of iron in older mice. The increased expression of hepatic Hamp1 measured in 6-month-old mice may further degrade FPN, resulting in iron accumulation in the duodenum, which could also partially explain the decreased levels of FPN degradation observed in 6-month-old Rnf217Villin/Villin mice. In addition, because duodenal nonheme iron levels were measured in the entire duodenum, much of the iron may been measured in cells other than in the epithelium, for example the lamina propria, in which case the iron might take some time to accumulate. Neither the Rnf217Lysm/Lysm nor the Rnf217Villin/Villin mice developed an unusual erythroid phenotype because their blood parameters were similar to their respective control littermates (supplemental Table 2), indicating that the regulation of FPN by RNF217 in both macrophages and intestinal enterocytes is not required for erythroid regulation, as the FPN expressed in erythrocytes may play a dominant role in their function.4,67
The absence of detectable differences in FPN protein in the absence of CHX in the ex vivo studies, as well as the absence of phenotypic changes without provocation/aging in Rnf217Lysm/Lysm and Rnf217Villin/Villin murine studies, suggesting compensatory mechanisms might coordinately regulate FPN expression. In addition, the possible compensatory regulation of FPN expression might also explain the otherwise unanticipated finding that the increase of Fpn mRNA in Tet1−/− BMDMs was attenuated compared with control macrophages. Taken together, these data support that FPN expression is tightly controlled at both transcriptional and/or the translational levels,8,68,69 which allow multiple and diverse physiological effects to influence FPN activity at its various sites of expression.
Although the LysM-Cre mice used in our study to generate Rnf217Lysm/Lysm offspring have been widely used for studying the biology of iron metabolism in macrophages,5,6,70-72 it is important to note that macrophages encompass a diverse population of phagocytic cell types, particularly with respect to the resident macrophage populations present in various tissues. Moreover, the expression of LysM-Cre can vary between different tissues,73 raising concerns with respect to the specificity and/or efficiency of this Cre line. Therefore, other Cre-expressing mouse lines targeting other types of macrophages such as the F4/80-Cre and CX3CR1-ER-Cre lines5,73 can be tested to determine the precise function of RNF217 in macrophages.
In summary, by functionally characterizing the role of RNF217 in mediating FPN degradation, we provide the first evidence that the Tet1-RNF217-FPN axis plays an important role in iron metabolism. These findings reveal a novel mechanism by which Tet1-mediated epigenetic modification of the Rnf217 promoter regulates iron homeostasis via the ubiquitination and subsequent degradation of the cellular iron exporter FPN, revealing new therapeutic targets for FPN-related diseases.
Acknowledgments
The authors thank Tomas Ganz, Elizabeta Nemeth, and Bo Qiao at University of California Los Angeles and Qiming Sun and Jianping Jin at Zhejiang University for valuable discussion and suggestions. The authors also thank Guoliang Xu and Yuqiang Ding at Fudan University for kindly providing Tet1flox/+ mice and Shenghui Hong at Laboratory Animal Center and Jinyao Chen at Facility for Histomorphology of Zhejiang University School of Medicine for technical support.
This work was supported by grants from the National Natural Science Foundation of China (31930057 [F.W.], 31970689 [J.M.], 32000820 [L.J.], 31701035 [H.W.], and 31701034 [Q.W.]), the National Key R&D Program of China (2018YFA0507802 [F.W.] and 2018YFA0507801 [J.M.]), and the China Postdoctoral Science Foundation (2019M662028 [L.J.]).
Authorship
Contribution: F.W., J.M., L.J., and J.W. and designed the study and wrote the manuscript; L.J., J.W., K.W., H.W., Q.W., P.N., and Y.Z. performed the experiments; Y.Y. and E.X. assisted with the animal experiments; Z.S. analyzed the RNA-sequencing and methylation data; C.Y. and R.H. preformed the yeast 2-hybrid screen; F.W. and J.M. obtained funding and supervised the project; and all authors approved the final version of the paper.
Conflict-of-interest disclosure: The authors declare no competing financial interests.
Correspondence: Fudi Wang, 866 Yuhangtang Rd, Zhejiang University School of Medicine, Hangzhou 310058, China; e-mail: fwang@zju.edu.cn; and Junxia Min, 866 Yuhangtang Rd, Zhejiang University School of Medicine, Hangzhou 310058, China; e-mail: junxiamin@zju.edu.cn.
Data are available under NCBI tracking system #21243344.
The online version of this article contains a data supplement.
There is a Blood Commentary on this article in this issue.
The publication costs of this article were defrayed in part by page charge payment. Therefore, and solely to indicate this fact, this article is hereby marked “advertisement” in accordance with 18 USC section 1734.

This feature is available to Subscribers Only
Sign In or Create an Account Close Modal