

Key Points
TET2 mutations are present in 28% of chronic NK-LGL leukemia, and TET2 promoter methylation is also detected.
TET2 and STAT3 mutated singly or comutated are associated with distinct patterns of cytopenias, as well as response to immunosuppressives.

Abstract
Chronic natural killer large granular lymphocyte (NK-LGL) leukemia, also referred to as chronic lymphoproliferative disorder of NK cells, is a rare disorder defined by prolonged expansion of clonal NK cells. Similar prevalence of STAT3 mutations in chronic T-LGL and NK-LGL leukemia is suggestive of common pathogenesis. We undertook whole-genome sequencing to identify mutations unique to NK-LGL leukemia. The results were analyzed to develop a resequencing panel that was applied to 58 patients. Phosphatidylinositol 3-kinase pathway gene mutations (PIK3CD/PIK3AP1) and TNFAIP3 mutations were seen in 5% and 10% of patients, respectively. TET2 was exceptional in that mutations were present in 16 (28%) of 58 patient samples, with evidence that TET2 mutations can be dominant and exclusive to the NK compartment. Reduced-representation bisulfite sequencing revealed that methylation patterns were significantly altered in TET2 mutant samples. The promoter of TET2 and that of PTPRD, a negative regulator of STAT3, were found to be methylated in additional cohort samples, largely confined to the TET2 mutant group. Mutations in STAT3 were observed in 19 (33%) of 58 patient samples, 7 of which had concurrent TET2 mutations. Thrombocytopenia and resistance to immunosuppressive agents were uniquely observed in those patients with only TET2 mutation (Games-Howell post hoc test, P = .0074; Fisher’s exact test, P = .00466). Patients with STAT3 mutation, inclusive of those with TET2 comutation, had lower hematocrit, hemoglobin, and absolute neutrophil count compared with STAT3 wild-type patients (Welch’s t test, P ≤ .015). We present the discovery of TET2 mutations in chronic NK-LGL leukemia and evidence that it identifies a unique molecular subtype.
Introduction
Chronic natural killer large granular lymphocyte (NK-LGL) leukemia is a rare disorder defined by prolonged expansion of clonal NK cells. It is recognized by the World Health Organization 2016 classification as the provisional entity chronic lymphoproliferative disorder of NK cells.1 The clinical presentation of persistent NK cell expansion and associated symptoms such as cytopenias are shared with chronic T-cell LGL (T-LGL) leukemia.2,3 The seminal discovery of STAT3 mutations in chronic T-LGL leukemia4 and subsequent similar findings in chronic NK-LGL leukemia have suggested a common pathogenesis.5 However, research in chronic NK-LGL leukemia has been biased in that discovery is often performed in patients having predominatly T-LGL leukemia. For example, in the largest published LGL leukemia exome study to date, encompassing 19 exomes, only 3 were of the chronic NK-LGL type.6
Multiple correlations have been observed between STAT3 mutations and clinical behavior in chronic T-LGL leukemia, including the association between Tyr640Phe STAT3 mutations and favorable response to methotrexate (MTX),7 and the association of STAT3 mutations with neutropenia.8 Recently, associations between STAT3 mutations and cytopenias have been reported in chronic NK-LGL leukemia in several studies involving small numbers of patients. These results include a statistically significant reduction in hemoglobin and a trend toward lower neutrophil count,9 and further evidence of linkage between neutropenia and STAT3 mutation.10,11 Here, we report clinical correlations from a cohort that exceeds the combined patient numbers of these previous studies.
The TET2 enzyme converts the modified base 5-methylcytosine to 5-hydroxymethylcytosine, a step in the cascade that demethylates DNA. TET2 is known to be recurrently mutated in childhood12 and adult13 acute myeloid leukemia (AML). TET2 mutation is also prevalent in myelodysplastic syndrome and nearly half of all cases of the related chronic myelomonocytic leukemia.14 Other than frank leukemia, TET2 is heavily involved in age-related clonal outgrowth in the hematopoietic compartment.15,,,-19 However, in this condition, TET2 mutation has been shown to have a distinct myeloid and B-cell proliferation bias with a complete lack of mutant-derived T-cell proliferations.20 It is possible this bias affects the common precursor of T and NK cells, which would dictate that TET2 mutations in these lymphoid cells are predominantly peripherally acquired. Mutations in TET2 or other methylation pathway enzymes in the lymphoid compartment are observed in peripheral T-cell lymphoma.21,22 In LGL leukemia, TET2 mutation has been reported in 1 patient of an Italian NK-LGL cohort23 and in 1 T-LGL leukemia case report.24
In the current study, we present results from what is currently the largest chronic NK-LGL mutation discovery cohort of 7 whole-genome sequencing (WGS) samples, with validation by targeted resequencing in 51 additional samples. We discovered that TET2 is frequently mutated and that the mutations change the methylation landscape in this cohort, highlighting that TET2 also has a major role in a lymphoid malignancy. STAT3 was also highly mutated in these samples, and thus this cohort provided a unique opportunity to compare and contrast the clinical features of the 2 most common mutations presently known in chronic NK-LGL leukemia.
Methods
Patient consent and clinical records
All studies were conducted under investigational review board–approved protocols for the LGL Leukemia Registry at the University of Virginia, with informed consent. All patients met ≥1 of the following criteria for a diagnosis of NK-LGL leukemia: >2 × 10⁹/L atypical lymphocytes; evidence of NK-cell invasion of the marrow; and aberrant NK populations detected by using flow cytometry. Concurrent myelodysplasia was not noted in any of the 48 available marrow biopsy specimens from our cohort of 58. Patient demographic characteristics, complete blood counts (CBCs), and flow cytometry data were collected from the time point nearest to when the sequenced sample was collected to ensure accurate correlation with mutation status. Treatments received at any point and their timing relative to sequencing and diagnosis were also collected. Strict criteria were used for treatment indication and response to therapy as previously described.7 Response was considered unevaluable if the treatment indication was not cytopenias. These data are presented together in supplemental Table 1 (available on the Blood Web site).
Patient sample purity assessment and enrichment
We set a target of 70% leukemic cells in each WGS sample so that we would be able to identify minor clones and subclones. Clinical flow results of NK cell markers for patients 1862, 1856, and 1791 (94% CD94+, 76% CD56+, and 93% CD56+, respectively) indicated these samples were suitable for WGS without enrichment. Patient 1444 was enriched with a negative selection NK Cell Isolation Kit (Stemcell Technologies). Patients 1511, 1820, and 1866 were positively selected with a CD94 antibody (clone REA113) on the AutoMACS system (Miltenyi Biotec), as were samples later used for Sanger sequencing validation of TET2 mutations. The CD94– population consisted of the remainder of the peripheral blood mononuclear cells not captured by the enrichment.
Whole-genome, targeted, and Sanger sequencing
We completed WGS of matched peripheral blood mononuclear cells (PBMCs) or enriched NK cells (described earlier) and saliva from 7 patients with NK-LGL at a target of 40× normal and 80× tumor coverage (Illumina). PBMC DNA was extracted by magnetic bead isolation (AnaPrep; BioChain Institute). Saliva DNA was prepared with Oragene OG-500 Colletion Kits (DNA Genotek). Mutect225 was used to identify somatic mutations in this cohort using COSMIC v7726 and dbSnp v138 as whitelist and blacklist, respectively (supplemental Table 2). Select genes with somatic mutations in this discovery cohort, and 3 from the literature, were used to develop a comprehensive targeted resequencing panel of all exon boundaries (supplemental Table 3). This panel was used to validate the variant calls from the 7 WGS samples and sequence an additional 28 paired PBMC/saliva samples and another 23 PBMC-only samples. Libraries were prepared by using the Ion AmpliSeq Kit for Chef DL8, and reads were collected on the Ion Torrent S5 (Thermo Fisher Scientific). An average per-sample target coverage of 1200× was achieved, with the lowest being 535×. Mutations were called and annotated by using the unmodified Ion Reporter 5.6 tumor/normal workflow for 35 paired samples and tumor-only for all 58 samples. Five recurrently mutated genes found in the tumor/normal pairs were thoroughly scrutinized in the tumor-only cohort. Lack of normal DNA in the tumor-only cohort necessitated that we apply computational filters to remove variants of germline origin before analysis. We removed calls that were not found in COSMIC (Catalogue of Somatic Mutations in Cancer), had poor alignments, or had a global allele frequency >0.1% in the 1000 Genomes Project27 version of 20161108.
The supplemental Methods present full details of Sanger sequencing and reduced-representation bisulfite sequencing (RRBS).
Statistical analysis
Statistical analyses for the clinical associations were performed by using R statistical software, version 3.5.3, with a significance level of α = 0.05. Welch’s t test was performed on CBC parameters for wild-type (WT) vs STAT3 mutant comparisons, as well as WT vs TET2 mutant comparisons. A 1-way analysis of variance (ANOVA) Welch’s test was performed on CBC parameters for WT, TET2-only, STAT3-only, and comutation groups. Games-Howell post hoc tests were performed on CBC parameters significant in the ANOVA (platelets). A Fisher’s exact test was used to assess if the binary ratio of parameter of interest is different for WT, TET2-only, STAT3-only, and comutation groups for non-CBC comparisons such as survival and treatment and followed by a pair-wise Fisher’s exact test when significant.
Results
WGS indicates significant clonality in all NK-LGL leukemia
Initial analysis of 7 whole-genome sequences using Mutect225 indicated a median 52 nonsilent mutations per sample, with the somatic nonsilent mutation burden varying from 25 to 101 mutations (supplemental Table 2). Based on HMMcopy28 analysis, 2 of the samples (1820 and 1862) exhibited evidence of large-scale somatic copy number variants (supplemental Figure 2). In most samples, the variant allele frequencies of nonsilent mutations clustered into those with high (∼0.5) and low values. The former indicated the presence of a major dominant clone (Figure 1). Of the genes with nonsilent mutations, 2 potential drivers present in dominant clones (STAT3 and TET2) were identified by taking the union of genes predicted by IntOGen29 and MutSigCV.30
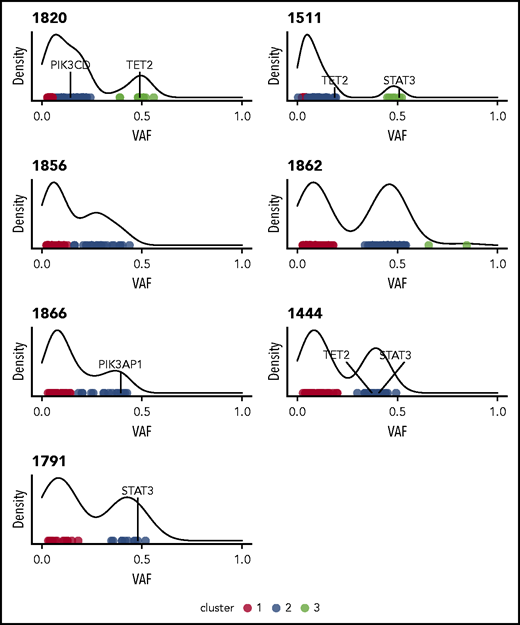
Clustering variants using variant allele frequencies (VAFs) of protein-altering variants reveals heterogeneity and clonality in NK-LGL leukemia. Density plots are shown for the 7 patients who underwent WGS. All indicate the presence of at least one major clone. Individual points are different somatic mutations, and color signifies cluster membership. Genes found to be recurrently mutated in this study are indicated.
Clustering variants using variant allele frequencies (VAFs) of protein-altering variants reveals heterogeneity and clonality in NK-LGL leukemia. Density plots are shown for the 7 patients who underwent WGS. All indicate the presence of at least one major clone. Individual points are different somatic mutations, and color signifies cluster membership. Genes found to be recurrently mutated in this study are indicated.
Validation of select mutations and paired sample resequencing
The WGS calls from the discovery cohort were validated by using a targeted resequencing panel of 39 genes. Mutations in 26 of the genes, including STAT3 and TET2, were validated in targeted resequencing of paired tumor/normal samples (Figure 2). In the 7 WGS sample validations and additional 28 paired samples, nonsilent mutations in TET2 were found in 9 (26%) of 35, often at frequencies that indicated presence in the majority of NK cells (supplemental Table 1). STAT3 mutations were seen in 12 (34%) of 35 samples in the paired analysis. Two of the 28 additional paired samples contained mutations in either TNFAIP3 or PIK3CD, which implicates the NF-κB and phosphatidylinositol 3-kinase (PI3K) pathways.
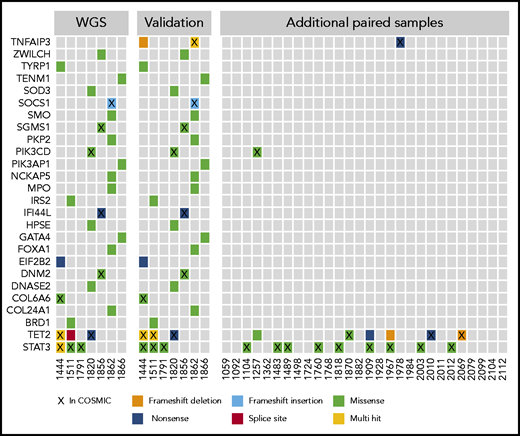
Select mutations found in WGS and targeted resequencing. The first panel shows the mutation distribution and type in the initial 7 whole-genome samples that were the basis for a targeted resequencing panel. The second panel shows validations on the targeted panel for the same samples and indicates good concordance between sequencing methods. The third panel shows additional paired PBMC/saliva samples sequenced by using the targeted panel, which identified few recurrently mutated genes in this cohort with the exceptions of TET2 and STAT3. Genes are listed by official gene symbol and samples by registry identification number.
Select mutations found in WGS and targeted resequencing. The first panel shows the mutation distribution and type in the initial 7 whole-genome samples that were the basis for a targeted resequencing panel. The second panel shows validations on the targeted panel for the same samples and indicates good concordance between sequencing methods. The third panel shows additional paired PBMC/saliva samples sequenced by using the targeted panel, which identified few recurrently mutated genes in this cohort with the exceptions of TET2 and STAT3. Genes are listed by official gene symbol and samples by registry identification number.
We further expanded our investigation to an additional 23 samples that lacked paired normal samples. We focused only on those genes recurrently mutated in the paired analysis: STAT3, TET2, TNFAIP3, and PI3K pathway genes PIK3CD and PIK3AP1. Examination of all 58 samples revealed that 3 (5%) of the samples were mutated in the PI3K pathway genes. Both mutations noted in PIK3CD are presumed to be activating as they have been observed as de novo germline mutations causing activated PI3 kinase delta syndrome,31 whereas the PIK3AP1 mutation has not been previously described. Twice as many (6 of 58 [10%]) samples were mutant in TNFAIP3.
Nonsilent mutation frequency for TET2, with mutations observed in 16 (28%) of all 58 samples, was consistent with that seen in paired samples alone (26%). The majority of TET2 mutations were truncations leading to loss of the catalytic domain (Figure 3A) and are rated pathogenic or likely pathogenic according to American College of Medical Genetics and Genomics/Association for Molecular Pathology standards as implemented in VarSome32 (supplemental Table 4). Point mutations were located in regions of the catalytic domain previously established to lead to loss of TET2 function when altered.33 Six patients had ≥2 TET2 mutations present in the same NK-LGL sample. Of note, we omitted the TET2 mutation Gln599Arg as it seemed to be a rare germline variant as opposed to its previously reported somatic nature in myeloid neoplasms34 (supplemental Figure 3). We also explored alternative mechanisms of TET2 loss in our NK-LGL cohort. We observed no known defective TET2 germline variants or TET2 copy number loss in whole-genome samples. However, methylation-specific polymerase chain reaction35 revealed TET2 promoter methylation predominantly in NK-LGLs with somatic TET2 mutation (9 of 14 [64.3%]) rather than those that were WT for TET2 (1 of 21 [4.8%]; Fisher’s exact test, P = .0002) (Figure 3B-D; supplemental Figure 4). Of those with TET2 mutations, promoter methylation was more prevalent in those samples with single (7 of 10 [70%]) rather than compound (2 of 6 [33.3%]) TET2 mutations, which suggests this may be a mechanism to silence expression of the WT allele.
![Spectrum of somatic mutations in STAT3 and TET2. (A) Lollipop plots indicate the frequency (y-axis) and placement within the amino acid sequence (x-axis) of detected mutations in STAT3 and TET2 proteins. (B-D) TET2 promoter methylation–specific polymerase chain reaction assay. Representative negative and positive patient sample results are indicated (B), and all gels are provided in supplemental Figure 4. (C) TET2 promoter methylation within mutational subgroups. (Fisher’s exact test, TET2 WT vs TET2 Mutant [Mut] [all samples], P = .0002; WT vs TET2 Mut, P = .0022). (D) TET2 promoter methylation of all TET2 Mut samples divided into those with ≥1 mutation. Fisher’s exact test, not significant, P = .3024). (E) Representative Sanger sequencing from isolated CD94+ and CD94– fractions showing that TET2 mutations are exclusively detected in the C94+ NK fraction. Co-Mut, comutation.](https://ash.silverchair-cdn.com/ash/content_public/journal/blood/138/8/10.1182_blood.2020005831/5/m_bloodbld2020005831f3.png?Expires=1767700138&Signature=s9261jlxuF6Mmn72kamku26c~hBlVQYd-3vh8KDFCF2wc7hZ4iIhuK9amJVk00xo2iil76qDAnJxwPkdOk-9aiZsQqmK38TaPcetsl2X8rtDZMMc536KrRpDSEgXxr6l0GuJoIXi0bnjZOe5NgmbstUEfELXaXoA57HmpfP7EOXa42XVqjMh2iMyn96-HNw7EYoMJ13ElIaBGjlxvc6QACzJYPQTvcGeeaqTMBarvDPMzNHEoaMaD-iy9~K~wff3ua2BWtxoZzZDX1wCzvldY5NgR8cuNcrBwQxi015e9y-44ox-ccPR9cBDEFUnP8Yre-qG4suAIw3T9uI0EzP-Cw__&Key-Pair-Id=APKAIE5G5CRDK6RD3PGA)
Spectrum of somatic mutations in STAT3 and TET2. (A) Lollipop plots indicate the frequency (y-axis) and placement within the amino acid sequence (x-axis) of detected mutations in STAT3 and TET2 proteins. (B-D) TET2 promoter methylation–specific polymerase chain reaction assay. Representative negative and positive patient sample results are indicated (B), and all gels are provided in supplemental Figure 4. (C) TET2 promoter methylation within mutational subgroups. (Fisher’s exact test, TET2 WT vs TET2 Mutant [Mut] [all samples], P = .0002; WT vs TET2 Mut, P = .0022). (D) TET2 promoter methylation of all TET2 Mut samples divided into those with ≥1 mutation. Fisher’s exact test, not significant, P = .3024). (E) Representative Sanger sequencing from isolated CD94+ and CD94– fractions showing that TET2 mutations are exclusively detected in the C94+ NK fraction. Co-Mut, comutation.
Spectrum of somatic mutations in STAT3 and TET2. (A) Lollipop plots indicate the frequency (y-axis) and placement within the amino acid sequence (x-axis) of detected mutations in STAT3 and TET2 proteins. (B-D) TET2 promoter methylation–specific polymerase chain reaction assay. Representative negative and positive patient sample results are indicated (B), and all gels are provided in supplemental Figure 4. (C) TET2 promoter methylation within mutational subgroups. (Fisher’s exact test, TET2 WT vs TET2 Mutant [Mut] [all samples], P = .0002; WT vs TET2 Mut, P = .0022). (D) TET2 promoter methylation of all TET2 Mut samples divided into those with ≥1 mutation. Fisher’s exact test, not significant, P = .3024). (E) Representative Sanger sequencing from isolated CD94+ and CD94– fractions showing that TET2 mutations are exclusively detected in the C94+ NK fraction. Co-Mut, comutation.
STAT3 was mutated in 19 (33%) of 58 samples, and these were predominantly missense mutations localized to the SH2 domain, which have been previously shown to increase STAT3 activity4 (Figure 3A). Of 7 samples with mutations in both STAT3 and TET2, mutation frequencies suggested 4 (1257, 1444, 1507, and 1909) to be in the same clone, whereas the frequencies differed substantially for 3 (1001, 1511, and 1967), suggesting they are present in different clonal populations. Mutation type and allele frequency for STAT3, TET2, TNFAIP3, PIK3CD, and PIK3AP1 are listed in supplemental Table 1 with clinical correlates.
Additional evidence that TET2 mutations are present in the NK compartment
Samples 1444, 1511, and 1820 were enriched for NK cells before WGS and found to be TET2 mutant. We took this as preliminary evidence that mutations were indeed in the NK compartment. To validate this, NK+ and NK– fractions were isolated from patient 1511 and five additional patients, which achieved at least 84% CD94+CD8– cells in the NK+ fraction. Nine mutations in 6 samples (3 samples had 2 mutations) were then tested by Sanger sequencing of TET2 (examples are given in Figure 3E, with full results in supplemental Figure 1). All 6 patients tested by using Sanger sequencing had ≥1 TET2 mutation present only in the NK+ cell compartment, including sample 1511, which had 2. Two patients, 1644 and 1967, had second TET2 mutations that were more pronounced in the NK+ vs NK– sample. One of these, Glu1268Ter in 1967, was also found in the patient’s saliva at an allele frequency of 16%. This finding could indicate the presence of the mutation in neutrophils36 and a cooccurring myeloid disorder or clonal hematopoiesis, but this patient’s marrow morphology was unremarkable. No other saliva samples showed the presence of mutations in TET2, STAT3, TNFAIP3, or PI3K genes. Between next-generation and Sanger sequencing, all 8 patients with material available for enrichment exhibited ≥1 TET2 mutation solely in the NK compartment.
TET2 mutant NK-LGL leukemia displays altered global methylation
The enzyme encoded by TET2 catalyzes a step in the demethylation of DNA; we therefore performed RRBS to ascertain the methylation changes in patient samples relative to TET2 mutational status. Leukemic samples were a subset of those fully characterized by WGS. Principal component analysis of the data showed that samples with mutations in TET2 exhibited significant separation from the other NK-LGL samples and normal NK-cell control samples (Figure 4A). Less separation was seen for mutant sample 1511, which may be explained by the fact that the TET2 mutation was observed in the minor clone for this sample (Figure 1). In comparisons between leukemic samples and normal NK cells, nearly 5 times more differentially methylated regions were observed in TET2 mutant samples (Figure 4B). This finding suggests that the mutations identified are associated with disrupted TET2 function.
![RRBS assessment of changes in DNA methylation in NK-LGL patient samples compared with normal NK cells. (A) RRBS was used to assess DNA methylation in the same highly pure leukemic samples used for WGS (TET2 mutant [Mut], n = 3; TET2 WT, n = 3) compared with 5 purified NK cell samples from normal donors (Normal). Principal component analysis used high-variance cytosine-phosphate-guanine sites at the 0.9 percentile of the interquartile range. Number of data points = 239 696. (B) Comparison of number of hypermethylated (Hyper) and hypomethylated (Hypo) differentially methylated regions of TET2 Mut and TET WT leukemic samples vs normal NK cells. (C) Distribution and quartiles of the amount of individual cytosine methylation within promoters of negative regulators of STAT3 in which 1 = 100% methylated. (D) Representative PTRD promoter methylation–specific polymerase chain reaction, with all gels provided in supplemental Figure 5. (E) PTPRD promoter methylation within mutation subgroups (Fisher’s exact test, TET2 WT vs TET2 Mut [all samples] not significant, P = .0772; WT vs TET2 Mut, P = .0474. Co-Mut, comutation; NA, not applicable; PC, principal component.](https://ash.silverchair-cdn.com/ash/content_public/journal/blood/138/8/10.1182_blood.2020005831/5/m_bloodbld2020005831f4.png?Expires=1767700138&Signature=hkPDdikg6sORDJn0VXp4T0pHucavp2rA-209uYc7Trr7tA6AGjyWaEK~JcYmjHB~5JpYaSSyqnJ7EKKq47~NSQHbUoDdbrYAsq82w0UoBI2R4a1FFBmqKxPN2-RqFC2GcCy~3xvsqF4Ez5FrsUfxW~L3nwr153T8BtEEFIgUa1S6iY2G00zcYXPjkYXzsdspOHVaL8qvpW0hWf-QGVhPC9FxfChGeAvwHQj4~pJIBEhGZqTg3nd4Y-GUCXAkJnYT8NXi98wzX3PVs1MRktrQ4EbjPb3xKluk0w7VWXkEO47alnTvV1sAyIzCkJmDKvBi57f7NNabJodF~uYhBUqDLw__&Key-Pair-Id=APKAIE5G5CRDK6RD3PGA)
RRBS assessment of changes in DNA methylation in NK-LGL patient samples compared with normal NK cells. (A) RRBS was used to assess DNA methylation in the same highly pure leukemic samples used for WGS (TET2 mutant [Mut], n = 3; TET2 WT, n = 3) compared with 5 purified NK cell samples from normal donors (Normal). Principal component analysis used high-variance cytosine-phosphate-guanine sites at the 0.9 percentile of the interquartile range. Number of data points = 239 696. (B) Comparison of number of hypermethylated (Hyper) and hypomethylated (Hypo) differentially methylated regions of TET2 Mut and TET WT leukemic samples vs normal NK cells. (C) Distribution and quartiles of the amount of individual cytosine methylation within promoters of negative regulators of STAT3 in which 1 = 100% methylated. (D) Representative PTRD promoter methylation–specific polymerase chain reaction, with all gels provided in supplemental Figure 5. (E) PTPRD promoter methylation within mutation subgroups (Fisher’s exact test, TET2 WT vs TET2 Mut [all samples] not significant, P = .0772; WT vs TET2 Mut, P = .0474. Co-Mut, comutation; NA, not applicable; PC, principal component.
RRBS assessment of changes in DNA methylation in NK-LGL patient samples compared with normal NK cells. (A) RRBS was used to assess DNA methylation in the same highly pure leukemic samples used for WGS (TET2 mutant [Mut], n = 3; TET2 WT, n = 3) compared with 5 purified NK cell samples from normal donors (Normal). Principal component analysis used high-variance cytosine-phosphate-guanine sites at the 0.9 percentile of the interquartile range. Number of data points = 239 696. (B) Comparison of number of hypermethylated (Hyper) and hypomethylated (Hypo) differentially methylated regions of TET2 Mut and TET WT leukemic samples vs normal NK cells. (C) Distribution and quartiles of the amount of individual cytosine methylation within promoters of negative regulators of STAT3 in which 1 = 100% methylated. (D) Representative PTRD promoter methylation–specific polymerase chain reaction, with all gels provided in supplemental Figure 5. (E) PTPRD promoter methylation within mutation subgroups (Fisher’s exact test, TET2 WT vs TET2 Mut [all samples] not significant, P = .0772; WT vs TET2 Mut, P = .0474. Co-Mut, comutation; NA, not applicable; PC, principal component.
We next annotated differentially methylated regions to gene promoters (full data set in supplemental Table 5). Pathway analysis revealed hypermethylation of hundreds of transcriptional activators and regulatory region–binding factors associated with RNA polymerase II (supplemental Tables 6 and 7), suggesting the potential for aberrant epigenetic regulation of many downstream targets. We hypothesized that TET2 mutation may contribute to NK-LGL leukemia by leading to loss of negative regulators of STAT3. We therefore analyzed the promoter regions of putative negative regulators (PIAS, PTP, PTPR, SHIP, and SOCS gene families) and found that those in protein tyrosine phosphatase receptor type delta (PTPRD) and type N were the most differentially methylated in TET2 mutant leukemic samples (Figure 4C; supplemental Figure 5) compared with TET2 WT LGL and normal NK control samples. Loss of PTPRD has been shown to lead to aberrant STAT3 activation.37-39 We therefore expanded the assessment of PTPRD promoter methylation using methylation-specific polymerase chain reaction39 on samples from our cohort; representative results are given in Figure 4D and full results in supplemental Figure 6. We found that 44.4% (4 of 9) of TET2-mutated samples exhibited promoter methylation (Figure 4E). This compares to 6.7% WT (1 of 15), 11.1% STAT3 mutant (1 of 9), and 25% comutant (1 of 5). This scenario suggests an alternative mechanism of STAT3 activation in TET2 mutant samples.
TET2 mutations are persistent in untreated NK-LGL leukemia
We next sequenced longitudinal tumor samples from 4 patients with TET2 mutations who did not receive treatment with cyclophosphamide (CP), MTX, or cyclosporine (Figure 5A), with a focus on the 5 recurrently mutated genes. Three patients had TET2 mutations at the beginning of observation, and patient 1511 developed a TET2 mutation at 70 months. TET2 mutations persisted indefinitely after detection in these untreated samples over 36, 40, 61, and 155 months, with an average of 73 months’ follow-up. TET2 mutation followed STAT3 mutation in patient 1511; the opposite was observed for patient 1257, in which TET2 mutation was followed by STAT3 mutation. In both patients, the frequencies for the 2 mutations appeared to converge, which may indicate presence in the same clone. Taken together, these data show that TET2 inactivation is associated with persistent clonal expansions with and without STAT3 mutation.
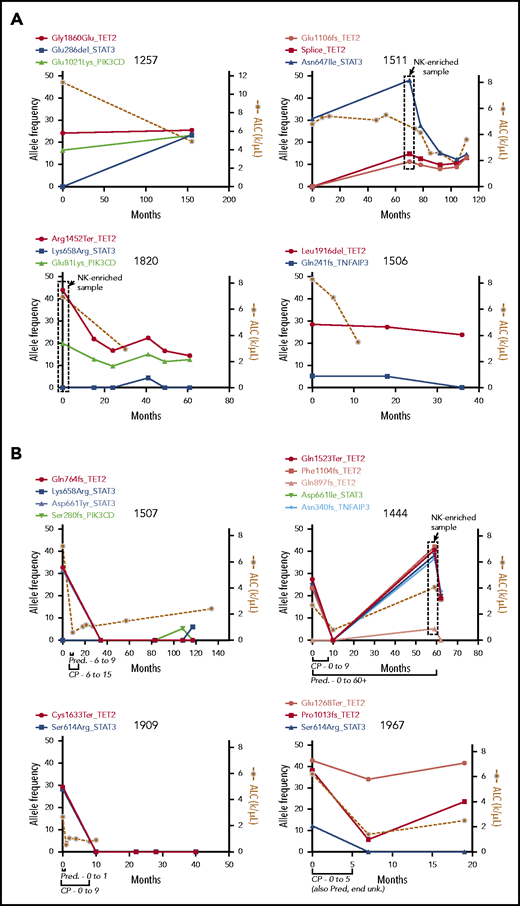
Longitudinal measurement of mutation allele frequency in TET2 mutant PBMC samples. Variant allele frequencies (left y-axis) are shown in the 5 recurrently mutated genes as measured by targeted sequencing and plotted with leukemic burden as assessed by absolute lymphocyte count (ALC; right y-axis). (A) Four untreated samples showing long-term persistence of TET2 mutant clones. The boxed data points are from NK-enriched samples, and thus allele frequencies are skewed higher. (B) Four samples that received treatment with CP for 9 or 5 months as indicated, showing complete reduction of the mutant clone and lymphocyte counts in treated individuals. Pred, prednisone; unk., unknown.
Longitudinal measurement of mutation allele frequency in TET2 mutant PBMC samples. Variant allele frequencies (left y-axis) are shown in the 5 recurrently mutated genes as measured by targeted sequencing and plotted with leukemic burden as assessed by absolute lymphocyte count (ALC; right y-axis). (A) Four untreated samples showing long-term persistence of TET2 mutant clones. The boxed data points are from NK-enriched samples, and thus allele frequencies are skewed higher. (B) Four samples that received treatment with CP for 9 or 5 months as indicated, showing complete reduction of the mutant clone and lymphocyte counts in treated individuals. Pred, prednisone; unk., unknown.
Variant allele frequencies correlate with response to CP
Four patients found to be TET2 mutant in this study underwent treatment with CP (100 mg daily orally) and had pretreatment and multiple posttreatment samples available. Clinical records for all 4 patients indicated complete response to therapy (ie, an improvement in blood counts). Samples from each of the 4 patients were then sequenced with the targeted panel, and mutational profiles were compared with disease burden as assessed by absolute lymphocyte count (Figure 5B). Of these, patients 1507 and 1909 showed elimination of the TET2 mutant clone with no return in the 117- and 40-month follow-up period for each sample, respectively. Patient 1444 showed initial elimination of the TET2 mutant clone, which re-emerged but not until 49 months later and in tandem with the emergence of a TNFAIP3 mutation. All 3 of these long-term responding patients had STAT3 mutations of frequency similar to that observed for TET2. Patient 1967 was unique in that 1 TET2 mutation (Pro1013fs) we had previously determined to be in the NK compartment was reduced by treatment, whereas the other (Glu1268Ter) was not greatly reduced. In all treated samples, the reduction in variant allele frequencies was accompanied by concomitant reduction in the lymphocyte count.
Clinical associations
We analyzed the effect of STAT3 mutation and TET2 mutation independently on CBC parameters to determine their possible correlation with cytopenias known to be present in patients with LGL leukemia. Highly significant (P < .02) decreases were observed in absolute neutrophil count, hemoglobin, hematocrit, and red blood cell (RBC) counts and increased RBC distribution width in STAT3 mutant samples compared with those without (Figure 6). Although similar trends are noted for TET2 mutants, none of the differences reached statistical significance. All tested CBC comparisons, including nonsignificant findings, are presented in supplemental Figures 7 and 8. These analyses were completed for CBC data taken on or near the date of the sequenced sample to ensure that the mutations were present. Some patients were undergoing treatment at that time. However, similar trends were observed in comparisons of CBCs from an additional treatment-naive date (supplemental Figure 9).

CBC parameters for patients with STAT3 mutation. CBC values from the date closest to the sequenced date are stratified according to patients who are STAT3 mutant (n = 20) or non–STAT3 mutant (WT) (n = 38). ANC, absolute neutrophil count; Hct, hematocrit; Hgb, hemoglobin; RDW, RBC distribution width.
CBC parameters for patients with STAT3 mutation. CBC values from the date closest to the sequenced date are stratified according to patients who are STAT3 mutant (n = 20) or non–STAT3 mutant (WT) (n = 38). ANC, absolute neutrophil count; Hct, hematocrit; Hgb, hemoglobin; RDW, RBC distribution width.
We then determined whether single mutations in either TET2 or STAT3 as opposed to mutations in both or neither lead to significant changes in CBC parameters. Overall, there was a pattern of reduced RBC, hemoglobin, hematocrit, and absolute neutrophil counts according to mutation profile. Slight decreases were observed in TET2-only mutants and modest decreases in STAT3-only mutants; the largest decreases were observed in comutated patients (supplemental Figure 5). Platelet count was the only parameter to show statistically significant global change (1-way ANOVA, P = .0071) (Figure 7A). Pairwise comparison revealed that the TET2-only mutation group had a significantly reduced platelet count compared with the WT group (P = .0074). Figure 7B shows that a number of these patients met the clinical definition of thrombocytopenia (<150 000/µL) and exhibited higher mean platelet volume than other groups.
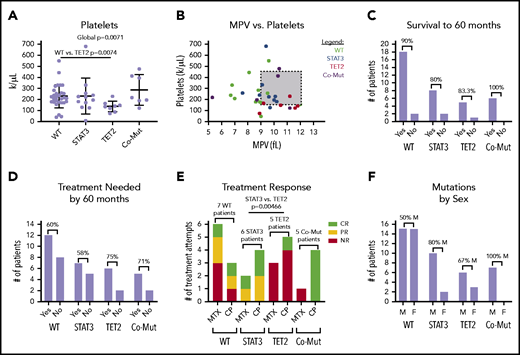
CBC parameters and other clinical features stratified according to STAT3 and TET2 mutation. Patients are divided into 4 categories, nonmutant (WT) (n = 29), STAT3 mutant-only (n = 12), TET2 mutant-only (n = 9), and comutation (Co-Mut) of both STAT3 and TET2 (n = 8). Platelets (Welch’s 1-way ANOVA global, P = .0071; Games-Howell post hoc test, WT vs TET2, P = .0074) (A) and relationship between platelet count and mean platelet volume (MPV) (B) in CBC reports from the date closest to the sequencing sample. (C) Overall survival within each group for those patients who have achieved 60 months of follow-up. (D) Need for immunosuppressive treatment within each group for those patients who have achieved 60 months of follow-up. (E) Response to immunosuppressive treatment initiated at any point during disease course (STAT3 vs TET2, Fisher’s exact test, P = .0046). (F) Distribution of patient sex within mutation groups. CR, complete response; F, female; M, male; NR, no response; PR, partial response.
CBC parameters and other clinical features stratified according to STAT3 and TET2 mutation. Patients are divided into 4 categories, nonmutant (WT) (n = 29), STAT3 mutant-only (n = 12), TET2 mutant-only (n = 9), and comutation (Co-Mut) of both STAT3 and TET2 (n = 8). Platelets (Welch’s 1-way ANOVA global, P = .0071; Games-Howell post hoc test, WT vs TET2, P = .0074) (A) and relationship between platelet count and mean platelet volume (MPV) (B) in CBC reports from the date closest to the sequencing sample. (C) Overall survival within each group for those patients who have achieved 60 months of follow-up. (D) Need for immunosuppressive treatment within each group for those patients who have achieved 60 months of follow-up. (E) Response to immunosuppressive treatment initiated at any point during disease course (STAT3 vs TET2, Fisher’s exact test, P = .0046). (F) Distribution of patient sex within mutation groups. CR, complete response; F, female; M, male; NR, no response; PR, partial response.
We also examined other categorical clinical variables relative to STAT3 and TET2 mutational status. Overall survival to 60 months for all mutation groups was ≥80%, and differences according to mutation status have not emerged at this point (Figure 7C). TET2 mutation, alone or in combination with STAT3, was associated with a slightly increased need for immunosuppressive treatment by 60 months that failed to reach statistical significance (Figure 7D). Roughly half (15 of 32 patients) of patients in the entire cohort who sought immunosuppressive treatment achieved at least some response to either MTX or CP (supplemental Table 1D).
We then examined treatment response between the groups as response (complete + partial) vs no response to MTX or CP. The patients with TET2 mutation exhibited significantly reduced response rates to MTX or CP treatment compared with patients with a STAT3 single mutation (pairwise Fisher’s exact test, P = .00466) (Figure 7E). All 4 TET2/STAT3 comutation patients exhibited a complete response to CP, which is in sharp contrast to the single complete response to CP observed in 5 patients with TET2 single mutation. The sex ratio was significantly different between the WT and TET2/STAT3 comutation group, with the TET2/STAT3 comutation group reporting no female patients (pairwise Fisher’s exact test, P = .0279) (Figure 7F).
Discussion
The key finding from the current study is that targeted sequencing of select mutations from a discovery cohort of 7 WGS samples found that TET2 was mutated in 28% of chronic NK-LGL leukemia cases. This frequency approaches that of previously reported STAT3 mutations, which we found in 33% of samples. Unlike STAT3 mutations, TET2 mutations seem to be specific to the NK variant of LGL leukemia as they have not been reported in T-LGL leukemia thus far beyond 1 case.24 We showed that all testable patients had a mutation solely in the NK compartment. However, one should be cognizant that LGL leukemia could coincide with other disorders, which could also be TET2 mutant. We established that TET2 mutations are clearly in the NK compartment, but we cannot rule out their existence in precursors and other cell types as we interrogated CD94+ and CD94– fractions via Sanger sequencing. It remains a formal possibility that deeper next-generation sequencing analysis may have picked up low-level mutations in the nonleukemic CD94– compartment.
Our preliminary analysis of CP-treated patients with NK-LGL leukemia indicates that TET2-specific treatments may not be necessary to achieve clinical response in TET2/STAT3 comutant samples. However, our observation of methylation differences in all leukemic samples, compared with normal NK cells, would suggest methylation as a potential therapeutic target in all patients with NK-LGL leukemia. The decision to use the hypomethylating agent azacytidine in AML is often driven by patient age and other risk factors, and not by the presence or absence of mutant TET2.40,41 Those patients with NK-LGL leukemia with only TET2 mutations stand to gain the most from new therapies, as only 1 of 5 followed up in this study responded to either CP or MTX. The finding of TET2 promoter methylation in TET2 mutant samples suggests these mechanisms cooperate to fully abrogate TET2 function. This action may make this subgroup susceptible to inhibition of other TET family members as at least some residual activity is required for clonal outgrowth.42 Unfortunately, models that introduce TET2 dysfunction into the marrow do not recreate NK-LGL leukemia; thus, genetically accurate preclinical models to screen and optimize experimental therapeutics are lacking.43 In a model similar to LGL leukemia but benefiting from defined stimulation, TET2 disruption also led to robust proliferation and expansion of chimeric antigen receptor T cells.44 Models of TET2 mutation in myeloid disorders45,46 have shown a requirement for additional cooperative mutations to promote leukemic expansion, and we speculate that this is also true for NK-LGL leukemia.
Our strategy of targeted resequencing identified TET2 and a few other genes as being mutated. TNFAIP3 and PI3K pathway genes exhibited mutations in 10% and 5% of this cohort, respectively. TNFAIP3 mutation has been previously described in chronic T-LGL47 and NK-LGL9 leukemia. PIK3AP1 and PIK3CD mutations have not previously been reported in LGL leukemia, and it is noteworthy that clinical trials of compounds targeting this pathway are advancing in other cancers.48
In the WGS samples of this study, in accordance with past exome sequencing, all samples showed a significantly mutated clone. This finding suggests that the phrase “chronic lymphoproliferative disorder of NK cells” is a misnomer that implies these are not highly clonal expansions. There is an obvious need to distinguish chronic and aggressive NK leukemias, but the term chronic NK-LGL leukemia may more accurately represent the similarities between this and the chronic T-LGL form. It will be interesting to observe, in other patient populations, how many samples will prove to be clonal. We can now theoretically measure clonality in roughly half of chronic NK-LGL by sequencing TET2 and STAT3 alone, which may facilitate this analysis in the future. We would expect more oligoclonal proliferation in earlier disease. This is consistent with the belief that antigen is the true driver of LGL leukemia49 and that mutations are opportunistic clonal expanders.50
TET2 mutations were found in 11 samples without STAT3 mutation, which implies they can fulfill a similar role for clonal expansion. STAT3 is a known regulator of inflammatory cytokine production in LGL leukemia51 in addition to its role in promoting clonal outgrowth.50,52 This additional function may explain why STAT3 mutant patients are more symptomatic compared with patients who are TET2 mutant alone. It could be inferred that comutated samples, which are associated with the most severe symptoms, may represent patients who have had more longstanding disease. Thus, one could speculate that length of disease is what truly associates with clinical symptoms. Counter to that, clear differences were observed between TET2 and STAT3 single-mutant samples, which we would infer to be at the same stage. This finding suggests that disease duration is not, or at least not completely, responsible for symptom presentation.
Thrombocytopenia alone seems to be significantly associated with TET2 mutant samples without STAT3 comutation. It has been previously reported that patients with AML and TET2 mutations have lower platelet numbers due to disruption of platelet production.53 Our findings of low platelet counts and high mean platelet volume would suggest that platelet loss in NK-LGL leukemia takes place in the periphery. More work needs to be done to determine how this action occurs in TET2 mutant samples and why it is specific to those without STAT3 comutation.
We have identified altered methylation in TET2 mutant NK-LGL samples. These changes are far more pronounced compared with those that distinguish NK-LGL leukemia from normal NK cells. TET2 promoter methylation was largely restricted to those samples with mutation. Taken together, this may indicate that TET2 dysregulation defines a subset of NK-LGL leukemia and is not a common feature. Roughly half of the TET2 mutant samples (44.4%) showed methylation of the PTPRD promoter, a known negative regulator of STAT3,37-39 which may be an alternative means of STAT3 activation in these samples. STAT3 mutations are abundant but not universal in the LGL leukemia patient population,4 whereas all patients with LGL leukemia exhibit constitutive activation of STATs.54 Damaging mutations in PTP family members have been observed in T-LGL55 and aggressive NK-LGL56 leukemias. Suppressor of cytokine signaling 3 (SOCS3) seems to be lost through an unknown mechanism.57
In summary, we identified mutant TET2 as a major new target in chronic NK-LGL leukemia, in the largest molecular profiling study of this disease to date. We further showed its intriguing association with thrombocytopenia and resistance to CP and MTX when present without STAT3 comutation. Although treatment indications and response to therapy were evaluated rigorously, these interesting findings should be considered preliminary until validated in prospective studies. This work improves our understanding of the heterogeneous clinical presentation of LGL leukemia.
Acknowledgments
The authors thank Andrea Hines, Holly Davis, and Kendall Thomas Baab for LGL Leukemia Registry support. They acknowledge help with RRBS data set processing from Stephen Turner and Alex Koeppel of the Bioinformatics Core, University of Virginia School of Medicine. Computational resources and technical support were provided by the School of Medicine Research Computing at the University of Virginia.
LGL leukemia research in the Loughran laboratory at the University of Virginia is supported by National Institutes of Health (NIH) National Cancer Institute (NCI) grants R01CA178393 and P30CA044579 (T.P.L., F.E.G.-B.). R.C.H. and C.A.K. are supported by NIH/NCI grant R01CA178393, and additionally by NIH grants R24DK106766 (National Institute of Diabetes and Digestive and Kidney Diseases) and R01GM121613 (National Institute of General Medical Sciences). Additional support was provided by the Bess Family Charitable Fund, the LGL Leukemia Foundation, Charles and Katharine Hutton Tweedy, William J. Branch, and a generous anonymous donor (T.P.L.).
The content is solely the responsibility of the authors and does not necessarily represent the official views of the NIH.
Authorship
Contribution: T.L.O., D.J.F., R.C.H., A.R., and T.P.L. conceived the study; T.L.O., H.C., F.E.G.-B., and A.R. wrote the manuscript; H.C., J.C.X., K.C.O., C.E.H., Y.N., B.C.S., M.S., S.K.S., M.F.T., U.P., C.A.K., E.A.F., and S.O.-G. designed experiments, collected data, analyzed results, and contributed figures to the manuscript; and all authors edited and approved the manuscript.
Conflict-of-interest disclosure: T.P.L. is on the Scientific Advisory Board and has stock options for Keystone Nano, Bioniz Therapeutics, and Dren Bio. T.P.L. and D.J.F. received honoraria from Kymera Therapeutics. There are no conflicts of interest with the work presented in the manuscript. The remaining authors declare no competing financial interests
Correspondence: Thomas P. Loughran Jr, University of Virginia Cancer Center, PO Box 800334, Charlottesville, VA 22908-0334; e-mail: tl7cs@hscmail.mcc.virginia.edu.
WGS and RRBS short reads will be deposited in the Database of Genotypes and Phenotypes (accession number phs002359.v1.p1).
The online version of this article contains a data supplement.
There is a Blood Commentary on this article in this issue.
The publication costs of this article were defrayed in part by page charge payment. Therefore, and solely to indicate this fact, this article is hereby marked “advertisement” in accordance with 18 USC section 1734.
