

Key Points
The 7-SNP-based classifier is an effective and reliable predictor of survival for patients with ENKTL.
The 7-SNP-based signature can be used as a supplement to current risk indicators, aiding clinical decision making.

Abstract
Current prognostic scoring systems based on clinicopathologic variables are inadequate in predicting the survival and treatment response of extranodal natural killer/T-cell lymphoma (ENKTL) patients undergoing nonanthracyline-based treatment. We aimed to construct a classifier based on single-nucleotide polymorphisms (SNPs) for improving predictive accuracy and guiding clinical decision making. Data from 722 patients with ENKTL from international centers were analyzed. A 7-SNP–based classifier was constructed using LASSO Cox regression in the training cohort (n = 336) and further validated in the internal testing cohort (n = 144) and in 2 external validation cohorts (n = 142 and n = 100). The 7-SNP–based classifier showed good prognostic predictive efficacy in the training cohort and the 3 validation cohorts. Patients with high- and low-risk scores calculated by the classifier exhibited significantly different progression-free survival (PFS) and overall survival (OS) (all P < .001). The 7-SNP–based classifier was further proved to be an independent prognostic factor by multivariate analysis, and its predictive accuracy was significantly better than clinicopathological risk variables. Application of the 7-SNP–based classifier was not affected by sample types. Notably, chemotherapy combined with radiotherapy significantly improved PFS and OS vs radiotherapy alone in high-risk Ann Arbor stage I patients, whereas there was no statistical difference between the 2 therapeutic modalities among low-risk patients. A nomogram was constructed comprising the classifier and clinicopathological variables; it showed remarkably better predictive accuracy than either variable alone. The 7-SNP–based classifier is a complement to existing risk-stratification systems in ENKTL, which could have significant implications for clinical decision making for patients with ENKTL.
Introduction
Extranodal natural killer/T-cell lymphoma (ENKTL) is an uncommon subtype of non-Hodgkin lymphoma that is more prevalent in Asia and Latin America.1,2 It is characterized by Epstein-Barr virus (EBV) infection and primarily involves the nasal cavity and nasopharynx.3,4 In the past decade, the survival outcomes of patients with ENKTL have significantly improved as a result of the adoption of nonanthracycline-based chemotherapy and early intervention with first-line radiotherapy (RT).5 Early-stage patients with ENKTL can achieve long-term survival after combined chemotherapy with RT or even first-line RT alone,6 whereas the clinical prognosis of advanced ENKTL remains unsatisfactory despite treatment with asparaginase-based chemotherapy, with or without RT.7
Accurate staging and prognosis scoring systems are essential for the management of ENKTL.8-10 Almost 70% of patients with ENKTL are stratified into the early stage according to the Ann Arbor staging system, but previous risk-classification models, such as the classical International Prognostic Index (IPI), the Korea Prognostic Index (KPI), and the Prognostic Index of Natural Killer Lymphoma (PINK), fail to select individual therapies for this group of patients.8,11,12 The typical heterogeneity of ENKTL remains a major obstacle for precise molecular typing. So far, no reliable genetic or molecular biomarker of ENKTL has been routinely used in clinical practice. Single-nucleotide polymorphisms (SNPs), the most common type of human genetic variants, have received increasing attention for their close association with disease prognosis.13 Additionally, the accuracy of ENKTL molecular diagnosis is affected by sampling location and intratumoral heterogeneity to some extent; whether SNP markers can overcome these limitations is worthy of further research.
We developed and validated a 7-SNP–based classifier to predict survival of patients with ENKTL receiving nonanthracycline-based chemotherapy, which has the potential to guide personalized clinical decision making. The concordance test showed that application of this classifier was not affected by sample type. Moreover, a nomogram was constructed to visually predict the prognosis of individual patients; significantly improved predictive accuracy was observed.
Methods
Study design and participants
This retrospective international cohort study consecutively enrolled newly diagnosed pathologically confirmed ENKTL patients who received nonanthracycline-based regimens, with or without RT, as first-line treatment. All patients were staged according to the Ann Arbor staging system. Patients with incomplete clinical data were excluded. Formalin-fixed paraffin-embedded (FFPE) samples or blood samples were collected at baseline. In the discovery phase, we collected 233 blood specimens from patients with ENKTL admitted to Sun Yat-sen University Cancer Center between 1 January 2010 and 30 December 2015. In the training phase, 480 FFPE samples were obtained from patients with ENKTL who received treatment at the Sun Yat-sen University Cancer Center between 1 January 2005 and 30 December 2015. The patients were assigned to a training cohort (70%, n = 336) or an internal validation cohort (30%, n = 144) by computer-generated random numbers. In the validation phase, the validation cohorts consisted of patients from multiple medical centers from 1 January 2010 to 30 December 2015. External validation cohort 1 included 142 FFPE samples from Sun Yat-sen Memorial Hospital, Guangdong Province People’s Hospital, and Tianjin Medical University Cancer Institute and Hospital. External validation cohort 2 included 58 blood samples from National Cancer Centre Singapore and 42 FFPE samples from Duke University Medical Center. The institutional ethics review committees of all hospitals approved this retrospective analysis. Research was conducted in accordance with the Declaration of Helsinki. All patient data were anonymized.
Baseline assessment
Patient demographics, including age and gender, and baseline characteristics, including Eastern Cooperative Group performance status (ECOG-PS) scores, Ann Arbor stage, extranodal involvement, lactate dehydrogenase (LDH), B symptoms, lymph node involvement, and nonnasal type, were retrieved. All sam-ples were obtained upon initial diagnosis and reassessed by 2 pathologists (H.-L.R. and M.L.) independently, according to the 2017 World Health Organization classification criteria14 ; ENKTLs occurring within the upper aerodigestive tract were defined as the nasal type, whereas lymphomas occurring in extra–upper aerodigestive tract sites were defined as the nonnasal type.14 The extent and severity of disease were assessed radiologically, such as with computed tomography, magnetic resonance imaging, and positron emission tomography–computed tomography scans. Regional lymph node involvement, distant lymph node involvement, and extranodal involvement were identified by imaging and/or biopsy results. Lymph nodes in the drainage area of the primary tumor were defined as regional lymph nodes, and those beyond the area were defined as distant lymph nodes. Elevated LDH was defined as >245 U/L in the plasma. Any concentration of detectable EBV DNA in the plasma or whole blood was defined as EBV+. Combined modality treatment (CMT) refers to the combination of RT and chemotherapy, and RT refers to treatment with RT alone. RT included extended field or extended involved field encompassing the primary tumor and adjacent regions at a median dose of 51 Gy (range, 42-71 Gy; dose per fraction, 1.8-2.0 Gy).
SNP genotype microarray
Genomic DNA was extracted from peripheral blood samples using a DNeasy Blood & Tissue Kit (69506; QIAGEN), following the manufacturer’s instructions. The extracted DNA was quantified using a NanoDrop ND-1000 Spectrophotometer (Thermo Fisher Scientific, Waltham, MA) and resolved by 1% agarose electrophoresis. After alkali denaturation and amplification, the resuspended DNA was hybridized to an Infinium Asian Screening Array (Illumina, San Diego, CA) overnight. The captured DNA was used as a template for a single-base extension reaction on the chip, and fluorescent markers were added to the chip to distinguish SNP genotypes. To identify SNPs associated with the death of ENKTL patients, we conducted an exploratory bioinformatics analysis at the genome-wide level of 95 patients who died and 138 patients who remained alive in the discovery phase. Initially, 746 103 SNPs were detected on the Illumina Asian Screening Array. We excluded SNPs located on the sex chromosomes, as well as those with low minor allele frequency or call rate <99%. A total of 316 824 SNPs for each of the 233 individuals were included (supplemental Figure 1, available on the Blood Web site). The differences in SNPs between those who died and those who survived were calculated using the χ2 test with a threshold of P < .001. Finally, 36 of 90 differentiated SNPs had explicit gene annotation information (supplemental Table 1) and were used for further analysis.
SNP status detection
The status of the 36 candidate SNPs for 336 FFPE samples was determined by time-of-flight mass spectrometry (MassARRAY system; Sequenom, San Diego, CA) among the training cohort. DNA fragments containing the SNP sites were amplified by multiple polymerase chain reactions. After removal of the remaining deoxyribonucleoside triphosphates and primers in the polymerase chain reaction system with SAP enzyme, single-base extension primers were added, with the 3′ terminus adjacent to the SNP site, and 4 kinds of dideoxyribonucleoside triphosphates were used to replace deoxyribonucleoside triphosphates. Matrix-assisted laser analysis and ionization time-of-flight mass spectrometry were used to detect differences in molecular weight between the extended product and the unextended primer, as well as to determine the SNP status at this point. Data were managed using Sequenom TYPER 4.0 Genotyping Software. We excluded samples in which candidate SNPs could not be detected (<1%). Details of the primers for MassARRAY are shown in supplemental Table 2. The 36 SNPs were recorded as 0, 1, and 2, as detailed in supplemental Table 1.
Statistical analysis
The χ2 test was used to calculate SNP genotype differences between survivors and nonsurvivors in the discovery phase. Gene Ontology (GO) terms and Kyoto Encyclopedia of Genes and Genomes (KEGG) enrichment analyses based on differentiated SNPs were performed using KOBAS (KEGG Orthology-Based Annotation System) software (version 3.0) with the default parameters. Coding SNPs and all above differentiated SNPs were used as the background sets, respectively. LASSO Cox regression was used to select these differentiated SNPs for classifier construction based on progression-free survival (PFS) in the training cohort using the “glmnet” package in R software.15-17 A risk score was calculated using the sum of values weighted by the coefficients from the LASSO model. The optimal classifier cutoff score was determined by X-tile software (version 3.6.1; Yale University, New Haven, CT).18 The SNP-based classifier was validated in the internal validation cohort and then in the external validation cohorts. Univariate and multivariate analyses were done to evaluate the independent significance of covariates with the “survival” package in R software, and significant variables with a value of P < .2 were entered into multivariate analysis. Multivariate Cox regression analysis using backward selection was used to test the independent significance of covariates: sex (male vs female), age (≤60 vs >60 years), ECOG-PS (0-1 vs ≥2), Ann Arbor stage (I-II vs III-IV), extranodal involvement (0-1 vs ≥2 nodes), LDH (normal vs elevated), B symptoms (no vs yes), lymph node involvement (none or regional vs distant), nonnasal type (no vs yes), and SNP-based classifier (low risk vs high risk). Survival analyses were performed using the Kaplan-Meier method and log-rank test. Hazard ratios (HRs) were used to calculate the risk of survival events between different groups by univariate Cox regression analysis. All indicators were recorded as dichotomous variables. Overall survival (OS) was measured from the date of diagnosis until death from any cause. PFS was calculated from the date of initial diagnosis to first progression. Disease progression (PD) was defined as a >25% increase compared with the sum of the sizes of the pretreatment lesions, or the appearance of new lesions, which were assessed by physical or radiographic examinations. For patients who experienced multiple episodes of PD, the first PD was defined as the occurrence of a survival event to calculate PFS. Patients who had not died were censored at the last date known alive. For PFS, patients who had not died or experienced PD were censored at their last evaluable disease assessment. The κ consistence test was used to evaluate the consistency of SNP genotypes between FFPE samples and blood specimens. We used coefficients of the independent prognostic covariates weighted in the multivariate Cox regression model to construct a nomogram using the “rms” package in R software. The accuracy of the nomogram was measured using the calibration curve and concordance probability (C-index), as well as the time-dependent receiver operating characteristic (ROC) curve analysis with the “survival ROC” package in R software, and the area under the curve (AUC) was measured. All statistical analyses were done using R software (version 3.5.3). A 2-sided P value <.05 was considered statistically significant.
Results
Patient characteristics
The study flowchart is shown in Figure 1. Patient demographic and baseline characteristics are summarized in Table 1. The study population included 336 patients in the training cohort (median follow-up, 48.2 months; interquartile range [IQR], 11.6-89.7), 144 patients in the internal validation cohort (median follow-up, 44.7 months; IQR, 15.2-74.5), 142 patients in the external validation cohort 1 (median follow-up, 55.4 months; IQR, 10.1-78.2), and 100 patients in external validation cohort 2 (median follow-up, 27.2 months; IQR, 7.7-58.7). The 5-year PFS rates were 44.4%, 49.3%, 46.7%, and 35.9%, respectively, and the 5-year OS rates were 62.8%, 57.5%, 56.8%, and 45.4%, respectively.
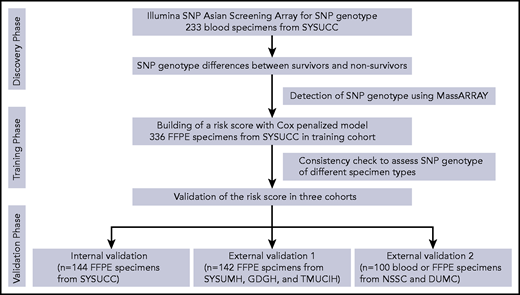
The study flowchart. DUMC, Duke University Medical Center; GDGH, Guangdong Provincial People's Hospital, Guangdong Academy of Medical Sciences; NSSC, National Cancer Center of Singapore; SYSUCC, Sun Yat-sen University Cancer Center; SYSUMH, Sun Yat-sen Memorial Hospital; TMUCIH, Tianjin Medical University Cancer Institute and Hospital.
The study flowchart. DUMC, Duke University Medical Center; GDGH, Guangdong Provincial People's Hospital, Guangdong Academy of Medical Sciences; NSSC, National Cancer Center of Singapore; SYSUCC, Sun Yat-sen University Cancer Center; SYSUMH, Sun Yat-sen Memorial Hospital; TMUCIH, Tianjin Medical University Cancer Institute and Hospital.
Demographic and baseline characteristics of ENKTL patients in 4 cohorts
| Variables | Training cohort (n = 336) | Internal validation cohort (n = 144) | External validation cohort 1 (n = 142) | External validation cohort 2 (n = 100) |
|---|---|---|---|---|
| Age, y | ||||
| ≤60 | 286 (85) | 124 (86) | 111 (78) | 67 (67) |
| >60 | 50 (15) | 20 (14) | 31 (22) | 33 (33) |
| Sex | ||||
| Male | 223 (66) | 102 (71) | 98 (69) | 75 (75) |
| Female | 113 (34) | 42 (29) | 44 (31) | 25 (25) |
| B symptoms | ||||
| No | 191 (57) | 78 (54) | 81 (57) | 54 (54) |
| Yes | 145 (43) | 66 (46) | 61 (43) | 46 (46) |
| ECOG-PS | ||||
| 0-1 | 307 (91) | 130 (90) | 130 (92) | 75 (75) |
| ≥2 | 29 (9) | 14 (10) | 12 (8) | 25 (25) |
| Ann Arbor stage | ||||
| I-II | 261 (78) | 112 (78) | 100 (70) | 54 (54) |
| III-IV | 75 (22) | 32 (22) | 42 (30) | 46 (46) |
| Lymph node involvement | ||||
| No | 161 (48) | 68 (47) | 61 (43) | 41 (41) |
| Regional | 133 (40) | 56 (39) | 40 (28) | 37 (37) |
| Distant | 42 (12) | 20 (14) | 41 (29) | 22 (22) |
| Nonnasal type | ||||
| Yes | 54 (17) | 30 (21) | 15 (11) | 12 (12) |
| No | 282 (83) | 114 (79) | 127 (89) | 88 (88) |
| No. of extranodal involvement | ||||
| 0 or 1 | 197 (59) | 101 (70) | 80 (56) | 57 (57) |
| ≥2 | 139 (41) | 43 (30) | 62 (44) | 43 (43) |
| LDH | ||||
| Normal | 203 (60) | 83 (58) | 81 (57) | 39 (39) |
| Elevated | 133 (40) | 61 (42) | 61 (43) | 61 (61) |
| IPI | ||||
| 0-1 | 256 (76) | 97 (68) | 77 (54) | 44 (44) |
| 2 | 57 (17) | 34 (23) | 34 (24) | 14 (14) |
| 3 | 21 (6) | 12 (8) | 21 (15) | 19 (19) |
| 4-5 | 2 (1) | 1 (1) | 10 (7) | 23 (23) |
| KPI | ||||
| Group 1 | 42 (13) | 20 (14) | 19 (13) | 12 (12) |
| Group 2 | 129 (38) | 43 (30) | 54 (38) | 19 (19) |
| Group 3 | 108 (32) | 55 (38) | 25 (18) | 33 (33) |
| Group 4 | 57 (17) | 26 (18) | 44 (31) | 36 (36) |
| PINK | ||||
| Low risk | 171 (51) | 64 (44) | 60 (42) | 33 (33) |
| Intermediate risk | 120 (36) | 61 (43) | 48 (34) | 36 (36) |
| High risk | 45 (13) | 19 (13) | 34 (24) | 31 (31) |
All data are n (%).
Constructing and validating a 7-SNP–based classifier
GO terms and KEGG pathway analyses revealed that the genes related to the 36 differentiated SNP sites were primarily involved in acetylated modification of histones, phosphatidylinositol 3-kinase (PI3K)-AKT signaling pathway activation, and the actin cytoskeleton (Figure 2A). In the training cohort, 7 SNPs were selected from the 36 differentiated SNPs by LASSO Cox analysis, and a prognostic classifier was constructed. The 7 selected SNPs were related to WDR27, UMAD1, TENM2, LINC02463, KDM4C, FGD4, and FAM71A (Figure 2B). An individual patient-level risk score was calculated using the following formula based on the 7-SNP status: risk score = (0.643 × rs3734905) – (0.340 × rs10272776) – (0.301 × rs3860783) – (0.349 × rs17776928) + (0.030 × rs73639447) + (0.939 × rs10844247) – (1.282 × rs3122712).
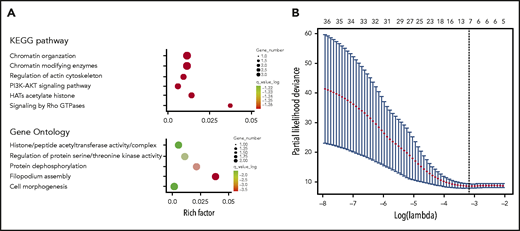
Construction of the 7-SNP–based classifier. (A) Top GO terms and KEGG pathway analysis of genes corresponding to 36 differentiated SNPs. (B) Seven SNPs are selected by LASSO Cox regression analysis.
Construction of the 7-SNP–based classifier. (A) Top GO terms and KEGG pathway analysis of genes corresponding to 36 differentiated SNPs. (B) Seven SNPs are selected by LASSO Cox regression analysis.
The risk scores of the training cohort ranged from −3.545 to 2.255, and they correlated positively with the risk of PD. The patients were stratified into low-risk (≤0; n = 172; 51.2%) and high-risk (>0; n = 164; 48.8%) groups using the optimum cutoff of the risk score, as determined by X-tile software (supplemental Figure 2). High-risk patients were significantly more likely than low-risk patients to have a poorer PFS (HR, 3.431; 95% confidence interval [CI], 2.479-4.750; P < .001) (supplemental Figure 3A) and OS (HR, 4.010; 95% CI, 2.808-5.727; P <.001) (supplemental Figure 4A). These findings were further validated for PFS in the high- and low-risk patients in the internal validation cohort (HR, 3.705; 95% CI, 2.104-6.526; P < .001) (supplemental Figure 3B), the external validation cohort 1 (HR, 3.778; 95% CI, 2.313-6.171; P < .001) (supplemental Figure 3C), and external validation cohort 2 (HR, 4.593; 95% CI, 2.554-8.259; P < .001) (supplemental Figure 3D). Consistently, high-risk cases were also significantly more likely than low-risk patients to have a poorer OS in the internal validation cohort (HR, 3.059; 95% CI, 1.691-5.536; P < .001) (supplemental Figure 4B), external validation cohort 1 (HR, 3.846; 95% CI, 2.228-6.640; P < .001) (supplemental Figure 4C), and external validation cohort 2 (HR, 249; 95% CI; 1.773-5.954; P < .001) (supplemental Figure 4D).
Univariate and multivariate Cox analyses revealed that, after adjustment for age, Ann Arbor stage, lymphoma node involvement, nonnasal type, and LDH, the 7-SNP–based classifier remained an independent and significant predictor of OS and PFS (Tables 2 and 3). Importantly, the adjustment did not noticeably change the HR of the 7-SNP classifier (Table 3). Moreover, we assessed the prognostic accuracy of the 7-SNP–based classifier and other predictors with time-dependent ROC analysis for 5-year PFS and OS. The 7-SNP–based classifier performed significantly better than did other independent predictors, including age, Ann Arbor stage, lymphoma node involvement, nonnasal type, and LDH (P < .05 for all, log-rank test; supplemental Figures 5-6).
Univariate analyses of a 7-SNP–based classifier and clinicopathological characteristics associated with PFS and OS
| Variables | Training cohort | Internal validation cohort | External validation cohort 1 | External validation cohort 2 | ||||
|---|---|---|---|---|---|---|---|---|
| HR (95% CI) | P | HR (95% CI) | P | HR (95% CI) | P | HR (95% CI) | P | |
| PFS | ||||||||
| Age (≤60 vs >60 y) | 1.456 (0.981-2.160) | .062 | 1.887 (0.997-3.646) | .059 | 1.892 (1.142-3.133) | .013 | 1.634 (0.959-2.784) | .071 |
| Sex (male vs female) | 0.825 (0.595-1.146) | .252 | 1.067 (0.618-1.834) | .817 | 1.058 (0.655-1.707) | .819 | 0.783 (0.422-1.453) | .438 |
| B symptoms (no vs yes) | 1.277 (0.945-1.726) | .112 | 1.659 (0.992-2.774) | .054 | 1.322 (0.842-2.077) | .226 | 2.203 (1.299-3.737) | .003 |
| ECOG-PS (0-1 vs ≥2) | 1.856 (1.175-2.933) | .008 | 1.570 (0.774-3.315) | .237 | 2.045 (1.017-4.114) | .045 | 2.319 (1.334-4.029) | .003 |
| Ann Arbor stage (I-II vs III-IV) | 2.496 (1.806-3.450) | <.001 | 2.155 (1.235-3.760) | .007 | 2.868 (1.809-4.548) | <.001 | 3.173 (1.860-5.412) | <.001 |
| Lymphoma node involvement (none or regional vs distant) | 1.697 (1.110-2.596) | .015 | 2.042 (1.082-3.855) | .028 | 1.850 (1.155-2.963) | .010 | 2.982 (1.637-5.432) | <.001 |
| Nonnasal type (no vs yes) | 1.660 (1.144-2.409) | .008 | 1.930 (1.094-3.430) | .023 | 2.288 (1.229-4.262) | .009 | 2.507 (1.255-5.008) | .009 |
| Extranodal involvement (0-1 vs ≥2 nodes) | 1.840 (1.361-2.486) | <.001 | 1.694 (0.972-2.953) | .063 | 1.875 (1.193-2.946) | .006 | 2.628 (1.556-4.439) | <.001 |
| LDH (normal vs elevated) | 1.839 (1.360-2.486) | <.001 | 1.940 (1.163-3.237) | .011 | 1.967 (1.253-3.090) | .003 | 1.624 (0.947-2.783) | .078 |
| 7-SNP–based classifier (low risk vs high risk) | 3.431 (2.479-4.750) | <.001 | 3.705 (2.104-6.526) | <.001 | 3.778 (2.313-6.171) | <.001 | 4.593 (2.554-8.259) | <.001 |
| OS | ||||||||
| Age (≤60 vs >60 y) | 1.536 (1.018-2.316) | .041 | 2.292 (1.172-4.483) | .015 | 2.066 (1.204-3.543) | .008 | 1.729 (0.974-3.068) | .061 |
| Sex (male vs female) | 0.857 (0.608-1.210) | .381 | 1.609 (0.598-1.910) | .822 | 1.066 (0.631-1.800) | .811 | 0.826 (0.431-1.583) | .565 |
| B symptoms (no vs yes) | 1.421 (1.034-1.953) | .030 | 1.352 (0.785-2.331) | .277 | 1.695 (1.034-2.783) | .036 | 2.175 (1.234-3.835) | .007 |
| ECOG-PS (0-1 vs ≥2) | 1.805 (1.115-2.921) | .016 | 1.575 (0.709-3.501) | .265 | 2.349 (1.156-4.773) | .018 | 2.725 (1.542-4.815) | .001 |
| Ann Arbor stage (I-II vs III-IV) | 2.512 (1.787-3.533) | <.001 | 2.162 (1.194-3.917) | <.001 | 3.260 (1.966-5.406) | <.001 | 3.178 (1.772-5.699) | <.001 |
| Lymphoma node involvement (none or regional vs distant) | 1.889 (1.229-2.904) | .004 | 1.893 (1.082-3.312) | .025 | 2.130 (1.276-3.554) | .004 | 2.715 (1.407-5.242) | .003 |
| Nonnasal type (no vs yes) | 1.858 (1.267-2.725) | .002 | 1.695 (0.914-3.141) | .094 | 1.978 (0.971-4.029) | .060 | 2.341 (1.126-4.856) | .023 |
| Extranodal involvement (0-1 vs ≥2 nodes) | 1.774 (1.289-2.441) | <.001 | 1.869 (1.043-3.349) | .035 | 2.400 (1.443-3.993) | .001 | 2.974 (1.662-5.323) | <.001 |
| LDH (normal vs elevated) | 1.859 (1.352-2.557) | <.001 | 2.007 (1.162-3.465) | .012 | 2.010 (1.219-3.315) | .006 | 1.891 (1.032-3.463) | .039 |
| 7-SNP–based classifier (low risk vs high risk) | 4.010 (2.808-5.727) | <.001 | 3.059 (1.691-5.536) | <.001 | 3.846 (2.228-6.640) | <.001 | 3.249 (1.773-5.954) | <.001 |
Multivariate analyses of a 7-SNP–based classifier and clinicopathological characteristics associated with PFS and OS
| Variables | Training cohort | Internal validation cohort | External validation cohort 1 | External validation cohort 2 | ||||
|---|---|---|---|---|---|---|---|---|
| HR (95% CI) | P | HR (95% CI) | P | HR (95% CI) | P | HR (95% CI) | P | |
| PFS | ||||||||
| Age (≤60 vs >60 y) | 1.956 (1.307-2.927) | .001 | 2.222 (1.131-4.365) | .021 | 2.150 (1.284-3.600) | .004 | 2.165 (1.244-3.767) | .006 |
| B symptoms (no vs yes) | — | — | 1.831 (1.065-3.147) | .029 | — | — | — | — |
| ECOG-PS (0-1 vs ≥2) | — | — | — | — | — | — | 2.835 (1.038-3.245) | .037 |
| Ann Arbor stage (I-II vs III-IV) | 2.102 (1.513-2.921) | <.001 | 1.833 (1.024-3.284) | .042 | 2.385 (1.491-3.814) | <.001 | 2.441 (1.386-4.301) | .002 |
| Lymphoma node involvement (none or regional vs distant) | 2.146 (1.394-3.305) | .001 | 2.061 (1.047-4.058) | .036 | — | — | 2.069 (1.089-3.929) | .026 |
| Nonnasal type (no vs yes) | 1.612 (1.104-2.353) | .013 | — | — | — | — | — | — |
| LDH (normal vs elevated) | 1.702 (1.246-2.325) | .001 | 2.057 (1.202-3.520) | .009 | — | — | — | — |
| 7-SNP–based classifier (low risk vs high risk) | 3.261 (2.335-4.555) | <.001 | 3.562 (1.908-6.649) | <.001 | 3.496 (2.115-5.781) | <.001 | 4.510 (2.449-8.305) | <.001 |
| OS | ||||||||
| Age (≤60 vs >60 y) | 2.143 (1.407-3.265) | <.001 | 2.450 (1.246-4.818) | .009 | 2.183 (1.262-3.776) | .005 | 2.231 (1.223-4.069) | .009 |
| B symptoms (no vs yes) | 1.335 (0.966-1.846) | .080 | — | — | — | — | — | — |
| ECOG-PS (0-1 vs ≥2) | — | — | — | — | — | — | 2.012 (1.120-3.615) | .019 |
| Ann Arbor stage (I-II vs III-IV) | 2.035 (1.437-2.884) | <.001 | 1.935 (1.041-3.596) | .037 | 1.994 (1.109-3.585) | .021 | 2.354 (1.260-4.399) | .007 |
| Lymphoma node involvement (none or regional vs distant) | 2.387 (1.531-3.722) | <.001 | 2.231 (1.131-4.399) | .021 | — | — | 1.929 (0.956-3.899) | .046 |
| Nonnasal type (no vs yes) | 1.787 (1.210-2.641) | .004 | — | — | — | — | — | — |
| Extranodal involvement (0-1 vs ≥2 nodes) | — | — | — | — | 1.879 (1.046-3.374) | .035 | — | — |
| LDH (normal vs elevated) | 1.718 (1.234-2.391) | .001 | 1.881 (1.075-3.292) | .027 | — | — | — | — |
| 7-SNP–based classifier (low risk vs high risk) | 3.822 (2.646-5.520) | <.001 | 3.296 (1.740-6.246) | <.001 | 3.690 (2.113-6.444) | <.001 | 3.144 (1.677-5.893) | <.001 |
Low-risk early-stage patients with ENKTL benefit from RT alone
We were interested in whether risk stratification using the 7-SNP–based classifier could determine if RT alone conferred survival benefits on patients with ENKTL according to risks. Notably, for patients with Ann Arbor stage I disease and risk score ≤0, there was no significant difference in terms of PFS (HR, 1.286; 95% CI, 0.734-2.255; P = .379) or OS (HR, 1.247; 95% CI, 0.653-2.382; P = .503) between the RT-alone and CMT groups (Figure 3). However, CMT was associated with significantly longer PFS (HR, 1.784; 95% CI, 1.164-2.732; P =.008) and OS (HR, 1.756; 95% CI, 1.111-2.774; P = .016) in patients with Ann Arbor stage I disease and risk score >0 (Figure 3). These results were robust to recommend RT alone for patients with low-risk Ann Arbor stage I disease.
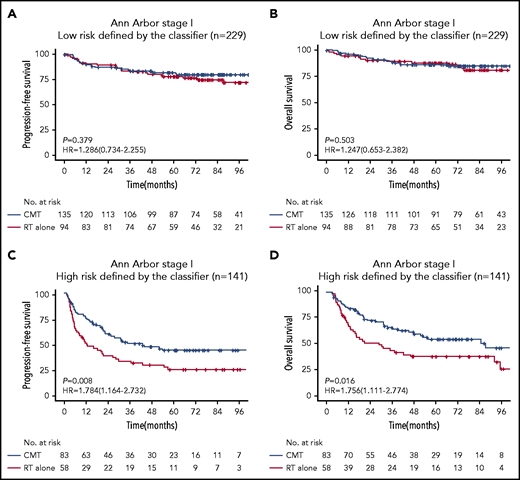
Kaplan-Meier survival analyses of Ann Arbor stage I patients with ENKTL receiving RT alone or CMT. PFS (A) and OS (B) for low-risk (risk score ≤0) patients with Ann Arbor stage I disease receiving RT vs CMT. PFS (C) and OS (D) for high-risk (risk score >0) patients with Ann Arbor stage I disease receiving RT vs CMT.
Kaplan-Meier survival analyses of Ann Arbor stage I patients with ENKTL receiving RT alone or CMT. PFS (A) and OS (B) for low-risk (risk score ≤0) patients with Ann Arbor stage I disease receiving RT vs CMT. PFS (C) and OS (D) for high-risk (risk score >0) patients with Ann Arbor stage I disease receiving RT vs CMT.
Concordance of the 7-SNP–based classifier in blood and FFPE samples
To clarify whether the individualized risk score was affected by sample types, we simultaneously detected the statuses of the 7 SNPs in the blood and FFPE samples from the same patients in the discovery set. The distributions of SNP states for the discovery set are shown in supplementary Table 3. High consistency was observed between the blood and FFPE specimens (κ coefficient >0.97; P < .001 for all). Therefore, the 7-SNP–based classifier is not restricted by sample types.
The 7-SNP–based classifier refines IPI, KPI, or PINK stratification
We stratified ENKTL patients using the clinically widely used prognostic systems (IPI, KPI, and PINK) and then used the 7-SNP–based classifier to further segregate the patients. We found that high-risk vs low-risk IPI-, KPI-, or PINK-stratified patients had significantly different survival outcomes (P < .05 for all) (Figure 4), suggesting that the 7-SNP–based classifier could complement existing risk-stratification systems in ENKTL.
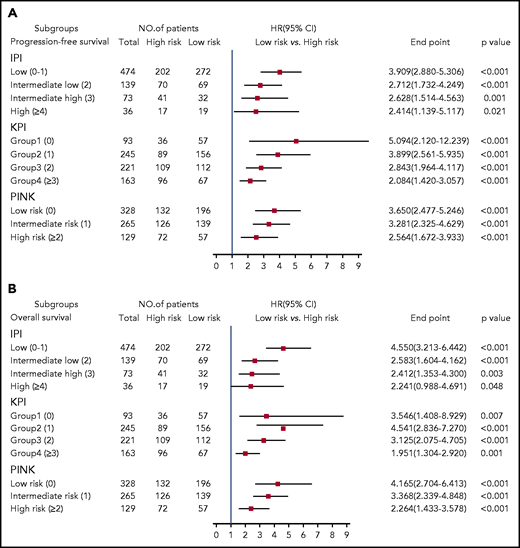
HRs of PFS and OS for all 722 patients with ENKTL according to the 7-SNP–based classifier stratified by IPI, KPI, and PINK. (A) PFS; (B) OS.
HRs of PFS and OS for all 722 patients with ENKTL according to the 7-SNP–based classifier stratified by IPI, KPI, and PINK. (A) PFS; (B) OS.
Building a predictive nomogram A
Using the data from 432 patients in the training cohort, we constructed nomogram A that integrated the 7-SNP–based classifier and other significant predictors of survival outcomes (age, Ann Arbor stage, lymphoma node involvement, nonnasal type, and LDH). The nomogram provided a quantitative method to predict the probability of PD in patients with ENKTL (Figure 5A). Calibration plots for predicting the probability of 5-year PFS showed good agreement between the predictions and observations in the 4 cohorts, and the C-indexes were 0.728 (95% CI, 0.679-0.759), 0.764 (95% CI, 0.721-0.807), 0.740 (95% CI, 0.687-0.793), and 0.769 (95% CI, 0.710-0.828) for the training cohort, the internal validation cohort, and external validation cohorts 1 and 2, respectively (supplemental Figure 7; supplemental Table 4). Moreover, the AUC of nomogram A was significantly greater than that of the 7-SNP–based classifier, IPI, KPI, and PINK (Figure 5B).
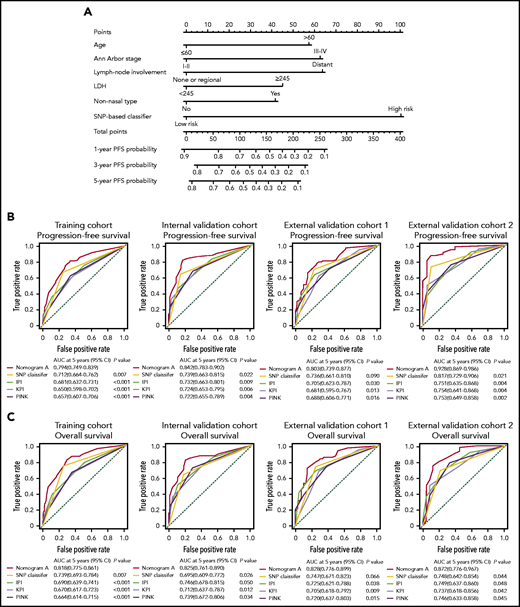
Establishing and validating a nomogram to predict PFS for patients with ENKTL received nonanthracycline-based treatment. (A) A nomogram (nomogram A) comprising the 7-SNP–based classifier, age, Ann Arbor stage, lymph node involvement, LDH, and nonnasal type was constructed to predict 1-, 3-, and 5-year PFS. Time-dependent ROC curves and AUCs for evaluating the 5-year PFS (B) and OS (C) predictive accuracy of nomogram A, IPI, KPI, and PINK in 4 cohorts.
Establishing and validating a nomogram to predict PFS for patients with ENKTL received nonanthracycline-based treatment. (A) A nomogram (nomogram A) comprising the 7-SNP–based classifier, age, Ann Arbor stage, lymph node involvement, LDH, and nonnasal type was constructed to predict 1-, 3-, and 5-year PFS. Time-dependent ROC curves and AUCs for evaluating the 5-year PFS (B) and OS (C) predictive accuracy of nomogram A, IPI, KPI, and PINK in 4 cohorts.
Building a predictive nomogram-EBV
To clarify whether the identification of plasma EBV status can improve the predictive performance of the existing model, we added the index of plasma EBV to nomogram A and constructed the novel nomogram-EBV. Pretreatment EBV-DNA data were available for 602 patients (supplemental Figures 8-9; supplemental Table 5). The C-index of nomogram-EBV (0.783; 95% CI, 0.748-0.818) was significantly greater than that of the PINK-E (PINK model with EBV data included) system (0.700; 95% CI, 0.669-0.731; P < .001; supplemental Figure 10), and the AUC of PINK-E performed significantly less well (P < .001) (supplemental Table 6). However, compared with nomogram A (C-index 0.750; 95% CI, 0.721-0.779), the predictive accuracy of nomogram-EBV was only slightly improved (P > .05) (supplemental Figure 10; supplemental Table 6).
Discussion
In this international multicenter cohort study, we constructed and validated a 7-SNP–based classifier to improve survival prediction precision for ENKTL. The PFS and OS for high- or low-risk patients defined by the classifier differed significantly in the training and validation cohorts. The predictive accuracy of the 7-SNP–based classifier was remarkably better than that of other clinicopathologic covariates. We then constructed a nomogram (nomogram A) comprising the 7-SNP–based classifier with clinicopathologic covariates, which proved to be a more accurate survival predictor than IPI, KPI, or PINK. Meanwhile, the addition of EBV status did not significantly improve the predictive performance of nomogram A.
In-depth genomic and transcriptomic analyses of ENKTL are dedicated to developing potential prognostic biomarkers; however, the efficacy stability of these markers is influenced by tumor heterogeneity and tissue specificity.19-21 In the present study, there were only 3 allelic statuses for each indicator in the 7-SNP–based classifier, which were recorded as rank variables. The application of this model is not affected by sample types and does not require adjustment for other variables. Individualized risk scores can be obtained by SNP microarray or DNA sequencing. By simply detecting the status of the 7 SNPs in blood or tumor tissue samples, clinicians can predict the prognosis of patients with ENKTL and tailor individualized therapeutic strategies based on the value calculated by the formula and the threshold provided by the classifier (http://ai.sysucc.org.cn/SNPForENKYL.html).Therefore, the classifier has universal applicability and is almost unaffected by technological differences among medical centers.
Current prognosis scoring systems, such IPI, KPI, or PINK, are composed of clinicopathological factors.22 We found that when patients in this study were stratified by the above prognostic systems, their distribution is uneven, with the vast majority of patients belonging to the low-risk group. Interestingly, the 7-SNP–based classifier can further assign subjects in the same subgroup to high- or low-risk groups with significantly different survival outcomes, indicating that it could serve as a complement to the current prognostic system.
Treatment strategies differ significantly between early-stage and advanced ENKTL.23 For patients with Ann Arbor stage I without risk factors (age >60 years, ECOG-PS ≥2, elevated LDH or primary tumor invasion), long-term survival can be achieved with RT alone.6 For patients with Ann Arbor stage I with any of the above risk factors, or for patients with Ann Arbor stage II, combined RT and chemotherapy is required.23 Meanwhile, the mortality of advanced patients with ENKTL is still high after asparaginase-based chemotherapy with or without RT.24 Our retrospective study and our preliminary analysis of an ongoing prospective study (NCT04127227) indicated that combination treatment strategies, such as anti–PD-1 antibody with P-GEMOX (pegaspargase, gemcitabine, and oxaliplatin), can markedly improve the survival of patients with advanced ENKTL.25,26 The predictive efficacy of the 7-SNP–based classifier could continue to be validated in the era of immunotherapy. In this study, we found that some differential SNP sites were located in the same gene sequence. For example, rs797016, rs10844247, and rs4931639 were colocalized in the FGD4 gene sequence, and rs73639447 and rs864696 were colocalized in the KDM4C gene sequence. This phenomenon implies that different statuses of SNP sites could affect the corresponding amino acid sequences, which are important components of the functional subunit (or “pocket structure”) of the protein. Moreover, the different statuses of these SNP sites may also be involved in the posttranscriptional regulation of genes. Molecular inhibitors that are designed to target these subunits or structures are likely to improve the survival of ENKTL. Further exploration of new strategies is crucial for the treatment of advanced ENKTL. Given that the vast majority of patients are in the early stages of the disease, patients should be further stratified so that treatment intensity can be fine-tuned according to the individual risk score. In our study, for patients with Ann Arbor stage I and risk score ≤0, there was no significant difference in survival after RT alone or a combination of RT and chemotherapy. However, patients with Ann Arbor stage I disease and risk score >0 benefited significantly from CMT. These results suggest that our classifier can complement current risk indicators, helping Ann Arbor stage I patients to choose optimal therapy (ie, RT alone or a combination therapy).
The 7 SNPs in the classifier are located in regions of the genes WDR27, UMAD1, TENM2, LINC02463, KDM4C, FGD4, and FAM71A. UMAD1, a specific sponge for microRNA-873, is associated with the level of Gal3 in the peripheral circulation and is used as a biomarker to predict lymph node metastasis of thyroid cancer.27 A study has shown that stabilization of KDM4C regulated by Wnt protein is essential for Wnt/β-catenin target gene expression and tumorigenesis, which may be a potential therapeutic target.28 KDM4C could regulate cellular proliferation with NF-κB p65 as a binding partner.29 FGD4 is closely correlated with tumor aggressiveness.30 Notably, EBV-encoded LMP1 interacts with FGD4 to activate Cdc42 and promote tumorigenesis. Whether FGD4 plays a role in the occurrence and development of ENKTL deserves further exploration.31 We speculate that this may be related to the inclusion of FGD4 in this model. FGD4 is an important molecule in the process of EBV-promoting tumor progression, and the inclusion of this indicator is equivalent to the participation of EBV to some extent. KEGG pathway and GO analyses of genes associated with the 36 differentiated SNPs demonstrated that histone acetylation, activation of the PI3K-AKT signaling pathway, and regulation of the actin cytoskeleton could play important roles in the pathophysiological mechanism of ENKTL, suggesting that patients with ENKTL may be sensitive to histone deacetylase inhibitors or PI3K inhibitors. Considering the complexity and uncertainty of the SNPs located in introns that regulate gene functions, the KEGG and GO enrichment analyses were performed using only coding SNPs as the background set (supplemental Figure 11); the results indicated that the coding SNPs were associated with positive regulation of cell death and the apoptotic process, which provided clues for further research in the field of ENKTL.32
The limitations of our study should be noted. First, the ethnic universality of the 7-SNP–based classifier has not been demonstrated, because only samples (Asian, White, and Hispanic) from China, Singapore, and the United States were included. Second, the biological mechanisms of WDR27, TENM2, LINC02463, and FAM71A that affect the prognosis of ENKTL patients have not been fully elucidated. Third, our SNP classifier and nomogram need to be validated further, and a prospective multicenter cohort study (NCT04423536) is ongoing.
In summary, the 7-SNP–based classifier is a complement to the existing risk-stratification systems in ENKTL, which may have significant implications for clinical decision making for ENKTL patients.
Acknowledgments
The sponsors had no role in study design, data collection and analysis, or report writing.
This work was supported by grants from the National Natural Science Foundation of China (81672686, 81973384), Special Support Program of Sun Yat-sen University Cancer Center (PT19020401), Science and Technology Planning Project of Guangzhou, China (202002030205), Clinical Oncology Foundation of the Chinese Society of Clinical Oncology (Y-XD2019-124), and the Singapore Ministry of Health’s National Medical Research Council (NMRC-OFLCG-18May0028 and NMRC-TCR-12Dec005 [S.T.L.] and NMRC-ORIRG16nov090 [C.K.O.]).
Authorship
Contribution: Q.-Q.C. and X.-P.T. conceived and designed the study; X.-P.T. and S.-Y.M. developed the methodology; X.-P.T. analyzed and interpreted data; Q.-Q.C., X.-P.T., and S.-Y.M. provided administrative, technical, or material support; Q.-Q.C. supervised the study; and all authors acquired data, wrote, reviewed and/or revised the manuscript, and approved the final revision.
Conflict-of-interest disclosure: The authors declare no competing financial interests.
Correspondence: Qing-Qing Cai, Department of Medical Oncology, Sun Yat-sen University Cancer Center, 651 Dongfeng Rd East, Guangzhou 510060, China; e-mail: caiqq@sysucc.org.cn.
The data reported in this article have been deposited in the Research Data Deposit public platform (accession number RDDA2021001837).
Data sharing requests should be sent to Qing-Qing Cai (caiqq@sysucc.org.cn).
The online version of this article contains a data supplement.

This feature is available to Subscribers Only
Sign In or Create an Account Close Modal