

Key Points
Sca-1–CD51+ microenvironment cells are predominantly located in trabecular bone lining regions and near the growth plate in mice.
Cell surface expression of PDGFRα and/or PDGFRβ identify 4 populations of Sca-1–CD51+ cells with distinct functions.
Visual Abstract

Abstract
Hematopoiesis is extrinsically controlled by cells of the bone marrow microenvironment, including skeletal lineage cells. The identification and subsequent studies of distinct subpopulations of maturing skeletal cells is currently limited because of a lack of methods to isolate these cells. We found that murine Lin–CD31–Sca-1–CD51+ cells can be divided into 4 subpopulations by using flow cytometry based on their expression of the platelet-derived growth factor receptors ⍺ and β (PDGFR⍺ and PDGFRβ). The use of different skeletal lineage reporters confirmed the skeletal origin of the 4 populations. Multiplex immunohistochemistry studies revealed that all 4 populations were localized near the growth plate and trabecular bone and were rarely found near cortical bone regions or in central bone marrow. Functional studies revealed differences in their abundance, colony-forming unit–fibroblast capacity, and potential to differentiate into mineralized osteoblasts or adipocytes in vitro. Furthermore, the 4 populations had distinct gene expression profiles and differential cell surface expression of leptin receptor (LEPR) and vascular cell adhesion molecule 1 (VCAM-1). Interestingly, we discovered that 1 of these 4 different skeletal populations showed the highest expression of genes involved in the extrinsic regulation of B lymphopoiesis. This cell population varied in abundance between distinct hematopoietically active skeletal sites, and significant differences in the proportions of B-lymphocyte precursors were also observed in these distinct skeletal sites. This cell population also supported pre-B lymphopoiesis in culture. Our method of isolating 4 distinct maturing skeletal populations will help elucidate the roles of distinct skeletal niche cells in regulating hematopoiesis and bone.
Introduction
Postnatal hematopoiesis primarily occurs in the bone marrow and is reliant on interactions with bone marrow microenvironment cells.1 Studies over the past 10 years have identified numerous microenvironment cell types2-17 and regulatory factors13,15,16,18-22 required for hematopoiesis and have begun to illustrate a complex hierarchy of multipotent skeletal stem cells and lineage-committed bone marrow stromal cells (also known as bone-marrow derived mesenchymal stem and progenitor cells).2-4 These cell types have been identified primarily by their differential expression of cell surface markers or by use of fluorescent reporter mice. These studies have provided considerable insight into the roles of primitive skeletal stem and progenitor cells in the regulation of hematopoietic cells (particularly leptin receptor–expressing mesenchymal stromal cells [LepR-MSCs]6,15,16,23 and nestin-green fluorescent protein [nestin-GFP+] cells12,14 ), but less is known about the nature of relatively mature skeletal progenitor cell populations.
Skeletal progenitors are essential components of hematopoietic niches, including important roles in regulating B lymphopoiesis.18-20,24-27 Skeletal lineage cells are derived from skeletal stem cells and include cells at different stages of differentiation, including chondrogenic precursors, pre-adipocytes, pre-osteoblasts, mature bone-forming osteoblasts, bone lining cells, and osteocytes. These cell populations exist in the hematopoietic and endothelial cell-depleted Sca-1–CD51+ fraction of collagenase-digested bone.28,29 It has been recognized, however, that there is a range of distinct skeletal progenitors within the Sca-1–CD51+ population.30 It is important to further purify these more mature populations of skeletal progenitors to enable studies of their roles in hematopoiesis and bone turnover.
Here, we isolated and characterized 4 subpopulations of Sca-1–CD51+ cells obtained from collagenase-digested long bones based on their expression of the platelet-derived growth factor receptors ⍺ and β (PDGFR⍺ and PDGFRβ). Functional and profiling studies revealed that these 4 subpopulations were distinct, having different clonogenic and differentiation potential, localization in bone marrow sections, gene expression profiles, and differential support of B lymphopoiesis.
Methods
Mice
All in vivo experiments were approved by the St Vincent’s Health Animal Ethics Committee and performed in strict compliance with the Australian Code of Practice for the Care and Use of Animals for Scientific Purposes. Lineage tracing studies used wild-type Prrx1-Cre (B6.Cg-Tg(Prrx1-cre)1Cjt/J),31 Nestin-Cre (B6.Cg-Tg(Nes-cre)1Kln/J),32 Col2a1-Cre,33 Osx1-GFP::Cre (B6.Cg-Tg(Sp7-tTA,tetO-EGFP/cre)1Amc/J),34 and Dmp1-Cre (B6N.FVB-Tg(Dmp1-cre)1Jqfe/Bwdj)35 mice, all crossed with Rosa26-loxP-stop-loxP–enhanced yellow fluorescent protein (R26-stop-EYFP; B6.129X1-Gt(ROSA)26Sortm1(EYFP)Cos/J)36 mice. All mice were backcrossed onto the C57BL/6 background. Nes-Cre and Prrx1-Cre mice with germline activation of Cre were excluded, as previously described.37,38 Mice were housed in individual ventilated cages in groups with access to food and water ad libitum and a 12-hour light/dark cycle.
Flow cytometry (fluorescence-activated cell sorting [FACS]) and in vitro analyses
These protocols are described in detail in supplemental Methods, available on the Blood Web site and as described previously.10,39-41
Multiplex immunofluorescence imaging and spatial localization studies
Tibias from 12-week-old male reporter mice were processed, and multiplex immunofluorescence labeling was performed using an Opal Kit (Akoya Biosciences, Marlborough, MA), as described previously.37,42 Full details on staining, antibodies, and localization analysis are provided in supplemental Methods (supplemental Tables 2-4). Whole slide scans were performed using the Vectra Automated Quantitative Pathology Imaging System (Akoya Biosciences) and visualized using Fiji software.43
Statistical analysis
All data were graphed and statistical analyses were performed using Prism 8 (GraphPad Software, La Jolla, CA), and data were plotted as mean ± standard deviation (SD). Statistical analyses are indicated in all figure legends. Extreme Limiting Dilution Analysis (ELDA) software44 was used for analyzing limiting dilution experiments.
Results
PDGFR⍺ and PDGFRβ expression identified 4 subpopulations of Sca-1–CD51+ cells
We first profiled 2 populations of skeletal stem and progenitor cells that were isolated on the basis of lack of expression of hematopoietic and endothelial cell markers and were further subdivided on the basis of their expression of CD51 and Sca-1 (Figure 1A). Sca-1+ cells are highly clonogenic, have multilineage potential, and are more primitive than Sca-1– cells.7,29,45-47 The Sca-1–CD51+ population is known to be heterogeneous.
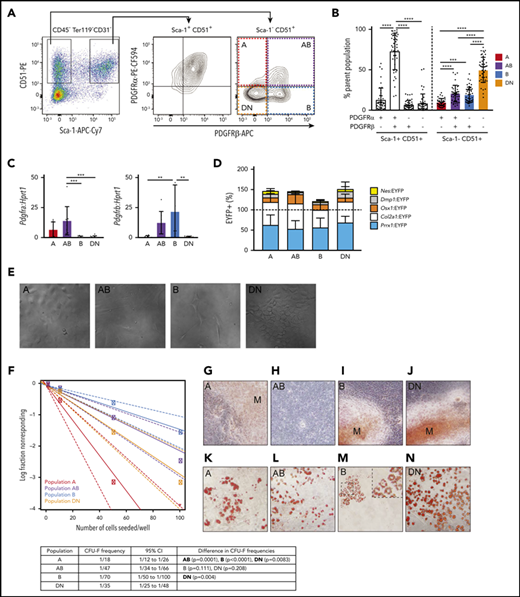
PDGFR⍺ and PDGFRβ expression identifies 4 subpopulations within Sca-1– CD51+ cells that differ in their potential to form CFU-F, mineralized osteoblasts, and adipocytes in culture. (A) Representative FACS plots show viable CD45–Ter119–CD31– cells with gates for Sca-1+CD51+ and Sca-1–CD51+ bone-derived cells and the expression of PDGFR⍺ and PDGFRβ within these populations. (B) Proportions of the PDGFR⍺+PDGFRβ–, PDGFR⍺+PDGFRβ+, PDGFR⍺–PDGFRβ+, and PDGFR⍺–PDGFRβ– cells in Sca-1+CD51+ and Sca-1–CD51+ (termed A, AB, B, and DN, respectively) populations (n = 45 mice pooled from >10 separate experiments). (C) Messenger RNA (mRNA) expression of Pdgfra and Pdgfrb in A, AB, B, and DN sorted cells. (D) The percentages of EYFP+ cells within the A, AB, B, and DN populations in each Cre reporter. Data are mean ± SD. Mice were pooled from separate experiments (Prrx1:EYFP, n = 7; Nes:EYFP, n = 6; Col2a1:EYFP, n = 3; Osx1:EYFP, n = 12; Dmp1:EYFP, n = 4). (E) Representative digital interference contrast photos of the different cell populations at 7 days of culture; images are cropped from pictures taken at original magnification, ×20. (F) A limiting dilution assay using ELDA (n = 24) determined the CFU-F frequencies (solid line) of A, AB, B, and DN cells; 95% confidence intervals are indicated by dashed lines. The table shows CFU-F frequencies for each population and a pairwise test for differences in CFU-F frequencies (significant differences are shown in bold). (G-N) Freshly sorted A, AB, B, and DN cells were seeded at 1000 cells per well into a 96-well plate and allowed to expand for 1 week to reach confluence, then cultured in osteogenic or adipogenic media for 14 days. Staining for minerals was performed on populations at day 14: Alizarin Red, A, AB, B, and DN cells (G-J); and Oil Red O, adipocytes (K-N). Original magnification for all images. ×40; all photos are representative of 5 osteogenic and 4 adipogenic independent experiments with 3 to 6 wells per population. One-way analysis of variance (ANOVA) with Tukey’s multiple comparisons test: **P < .01; ***P < .001; ****P < .001. APC, allophycocyanin; Cy7, cyanine; PE, phycoerythrin.
The Sca-1+CD51+ cells predominantly expressed markers associated with pericytes and fibroblasts (supplemental Figure 1A-E). In contrast, Sca-1–CD51+ cells had the highest expression of osteoblastic and chondrocyte markers, but they also expressed some markers consistent with bone marrow LepR+ cells (termed LepR-MSCs by Baryawno et al23 ) and pericyte populations (supplemental Figure 1). The majority of the Sca-1+CD51+ and Sca-1–CD51+ cells were targeted by skeletal lineage reporter mice (supplemental Figure 1F) and, with the exception of FMS-related tyrosine kinase 3 ligand (Flt3l), the Sca-1–CD51+ cells exhibited higher expression of some key extrinsic regulators of developing B lymphocytes (supplemental Figure 1G). We therefore focused on further purifying Sca-1–CD51+ cells using other cell surface markers.
Sca-1+CD51+ cells express PDGFR⍺,6,7 and bone marrow perivascular cells express PDGFRβ,48 so we examined their expression in Sca-1+CD51+ and Sca-1–CD51+ cells (Figure 1A). The majority of Sca-1+CD51+ cells were PDGFR⍺+PDGFRβ+, whereas the Sca-1–CD51+ population was separated into 4 distinct subpopulations based on their expression of PDGFR⍺ and/or PDGFRβ (Figure 1A-B). We defined these 4 populations as A (PDGFR⍺+PDGFRβ–), AB (PDGFR⍺+PDGFRβ+), B (PDGFR⍺–PDGFRβ+), and double negative or DN (PDGFR⍺–PDGFRβ–) (Figure 1A-B). Quantitative polymerase chain reaction (qPCR) studies of sorted cells confirmed their expression (or lack thereof) of Pdgfra and/or Pdgfrb (Figure 1C). The proportions of these cell populations in total digested bone cells were A, 0.089% ± 0.066%; AB, 0.257% ± 0.088%; B, 0.481% ± 0.198%, and DN, 1.232% ± 0.734% (mean ± SD; data are representative of 7 different experiments).
To identify the lineage derivation of A, AB, B, and DN populations, we performed lineage tracing in the long bones. We used Cre+EYFP+ mice that represent different skeletal lineage origins, including Nes:EYFP (neural crest–derived cells), Prrx1:EYFP (limb-bud–derived cells), Col2a1:EYFP (chondrogenic cells and early skeletal progenitors), Osx1:EYFP (osteoprogenitor cells), and Dmp1:EYFP (late osteoblasts). The use of the EYFP reporter mice meant that all cells expressing these Cre promoters and their progeny would be EYFP+, which enabled detection using FACS. The majority of cells in all populations were targeted by Prrx1-Cre and/or Col2a1-Cre, with only a small proportion of cells targeted by Nes-Cre, Osx1-Cre, or Dmp1-Cre (Figure 1D). Although some reporters target non-overlapping cell origins (eg, Nes-Cre and Prrx1-Cre),18 there must be some overlap between the other reporters (eg, Col2a1-Cre and Prrx1-Cre) because, collectively, the proportion of cells targeted by all of the reporter mice used in this study totaled more than 100% (Figure 1D).
A, AB, B, and DN populations identify cells with different lineage potential and CFU-F capacity
Culture studies revealed that the A and DN cells were small cobblestone-like cells, the AB cells were large blanket-like cells, and the B cells were large spindle-shaped cells (Figure 1E). Some cells with the morphology of AB and B cells were also observed in cultures of DN cells (data not shown). We assessed the frequency of colony-forming units-fibroblast (CFU-F) by using limiting dilution assays of the fibroblastic colonies formed by the A, AB, B, and DN populations. All populations were capable of forming colonies (Figure 1F); however, the frequencies of cells that formed colonies were lower than has been reported for Sca-1+ cells.6,7 The A cells had significantly higher potential to form colonies compared with the other cell types (Figure 1F).
The A, B, and DN cells formed minerals in osteogenic culture conditions, indicating that they could form osteoblasts (Figure 1G,I-J). In contrast, the AB cells did not mineralize (Figure 1H), even after prolonged culture in osteogenic conditions (data not shown). In culture conditions that permitted the formation of adipocytes, lipid-filled vacuoles were observed in the cytoplasm of A, AB, and DN cells (Figure 1K-L,N). In comparison, the cultures of B cells showed sparse Oil RedO–stained lipid in the cell membrane, not within the cytoplasm, indicating that these cells were not adipocytes (Figure 1M).49 Collectively, these studies showed that the A and DN cells could differentiate into both osteoblasts and adipocytes, the AB cells formed adipocytes but not osteoblasts, and the B cells formed osteoblasts but not adipocytes in vitro; however, we have not validated lineage potential with in vivo transplantation assays, which are warranted to confirm their nature.
A, AB, B, and DN cells reside in trabecular bone regions
We used Opal multiplex immunohistochemistry (IHC) on tibial sections from the different EYFP+ reporter mice to identify all 4 populations in situ. Interestingly, these studies revealed that the Sca-1–CD51+ cells were largely restricted to the endosteal bone surface, with very few CD51+EYFP+ cells observed in the central marrow area (Figure 2; supplemental Figures 2 and 3). Sca-1–CD51+ cells predominantly lined bone and were most abundantly located adjacent to the growth plate and in the primary spongiosa, with very few Sca-1–CD51+ cells lining the cortical bone (Figure 2). Comparatively, many cells that expressed PDGFR⍺ and/or PDGFRβ lined the cortical bone surface, but these cells did not express CD51. Furthermore, we observed EYFP+ skeletal cells lining trabecular bone that likewise lacked expression of CD51 in Prrx1:EYFP+ or Col2a1:EYFP+ mice (supplemental Figure 2B).
![A, AB, B, and DN cells predominantly line trabecular bone. Shown are representative images of multiplexed IHC in Prrx1:EYFP mice tibias. Color vision deficiency compatible images are shown in supplemental Figure 8. Mouse tibial sections were stained for the same markers used to identify the distinct microenvironment cell populations by FACS, scanned using a Vectra Automated Quantitative Pathology Imaging System, and visualized using Fiji software. Shown are Sca-1 (Opal 520, red), EYFP (Opal 540, green), CD51 (Opal 650, yellow), PDGFR⍺ (Opal 570, cyan), PDGFRβ (Opal 620, magenta), nuclei (4′,6-diamidino-2-phenylindole [DAPI], white); hematopoietic lineage staining was excluded for visualization purposes but is shown in supplemental Figure 2. All images are shown as a composite image with all markers and individual staining for each field of view shown on the right. Three regions of interest were examined: growth plate (A-B), trabecular bone (C), and metaphyseal cortical bone (D). Dotted red lines indicate the border of trabecular and cortical bone. Colored arrowheads indicate populations A (red arrowhead; PDGFR⍺+PDGFRβ–), AB (purple arrowhead; PDGFR⍺+PDGFRβ+), B (blue arrowhead; PDGFR⍺–β+) and DN (orange arrowhead; PDGFR⍺–PDGFRβ–), which are all Sca-1–EYFP+CD51+lin–. (E) Representative single-cell images of A, AB, B, and DN microenvironment cells. Arrowheads point to the single cell shown on each individual panel. Scale bar, 100 µm. Images have been thresholded, brightness and contrast were adjusted equally for visualization purposes, and all analyses were performed on raw data. C, cortical bone; GP, growth plate; T, trabecular bone.](https://ash.silverchair-cdn.com/ash/content_public/journal/blood/138/4/10.1182_blood.2020005865/4/m_bloodbld2020005865f2.png?Expires=1765886011&Signature=tr0wEDu3RN2sNAcjIziWjsYgSu-xgau-dpqvPbM0uvT5ahdNzcD2Y0GwFztAQp5~xcVrNr3FPaywAj3kYqNYpz-CosN8b9zO4c9hzu2dGugXud0YKl8e5bWFPqUwShgmhLq7xUwNUAQNH9I5JyvnY6yaDckxXQ52HXZQ2QeB1RljiltJE2frKbMwDFRH9fXonNdQeaVGytLhGen2ZVeBQlkDB2Onwv8P6AuuQcTO9Ar5zgmbPMWyb8vFHcUpdI4RWDhYv4TctQYkma7pcYnWTzUDJm1XCSOtVmV5EVejLAzZez5kHh37fPV5p8zRJJfQt4Xn8lq6y44Gd6H3V9NQ8w__&Key-Pair-Id=APKAIE5G5CRDK6RD3PGA)
A, AB, B, and DN cells predominantly line trabecular bone. Shown are representative images of multiplexed IHC in Prrx1:EYFP mice tibias. Color vision deficiency compatible images are shown in supplemental Figure 8. Mouse tibial sections were stained for the same markers used to identify the distinct microenvironment cell populations by FACS, scanned using a Vectra Automated Quantitative Pathology Imaging System, and visualized using Fiji software. Shown are Sca-1 (Opal 520, red), EYFP (Opal 540, green), CD51 (Opal 650, yellow), PDGFR⍺ (Opal 570, cyan), PDGFRβ (Opal 620, magenta), nuclei (4′,6-diamidino-2-phenylindole [DAPI], white); hematopoietic lineage staining was excluded for visualization purposes but is shown in supplemental Figure 2. All images are shown as a composite image with all markers and individual staining for each field of view shown on the right. Three regions of interest were examined: growth plate (A-B), trabecular bone (C), and metaphyseal cortical bone (D). Dotted red lines indicate the border of trabecular and cortical bone. Colored arrowheads indicate populations A (red arrowhead; PDGFR⍺+PDGFRβ–), AB (purple arrowhead; PDGFR⍺+PDGFRβ+), B (blue arrowhead; PDGFR⍺–β+) and DN (orange arrowhead; PDGFR⍺–PDGFRβ–), which are all Sca-1–EYFP+CD51+lin–. (E) Representative single-cell images of A, AB, B, and DN microenvironment cells. Arrowheads point to the single cell shown on each individual panel. Scale bar, 100 µm. Images have been thresholded, brightness and contrast were adjusted equally for visualization purposes, and all analyses were performed on raw data. C, cortical bone; GP, growth plate; T, trabecular bone.
Multiplex IHC revealed that A, B, AB, and DN populations identified by FACS resided in endosteal regions. The highest proportions of EYFP+ A, AB, B, and DN cells were observed in sections obtained from Prrx1:EYFP (Figure 2; supplemental Figure 2A) and Col2a1:EYFP mice (supplemental Figure 2B), although some cells were also detectable in sections from Dmp1:EYFP, Osx1:EYFP, and Nes:EYFP mice (supplemental Figure 2C-E), consistent with the results of the FACS lineage tracing studies (Figure 1D). Interestingly, the majority of these cell populations were found lining the growth plate and trabecular bone regions, but were virtually absent along cortical bone, except in cortical bone regions close to the growth plate (Figure 2; supplemental Figure 2A-E).
Lin–CD45–CD31–Sca-1–CD51+ cells can also be detected in mouse bone marrow cells.30 Our FACS studies found that these bone marrow–derived cells were predominantly PDGFR⍺–PDGFRβ– (supplemental Figure 3E-F). However, when first gating for Col2a1:EYFP+ cells, we identified a subpopulation of EYFP+Sca-1–CD51+PDGFR⍺+PDGFRβ+ cells in the bone marrow (supplemental Figure 3G-H). These Col2a1:EYFP+ AB and DN cells are very rare cells (percentage of total bone marrow [mean ± SD]: AB, 0.008 ± 0.002; DN, 0.028 ± 0.014; n = 3). We did not focus on locating these cells in the bone marrow regions devoid of bone; however, we did find a candidate AB cell surrounding an artery (supplemental Figure 3D).
To document the spatial localization of the distinct cell types in the different bone regions of the tibias, we used an approach similar to that of Christodoulou et al50 with bone sections obtained from Prrx1:EYFP mice (Figure 3; supplemental Figure 4). We first allocated each of the individual cells identified in sections obtained from 4 Prrx1:EYFP mice to 3 distinct bone regions (growth plate, metaphysis, and diaphysis). The proportions of the 4 different cell types in each region were averaged across the 4 different mice, and these were compared with each other and to random dots (Figure 3A; supplemental Figure 4A). These studies revealed that the A cells were more abundantly located near the growth plate than the random dots (Figure 3A-B). All populations were distributed at similar proportions to the random dots in the metaphysis region (Figure 3C), whereas there were significantly fewer A and DN cells detected in the diaphysis compared with the random dots (Figure 3D).
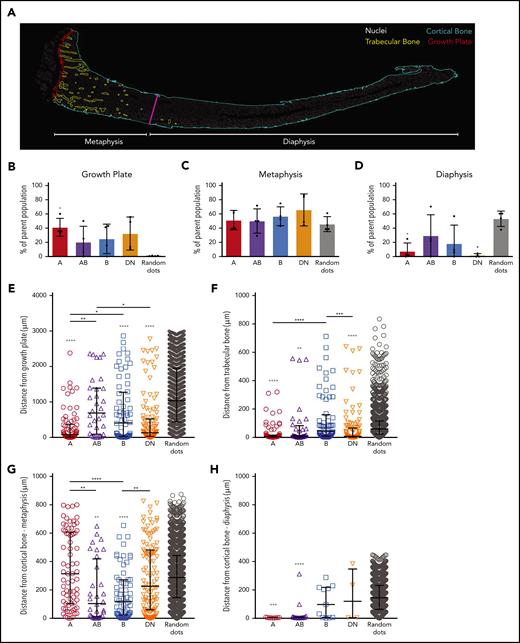
The spatial localization of A, AB, B, and DN cells in mouse tibias. (A) A representative image of a whole tibia from a Prrx1:EYFP mouse used for localization studies with the different colors defining the growth plate (red), trabecular bone (yellow), cortical bone (light blue), and border of metaphysis to diaphysis (magenta), the latter defined as being ≥3000 µm from the growth plate. Nuclei (white) highlights the bone marrow cells. (B-D) The proportions of the different cell types are shown for the growth plate (B), metaphysis (C), and diaphysis regions (D). Data are presented as mean ± SD from 4 Prrx1:EYFP mice. (E-H) Shown are the distances of individual cells within the metaphysis region to the growth plate (E), trabecular bone (F), and metaphyseal cortical bone (G) and within the diaphyseal region to the cortical bone (H). Data are presented as median with interquartile range (n = 4 Prrx1:EYFP mice). Gray asterisks directly above each data set are comparisons to random dots, and the asterisks above the bars highlight differences between distinct cell populations. Data were analyzed using 1-way ANOVA with Tukey’s multiple comparisons test (B-D) or Kruskal-Wallis test with Dunn’s multiple comparisons test (E-H). *P < .05; **P < .01; ***P < .001; ****P < .0001.
The spatial localization of all individual cells that were not located within 10 μm of the growth plate was then determined in sections obtained from 4 Prrx1:EYFP mice. The exact distance of each individual cell to the different bone types within the metaphysis (containing growth plate, trabecular bone, and cortical bone; Figure 3E-G) and the diaphysis (containing cortical bone; Figure 3H) was calculated. The spatial localization data for each cell type was compared with each of the other cell populations and to that of the random dots (Figure 3E-H). Because of the close proximity of some areas of the growth plate, trabecular bone, and metaphyseal cortical bone (Figure 3A), we also generated XY plots to determine whether any of these cells closely associated with ≥2 of these bone types (supplemental Figure 4B-G). The A and DN cells predominantly localized close to the growth plate and/or trabecular bone but not cortical bone, with the exception of a rare population of A cells that were detected within 10 µm of the diaphyseal cortical bone (Figure 3E-H; supplemental Figure 4). In contrast, the B cells were located significantly closer to the growth plate and/or metaphyseal cortical bone compared with the random dots (Figure 3E-H; supplemental Figure 4). The AB cells were significantly closer to trabecular and cortical bone but not the growth plate (Figure 3E-H; supplemental Figure 4).
A, AB, B, and DN populations have differential expression of skeletal genes
Microarray analysis and qPCR validation revealed differential expression of osteoblastic and chondrogenic genes (defined in Baryawno et al23 ) between the A, AB, B, and DN populations (Figure 4A-D; supplemental Figure 5). The AB and B cells expressed more osteoblastic genes compared with the A and DN cells (Figure 4A,C). In comparison, the A and DN cells highly expressed genes associated with chondrocytes (Figure 4B,D), consistent with their abundant localization near the growth plate (Figures 2 and 3). All populations expressed Alpl and the early osteoblast lineage transcription factor Runx2, intermediate osteoblast markers Sp7 (encoding Osterix) and Pth1r, and the mature osteoblast marker Bglap (Figure 4A,F-I), whereas Sost was detected only in the B and DN cells (Figure 4J).
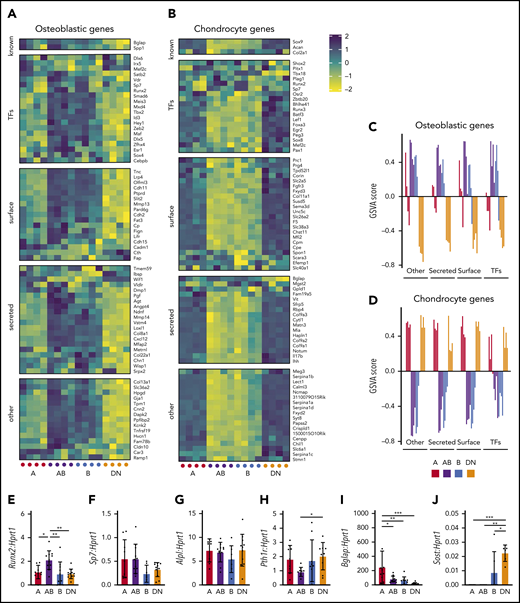
AB and B cells express osteoblastic genes, whereas A and DN cells express chondrocyte genes. (A-B) Shown are the expression of gene sets described by Baryawno et al23 for osteoblastic (A) and chondrogenic (B) genes in microarrays of cells of each population. (C-D) Gene set variation analysis (GSVA) for osteoblastic (C) and chondrocyte (D) gene sets. Data represent 4 independent experiments with cells obtained from 4 mice per experiment. (E-J) Gene expression qPCR validation of Runx2 (E), Sp7 (F), Alpl (G), Pth1r (H), Bglap (I), and Sost (J). Data represent 7 independent experiments with cells pooled from 3 to 4 mice. All data are mean ± SD. One-way ANOVA with Tukey’s multiple comparisons test: *P < .05; **P < .01; ***P < .001. TFs, transcription factors.
We also investigated the expression of genes expressed by bone marrow LepR+ MSCs, pericytes, and fibroblasts23 in the Sca-1–CD51+ subpopulations (Figure 5A-D; supplemental Figure 5B-C). The AB cells expressed high levels of genes expressed by bone marrow LepR+ MSCs, whereas the other populations had lower expression of these genes (Figure 5A,C). In comparison, the pericyte and fibroblast gene sets did not conclusively define any of the populations, although some genes were notably higher in the B and AB populations (Figure 5B,D; supplemental Figure 5B-C). We validated the expression of some genes by qPCR and found no differences in preadipocyte genes associated with LepR+ MSCs (Pparg, Cebpa, or Adipoq) (Figure 5E-G). Pericyte-associated gene Acta2 expression was significantly higher in AB cells than in A and DN populations and was also detectable in the B population (Figure 5H). FACS analyses revealed that significant proportions of all 4 cell populations expressed both leptin receptor (LEPR) and vascular cell adhesion molecule 1 (VCAM-1) (Figure 5I-L). Although the AB cells expressed LEPR and VCAM-1 most abundantly, the A population had a subpopulation of LEPRbright cells with significantly higher LEPR mean fluorescence intensity compared with the other LEPR+ cells in each population (Figure 5I-L; supplemental Figure 5D).
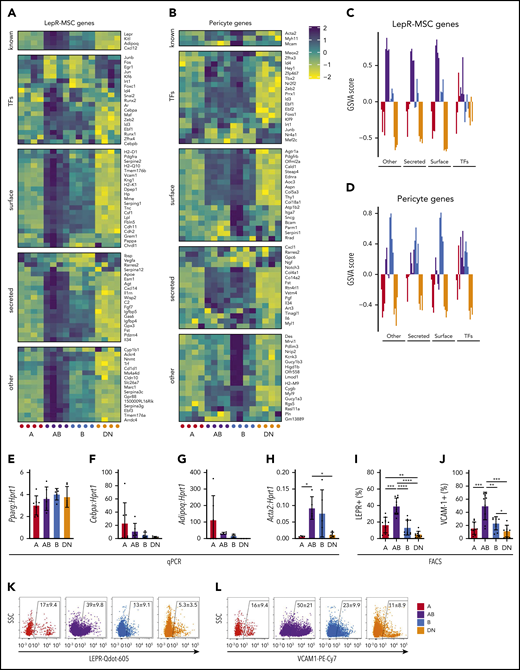
AB cells exhibit a LepR-MSC gene expression profile. (A-B) Shown are the expression of gene sets described by Baryawno et al23 for LepR-MSCs (A) and pericyte (B) genes in microarrays of cells from each population. (C-D) GSVA for LepR-MSC (C) and pericyte (D) gene sets (n = 4 independent experiments with cells obtained from 4 mice per experiment). (E-H) Gene expression qPCR validation of Pparg (E), Cebpa (F), Adipoq (G), and Acta2 (H) (n = 7 independent experiments of cells pooled from 3 to 4 mice). (I-L) Shown are the proportions of A, AB, B, and DN cells expressing cell surface LEPR (n = 10; I) and VCAM1 (n = 9; J) and representative FACS plots of LEPR (K) and VCAM1 (L) for each population. All data are mean ± SD. One-way ANOVA with Tukey’s multiple comparisons test: *P < .05; **P < .01; ***P < .001; ****P < .0001.
The proportions of hematopoietic cell types and AB and B skeletal cells vary in distinct skeletal sites
We discovered that different skeletal sites such as calvaria, long bones, and vertebrae had significant differences in their hematopoietic support potential (Figure 6; supplemental Figure 6A-D). The proportions of repopulating long-term and short-term hematopoietic stem cells (LT-HSCs and ST-HSCs)51 were significantly lower in the long bones than in calvaria and vertebrae (Figure 6A). The proportions of multipotent progenitor (MPP) populations MPP3 and MPP4, but not MPP2, were significantly increased in calvaria compared with long bones (Figure 6A). The proportions of pre-megakaryocyte/erythroid progenitors, megakaryocyte progenitors, and pre-granulocyte-macrophage progenitors52 were significantly reduced in the long bones compared with calvaria and vertebrae, and the proportions of pre-CFU-erythrocyte (pre-CFU-E) cells were higher in calvaria than in long bones (Figure 6B). In contrast, the proportions of granulocyte-macrophage progenitors were increased in long bones compared with calvaria (Figure 6B).
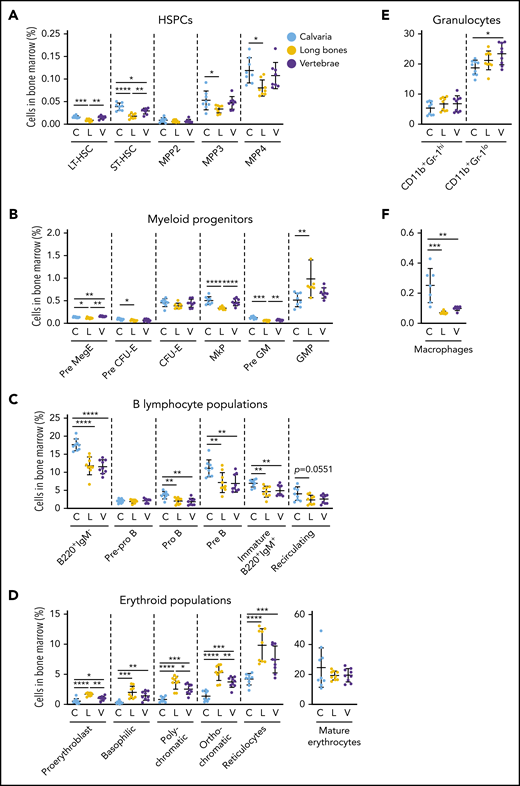
Hematopoiesis varies in distinct skeletal sites. Bone marrow was isolated from mouse calvaria, long bones, and vertebrae, and the proportions of hematopoietic populations were identified by flow cytometry. The proportion of HSPCs (A), myeloid progenitors (B), B-lymphocyte populations (C), erythroid populations (D), granulocytes (E), and macrophages (F) varied by skeletal site. All data are mean ± SD, pooled from 3 independent experiments (n = 7 to 9 mice per cell type). One-way ANOVA with Tukey’s multiple comparisons test: *P < .05; **P < .01; ***P < .001; ****P < .0001. C, calvaria; GMP, granulocyte-macrophage progenitor; L, long bones; MkP, megakaryocyte progenitor; Pre GM, pregranulocyte-macrophage progenitor; Pre MegE, premegakaryocyte/erythroid progenitor; V, vertebrae.
The proportions of B220+IgM– B lymphocytes (pro-B and pre-B) and immature B220+IgM+ B lymphocytes37 were all significantly increased in calvaria compared with long bones and vertebrae, whereas mature recirculating B lymphocytes were comparable (Figure 6C). Conversely, long bones had significantly higher proportions of all erythroid progenitors53 but similar proportions of mature erythrocytes compared with both calvaria and vertebrae (Figure 6D). The proportions of immature granulocytes54 were significantly increased in vertebrae compared with calvarium (Figure 6E). The proportions of macrophages55 were increased in calvaria compared with long bones and vertebrae (Figure 6F).
AB cells express high levels of immature B-lymphocyte regulatory factors and support B lymphopoiesis
The majority of A, AB, B, and DN cells in the calvaria and vertebrae were targeted by Col2a1-Cre and Osx1-Cre (Figure 7A; supplemental Figure 7A-B), whereas those in the long bone cells were predominantly Prrx1-Cre- and Col2a1-Cre–targeted cells. The proportions of AB cells were significantly higher in the calvaria bone compared with long bones and vertebrae, and the B cells were more abundant in calvaria than long bones (Figure 7B; supplemental Figure 7C).
![AB cells support B lymphopoiesis. (A) The percentages of eYFP+ cells within the A, AB, B, and DN populations in each Cre reporter. Data are mean ± SD (n = 3 mice per reporter, from 3 individual experiments). (B) Shown are the proportions of A, AB, B, and DN populations in calvaria, long bones, and vertebrae (n = 7 mice). (C) Heatmap showing microarray expression of B-lymphocyte regulatory factors in A, AB, B, and DN cells (n = 4 independent experiments of cells pooled from 4 mice). (D-I) Gene expression qPCR validation for Flt3l (D), Cxcl12 (E), Kitl (membrane bound [m]) (F), Kitl (secreted [s]) (G), Il7 (H), and Tnfsf11 (I) (n = 7 independent experiments of cells pooled from 3 to 4 mice). All data are mean ± SD. (J) Schematic showing coculture of pro-B lymphocytes with A, AB, B, or DN cells for 7 days, which were then assessed for the proportions of B-lymphocyte populations by FACS or transferred onto OP9 cells for an additional 7 days. (K) The proportions of pro-B, pre-B, and IgM+ B lymphocytes after 7 days of coculturing pro-B lymphocytes with A (n = 7), AB (n = 15), B (n = 9), or DN (n = 15) cells. (L) The proportions of pro-B, pre-B, and IgM+ B lymphocytes after coculturing pro-B lymphocytes with A, AB, B, or DN cells for 7 days, followed by 7 days coculture with OP9 cells. Data are shown only for cultures that produced B lymphocytes: A (n = 4), AB (n = 8), B (n = 6), or DN (n = 4). (M) The proportions of wells containing B lymphocytes after 7 days coculture with A, AB, B, and DN cells, and then 7 days after transfer onto OP9 cells. (N) Schematic showing coculture of pre-B lymphocytes with A, AB, B, or DN cells for 7 days, which were then analyzed for the proportions of B-lymphocyte populations. (O-P) The numbers of viable pre-B lymphocytes (O) and IgM+ B lymphocytes (P) after 7 days of coculture with pre-B lymphocytes with A (n = 5), AB (n = 9), B (n = 12), or DN (n = 16) cells. One-way ANOVA with Tukey’s multiple comparisons test: *P < .05; **P < .01; ***P < .001; ****P < .0001. C, calvaria; L, long bones; V, vertebrae.](https://ash.silverchair-cdn.com/ash/content_public/journal/blood/138/4/10.1182_blood.2020005865/4/m_bloodbld2020005865f7.png?Expires=1765886011&Signature=LlPCupRWckOe9b2k0tAwOMX8x5KhyUNI5epVuvBbmP5-R4GKbFOjbwJoTzEuRG9di4ZbtXfvJKNhSAvYKSdgU6luk2sPjAgjCL3-v5u~led5D20Zrb7ifrwlFFm-yoM9M9iwX20B4S0b0Z5L1IbWiCJXr5be4HOUqx1ZkDrlTrdCIIqzplhXtfQKvdOobCETWJuwntfk6rcaQcCDD9YkU88S~ONmVQsrlPZTzrtznNGz3fRPWumHeuN6yeS8NMlinvTsfZFYQfhYHsgIVxNkKAn1nQ-4w-yVJCW2JhcnRDw6MyeIWYinsONfkLMjhP9ijFF~RT~BEEQ48JqsU2dXaw__&Key-Pair-Id=APKAIE5G5CRDK6RD3PGA)
AB cells support B lymphopoiesis. (A) The percentages of eYFP+ cells within the A, AB, B, and DN populations in each Cre reporter. Data are mean ± SD (n = 3 mice per reporter, from 3 individual experiments). (B) Shown are the proportions of A, AB, B, and DN populations in calvaria, long bones, and vertebrae (n = 7 mice). (C) Heatmap showing microarray expression of B-lymphocyte regulatory factors in A, AB, B, and DN cells (n = 4 independent experiments of cells pooled from 4 mice). (D-I) Gene expression qPCR validation for Flt3l (D), Cxcl12 (E), Kitl (membrane bound [m]) (F), Kitl (secreted [s]) (G), Il7 (H), and Tnfsf11 (I) (n = 7 independent experiments of cells pooled from 3 to 4 mice). All data are mean ± SD. (J) Schematic showing coculture of pro-B lymphocytes with A, AB, B, or DN cells for 7 days, which were then assessed for the proportions of B-lymphocyte populations by FACS or transferred onto OP9 cells for an additional 7 days. (K) The proportions of pro-B, pre-B, and IgM+ B lymphocytes after 7 days of coculturing pro-B lymphocytes with A (n = 7), AB (n = 15), B (n = 9), or DN (n = 15) cells. (L) The proportions of pro-B, pre-B, and IgM+ B lymphocytes after coculturing pro-B lymphocytes with A, AB, B, or DN cells for 7 days, followed by 7 days coculture with OP9 cells. Data are shown only for cultures that produced B lymphocytes: A (n = 4), AB (n = 8), B (n = 6), or DN (n = 4). (M) The proportions of wells containing B lymphocytes after 7 days coculture with A, AB, B, and DN cells, and then 7 days after transfer onto OP9 cells. (N) Schematic showing coculture of pre-B lymphocytes with A, AB, B, or DN cells for 7 days, which were then analyzed for the proportions of B-lymphocyte populations. (O-P) The numbers of viable pre-B lymphocytes (O) and IgM+ B lymphocytes (P) after 7 days of coculture with pre-B lymphocytes with A (n = 5), AB (n = 9), B (n = 12), or DN (n = 16) cells. One-way ANOVA with Tukey’s multiple comparisons test: *P < .05; **P < .01; ***P < .001; ****P < .0001. C, calvaria; L, long bones; V, vertebrae.
The increased proportions of AB cells in calvaria (Figure 7B) correlated with the increased proportions of B-lymphocyte progenitor cells in this skeletal site (Figure 6C). The AB cells also expressed the highest levels of B-lymphocyte regulatory molecules in our microarray data: Flt3l, C-X-C motif chemokine ligand 12 (Cxcl12), Kit ligand (Kitl; membrane-bound and secreted isoforms), interleukin 7 (Il7), and tumor necrosis family superfamily member 11 (Tnfsf11, encoding RANKL) (Figure 7C). Validation studies using qPCR revealed that the AB cells expressed significantly higher levels of Cxcl12, Il7, and Tnfsf11 than all other populations (Figure 7E,H-I). Furthermore, the AB cells expressed higher levels of Flt3l compared with DN cells (Figure 7D), and the B cells expressed higher levels of Tnfsf11 compared with the DN cells (Figure 7I).
The ability of A, AB, B, and DN cells to support in vitro B lymphopoiesis after 7 days of coculture with different B-lymphocyte progenitors was assessed. The maintenance of pre-pro-B and pro-B progenitors was also assessed by transferring the 7-day cocultured B-lymphocyte progenitors onto the B lymphopoiesis supportive stromal OP9 cell line27,41 and assessing B lymphopoiesis after 7 days of coculture (Figure 7J-O; supplemental Figure 6E). Increased proportions of pre-B lymphocytes were produced from pro-B lymphocytes cocultured for 7 days with DN cells (Figure 7K). Although all 4 cell types supported the maintenance of pro-B lymphocytes during 7 days of coculture (Figure 7L), the AB cells had the highest proportions of wells that produced B lymphocytes after 7 days of culture on OP9 cells (Figure 7M). Strikingly, there were significantly increased numbers of pre-B and immunoglobulin M–positive (IgM+) cells produced from pre-B lymphocytes after 7 days of culture with AB cells compared with A, B, and DN cells (Figure 7O-P). In contrast, none of the cell types supported the maturation of pre-pro B lymphocytes, nor did they maintain these cells in culture (supplemental Figure 6E).
Discussion
There are numerous types of skeletal lineage cells in the bone microenvironment56 ; however, methods for studying the roles of these cells in regulating hematopoiesis largely rely on fluorescent reporter mice. In particular, methods for isolating distinct populations of maturing skeletal lineage niche cells using cell surface markers have been lacking. Here we describe 4 distinct populations of skeletal lineage cells that were isolated by FACS without requiring reporter mice. These A, AB, B, and DN cells were found within the CD45–Ter119–CD31–Sca-1–CD51+ fraction and were subdivided by differential expression of PDGFR⍺ and/or PDGFRβ. Innovative 7-color multiplex IHC studies of tibias revealed that all 4 populations predominantly lined growth plate and/or trabecular bone surfaces and were largely absent from cortical bone and central bone marrow regions. These populations had low clonogenic (CFU-F) potential, suggesting that they are more mature than PαS cells7,9 and LepR MSCs.6,15,16,23 They differed in their gene expression profiles and potential to form mineralized osteoblasts and adipocytes in vitro. One of these populations, AB cells, expressed high levels of B-lymphocyte regulatory factors and was increased in calvaria, which also had increased numbers of pro-B, pre-B, and immature IgM+ B lymphocytes. The AB cells also supported the maintenance of pro-B and increased the production of pre-B and IgM+ B lymphocytes from pre-B lymphocytes in culture compared with the A, B, and DN cells.
The A cells were the rarest population analyzed, had the highest content of CFU-F cells (5.7%) and, although we could not assess the in vivo functional potential of these cells, they exhibited adipo-osteogenic differentiation capacity in vitro. This population closely compares with PDGFR⍺+Sca-1– cells described previously,6,7 although these latter cells also include the AB cells. Despite having the highest CFU-F content of the 4 Sca-1–CD51+ subpopulations, the A population is more mature than the well-characterized PαS cells (that largely overlap with the Sca-1+CD51+ population in our study), which have been reported by different laboratories to contain 5%,7 10% (Prrx1Cre-tdTomato+),18 15%,6 and 50%57 CFU-F cells. Our studies used methods reported by Short et al,57 and the results suggest that the Sca-1– cells have a lower CFU-F frequency than the PαS cells. Localization studies using multiplex IHC revealed that the A cells were located on the growth plate and trabecular bone surfaces throughout the metaphyses but were more prevalent adjacent to the growth plate. Furthermore, the A cells expressed genes commonly associated with chondrocytes and osteoblasts but had low or negligible expression of genes associated with bone marrow LepR+ MSCs and pericytes. Unfortunately, we were not able to perform the chondrogenic pellet assay to assess chondrogenic potential because of the low numbers of cells we could obtain from mice. These cells associated best with the gene set profile of osteolineage cells 2 (cluster 8) from Baryawno et al23 and are potentially chondro-osteoprogenitor cells.
The DN cells had many overlapping characteristics with the A cell population, including in vitro adipogenic and osteoblastic differentiation potential and similar gene expression profiles. In contrast, the DN population was the most abundant population, had lower numbers of CFU-F cells, and expressed significantly lower levels of Bglap and higher levels of Sost compared with the A cells. They were found in abundance near growth plate and trabecular bone regions and associated with cluster 4 (chondrocyte progenitor cells) described in Baryawno et al.23
PDGFRβ expression identified 2 cell populations lining bone that were distinct in their potential to form mineralizing osteoblasts and adipocytes; these were further defined by their expression (or lack thereof) of PDGFR⍺. The AB cells had adipogenic but not osteoblastic potential in culture, whereas the B cells could form mineralizing osteoblasts but not adipocytes.
The B skeletal cells were enriched in gene sets representative of osteoblasts.23 Their combined gene expression, mineralization capacity, and low numbers of CFU-F cells suggest that they are representative of the preosteoblasts described by Baryawno et al.23 These cells likely contain bone lining cells that can be induced to mineralize under appropriate stimuli, akin to the Sca-1–CD51+LepR+ cells identified in FACS studies by Matic et al.58 In support of this, the B cells expressed Tnfsf11 (Rankl), which is a key regulator of osteoclastogenesis59 and is produced by bone lining cells.58
PDGFRβ-PDGFBB signaling stimulates chemotaxis of skeletal progenitor cells and osteoblasts,60-62 which leads to the formation of trabecular bone.63 Recently, Osx1-Cre–targeted cell-derived Pdgfrb signaling was shown to be essential for fracture repair, and this involved regulation of matrix metallopeptidase 9 (Mmp9).64 Interestingly, the B cells had significantly higher expression of Mmp9 in microarray data sets than all other populations (mean expression, log2: A, 8.2835; AB, 8.7677; B, 11.2263; and DN, 9.8210). The majority of the Pdgfrb-expressing cells in the study by Bohn et al64 were of perivascular origin. We did observe PDGFRβ-expressing cells in perivascular regions of the bone marrow cells, but they did not coexpress CD51 (supplemental Figure 3). The PDGFRβ-expressing populations described in our study were predominantly found in trabecular bone regions, not central bone marrow, coexpressed CD51, and did not express Sca-1, hematopoietic, or endothelial cell markers.
The AB cells expressed genes associated with LepR-MSCs,23 and expressed high levels of mRNA transcripts involved in regulating B lymphopoiesis (Flt3l, Cxcl12, Il7, and Tnfsf11). Consistent with this, in vitro studies revealed that they supported the maintenance of pro-B lymphocytes and increased the production of pre-B and IgM+ B lymphocytes from pre-B lymphocytes during 7 days of coculture. High CXCL12 expression and regulation of B lymphopoiesis is similarly a characteristic of CXCL12-expressing adventitial reticular cells13,18,65,66 and bone marrow LepR+ cells,6,15,16 which had some overlap with, but were distinct from, the AB cells in their expression of cell surface markers. Furthermore, the LepR+ cells and chimeric antigen receptor cells have osteogenic potential,6,7,13,67 were isolated from bone marrow, and reside in the bone marrow in perivascular regions.6,23,65 In comparison, the AB cells do not form mineralized osteoblasts, were isolated from collagenase-digested bone, and were identified as lining endosteal bone surfaces.
Interestingly, we found that the proportions of the AB cells and B-lymphocyte precursors varied across skeletal sites. The calvaria had higher proportions of AB cells and a greater capacity to support early B lymphopoiesis. These changes were not limited to B-lymphocyte precursors, because significant differences in the proportions of primitive HSCs and myeloid progenitor populations in addition to maturing erythroid, granulocyte, and macrophage populations were observed in the different skeletal sites. This highlights that hematopoietic niches not only vary within the bone marrow microenvironment (eg, endosteal vs vascular niches) but distinct bones support hematopoietic lineages to different extents.
Previous studies by Silberstein et al68 showed that Col2.3GFP+ trabecular bone cells in close proximity (<2 cell diameters) to LT-HSCs have distinct HSC regulatory gene expression to trabecular bone cells that are >5 cell diameters from HSCs. Our studies agree with these findings and show that 4 phenotypically and functionally different skeletal lineage populations coexist on trabecular bone surfaces. Interestingly, we observed that the majority of the cuboidal cells lining the trabecular and cortical bone surfaces were CD51–, which supports FACS studies by Matic et al58 showing that ∼80% of Col2.3GFP+ and Dmp1+ cells isolated from bone are CD51–Sca-1–.
Mende et al30 recently explored the expression of signaling pathways between hematopoietic and nonhematopoietic cells within the microenvironment. Their studies investigated gene sets expressed by niche cells, including bone-derived CD31–CD144–CD51+Sca-1–PDGFR⍺+ cells (termed MSCs), and endosteal CD31–CD51+Sca-1–PDGFR⍺– cells (termed osteoblastic progenitors), which together are equivalent to our Sca-1–CD51+ population. We have shown that the CD31–CD144–CD51+Sca-1–PDGFR⍺+ cells can be further purified into A and AB cells, and the CD31–CD51+Sca-1–PDGFR⍺– cells can be subdivided into B and DN cells, and that these subpopulations of more mature skeletal lineage cells are very distinct cell types.
Many recent publications have used combinations of single-cell techniques, including single-cell RNA sequencing, mass cytometry, and FACS using reporter mouse strains for lineage tracing to describe distinct nonhematopoietic niche cells.2,3,23,69-71 A key limitation of these studies is that, to date, cell surface markers that permit the isolation of these distinct cell types for functional characterization and in situ studies have not been identified. Our study achieved this, and these novel populations will help researchers study the roles of distinct skeletal lineage cells in conditions with altered hematopoiesis and/or bone turnover, such as cancer or osteopenia.
All data are available by sending an e-mail to Louise E. Purton at lpurton@svi.edu.au. The microarray data sets are available from GEO (GSE82284, GSE82285).
The online version of this article contains a data supplement.
The publication costs of this article were defrayed in part by page charge payment. Therefore, and solely to indicate this fact, this article is hereby marked “advertisement” in accordance with 18 USC section 1734.
There is a Blood Commentary on this article in this issue.
Acknowledgments
The authors thank Michael Thompson and Anthony Di Carluccio from the SVI Flow Cytometry Facility for FACS isolation of cells, the staff in the St Vincent’s Bioresource Centre for the care of the mice used in this study, Monique Smeets and Robert Signer for technical advice, and Thomas (Jack) Martin for thoughtful advice and comments on the manuscript. The Osx1-Cre founder mice were kindly supplied by Andy McMahon.
These studies were supported in part by a grant from the National Health and Medical Research Council of Australia (NHMRC; GNT1127551) (L.E.P.) and the Victorian State Government Operational Infrastructure Support Program (to St Vincent’s Institute). L.E.P. was supported by an NHMRC Senior Research Fellowship (GNT1003339). A.C.G. was supported by an Australian Postgraduate Award from the Australian Government.
Authorship
Contribution: L.E.P. conceived the study; A.C.G., G.T., and L.E.P. designed the study; A.C.G., G.T., L.S., D.K., E.K.B., J.M.Q., T.K., J.Y.W., and L.E.P. performed the experiments; S.C.L., A.M.C., and L.E.P. analyzed the microarray data sets; A.C.G., G.T., and L.E.P. analyzed the data; A.C.G. and L.E.P. drafted and revised the manuscript; and all authors approved the final version of the manuscript.
Conflict-of-interest disclosure: The authors declare no competing financial interests.
The current affiliations for A.C.G. are Department of Oncology and Metabolism, The University of Sheffield, Sheffield, United Kingdom, and The Mellanby Centre for Bone Research, Sheffield, United Kingdom.
Correspondence: Louise E. Purton, St Vincent’s Institute, 9 Princes St, Fitzroy, VIC 3065, Australia; e-mail: lpurton@svi.edu.au.

This feature is available to Subscribers Only
Sign In or Create an Account Close Modal