

TO THE EDITOR:
Cytotoxic cutaneous T-cell lymphomas (CTCLs) are a collection of uncommon but highly aggressive cancers of skin-homing cytotoxic T cells. These include the established World Health Organization (WHO) entity primary cutaneous γδ T-cell lymphomas (PCGDTLs), the provisional WHO entity primary cutaneous CD8+ aggressive epidermotropic T-cell lymphoma (PCAETCL), and samples that do not currently fit a specific WHO category, which we refer to as cytotoxic CTCL-NOS (not otherwise specified).1
All 3 entities present with ulcerated skin lesions and express at least 1 cytotoxic enzyme by histopathology (supplemental Figure 1, available on the Blood Web site). These cytotoxic CTCL entities are clinically similar.2,3 There are no statistically significant differences in clinical presentation, survival, or response to therapy.2,3 Median survival across all 3 cytotoxic CTCL subtypes has been reported to be from 12 to 15 months.3,4 Because of their dismal clinical outcomes, greater insights into disease pathogenesis are needed.
We recently defined the landscape of PCGDTLs.5 However, little is known about the other cytotoxic CTCLs. A recent whole-genome sequencing (WGS) study of 12 PCAETCLs found recurrent JAK2 fusions in 3 PCAETCLs.6 Otherwise, there is little known about these aggressive cancers.
To bridge this knowledge gap, we obtained 35 cases of cytotoxic CTCLs. All cases expressed a pan T-cell marker and at least 1 cytotoxic enzyme (TIA-1, perforin, or granzyme B). Cases were obtained from 10 academic institutions (Massachusetts General Hospital, Brigham and Women’s Hospital, Northwestern, Stanford, University of Utah, University of Pennsylvania, University of Wisconsin–Madison, Moffit Cancer Center, University of California–Irvine, City of Hope). All slides were reviewed in a blinded manner by 2 expert dermatopathologists (L.M.D. and J.G.).
All PCGDTLs expressed the γ or δ T-cell receptor. All 9 PCAETCLs expressed CD8 and had full-thickness epidermotropism. The 20 CTCL-NOSs did not meet criteria for PCAETCL because they were either CD8−, did not have full-thickness epidermal involvement, or had mixed histological features characteristic of other CTCLs (Table 1). Consistent with recent reports,3 there were no statistically significant differences in sites of disease, age, or sex between PCAETCLs and CTCL-NOSs in our cohort (Fisher’s exact test). Both PCAETCL and CTCL-NOS had aggressive clinical courses. Median survivals were 12.2 months and 11 months, respectively (Figure 1A).
Histological and clinical features of cytotoxic CTCLs
| WHO criteria | Fusion result | Demographic features | Clinical outcomes | ||||||||
|---|---|---|---|---|---|---|---|---|---|---|---|
| Case | γδ TCR | CD8+ | Epidermis | Assay | Transcript | Age, y | Sex | Race | Status | Skin involvement | Survival |
| PCAETCL | |||||||||||
| NU1 | NEG | POS | 1.5 (P) | NGS | KHDRBS1-JAK2 | 69 | M | AA | DOD | HN, T, E | 15 |
| NU2 | NEG | POS | 2 (P) | Archer | CAPRIN1-JAK2 | 46 | M | M | AWD | HN, T, G, E | 26 |
| NU3 | NEG | POS | 2.5 | NGS | PICALM-JAK2 | 84 | M | C | AWD | G, T, E | 26 |
| NU4 | NEG | POS | 3 | NGS | PICALM-JAK2 | 31 | M | H | AWOD* | HN, T, O, E | 3 |
| PE12 | NEG | POS | 1.5 (P) | Archer | PCM1-JAK2 | 67 | M | C | N/A | HN, T, G, E | 12 |
| MGH3 | NEG | POS | 3 | Archer | CAPRIN1-JAK2 | 69 | M | C | DOD | T, E | 19 |
| MOF4 | NEG | POS | 1.5 (P) | Archer | STAT3-JAK2 | 80 | F | C | DOD | HN, T, E | 7 |
| WIS5 | NEG | POS | 1.5 (P) | Archer | SELENO1-ABL1 | 88 | M | C | DOD | T, E | 2 |
| MGH6 | NEG | POS | 1.5 (P) | Archer | PCM1-JAK2 | 75 | M | N/A | N/A | HN, T, E | 9 |
| CD8−/CD4− cytotoxic CTCL-NOS | |||||||||||
| NU5 | NEG | NEG | 3 | Archer | Negative | 75 | F | C | AWD | HN | 39 |
| NU6 | NEG | NEG | 2.5 | NGS | Negative | 20 | M | AA | DOD | HN, T, E | 0 |
| NU7 | NEG | NEG | 1 | NGS | Negative | 75 | F | C | AWD | HN, T, E | 35 |
| NU8 | NEG | NEG | 2 | Archer | Negative | 67 | M | C | AWD | E | 8 |
| NU9 | NEG | NEG | 0 | NGS | Negative | 47 | F | C | AWD | HN, T, E | 11 |
| NU10 | NEG | NEG | 1 (MF) | Archer | Negative | 45 | M | C | AWD | T, G, E | 36 |
| NU11 | NEG | NEG | 2 | NGS | Negative | 61 | M | C | DOD | HN, E | 21 |
| NU15 | NEG | NEG | 3 | Archer | Negative | 89 | F | C | AWD | HN | 8 |
| NU13 | NEG | NEG | 2 | NGS | Negative | 86 | M | C | DOD | T, E | 20 |
| NU14 | NEG | NEG | 2 | NGS | Negative | 63 | M | C | DOD | HN, T, E | 14 |
| CD8+ cytotoxic CTCL-NOS that did not meet criteria for PCAETCL | |||||||||||
| NU12 | NEG | VAR | 2 (N) | Archer | INTS4-TP63 | 76 | M | H | AWD | HN, E | 7 |
| NU16 | NEG | POS | 1 | NGS | Negative | 72 | M | C | DOD | HN, T, E | 1 |
| BWH2 | NEG | POS | 0 | Archer | Negative | 64 | M | C | AWD | HN, E | 3 |
| PE9 | NEG | POS | 0.5 | Archer | Negative | 75 | M | C | AWD | HN, T, O, E | 43 |
| PE10 | NEG | POS | 0.5 (MF) | Archer | Negative | 67 | M | AA | N/A | HN, T, G, E | 4 |
| PE11 | NEG | POS | 0.5 (MF) | Archer | Negative | 82 | M | C | N/A | E | 7 |
| PE14 | NEG | POS | 1.5 | Archer | Negative | 52 | F | C | DOD | T, E | 37 |
| ST15 | NEG | POS | 1 | Archer | Negative | 75 | M | A | DOD | HN, T, O, E | 7.9 |
| UCI8 | NEG | POS | 1.5 | Archer | Negative | 63 | M | C | DOD | HN, T, E | 14 |
| UT22 | NEG | POS | 2 (MF) | NGS | Negative | 70 | M | C | AWD | HN, T, E | 10 |
| PCGDTL | |||||||||||
| COH16 | POS | NEG | 2 | Archer | Negative | 78 | M | C | DOD | T, G, E | 22 |
| COH17 | POS | SUBSET | 0 | Archer | Negative | 68 | M | C | DOD | E | 15 |
| COH18 | POS | NEG | 0 | Archer | Negative | 63 | M | C | DOD | T, E | 1 |
| COH19 | POS | NEG | 2 | Archer | Negative | 81 | M | C | DOD | HN, T, G, E | 50 |
| COH20 | POS | NEG | 2 (MF) | Archer | Negative | 75 | F | C | AWD | T, E | 15 |
| COH21 | POS | POS | 1.5 | Archer | Negative | 40 | M | C | AWD | HN, T, E | 64 |
Assays used for fusion detection were Archer or next generation sequencing (NGS) methods. Archer (Heme fusion assay) is a custom-targeted anchored multiplex PCR-based RNA-seq assay for gene fusion detection. Fusions from RNA-seq or WGS were discovered by STAR-Fusion19 followed by manual inspection by WGS/RNA-Seq reads. Survival is reported in months from date of diagnosis to date of death (or hematopoietic stem cell transplant). Race: A, Asian; AA, African American; C, Caucasian; M, Middle Eastern; H, Hispanic. Status: AWD, alive with disease; AWOD, alive without disease; DOC, died of other cause; DOD, died of disease. Skin involvement: E, extremities; G, genitals; HN, head/neck; O, oral mucosa; T, trunk. Epidermis density is described as 0, very low epidermal infiltrate density of the lymphoma cells; 1, low epidermal density of lymphoma cells; 2, intermediate density of lymphoma cells; 3, high density of lymphoma cells.
M, mixed features, describing a histological pattern that have features of mycosis fungoides (MF), such as Pautrier microabscesses or lichenoid infiltrates; N, Neurotropism, neural invasion of lymphoid infiltrates NEG, negative for expression determined by immunohistochemistry (IHC); P, pagetoid, describing a pattern of lymphocytic infiltration where it is densest at the basal layer, and infiltration density becomes less sparse, but still present, at the top layer of the epidermis; POS, positive for expression determined by IHC; SUBSET, a subset of the population was positive for expression determined by IHC; TCR, T-cell receptor; VAR, variable expression determined by IHC.
Hematopoietic stem cell transplant.
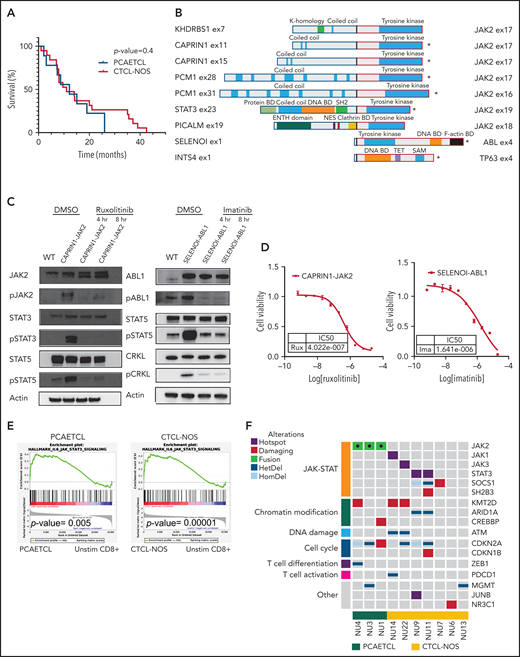
Cytotoxic CTCLs harbor targetable mutations that activate the JAK-STAT pathway. (A) Survival curves for PCAETCL and CTCL-NOS were generated and analyzed with Log-rank (Mantel-Cox) test. (B) Summary of all fusions and their known domains. *Transcripts detected by the Archer assay. The rest were identified by WGS and/or RNA-Seq. Breakpoints are denoted with bold, black junctions. Clathrin BD, Clathrin binding domain; DNA BD, DNA binding domain; Protein BD, binding domain; NES, nuclear export signaling domain; TET, tetramerization domain. (C) Western blots of pathway targets in CAPRIN1-JAK2 and SELENOI-ABL1–expressing Ba/F3. Cells were transduced with novel fusion genes or wild-type kinase controls and treated with either vehicle or indicated drug for indicated times. Antibodies used against JAK2 (#3230), pJAK2 (#3771), cABL (#2862), pABL (#2868), STAT3 (#9139), pSTAT3 (#9145), STAT5 (#94205), pSTAT5 (#4322), CRKL (#38710), and pCRKL (#3181) were obtained from Cell Signaling Technology. (D) Cell viability assay to determine IC50 values of ruxolitinib and imatinib in CAPRIN1-JAK2-expressing Ba/F3 and SELENOI-ABL1–expressing Ba/F3, respectively. We cultured 0.1 × 10⁶ cells per mL with inhibitors or vehicle in a 384-well plate. After 48 hours, Cell-titer Glo (CTG) luminescent reagent (Promega) was added. Luminescence was read by EnVision Multilabel Reader (PerkinElmer). Each data point was quantified in quadruplicate. Cell line experiments were repeated at least in triplicate. Dose response curves were generated with GraphPad. (E) Gene set enrichment analysis of Molecular Signatures Database Hallmark IL-6–mediated JAK-STAT signaling in PCAETCL compared with unstimulated (unstim) CD8+ T cells and CTCL-NOS compared with unstimulated CD8+ T cells. P values were .005 and .00001, respectively. (F) Oncoplot of PCAETCL and CTCL-NOS. Fusion events were called using STAR-Fusion19 and confirmed via manual inspection of sequencing data. Splice site, frameshift, or nonsense mutations were called as damaging mutations in known tumor suppressors. Hotspot mutations were recurrent amino acid alterations. Copy number deletions for focal deletion (<5 Mb). DMSO, dimethyl sulfoxide; ENTH, epsin N-terminal homology domain; HetDel, heterozygous copy number deletion; HomDel, biallelic deletions; WT, wild type.
Cytotoxic CTCLs harbor targetable mutations that activate the JAK-STAT pathway. (A) Survival curves for PCAETCL and CTCL-NOS were generated and analyzed with Log-rank (Mantel-Cox) test. (B) Summary of all fusions and their known domains. *Transcripts detected by the Archer assay. The rest were identified by WGS and/or RNA-Seq. Breakpoints are denoted with bold, black junctions. Clathrin BD, Clathrin binding domain; DNA BD, DNA binding domain; Protein BD, binding domain; NES, nuclear export signaling domain; TET, tetramerization domain. (C) Western blots of pathway targets in CAPRIN1-JAK2 and SELENOI-ABL1–expressing Ba/F3. Cells were transduced with novel fusion genes or wild-type kinase controls and treated with either vehicle or indicated drug for indicated times. Antibodies used against JAK2 (#3230), pJAK2 (#3771), cABL (#2862), pABL (#2868), STAT3 (#9139), pSTAT3 (#9145), STAT5 (#94205), pSTAT5 (#4322), CRKL (#38710), and pCRKL (#3181) were obtained from Cell Signaling Technology. (D) Cell viability assay to determine IC50 values of ruxolitinib and imatinib in CAPRIN1-JAK2-expressing Ba/F3 and SELENOI-ABL1–expressing Ba/F3, respectively. We cultured 0.1 × 10⁶ cells per mL with inhibitors or vehicle in a 384-well plate. After 48 hours, Cell-titer Glo (CTG) luminescent reagent (Promega) was added. Luminescence was read by EnVision Multilabel Reader (PerkinElmer). Each data point was quantified in quadruplicate. Cell line experiments were repeated at least in triplicate. Dose response curves were generated with GraphPad. (E) Gene set enrichment analysis of Molecular Signatures Database Hallmark IL-6–mediated JAK-STAT signaling in PCAETCL compared with unstimulated (unstim) CD8+ T cells and CTCL-NOS compared with unstimulated CD8+ T cells. P values were .005 and .00001, respectively. (F) Oncoplot of PCAETCL and CTCL-NOS. Fusion events were called using STAR-Fusion19 and confirmed via manual inspection of sequencing data. Splice site, frameshift, or nonsense mutations were called as damaging mutations in known tumor suppressors. Hotspot mutations were recurrent amino acid alterations. Copy number deletions for focal deletion (<5 Mb). DMSO, dimethyl sulfoxide; ENTH, epsin N-terminal homology domain; HetDel, heterozygous copy number deletion; HomDel, biallelic deletions; WT, wild type.
To identify oncogenic gene fusions, we performed a clinically validated targeted RNA sequencing (RNA-Seq) assay using anchored multiplexed polymerase chain reaction (PCR) technology,7 the Archer Heme Fusion assay, on 6 PCGDTLs, 6 PCAETCLs, and 12 CTCL-NOSs formalin-fixed paraffin-embedded (FFPE) samples. Surprisingly, all 6 PCAETCLs harbored a kinase gene fusion; 5 had a JAK2 fusion, and one had a novel ABL1 fusion. In contrast, none of the CTCL-NOSs or PCGDTLs expressed a kinase fusion (Figure 1B).
To investigate this further, we performed WGS and/or RNA-Seq on 3 additional PCAETCLs (1 fresh frozen and 2 FFPE) and 7 CTCL-NOSs (4 fresh frozen and 3 FFPE). The WGS and RNA-Seq were prepared and analyzed as previously described.5 We also added custom probes spanning JAK2 to enrich our RNA-Seq for JAK2 fusions. Recently, we performed a comprehensive genomic analysis of PCGDTLs that identified mutations in JAK/STAT, MYC, and MAPK pathways.5 Thus, we did not pursue additional molecular studies on this cohort.
This analysis identified JAK2 fusions in all additional 3 PCAETCLs (Figure 1B). None of the additional CTCL-NOSs harbored an oncogenic fusion. Collectively, PCAETCLs in our cohort harbored JAK2 fusions reported in other cancers (PCM1-JAK2 and STAT3-JAK2),8-10JAK2 fusions recently reported for PCAETCL (KHDRBS1-JAK2),6 and 3 fusions not previously described in any cancer (PICALM-JAK2, CAPRIN1-JAK2, and SELENOI-ABL1) (Figure 1B).
All JAK2 translocations involved introns 15 to 18, preserved the catalytic domain, but lost the upstream FERM, SH2, and the regulatory pseudokinase domains. The ABL1 fusion also retained its catalytic tyrosine kinase domain but lost its N-terminal regulatory SH2 and SH3 domains. This fusion is analogous to NPM1-ABL1, but not BCR-ABL1, fusions, which also lose their SH2/SH3 domains.
To functionally validate these fusions, we obtained cDNA for CAPRIN1, JAK2, and ABL1 (Horizon; Addgene). We cloned the fusion genes into pMSCVpuro-DEST vector (Addgene). We transduced Ba/F3 cells with retrovirus encoding CAPRIN1-JAK2, SELENO-ABL1, or wild-type JAK2 or ABL1. Like other oncogenes,11 both gene fusions, but not wild-type kinases, conferred IL-3–independent growth (supplemental Figure 2A-B). Both CAPRIN1-JAK2 and SELENOI-ABL1 increased phosphorylation of targets downstream in their respective signaling cascades (Figure 1C). For CAPRIN1-JAK2, these include phospho-JAK2 (pJAK2), pSTAT3, and pSTAT5. For SELENOI-ABL1, these include pABL, pSTAT5, and pCRKL.
Next, we assessed their potential targetability. The JAK1/JAK2 inhibitor ruxolitinib decreased pJAK2, pSTAT3, and pSTAT5 and decreased viability of cells expressing CAPRIN1-JAK2 fusions (50% inhibitory concentration [IC50] = 402.2 nM). Similarly, imatinib inhibited SELENOI-ABL1–dependent phosphorylation cascades and viability (IC50 = 1641 nM) (Figure 1D). As previously shown for NPM1-ABL1, the allosteric inhibitor asciminib that binds a myristoyl site in ABL112 had no effect on SELENOI-ABL1 fusion expressing cells (data not shown).
We then analyzed the RNA-Seq data for transcriptional evidence of JAK-STAT activation. As expected, gene set enrichment analysis demonstrated a significant upregulation of a JAK-STAT gene signature in PCAETCLs (P value = .005) compared with unstimulated CD8+ T cells (Figure 1E). To confirm this observation at the protein level, we performed IHC for pSTAT3 (clone D3A7, Cell Signaling Technology) on 5 samples. These include 1 PCAETCL expressing the SELENOI-ABL1 fusion (predicted to phosphorylate pSTAT5 but not pSTAT3), 3 PCAETCL samples with JAK2 fusions (PCM1-JAK2 and STAT3-JAK2), and a CTCL-NOS without a known JAK-STAT mutation. As expected, we found pSTAT3 in the 3 samples with JAK2 fusions but not in the other samples (supplemental Figure 3).
Next, we analyzed our WGS data as previously described13 (supplemental Table 1). Five of 7 (71%) CTCL-NOSs had a somatic single nucleotide variant (SSNV) predicted to activate JAK-STAT signaling, including hotspot mutations in STAT3, p.D661Y (NU9) and p.P714L (NU11), JAK1, p.G1097D (NU14), JAK3, p.P906S (UT22), a damaging mutation in SOCS1, p.Q108* (NU7), and a SH2B3 splice site mutation (NU11). As previously reported, we found CDKN2A mutations in all PCAETCLs.6 These were also present in 43% of CTCL-NOSs (Figure 1F). Moreover, CTCL-NOSs and/or PCAETCLs harbored mutations in other genes recurrently mutated in CTCL,11,14 including chromatin modification (ARID1A, KMT2D, CREBBP), cell cycle (CDKN1B), and DNA damage genes (ATM). Consistent with their genetics, CTCL-NOSs also had significant enrichment of the JAK-STAT gene set in their RNA-Seq data (P = .00001). Despite the negative pSTAT3 IHC in the 1 CTCL-NOS sample, these data suggest transcriptional activation of ≥1 STATs in this disease cohort.
Our observations have immediate clinical importance for both classification and treatment. Strikingly, all 9 PCAECTLs in our series harbored kinase fusions, suggesting that these fusions may be a disease-defining characteristic. At the same time, the majority of CTCL-NOSs harbor SSNVs that activate JAK/STAT signaling. Although both cancers may require oncogenic JAK-STAT signaling, the literature suggests variable genotype-driven responses to JAK inhibitors. JAK2 fusions predict exceptional response to small molecule inhibitors, while responses in cases with activating SSNVs are variable.15 A recent study of ruxolitinib in peripheral T-cell lymphoma and CTCLs reported responses in 23% of patients with activating JAK/STAT SSNVs.16
The reasons underlying the genetic differences between PCAETCLs and CTCL-NOSs remain unclear. It is possible that these kinase fusions and JAK/STAT SSNVs have subtle molecular differences. Nonetheless, our data add to the growing body of literature wherein molecular differences between tumors correlate with histological patterns.17,18
We received informed consent for these patients in accordance with Northwestern Institutional Review Board standards.
Acknowledgments
The authors acknowledge the patients, the Northwestern Skin Disease Research Center, the Northwestern University Research Computing Services, and Admera Health.
This work was supported by National Institutes of Health (NIH), National Institute of Arthritis Musculoskeletal and Skin Diseases grant P30-AR066524 (G.S.W.), NIH, National Cancer Institute grants R35-CA231958 (D.M.W.) and P01-CA248384 (D.M.W.), Leukemia and Lymphoma Society grant SCOR 7026-21 (D.M.W.), Leukemia and Lymphoma Society grant 1377-21 (J.C.), and Doris Duke Charitable Fund grant 2020132 (J.C.).
Authorship
Contribution: K.L., J.G., D.M.W., V.N., and J.C. wrote the manuscript; K.L and C.S. performed sequencing and bioinformatics analyses; L.Y. performed the functional assays; K.L., M.G.E., S.N., M.K., R.A.B., N.T., C.Q., L.T.D., J.S., H.Z., A.A.G., G.S.W., D.A.W., V.S., P.L.H., and V.N. provided the samples and clinical data at their respective centers; J.C.A. and V.N. performed the immunohistochemistry staining; L.M.D. and J.G. reviewed histology images; and K.L., M.G.E., and J.G. analyzed the clinical data.
Patient samples and clinical information were collected in accordance with the Institutional Review Board of Northwestern University (STU00009443).
Conflict-of-interest disclosure: The authors declare no competing financial interests.
Correspondence: Valentina Nardi, Massachusetts General Hospital, Harvard Medical School, Warren 2, 55 Fruit St, Boston, MA 02114; e-mail: vnardi@partners.org; and Jaehyuk Choi, Robert H. Lurie Comprehensive Cancer Center, Northwestern University, 303 E. Superior St, Room 5-115, Chicago, IL 60611; e-mail: jaehyuk.choi@northwestern.edu.
For samples in accordance with institutional review board, DNA/RNA sequencing will be deposited into database of Genotypes and Phenotypes. The database of Genotypes and Phenotypes accession number is phs002456.v1.p1.
The online version of this article contains a data supplement.
There is a Blood Commentary on this article in this issue.

This feature is available to Subscribers Only
Sign In or Create an Account Close Modal