

Key Points
FLT3-ITD is S-palmitoylated at cysteine 563 by the acyltransferase ZDHHC6.
Disruption of palmitoylation changes FLT3-ITD subcellular localization, downstream signaling, and promotes leukemia progression.

Abstract
Internal tandem duplication within FLT3 (FLT3-ITD) is one of the most frequent mutations in acute myeloid leukemia (AML) and correlates with a poor prognosis. Whereas the FLT3 receptor tyrosine kinase is activated at the plasma membrane to transduce PI3K/AKT and RAS/MAPK signaling, FLT3-ITD resides in the endoplasmic reticulum and triggers constitutive STAT5 phosphorylation. Mechanisms underlying this aberrant FLT3-ITD subcellular localization or its impact on leukemogenesis remain poorly established. In this study, we discovered that FLT3-ITD is S-palmitoylated by the palmitoyl acyltransferase ZDHHC6. Disruption of palmitoylation redirected FLT3-ITD to the plasma membrane and rewired its downstream signaling by activating AKT and extracellular signal-regulated kinase pathways in addition to STAT5. Consequently, abrogation of palmitoylation increased FLT3-ITD–mediated progression of leukemia in xenotransplant-recipient mouse models. We further demonstrate that FLT3 proteins were palmitoylated in primary human AML cells. ZDHHC6-mediated palmitoylation restrained FLT3-ITD surface expression, signaling, and colonogenic growth of primary FLT3-ITD+ AML. More important, pharmacological inhibition of FLT3-ITD depalmitoylation synergized with the US Food and Drug Administration–approved FLT3 kinase inhibitor gilteritinib in abrogating the growth of primary FLT3-ITD+ AML cells. These findings provide novel insights into lipid-dependent compartmentalization of FLT3-ITD signaling in AML and suggest targeting depalmitoylation as a new therapeutic strategy to treat FLT3-ITD+ leukemias.
Introduction
FLT3 is a receptor tyrosine kinase activated by FLT3 ligand (FLT3L) and plays an important role in the development of hematopoietic progenitors. The oncogenic FLT3 mutation is one of the most prevalent genetic alterations identified in AML.1 The ITDs in the juxtamembrane (JM) domain of FLT3 (FLT3-ITD) are present in ∼25% of all cases of AML. Patients with FLT3-ITD have a high leukemia burden, increased risk of relapse, and poor prognosis.1,2 However, the prognostic value of FLT3 mutations in the tyrosine kinase domain (FLT3-TKD), which have a lower incidence in AML (5% to 10% of all cases), is uncertain.3 Both types of mutations trigger ligand-independent FLT3 kinase activity, leading to the proliferation and survival of AML cells.
The kinase activity of wild-type FLT3 (FLT3-WT) is autoinhibited by the JM domain in the absence of FLT3L. Ligand binding at the plasma membrane (PM) triggers conformational changes and tyrosine phosphorylation in the receptor JM domain that releases the inhibitory contacts. This engagement subsequently activates FLT3 kinase and downstream PI3K/AKT and RAS/extracellular signal–regulated kinase (ERK) pathways.4,5 The ITD insertions in the JM domain confer constitutive activation of FLT3 and aberrant activation of STAT5.4 In contrast, the TKD mutants function through AKT and ERK pathways in a ligand-independent manner, without aberrant activation of STAT5.6 Importantly, FLT3-WT is primarily localized in the PM, whereas FLT3-ITD is predominantly distributed in the endoplasmic reticulum (ER),7 which may explain their differential signal transduction, in that membrane targeting of FLT3-ITD by linking a myristoylation sequence switches STAT5 signaling to AKT and ERK.8 Conversely, anchoring FLT3-WT or the TKD mutants to the ER abolishes AKT and ERK signaling.9 These results strongly support the importance of subcellular compartmentalization in controlling the access of kinases to substrates and ensure signaling outcomes.10 However, the underlying physiological mechanism regulating FLT3-ITD localization and signaling and its influence on leukemogenesis remain poorly established.
The prevalence of FLT3 mutations in AML and its structural characteristics as a kinase render it an intensely studied therapeutic target. The second-generation tyrosine kinase inhibitors (TKIs) such as gilteritinib, crenolanib, and quizartinib, present considerable clinical benefits, with high specificity and potency.11-13 However, they demonstrate limited and transient antileukemia activities as single agents and are challenged by drug resistance arising from secondary mutations or signaling compensations.14,15 Therefore, efficient targeting of FLT3 for the treatment of AML requires a thorough understanding of the regulation of FLT3 localization, activity, and downstream signaling.
Protein subcellular localization can be regulated by lipid conjugation. Palmitoylation is a reversible lipid modification that adds a 16-carbon palmitic acid to the cysteine residue(s) of the target proteins. Palmitoylation is catalyzed by the ZDHHC family of acyltransferases (PAT).16 Palmitoylation is known to regulate protein subcellular trafficking, stability, and enzymatic activity,17 One such example in the blood system is the palmitoylation of the small GTPases H-Ras and N-Ras.18 However, there have been no reports on FLT3 palmitoylation to date.
In this study, we demonstrated a critical role for S-palmitoylation in modulating FLT3-ITD intracellular trafficking, signaling, and AML progression via ZDHHC6. Disruption of palmitoylation drove FLT3-ITD trafficking to the PM, rewired its signaling, and promoted leukemia cell growth. More important, pharmacological inhibition of FLT3-ITD depalmitoylation synergized with FDA-approved FLT3 TKI gilteritinib in abrogating FLT3-ITD+ AMLs. Hence, our findings provide new insights into lipid-dependent compartmentalization of FLT3-ITD signaling in AML and suggest targeting depalmitoylation as a new therapeutic strategy.
Methods
Mice and primary human samples
NOD/SCID/IL2rγnull (NSG) mice were from Jackson Laboratories. Animal studies were performed under protocols approved by the Institutional Animal Care and Use Committee of the Children’s Hospital of Philadelphia. Bone marrow– or peripheral blood–derived mononuclear cells (MNCs) from patients with primary AML were obtained from the Stem Cell and Xenograft Core Facility at the University of Pennsylvania.
Acyl-PEG exchange assay
The acyl-PEG exchange (APE) assay was performed as described previously.19 This method is based on mass-tag labeling of newly released thiol groups from palmitoylated cysteine after being exposed to hydroxylamine, thus resulting in a mass shift in sodium dodecyl sulfate-polyacrylamide gel electrophoresis that can be detected by standard western blot analysis. Details are provided in the supplemental Methods (available on the Blood Web site).
Xenograft using NSG mice
The xenograft experiments in NSG mice were performed as previously described.20,21 In brief, 8- to 12-week-old NSG mice were irradiated with 250 cGy 1 day before transplantation. MV4;11 cells (0.5 × 10⁶) transduced with pELNS.CBR-T2A-mCherry were injected into the tail vein of the NSG mice. At 1 and 2 weeks after transplantation, the mice were intraperitoneally injected with 200 μL 15 mg/mL d-luciferin (cat no. 122799; PerkinElmer). After 4 minutes, luciferase imaging was conducted on an IVIS Spectrum instrument (PerkinElmer).
Data analysis and statistics
Statistics were performed by unpaired 2-tailed Student t tests or 2-way analysis of variance (Prism; GraphPad Software Inc). Percentages of cells with different subcellular localization of FLT3 proteins were analyzed by using Fisher’s exact test. Drug synergy scores were calculated by CompuSyn software.
Results
FLT3 is palmitoylated at cysteine 563
Given the importance of protein palmitoylation in regulating receptor trafficking and signaling,16 we examined the palmitoylation status of FLT3-ITD, using an APE assay that allows for detection of protein palmitoylation in unfractionated cell lysates under denatured conditions.19 We first examined the palmitoylation of transiently expressed proteins in 293T cells and found that FLT3-ITD was palmitoylated (Figure 1A). Calnexin (CANX) is a well-described palmitoylated protein in the ER and was blotted as a positive control.22 We next validated the results in a cytokine-dependent hematopoietic progenitor cell line, TF-1, that stably expresses FLT3-ITD via the retroviral vector MigR1. Importantly, treatment with 2-bromopalmitate (2-BP), a palmitate analogue that blocks palmitate incorporation into proteins, abrogated FLT3-ITD palmitoylation (Figure 1B). Moreover, we confirmed the palmitoylation of endogenous FLT3-ITD in MV4;11 cells, an AML cell line with biallelic FLT3-ITD mutations (Figure 1C; supplemental Figure 1A). Of note, endogenous FLT3-WT in SEMK2 cells was also palmitoylated (Figure 1D).
![Palmitoylation of FLT3 at C563 specifically regulates FLT3-ITD–mediated signaling and cell growth. (A) Analysis of FLT3-ITD palmitoylation with the APE assay in 293T cells transiently expressing MigR1-FLT3-ITD. HAM, hydroxylamine (NH2OH). (B) APE analysis of TF-1 cells stably expressing MigR1-FLT3-ITD treated with the palmitoylation inhibitor 2-BP or vehicle control ethanol (EtOH). (C-D) Examination of palmitoylation of endogenous FLT3 proteins in FLT3-ITD+ MV4;11 AML cell line (C) and FLT3-WT SEMK2 cells (D). (E) Palmitoylation status of FLT3-ITD mutants with various cysteines mutated to serines by using the APE assay. (F) Examination of the effect of C563S mutation on the palmitoylation of FLT3-WT and oncogenic FLT3-ITD and FLT3-D835Y mutants in 293T cells. (G) TF-1 cells stably expressing empty vector (MigR1 or EV), FLT3-ITD, or FLT3-ITD-C563S were established, and cell lysates were subjected to WB analysis for various signaling proteins. ITD-C563S proteins showed 2 bands in the immunoblot with long exposure (LE), in comparison with short exposure (SE). (H) Signaling sensitivity to human FLT3L (hFLT3L). TF-1 cells stably expressing different FLT3 variants were starved and stimulated with a graded concentration of FLT3L for 10 minutes. Cell lysates were subjected to WB analysis with the indicated antibodies. (I) TF-1 cells as in panel H were plated in triplicate in a graded concentration of FLT3L for 3 days. Cell growth was examined using the MTT assay. In all relevant panels, data are presented as means ± standard deviation. ***P < .001; ns, not significant, as determined by 2-tailed Student t tests. MTT, 3-(4,5-dimethylthiazol-2-yl)-2,5-dimethyltetrazolium bromide; 3-[4,5-dimethylthiazol-2-yl]-2,5-diphenyltetrazolium bromide.](https://ash.silverchair-cdn.com/ash/content_public/journal/blood/138/22/10.1182_blood.2021011582/5/m_bloodbld2021011582f1.png?Expires=1769096582&Signature=y96Yb-QvEuN~LrIYwgAKBx60by0YM7EIBUyGqyJqbHu9c6TRm8KaqHLUrfTzdaABfsm~FHXS6dyZ4i6kZCOcK1FTMa1NqegkDaB9qpK0lwaQh57KGJFfdFK58vE4l4XiP22UHybGzpfmjABVU-9SXxkMZLGurw3RaU8rAndkenfpOGZQCBmolTZT0NroYNLaQc5vRYigb0SWRrNdUmeGAyFbhg0jADJyVLPCdt3xU12agfg4ldcwtyeG4Xq8b-78Oj7eMjDg7sTSiFooPt3MAIAiaYEA5z-WE0babrx9maFOQlPEbDom4U8YSZMgyMRIlNuyIXyEF65i2yW1AJt93g__&Key-Pair-Id=APKAIE5G5CRDK6RD3PGA)
Palmitoylation of FLT3 at C563 specifically regulates FLT3-ITD–mediated signaling and cell growth. (A) Analysis of FLT3-ITD palmitoylation with the APE assay in 293T cells transiently expressing MigR1-FLT3-ITD. HAM, hydroxylamine (NH2OH). (B) APE analysis of TF-1 cells stably expressing MigR1-FLT3-ITD treated with the palmitoylation inhibitor 2-BP or vehicle control ethanol (EtOH). (C-D) Examination of palmitoylation of endogenous FLT3 proteins in FLT3-ITD+ MV4;11 AML cell line (C) and FLT3-WT SEMK2 cells (D). (E) Palmitoylation status of FLT3-ITD mutants with various cysteines mutated to serines by using the APE assay. (F) Examination of the effect of C563S mutation on the palmitoylation of FLT3-WT and oncogenic FLT3-ITD and FLT3-D835Y mutants in 293T cells. (G) TF-1 cells stably expressing empty vector (MigR1 or EV), FLT3-ITD, or FLT3-ITD-C563S were established, and cell lysates were subjected to WB analysis for various signaling proteins. ITD-C563S proteins showed 2 bands in the immunoblot with long exposure (LE), in comparison with short exposure (SE). (H) Signaling sensitivity to human FLT3L (hFLT3L). TF-1 cells stably expressing different FLT3 variants were starved and stimulated with a graded concentration of FLT3L for 10 minutes. Cell lysates were subjected to WB analysis with the indicated antibodies. (I) TF-1 cells as in panel H were plated in triplicate in a graded concentration of FLT3L for 3 days. Cell growth was examined using the MTT assay. In all relevant panels, data are presented as means ± standard deviation. ***P < .001; ns, not significant, as determined by 2-tailed Student t tests. MTT, 3-(4,5-dimethylthiazol-2-yl)-2,5-dimethyltetrazolium bromide; 3-[4,5-dimethylthiazol-2-yl]-2,5-diphenyltetrazolium bromide.
Palmitoylation of FLT3 at C563 specifically regulates FLT3-ITD–mediated signaling and cell growth. (A) Analysis of FLT3-ITD palmitoylation with the APE assay in 293T cells transiently expressing MigR1-FLT3-ITD. HAM, hydroxylamine (NH2OH). (B) APE analysis of TF-1 cells stably expressing MigR1-FLT3-ITD treated with the palmitoylation inhibitor 2-BP or vehicle control ethanol (EtOH). (C-D) Examination of palmitoylation of endogenous FLT3 proteins in FLT3-ITD+ MV4;11 AML cell line (C) and FLT3-WT SEMK2 cells (D). (E) Palmitoylation status of FLT3-ITD mutants with various cysteines mutated to serines by using the APE assay. (F) Examination of the effect of C563S mutation on the palmitoylation of FLT3-WT and oncogenic FLT3-ITD and FLT3-D835Y mutants in 293T cells. (G) TF-1 cells stably expressing empty vector (MigR1 or EV), FLT3-ITD, or FLT3-ITD-C563S were established, and cell lysates were subjected to WB analysis for various signaling proteins. ITD-C563S proteins showed 2 bands in the immunoblot with long exposure (LE), in comparison with short exposure (SE). (H) Signaling sensitivity to human FLT3L (hFLT3L). TF-1 cells stably expressing different FLT3 variants were starved and stimulated with a graded concentration of FLT3L for 10 minutes. Cell lysates were subjected to WB analysis with the indicated antibodies. (I) TF-1 cells as in panel H were plated in triplicate in a graded concentration of FLT3L for 3 days. Cell growth was examined using the MTT assay. In all relevant panels, data are presented as means ± standard deviation. ***P < .001; ns, not significant, as determined by 2-tailed Student t tests. MTT, 3-(4,5-dimethylthiazol-2-yl)-2,5-dimethyltetrazolium bromide; 3-[4,5-dimethylthiazol-2-yl]-2,5-diphenyltetrazolium bromide.
Next, we identified the cysteines in FLT3 that would be palmitoylated, by using clustering and scoring strategy (CSS)-palm and naive Bayesian algorithm (NBA)-palm (supplemental Figure 1B).23,24 We then mutated these cysteines individually or in combination and found that the conserved cysteine 563 (C563) was critical, as mutation of cysteine to serine (C563S) completely abolished FLT3-ITD palmitoylation (Figure 1E; supplemental Figure 1A). In addition, this mutation abolished palmitoylation of FLT3-WT and the FLT3-D835Y mutant (Figure 1F). These data suggest that FLT3 and its oncogenic variants are palmitoylated at C563.
Disruption of palmitoylation rewires FLT3-ITD signaling and augments cell growth
To study the impact of palmitoylation in FLT3 function, we first examined the downstream signaling of FLT3-ITD, with or without the C563S mutation that disrupts palmitoylation. Because parental TF-1 cells do not express FLT3 or respond to FLT3L, they enable us to examine the signaling responses in cells that exogenously express different FLT3 variants. Consistent with prior studies,4,8,9,25 FLT3-ITD resulted in constitutive phosphorylation of STAT5, but failed to activate AKT or ERK (Figure 1G-H). The C563S mutation led to a sharp increase in AKT and ERK, as well as FLT3 phosphorylation, while maintaining STAT5 activation (Figure 1G-H). Time course studies showed sustained activation of STAT5, AKT, and ERK in FLT3-ITD-C563S expressing cells, as opposed to sustained pSTAT5 but not pAKT or pERK in FLT3-ITD–expressing cells (supplemental Figure 1C). Moreover, we observed an additional FLT3-ITD-C563S protein band that was slowly migrating and heavily phosphorylated, in stark contrast to FLT3-ITD (Figure 1G-H; supplemental Figure 1C), indicating the presence of a highly glycosylated, mature form.
Next, we asked whether the function of FLT3-WT and the TKD mutant FLT3-D835Y was influenced by palmitoylation. FLT3-C563S–expressing cells exhibited ligand-dependent phosphorylation of FLT3, AKT, and ERK, but not of STAT5, similar to FLT3-WT–expressing cells (Figure 1H; supplemental Figure 1C). The D835Y mutation induced constitutive activation of AKT and ERK, but not of STAT5 (supplemental Figure 1D), in line with published reports.9,25 Of note, the C563S mutation did not affect the signaling mediated by FLT3-D835Y (supplemental Figure 1D). Taken together, these results suggest a unique role for palmitoylation in modifying FLT3-ITD signaling, but not that of FLT3-WT or FLT3-D835Y.
The dramatic change in FLT3-ITD signaling upon perturbations in palmitoylation prompted us to test its impact on cell growth. In TF-1 cells, FLT3L induced dose-dependent proliferation when FLT3-WT was expressed, whereas FLT3-ITD conferred ligand-independent proliferation, albeit at a lower rate than that of FLT3-WT at the maximal concentration of FLT3L (Figure 1I). The C563S mutation significantly enhanced FLT3-ITD–mediated cell growth that correlated with enhanced signaling (Figure 1I). In contrast, the C563S mutation did not affect the cell growth conferred by FLT3-WT or FLT3-D835Y (Figure 1I; supplemental Figure 1E). Collectively, these observations revealed that disruption of FLT3 palmitoylation specifically affects FLT3-ITD–mediated signaling and cell growth.
Disruption of palmitoylation alleviates ER retention and promotes surface expression of FLT3-ITD
Newly synthesized FLT3 proteins undergo various forms of glycosylation, first in the ER, then in the Golgi apparatus, before the mature form is inserted in the PM. The presence of the underglycosylated immature form and complex glycosylated mature form of FLT3-WT correlates with its distribution in the intracellular compartments ER and Golgi/PM, respectively (Figure 1F,H; supplemental Figure 1C-D).7,9 In contrast, FLT3-ITD is mostly localized in the ER, with much reduced PM localization that is consistent with a single underglycosylated band.7-9,26 We thus hypothesized that disruption of palmitoylation, a form of lipid conjugation, may affect the cellular localization of FLT3. To test this possibility, we compared the cell surface level of ectopically expressed FLT3 in TF-1 cells by flow cytometry (Figure 2A). FLT3-WT showed abundant distribution on the cell surface, whereas FLT3-ITD was almost undetectable (Figure 2B-C). Importantly, the C563S mutation markedly increased the surface level of FLT3-ITD, without significantly affecting that of FLT3-WT or FLT3-D835Y (Figure 2C). To understand this phenomenon, we examined the subcellular localization of FLT3 variants by using immunofluorescence followed by confocal microscopy. The results demonstrated that FLT3-ITD was largely localized in the ER (Figure 2D-E), whereas FLT3-WT was mainly in the Golgi/PM (supplemental Figure 2A-B). Moreover, disruption of palmitoylation significantly altered subcellular localization of FLT3-ITD, with a large fraction of FLT3-ITD-C563S in the Golgi/PM (Figure 2D-E). In contrast, the distribution of FLT3-WT was not changed by the C563S mutation (Figure 2B-C; supplemental Figure 2A-B). Importantly, pharmacological disruption of palmitoylation by 2-BP treatment markedly redistributed FLT3-ITD from the ER to the Golgi/PM (Figure 2F-G). We thus concluded that disruption of palmitoylation alleviates FLT3-ITD ER retention and promotes its trafficking toward Golgi and the cell surface.
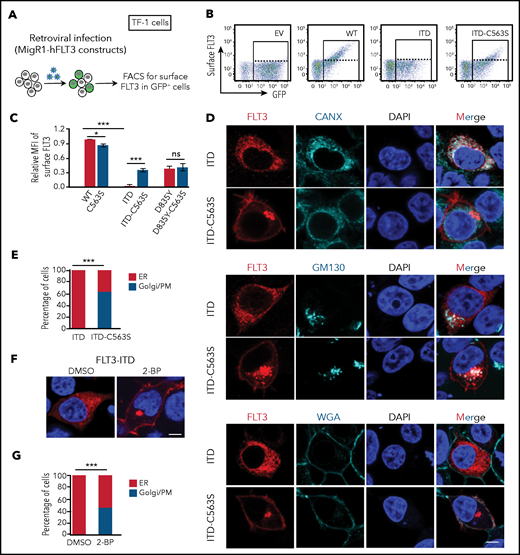
Disruption of palmitoylation alters FLT3-ITD intracellular localization. (A) Examination of FLT3 surface level elicited by C563S mutation. (B) Representative flow plots of surface FLT3 expression in TF-1 cells stably reconstituted with different MigR1-FLT3 variants. (C) Quantification of relative mean fluorescence intensity (MFI) of surface FLT3 by flow cytometry from 3 independent experiments. Data are presented as means ± standard error of the mean; P-values were determined by 2-tailed Student t tests. (D) Representative immunofluorescent confocal images of FLT3 (red) with the ER marker CANX (cyan, top panel), Golgi marker GM130 (cyan, middle panel), or AlexaFluor647-conjugated PM marker wheat germ agglutinin (WGA; bottom panel) in 293T cells expressing MigR1-FLT3-ITD or FLT3-ITD-C563S. The nuclei were stained with 4′,6-diamidino-2-phenylindole (DAPI; blue). Bar represents 10 μm. (E) Quantification of percentages of cells expressing FLT3-ITD (n = 90) or FLT3-ITD-C563S mutant (n = 84) with FLT3 distribution predominantly in the ER or Golgi/PM, as shown in panel D. (F) Representative confocal images of 293T cells expressing MigR1-FLT3-ITD treated or not with 2-BP. Immunofluorescence staining was performed as that in panel D. Bar represents 10 μm. (G) Quantification of percentages of cells with FLT3-ITD distributed predominantly in the ER or Golgi/PM in the absence (n = 106) or presence (n = 120) of 2-BP, as shown in panel F. (E,G) P-values were determined by Fisher’s exact test; (C) 2-tailed Student t tests. In all relevant panels, *P < .05; ***P < .001; ns, not significant.
Disruption of palmitoylation alters FLT3-ITD intracellular localization. (A) Examination of FLT3 surface level elicited by C563S mutation. (B) Representative flow plots of surface FLT3 expression in TF-1 cells stably reconstituted with different MigR1-FLT3 variants. (C) Quantification of relative mean fluorescence intensity (MFI) of surface FLT3 by flow cytometry from 3 independent experiments. Data are presented as means ± standard error of the mean; P-values were determined by 2-tailed Student t tests. (D) Representative immunofluorescent confocal images of FLT3 (red) with the ER marker CANX (cyan, top panel), Golgi marker GM130 (cyan, middle panel), or AlexaFluor647-conjugated PM marker wheat germ agglutinin (WGA; bottom panel) in 293T cells expressing MigR1-FLT3-ITD or FLT3-ITD-C563S. The nuclei were stained with 4′,6-diamidino-2-phenylindole (DAPI; blue). Bar represents 10 μm. (E) Quantification of percentages of cells expressing FLT3-ITD (n = 90) or FLT3-ITD-C563S mutant (n = 84) with FLT3 distribution predominantly in the ER or Golgi/PM, as shown in panel D. (F) Representative confocal images of 293T cells expressing MigR1-FLT3-ITD treated or not with 2-BP. Immunofluorescence staining was performed as that in panel D. Bar represents 10 μm. (G) Quantification of percentages of cells with FLT3-ITD distributed predominantly in the ER or Golgi/PM in the absence (n = 106) or presence (n = 120) of 2-BP, as shown in panel F. (E,G) P-values were determined by Fisher’s exact test; (C) 2-tailed Student t tests. In all relevant panels, *P < .05; ***P < .001; ns, not significant.
To further assess whether the redistribution of FLT3-ITD-C563S toward the Golgi/PM is through the classic exocytosis route, we treated the cells with Brefeldin A (BFA), to block transportation from the ER to the Golgi. BFA abrogated the surface localization of FLT3-ITD-C563S, leading to its accumulation mostly in the ER and somewhat in the Golgi (supplemental Figure 2C-D). Consistently, BFA treatment in TF-1 cells led to a sharp decline in surface FLT3-ITD-C563S level (supplemental Figure 2E-F), concomitant with the disappearance of the glycosylated form (supplemental Figure 2G). Moreover, altered cellular localization changed signaling transduction, as BFA reduced AKT and ERK activation conferred by FLT3-ITD-C563S (supplemental Figure 2G). Collectively, these data indicate that disruption of palmitoylation alleviates ER retention and promotes surface expression of FLT3-ITD, thereby rewiring signaling transduction.
We next tested whether there is a functional interplay between FLT3 palmitoylation and phosphorylation, as it has been shown that inhibition of phosphorylation by quizartinib also increases FLT3-ITD surface expression.27 We found that neither gilteritinib nor quizartinib affected FLT3-ITD palmitoylation (supplemental Figure 3A). Moreover, FLT3 TKIs increased FLT3-ITD surface levels even when palmitoylation was ablated in the ITD-C563S mutant cells (supplemental Figure 3B), indicating that TKI regulation of FLT3-ITD surface expression is independent of palmitoylation.
Disruption of FLT3-ITD palmitoylation promotes AML progression in vivo
To validate our findings in TF-1 cells that exogenously express FLT3, we generated C563S mutation in the endogenous FLT3-ITD locus in MV4;11 cells via CRISPR/Cas9-mediated genome editing (supplemental Figure 4A). We obtained heterozygous C563S (ITD/CS Het) and homozygous C563S (ITD/CS Homo)-edited clones along with unedited clones (ITD) for our experiments. First, palmitoylation occurred in both ITD and ITD/CS Het clones, but was completely abolished in the ITD/CS Homo clones (Figure 3A). Next, ITD/CS Homo clones exhibited increased surface FLT3-ITD level with a moderate increase in the Het clones (Figure 3B). Moreover, AKT and ERK phosphorylation was enhanced in the ITD/CS Homo clones, with intermediate levels in the Het clones, as compared with the unedited clones (Figure 3C). More important, cell growth in liquid cultures and colonogenic assays revealed superior growth of ITD/CS Homo clones over that of ITD/CS Het or ITD clones (Figure 3D-E; supplemental Figure 4B). Hence, our data indicate that disruption of palmitoylation increases the FLT3-ITD cell surface level, FLT3-ITD–mediated signaling, and cell growth.

Disruption of palmitoylation promotes leukemia cell growth and leukemia progression in vivo. (A) Examination of palmitoylation status of endogenous FLT3-ITD by using the APE analysis in different MV4;11 cell clones that were either not edited (ITD) or were edited for C563S heterozygous (ITD/CS Het) or homozygous (ITD/CS Homo) mutations via CRISPR/Cas9. (B) Quantification of surface FLT3 levels in ITD, ITD/CS Het, and ITD/CS Homo MV4;11 clones determined by flow cytometry. (C) Examination of downstream signaling in individual MV4;11 clones using WB analysis. (D) Relative cell growth of ITD, ITD/CS Het, and ITD/CS Homo MV4;11 clones at different days, as determined by enumeration of the cells. (E) Different MV4;11 clones were plated in methylcellulose media and the number of colony-forming leukemia cells quantified after 7 to 10 days. (F) Bioluminescence imaging of NSG mouse recipients of xenografts of unedited FLT3-ITD or of ITD/CS Homo–edited MV4;11 clones expressing firefly luciferase-T2A-mCherry at 1 and 2 weeks. (G) Quantification of bioluminescence signals of mouse recipients of xenografts as shown in panel F. Each symbol represents an individual mouse (ITD, n = 7; ITD/CS Homo, n = 8). Means ± standard error of the mean are presented as vertical lines. (B,D-E) Data analyses were performed in triplicate; results are presented as means ± standard deviation. In all relevant panels, *P < .05; **P < .01; ***P < .001; ns, not significant, as determined by 2-tailed Student t test.
Disruption of palmitoylation promotes leukemia cell growth and leukemia progression in vivo. (A) Examination of palmitoylation status of endogenous FLT3-ITD by using the APE analysis in different MV4;11 cell clones that were either not edited (ITD) or were edited for C563S heterozygous (ITD/CS Het) or homozygous (ITD/CS Homo) mutations via CRISPR/Cas9. (B) Quantification of surface FLT3 levels in ITD, ITD/CS Het, and ITD/CS Homo MV4;11 clones determined by flow cytometry. (C) Examination of downstream signaling in individual MV4;11 clones using WB analysis. (D) Relative cell growth of ITD, ITD/CS Het, and ITD/CS Homo MV4;11 clones at different days, as determined by enumeration of the cells. (E) Different MV4;11 clones were plated in methylcellulose media and the number of colony-forming leukemia cells quantified after 7 to 10 days. (F) Bioluminescence imaging of NSG mouse recipients of xenografts of unedited FLT3-ITD or of ITD/CS Homo–edited MV4;11 clones expressing firefly luciferase-T2A-mCherry at 1 and 2 weeks. (G) Quantification of bioluminescence signals of mouse recipients of xenografts as shown in panel F. Each symbol represents an individual mouse (ITD, n = 7; ITD/CS Homo, n = 8). Means ± standard error of the mean are presented as vertical lines. (B,D-E) Data analyses were performed in triplicate; results are presented as means ± standard deviation. In all relevant panels, *P < .05; **P < .01; ***P < .001; ns, not significant, as determined by 2-tailed Student t test.
To evaluate the impact of palmitoylation on FLT3-ITD–conferred leukemia growth in vivo, we stably expressed luciferase with mCherry marker via lentiviral transduction in 2 independent ITD/CS Homo clones, along with ITD control clones, and confirmed that the luciferase activities were comparable in different clones (data not shown). Subsequently, we transplanted an equal number of mCherry+ cells into sublethally irradiated NSG mice and examined leukemia cell growth by using live-animal imaging. Our data showed that disruption of palmitoylation dramatically exacerbated the leukemia burden as evidenced by intensified bioluminescence signal in mouse recipients of ITD/CS Homo–xenografts, as compared with that of recipients of ITD transplants (Figure 3F-G). Hence, these results demonstrate that disruption FLT3-ITD palmitoylation promotes leukemia progression in vivo.
ZDHHC6-mediated palmitoylation restrains FLT3-ITD surface expression, signaling, and leukemogenic activity
Having established the importance of FLT3-ITD palmitoylation, we set out to identify the PAT(s) responsible for catalyzing FLT3 palmitoylation. We transfected FLT3-ITD, along with 23 mammalian ZDHHCs28 in 293T cells. ZDHHC2, ZDHHC6, and ZDHHC15 were identified as potential PATs for FLT3-ITD because they increased the ratio of palm-FLT3-ITD to non–palm-FLT3-ITD (supplemental Figure 5A). ZDHHC15 was excluded in subsequent studies for its extremely low expression in hematopoietic cell lines (supplemental Figure 5B). Both ZDHHC2 and ZDHHC6 showed interactions with FLT3 and its variants in 293T cells (Figure 4A; supplemental Figure 5C). We next generated CRISPR/Cas9-mediated knockout (KO) of ZDHHC2 or ZDHHC6 in MV4;11 cells. Because of the unavailability of workable antibodies against ZDHHC2 or ZDHHC6, we validated the KO efficiency by TIDE (Tracking of Indels by Decomposition) analysis (supplemental Figure 5D-E).29ZDHHC6 deletion abrogated the level of palm-FLT3-ITD in MV4;11 cells, whereas deletion of ZDHHC2 displayed a moderate effect (Figure 4B). The palmitoylation of the ER resident protein calnexin (CANX) was also decreased by ZDHHC6 KO.22 Similar results were obtained in TF-1 cells expressing exogenous FLT3-ITD via short hairpin RNA knockdown of ZDHHC2 or ZDHHC6 (supplemental Figure 5F-G). Therefore, we identified ZDHHC6 as the predominant PAT for FLT3 palmitoylation, whereas ZDHHC2 was identified as a minor PAT.
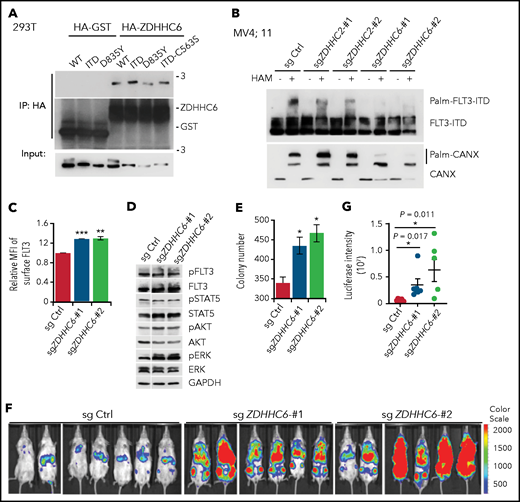
ZDHHC6 is the predominant PAT for FLT3. (A) ZDHHC6 interacts with all FLT3 variants. 293T cells transfected with HA-GST (control) or HA-ZDHHC6, along with the indicated FLT3 constructs, were immunoprecipitated by HA-EZ agarose beads, followed by western blot (WB) analysis. (B) Examination of endogenous FLT3-ITD palmitoylation in MV4;11 cells depleted of ZDHHC2 or ZDHHC6 with 2 independent guide RNAs (gRNAs), by the APE assay. (C) Quantification of surface FLT3-ITD levels in MV4;11 cells depleted of ZDHHC6 by 2 different gRNAs in comparison with control (Ctrl) gRNA (n = 3). (D) WB analysis of signal transduction in MV4;11 cells depleted of ZDHHC6, in comparison with Ctrl gRNA. (E) Colony-forming capacity of MV4;11 cells depleted of ZDHHC6 in triplicate. (F) Bioluminescence imaging of NSG mouse recipients of MV4;11 cell transplants depleted of ZDHHC6 with 2 different gRNAs along with the control gRNA. (G) Quantification of bioluminescence signals from panel F. Single guide (sg) Ctrl (n = 7), sgZDHHC6-#1 (n = 6), or sgZDHHC6-#2 (n = 6). Each symbol represents an individual mouse. Means ± standard error of the mean are presented as vertical lines. (C,E) Data are presented as means ± standard deviation. In all relevant panels, *P < .05; **P < .01; ***P < .001; ns, not significant, as determined by 2-tailed Student t tests.
ZDHHC6 is the predominant PAT for FLT3. (A) ZDHHC6 interacts with all FLT3 variants. 293T cells transfected with HA-GST (control) or HA-ZDHHC6, along with the indicated FLT3 constructs, were immunoprecipitated by HA-EZ agarose beads, followed by western blot (WB) analysis. (B) Examination of endogenous FLT3-ITD palmitoylation in MV4;11 cells depleted of ZDHHC2 or ZDHHC6 with 2 independent guide RNAs (gRNAs), by the APE assay. (C) Quantification of surface FLT3-ITD levels in MV4;11 cells depleted of ZDHHC6 by 2 different gRNAs in comparison with control (Ctrl) gRNA (n = 3). (D) WB analysis of signal transduction in MV4;11 cells depleted of ZDHHC6, in comparison with Ctrl gRNA. (E) Colony-forming capacity of MV4;11 cells depleted of ZDHHC6 in triplicate. (F) Bioluminescence imaging of NSG mouse recipients of MV4;11 cell transplants depleted of ZDHHC6 with 2 different gRNAs along with the control gRNA. (G) Quantification of bioluminescence signals from panel F. Single guide (sg) Ctrl (n = 7), sgZDHHC6-#1 (n = 6), or sgZDHHC6-#2 (n = 6). Each symbol represents an individual mouse. Means ± standard error of the mean are presented as vertical lines. (C,E) Data are presented as means ± standard deviation. In all relevant panels, *P < .05; **P < .01; ***P < .001; ns, not significant, as determined by 2-tailed Student t tests.
Next, we investigated the biological effects of ZDHHC6 on FLT3-ITD. We found that ZDHHC6 deletion significantly elevated the FLT3-ITD surface level in MV4;11 cells (Figure 4C), as well as the ectopically expressed FLT3-ITD in TF-1 cells (supplemental Figure 5H-I). Importantly, ZDHHC6 deletion enhanced the activation of AKT and ERK (Figure 4D) and significantly augmented the colony-forming capacity of MV4;11 cells (Figure 4E). These data indicate that ZDHHC6-mediated FLT3-ITD palmitoylation affects endogenous FLT3-ITD signaling and growth-promoting activity. To further study ZDHHC6 function in vivo, we established ZDHHC6-KO MV4;11 cells stably expressing luciferase and transplanted them into NSG mice. Live-animal imaging data revealed that ZDHHC6 deletion dramatically exacerbated leukemia cell growth in NSG mice (Figure 4F-G). Overall, these data suggest that ZDHHC6 is the major PAT enzyme that catalyzes FLT3 palmitoylation and regulates FLT3-ITD–conferred signaling and development of leukemia.
Abrogation of palmitoylation enhances proliferation of primary human FLT3-ITD+ AMLs
Our findings so far prompted us to investigate the impact of FLT3-ITD palmitoylation in primary AML samples. We chose FLT3-ITD+ or FLT3-WT AMLs with high blast counts, but without complex cytogenetics (supplemental Table 1). In addition, we chose FLT3-ITD+ AMLs with high ITD/WT allele ratios, to ensure that we are detecting predominantly FLT3-ITD in subsequent studies.
We first investigated the palmitoylation status and the impact of palmitoylation on FLT3-ITD surface level in primary human AMLs. We found that both endogenous FLT3-WT and FLT3-ITD proteins were palmitoylated in all primary human AML samples examined (Figure 5A). The total FLT3 protein and the mRNA levels were comparable among AML samples (Figure 5A; supplemental Figure 6A). In contrast, the cell surface level of FLT3-ITD was significantly lower than that of FLT3-WT when we compared freshly thawed FLT3-ITD+ and FLT3-WT AMLs using flow cytometry (Figure 5B-C). In addition, we measured total FLT3 levels after fixation and permeabilization by flow cytometry and assessed the relative cell surface FLT3/total FLT3 levels. The data showed that the cell surface level of FLT3-ITD was indeed significantly lower than that of FLT3-WT in primary AMLs (Figure 5C).
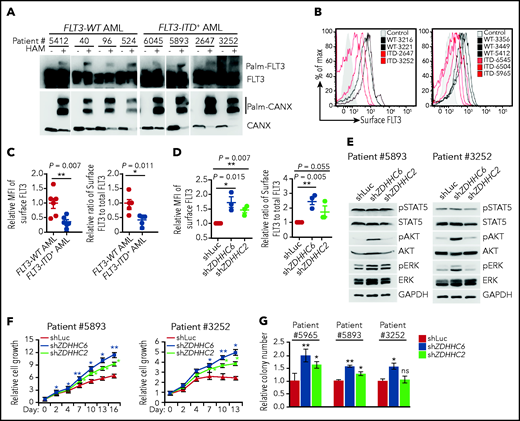
ZDHHC6-mediated palmitoylation restrains FLT3-ITD surface expression, signaling and colonogenic growth in primary human AMLs. (A) Examination of FLT3 palmitoylation in primary FLT3-WT and FLT3-ITD+ AML cells by the APE assay. (B) Flow cytometric plots showing cell surface FLT3 expression of various FLT3-WT (black traces) vs FLT3-ITD+ (red traces) primary AMLs. Control (shaded area) indicates secondary antibody only. (C) The quantification of the MFIs of surface FLT3 levels in FLT3-ITD+ AMLs (left; n = 5) relative to that in FLT3-WT AMLs (n = 6), as shown in panel B. Relative surface/total FLT3 level in FLT3-ITD+ AMLs (right) when compared with FLT3-WT AMLs. The total FLT3 levels were determined by flow cytometry after fixation and permeabilization of AML cells. (D) Quantification of the MFIs of surface FLT3 level (left) and relative surface-to-total FLT3 level (right) in FLT3-ITD+ AML cells depleted of ZDHHC2 or ZDHHC6 when compared with that of Luc control (n = 3 for each group). (E) WB analysis of signaling transduction in 2 FLT3-ITD+ patient AML cells depleted of ZDHHC2 or ZDHHC6 vs Luc. (F) Cell growth of FLT3-ITD+ patient AML cells upon depletion of ZDHHC2 or ZDHHC6 as in panel D. (G) Relative colony-forming capacity of 3 individual FLT3-ITD+ patient AML cells with depletion of ZDHHC2 or ZDHHC6 vs Luc. All relevant data are presented as means ± standard deviation. (C-D) Each symbol represents individual patient AML cells. (F-G) Data analyses were performed in triplicate. In all relevant panels, *P < .05; **P < .01; ns, not significant, as determined by 2-tailed Student t test.
ZDHHC6-mediated palmitoylation restrains FLT3-ITD surface expression, signaling and colonogenic growth in primary human AMLs. (A) Examination of FLT3 palmitoylation in primary FLT3-WT and FLT3-ITD+ AML cells by the APE assay. (B) Flow cytometric plots showing cell surface FLT3 expression of various FLT3-WT (black traces) vs FLT3-ITD+ (red traces) primary AMLs. Control (shaded area) indicates secondary antibody only. (C) The quantification of the MFIs of surface FLT3 levels in FLT3-ITD+ AMLs (left; n = 5) relative to that in FLT3-WT AMLs (n = 6), as shown in panel B. Relative surface/total FLT3 level in FLT3-ITD+ AMLs (right) when compared with FLT3-WT AMLs. The total FLT3 levels were determined by flow cytometry after fixation and permeabilization of AML cells. (D) Quantification of the MFIs of surface FLT3 level (left) and relative surface-to-total FLT3 level (right) in FLT3-ITD+ AML cells depleted of ZDHHC2 or ZDHHC6 when compared with that of Luc control (n = 3 for each group). (E) WB analysis of signaling transduction in 2 FLT3-ITD+ patient AML cells depleted of ZDHHC2 or ZDHHC6 vs Luc. (F) Cell growth of FLT3-ITD+ patient AML cells upon depletion of ZDHHC2 or ZDHHC6 as in panel D. (G) Relative colony-forming capacity of 3 individual FLT3-ITD+ patient AML cells with depletion of ZDHHC2 or ZDHHC6 vs Luc. All relevant data are presented as means ± standard deviation. (C-D) Each symbol represents individual patient AML cells. (F-G) Data analyses were performed in triplicate. In all relevant panels, *P < .05; **P < .01; ns, not significant, as determined by 2-tailed Student t test.
We found that both ZDHHC2 and ZDHHC6 were expressed in AML cells at the mRNA level (supplemental Figure 6B). To test whether palmitoylation restrains FLT3-ITD surface expression, we depleted ZDHHC6 or ZDHHC2 via lentiviral miR30-based shRNA knockdown. Notably, ZDHHC6 depletion markedly increased FLT3-ITD surface level in all 3 FLT3-ITD+ AMLs examined, whereas ZDHHC2 depletion resulted in a moderate effect (Figure 5D).
Last and importantly, we examined FLT3-mediated signaling and cell growth affected by palmitoylation in AMLs. FLT3-WT AMLs exhibited AKT and ERK but not STAT5 activation in response to FLT3L stimulation. In contrast, FLT3-ITD+ AMLs displayed constitutively activated STAT5 but weak AKT and ERK phosphorylation (supplemental Figure 6C). As a control, granulocyte-macrophage colony-stimulating factor induced robust STAT5 phosphorylation in all AML samples (supplemental Figure 6C),30,31 indicating that FLT3-WT AMLs have an intact JAK-STAT5 signaling axis. These data validate that FLT3L does not normally induce STAT5 phosphorylation in FLT3-WT AMLs, whereas FLT3-ITD confers aberrant and constitutive STAT5 activation. To determine the impact of ZDHHC-mediated palmitoylation on FLT3-ITD signaling and cell growth, we depleted ZDHHC6 or ZDHHC2 in primary FLT3-ITD+ AML cells. ZDHHC6 depletion enhanced AKT and ERK activation in FLT3-ITD+ AMLs, and ZDHHC2 depletion showed moderate influence (Figure 5E). More important, ZDHHC6 depletion promoted cell proliferation and enhanced the colony-forming capacity of FLT3-ITD+ AML cells, whereas ZDHHC2 depletion showed a moderate effect (Figure 5F-G). Hence, our data revealed that disruption of ZDHHC6-mediated palmitoylation enhances surface FLT3-ITD expression and FLT3-ITD–mediated signaling and proliferation in primary human AMLs.
Pharmacological inhibition of FLT3-ITD depalmitoylation synergizes with gilteritinib in constraining oncogenic signaling and leukemia progression
Having established that palmitoylation exerts a profound effect on FLT3-ITD activity, we further explored whether we could pharmacologically inhibit FLT3-ITD depalmitoylation for therapeutic purposes. Palmostatin B (palm B), a pan-depalmitoylase inhibitor, significantly increased FLT3-ITD palmitoylation (supplemental Figure 7A). In addition, palm B inhibited AKT and ERK activation in a dose-dependent manner in MV4;11 cells (supplemental Figure 7B). Consequently, palm B markedly inhibited the growth of FLT3-ITD+ cells (MV4;11 and MOLM13), but minimally affected the growth of FLT3-WT (CMK and SEMK2) or FLT3− (K562) cells (Figure 6A).
![Depalmitoylation inhibitor synergizes with gilteritinib in restraining FLT3-ITD–mediated signaling and leukemia cell growth. (A) Cell growth curves of different leukemia cell lines in a graded dose of the depalmitoylation inhibitor palm B. Cells were grown in triplicate for 3 days; relative MTT values are shown. MV4;11: FLT3-ITD homozygous; MOLM13: FLT3-ITD heterozygous; CMK and SEMK2: FLT3-WT; K562: FLT3−. (B) MV4;11 cells were pretreated with DMSO, 60 μM palm B alone, 2 nM gilteritinib alone, or dual drugs for 6 hours, followed by xenotransplantation into sublethally irradiated NSG mice. Bioluminescence imaging at 2 weeks after xenograft is shown. (C) Quantification of bioluminescence signals as in panel B. DMSO (n = 5), palm B alone (n = 7), gilteritinib alone (n = 7), or dual drugs (n = 5). (D) Representative flow cytometric plots of surface FLT3 levels in FLT3-WT and FLT3-ITD+ AMLs, with or without 60 μM palm B treatment. (E) Quantification of surface FLT3 level as in panel D. FLT3-WT (n = 4) and FLT3-ITD+ patients with AML (n = 4). (F) Primary FLT3-WT and FLT3-ITD+ AML cells were grown in triplicate for 3 days in media containing graded concentrations of palm B. Cell growth was examined by MTT assay. (G) Primary FLT3-ITD+ AML cells were grown in triplicate for 3 days in the presence of various concentrations of palm B or gilteritinib, followed by MTT analysis. Drug synergy scoring calculated by CompuSyn software is shown. CI<1, synergism; CI = 1, additive effect; CI>1, antagonism. (H) Colony numbers of primary FLT3-ITD+ AML cells plated in triplicate in various concentrations of gilteritinib in the presence or absence of palm B. (I) Examination of FLT3-ITD downstream signaling in primary FLT3-ITD+ AML cells treated with the indicated doses of palm B, gilteritinib, or dual drugs. (A,F) Data in are presented as means ± SD. Statistics of the FLT3-WT and FLT3-ITD+ groups in panels A and F were first examined by 2-way analysis of variance (###P < .001), followed by Bonferroni post hoc tests for individual doses. *P < .05; **P < .01; ***P < .001. (C,E) Data are presented as means ± standard error of the mean. (C,E) Each symbol represents an individual mouse or patient AML sample. (H) Data are presented as means ± standard deviation. (H) *Comparison of different concentrations of gilteritinib to 0 nM gilteritinib in the respective DMSO or palm B group. #Comparison of the DMSO and palm B groups in the presence of the same concentration of gilteritinib. In all relevant panels, * ,** or ##P < .01; *** or ###P < .001, as determined by 2-tailed Student t test. CI, combination index; MTT, 3-[4,5-dimethylthiazol-2-yl]-2,5-diphenyltetrazolium bromide.](https://ash.silverchair-cdn.com/ash/content_public/journal/blood/138/22/10.1182_blood.2021011582/5/m_bloodbld2021011582f6.png?Expires=1769096582&Signature=ry~~d1oLKVMw70D36g5gaVKfECooZaR-VLogoZScNKRurTPbe3Xtxz2RhDQov4Td6H5GhhOgoWVHaobsehiYEEkrxYVXfsMyJS63srYwAtLO4exb8Zomi6cKvc2bCdrgbkycpUBdnicgJmspNE8RaXsz62gZNccPOyGZH~UPnlAnOPFkdOjf0ZQR3LNnRNY09KmeL5y2H4QPHhaxb1lj7jlFpztMG3i0bi~G44ues2XNq7QDV3Lrbh2ABOhmwWLkUjoN1vswPn6eERz5PC-NzT7MdQlBQJpWK22tX2rSxLXIGN9fFsO0vwLc8Fs103subpBgkPbhsK5lpGnzouo37w__&Key-Pair-Id=APKAIE5G5CRDK6RD3PGA)
Depalmitoylation inhibitor synergizes with gilteritinib in restraining FLT3-ITD–mediated signaling and leukemia cell growth. (A) Cell growth curves of different leukemia cell lines in a graded dose of the depalmitoylation inhibitor palm B. Cells were grown in triplicate for 3 days; relative MTT values are shown. MV4;11: FLT3-ITD homozygous; MOLM13: FLT3-ITD heterozygous; CMK and SEMK2: FLT3-WT; K562: FLT3−. (B) MV4;11 cells were pretreated with DMSO, 60 μM palm B alone, 2 nM gilteritinib alone, or dual drugs for 6 hours, followed by xenotransplantation into sublethally irradiated NSG mice. Bioluminescence imaging at 2 weeks after xenograft is shown. (C) Quantification of bioluminescence signals as in panel B. DMSO (n = 5), palm B alone (n = 7), gilteritinib alone (n = 7), or dual drugs (n = 5). (D) Representative flow cytometric plots of surface FLT3 levels in FLT3-WT and FLT3-ITD+ AMLs, with or without 60 μM palm B treatment. (E) Quantification of surface FLT3 level as in panel D. FLT3-WT (n = 4) and FLT3-ITD+ patients with AML (n = 4). (F) Primary FLT3-WT and FLT3-ITD+ AML cells were grown in triplicate for 3 days in media containing graded concentrations of palm B. Cell growth was examined by MTT assay. (G) Primary FLT3-ITD+ AML cells were grown in triplicate for 3 days in the presence of various concentrations of palm B or gilteritinib, followed by MTT analysis. Drug synergy scoring calculated by CompuSyn software is shown. CI<1, synergism; CI = 1, additive effect; CI>1, antagonism. (H) Colony numbers of primary FLT3-ITD+ AML cells plated in triplicate in various concentrations of gilteritinib in the presence or absence of palm B. (I) Examination of FLT3-ITD downstream signaling in primary FLT3-ITD+ AML cells treated with the indicated doses of palm B, gilteritinib, or dual drugs. (A,F) Data in are presented as means ± SD. Statistics of the FLT3-WT and FLT3-ITD+ groups in panels A and F were first examined by 2-way analysis of variance (###P < .001), followed by Bonferroni post hoc tests for individual doses. *P < .05; **P < .01; ***P < .001. (C,E) Data are presented as means ± standard error of the mean. (C,E) Each symbol represents an individual mouse or patient AML sample. (H) Data are presented as means ± standard deviation. (H) *Comparison of different concentrations of gilteritinib to 0 nM gilteritinib in the respective DMSO or palm B group. #Comparison of the DMSO and palm B groups in the presence of the same concentration of gilteritinib. In all relevant panels, * ,** or ##P < .01; *** or ###P < .001, as determined by 2-tailed Student t test. CI, combination index; MTT, 3-[4,5-dimethylthiazol-2-yl]-2,5-diphenyltetrazolium bromide.
Depalmitoylation inhibitor synergizes with gilteritinib in restraining FLT3-ITD–mediated signaling and leukemia cell growth. (A) Cell growth curves of different leukemia cell lines in a graded dose of the depalmitoylation inhibitor palm B. Cells were grown in triplicate for 3 days; relative MTT values are shown. MV4;11: FLT3-ITD homozygous; MOLM13: FLT3-ITD heterozygous; CMK and SEMK2: FLT3-WT; K562: FLT3−. (B) MV4;11 cells were pretreated with DMSO, 60 μM palm B alone, 2 nM gilteritinib alone, or dual drugs for 6 hours, followed by xenotransplantation into sublethally irradiated NSG mice. Bioluminescence imaging at 2 weeks after xenograft is shown. (C) Quantification of bioluminescence signals as in panel B. DMSO (n = 5), palm B alone (n = 7), gilteritinib alone (n = 7), or dual drugs (n = 5). (D) Representative flow cytometric plots of surface FLT3 levels in FLT3-WT and FLT3-ITD+ AMLs, with or without 60 μM palm B treatment. (E) Quantification of surface FLT3 level as in panel D. FLT3-WT (n = 4) and FLT3-ITD+ patients with AML (n = 4). (F) Primary FLT3-WT and FLT3-ITD+ AML cells were grown in triplicate for 3 days in media containing graded concentrations of palm B. Cell growth was examined by MTT assay. (G) Primary FLT3-ITD+ AML cells were grown in triplicate for 3 days in the presence of various concentrations of palm B or gilteritinib, followed by MTT analysis. Drug synergy scoring calculated by CompuSyn software is shown. CI<1, synergism; CI = 1, additive effect; CI>1, antagonism. (H) Colony numbers of primary FLT3-ITD+ AML cells plated in triplicate in various concentrations of gilteritinib in the presence or absence of palm B. (I) Examination of FLT3-ITD downstream signaling in primary FLT3-ITD+ AML cells treated with the indicated doses of palm B, gilteritinib, or dual drugs. (A,F) Data in are presented as means ± SD. Statistics of the FLT3-WT and FLT3-ITD+ groups in panels A and F were first examined by 2-way analysis of variance (###P < .001), followed by Bonferroni post hoc tests for individual doses. *P < .05; **P < .01; ***P < .001. (C,E) Data are presented as means ± standard error of the mean. (C,E) Each symbol represents an individual mouse or patient AML sample. (H) Data are presented as means ± standard deviation. (H) *Comparison of different concentrations of gilteritinib to 0 nM gilteritinib in the respective DMSO or palm B group. #Comparison of the DMSO and palm B groups in the presence of the same concentration of gilteritinib. In all relevant panels, * ,** or ##P < .01; *** or ###P < .001, as determined by 2-tailed Student t test. CI, combination index; MTT, 3-[4,5-dimethylthiazol-2-yl]-2,5-diphenyltetrazolium bromide.
Given that FLT3 TKIs have demonstrated promising antileukemia activity in treating FLT3-ITD+ AMLs,8,9 we tested whether disruption of FLT3-ITD palmitoylation affects its sensitivity to TKIs. Of note, although FLT3-ITD-C563S–expressing cells displayed cell growth superior to that of those expressing FLT3-ITD, they were responsive to FLT3 TKI-conferred growth inhibition in both TF1 and MV4;11 cells (supplemental Figure 7C-F). Interestingly, disruption of FLT3-ITD palmitoylation rendered cells slightly more resistant to quizartinib, but not to gilteritinib (supplemental Figure 7C-F). In contrast, ablation of palmitoylation in FLT3-D835Y did not affect its sensitivity to either TKI (supplemental Figure 7C-D). Furthermore, we found that palm B significantly dampened the effects of TKIs in promoting FLT3-ITD surface expression in MV4;11 cells (supplemental Figure 7G-H).
Although the US Food and Drug Administration–approved gilteritinib displays clinical benefit, it is not curative as a single agent.14 Therefore, we tested whether palm B could synergize with gilteritinib in inhibiting FLT3-ITD+ AMLs. In MV4;11 cells, combined treatment of gilteritinib and palm B substantially inhibited the cell growth and signaling conferred by FLT3-ITD, more than that of single drugs (supplemental Figure 7I-J). To evaluate the synergistic effects of gilteritinib and palm B in vivo, we pretreated MV4;11 cells with dimethyl sulfoxide (DMSO), alone and with single or combined drugs, and then transplanted them into NSG mice. Live-animal imaging data revealed that palm B synergized with gilteritinib to limit FLT3-ITD+ leukemia progression (Figure 6B-C).
We next examined the impact of palm B in patient-derived primary AML cells. Flow cytometry analysis revealed that palm B significantly decreased the cell surface level of FLT3 in primary FLT3-ITD+ AMLs but not that in FLT3-WT AMLs (Figure 6D-E). In addition, palm B markedly inhibited the growth of FLT3-ITD+ AML cells in comparison with FLT3-WT AMLs (Figure 6F), indicating that depalmitoylation is a therapeutic target specifically in FLT3-ITD+ AMLs. Indeed, combining gilteritinib and palm B synergistically inhibited the cell growth and colony-forming capacity of primary FLT3-ITD+ AMLs that is accompanied by an inhibition of AKT and ERK activation by palm B (Figure 6G-I). Therefore, our data revealed that pharmacological inhibition of FLT3-ITD depalmitoylation synergizes with FLT3 TKI gilteritinib in abrogating FLT3-ITD+ AMLs.
Discussion
FLT3 is frequently mutated in AML with FLT3-ITD being the most prevalent mutation. Notably, FLT3-ITD and FLT3-TKD mutants induce different phenotypes in both transgenic mouse models32-34 and human AMLs.35 FLT3-ITD confers distinct subcellular localizations and downstream signaling from its WT counterpart or the TKD mutants. However, little is known about the underlying mechanisms or its impact on leukemogenesis. In this study, we discovered that ZDHHC6-mediated S-palmitoylation plays critical roles in the regulation of FLT3-ITD, but not of WT or TKD mutants, which may underlie their distinct cellular and clinical characteristics. Disruption of FLT3 palmitoylation alleviates the ER retention of FLT3-ITD, promoting its trafficking through Golgi to the PM, thus rewiring its downstream signaling by activating AKT and ERK while maintaining STAT5 activation (supplemental Figure 8). Silencing ZDHHC6-mediated palmitoylation exacerbates FLT3-ITD–mediated progression of leukemia, whereas inhibition of depalmitoylation abrogates the growth of FLT3-ITD+ AML cells. These findings provide both molecular and functional insights into our understanding of lipid-dependent compartmentalization in AML leukemogenesis.
FLT3-ITD appears to be trapped in the ER to various degrees in different cell lines or model systems,7,8,27 perhaps owing to the differences in the efficiencies of the secretory pathway among these cell lines. It has been speculated that misfolding of FLT3-ITD protein, along with its constitutive and premature phosphorylation, results in its preferential association with the ER chaperone CANX and its retarded maturation in the ER.7,8 FLT3 TKIs increased FLT3-ITD surface expression (Reiter et al27; supplemental Figure 7), possibly by inhibiting its phospho-dependent interaction with ER resident proteins7 and preventing the degradation of surface-bound FLT3. In this study, we reveal a critical role for palmitoylation in tethering FLT3-ITD to the ER by the ER-resident PAT ZDHHC6.36 Genetic or pharmacological inhibition of palmitoylation reverses FLT3-ITD ER retention, attesting to a reversible spatial restriction of FLT3-ITD controlled by palmitoylation. Notably, FLT3-ITD phosphorylation does not affect its palmitoylation; TKI further increases the surface level of palmitoylation-deficient ITD-C563S mutant. These observations suggest that palmitoylation and phosphorylation are 2 distinct mechanisms regulating FLT3-ITD intracellular localization. Different from FLT3-ITD, FLT3-WT and the D853Y mutant show efficient trafficking to the Golgi/PM. Palmitoylation appears to play a negligible role in their maturation process and thus does not affect their signaling or cellular output.
We found that, although palmitoylation affects FLT3-ITD phosphorylation and cellular localization, disruption of FLT3-ITD palmitoylation does not affect its sensitivity to gilteritinib, a type 1 inhibitor that inhibits active kinases. Strikingly, depalmitoylation inhibitors reduce the surface expression, signaling, and cell growth conferred by FLT3-ITD synergistically with gilteritinib. The clinical use of gilteritinib is challenged by the acquired drug resistance from reactivation of the RAS/ERK pathway or secondary RAS mutations,14,37,38 implying a need for targeting both FLT3 and RAS in AML. It has been established that palmitoylation regulates the trafficking of N-RAS between Golgi and the PM,18 which is essential for N-RAS–mediated leukemia.39 Palmitoylation inhibitors abrogate N-RAS activity; however, such inhibitors cause cell damage because of their pleiotropic effects on lipid metabolism.40 Notably, depalmitoylation inhibitors disrupt the RAS palmitoylation cycle and its cellular localization, thus suppressing the growth of murine oncogenic N-RAS+ AML blasts.41-43 Our study suggests perturbation of the dynamic palmitoylation cycle as a new means of modulating FLT3 activity for the treatment of AMLs with FLT3-ITD mutations. Future investigations are warranted to explore whether depalmitoylation inhibitors have dual effects by inhibiting both FLT3-ITD and RAS/MAPK signaling in patients with AML who are FLT3-ITD+ with secondary RAS mutations/activation.
Acknowledgments
The authors thank Martin Carroll and the Human Stem Cell and Xenotransplant Core for AML samples; Jian Huang and Steve Sykes for kindly providing the MigR1-FLT3-ITD construct; Sarah K. Tasian for the pELNS.CBR-T2A vector; Junwei Shi for the MV4;11 and SEMK2 cell lines and the LRG-U6-sgRNA-EFS-GFP vector; and Ken Mills (Queen’s University Belfast, Belfast, UK) and Melanie Percy (Belfast City Hospital, Belfast, UK) for help with bioinformatics analysis.
This work was supported by National Institutes of Health, National Heart, Lung, and Blood Institute grants R01HL095675 and R01HL133828 (W.T.) and awards from Alex’s Lemonade Research Foundation and the Leukemia and Lymphoma Society (W.T.).
Authorship
Contribution: W.T. and K.L. conceived the project; W.T. supervised the experiments; W.T., K.L., and J.-G.R. designed the experiments and wrote the manuscript; X.H. performed the APE assay and identified the FLT3 palmitoylation site; K.L. performed all the remaining APE assays and experiments in TF-1 cells; J.-G.R. performed all the experiments in the MV4;11 cells and primary AML cells; J.G., K.L., and J.-G.R. performed the xenograft assay in NSG mice; and K.L. and C.G. performed the confocal microscopy.
Conflict-of-interest disclosure: The authors declare no competing financial interests.
Correspondence: Wei Tong, Children’s Hospital of Philadelphia, 3615 Civic Center Blvd, 310D, ARC, Philadelphia, PA 19104; e-mail: tongw@chop.edu.
Requests for original data, resources, and reagents should be directed to and will be fulfilled by the lead contact Wei Tong (tongw@chop.edu). No data sets were deposited from this study in any public repositories.
The online version of this article contains a data supplement.

This feature is available to Subscribers Only
Sign In or Create an Account Close Modal