

Key Points
CYB561A3 is critical for Burkitt B-cell lysosomal ferric iron reduction.
CYB561A3 knockout causes Burkitt iron starvation and lysosome and mitochondrial damage.

Abstract
Epstein-Barr virus (EBV) causes endemic Burkitt lymphoma, the leading childhood cancer in sub-Saharan Africa. Burkitt cells retain aspects of germinal center B-cell physiology with MYC-driven B-cell hyperproliferation; however, little is presently known about their iron metabolism. CRISPR/Cas9 analysis highlighted the little-studied ferrireductase CYB561A3 as critical for Burkitt proliferation but not for that of the closely related EBV-transformed lymphoblastoid cells or nearly all other Cancer Dependency Map cell lines. Burkitt CYB561A3 knockout induced profound iron starvation, despite ferritinophagy ad plasma membrane transferrin upregulation. Elevated concentrations of ascorbic acid, a key CYB561 family electron donor, or the labile iron source ferrous citrate rescued Burkitt CYB561A3 deficiency. CYB561A3 knockout caused catastrophic lysosomal and mitochondrial damage and impaired mitochondrial respiration. Conversely, lymphoblastoid B cells with the transforming EBV latency III program were instead dependent on the STEAP3 ferrireductase. These results highlight CYB561A3 as an attractive therapeutic Burkitt lymphoma target.
Introduction
B cells transform from quiescence into a highly metabolically active state to generate humoral responses. Activated B cells migrate to lymphoid tissues, where together with other immune cells they form specialized germinal center structures that support B-cell growth, immunoglobulin editing, and differentiation into memory and antibody-secreting cells.1-3 Epstein-Barr virus (EBV) subverts germinal center pathways to colonize the B-cell compartment of 95% of adults worldwide.4-7 EBV is associated with germinal center–derived B-cell malignancies, including endemic Burkitt lymphoma, the most common childhood cancer in sub-Saharan Africa.8,9 EBV also causes B-cell lymphomas in immunosuppressed hosts.4,7,10,11
Upon B-cell infection, EBV uses latency programs to convert B cells into lymphoblasts, in which infectious virus is not produced. Instead, newly infected cells quadruple in size over the first 3 days’ postinfection and undergo Burkitt-like growth.12-14 Subsequently, the EBV latency III program, composed of 6 Epstein-Barr nuclear antigens (EBNAs) and 2 membrane proteins, drives infected cells into germinal centers.6,15 If left unchecked by immune surveillance, latency III converts B cells into immortalized lymphoblastoid cell lines (LCLs). In immunocompetent hosts, EBV-infected cells instead differentiate into memory B cells, where the viral latency I program expresses only a single EBV-encoded protein. Latency I is observed in most EBV+ Burkitt lymphomas.16
Although iron is an essential nutrient, much remains to be learned about B-cell iron metabolism. The ability of iron to shuttle between ferric (Fe3+) and ferrous (Fe2+) iron states and to assemble into iron-sulfur (Fe-S) clusters enables it to serve as a key redox cofactor for electron transport, DNA synthesis, mitosis, and other processes.17-19 However, levels of bioavailable Fe2+ iron must be tightly regulated, as it can catalyze Fenton reactions that generate toxic hydroxyl radicals, resulting in damage to DNA, lipids, and protein.3 To limit the amount of free iron, ferritin nanocages, comprising heavy and light chains, store >4000 iron atoms.17,19,20 Conversely, depletion of labile iron pools triggers homeostatic responses to restore free iron levels, including autophagic ferritin delivery to lysosomes (ferritinophagy).20,21
Transferrin-bound iron is delivered to cells by transferrin receptor (TFRC)-mediated endocytosis. Lysosome acidification is necessary for ferric iron (Fe3+) release from transferrin and reduction to Fe2+ for cytosolic transport.17,22-24 TFRC is essential for lymphocyte development,25 and hypomorphic TFRC mutations cause severe B- and T-cell immunodeficiency.26 STEAP proteins catalyze reduction of ferric to ferrous iron for cytosolic transport by DMT1, using nicotinamide-adenine dinucleotide phosphate, reduced form (NADPH), as an electron donor.17,19 Cytochrome 561 (CYB561) integral membrane proteins, which use ascorbate as an electron donor for transmembrane transport, can also reduce ferric iron.27 Although present in nearly all kingdoms of life, the 4 human CYB561A3 members seem to play roles in highly specific cellular niches. CYB561A3, also called lysosomal Cyt561 or LCytb, is expressed in late endosomal/lysosomal membranes in macrophages.28 CYB561A3 exhibits ferrireductase activity when expressed in yeast.29
We performed CRISPR/Cas9 human genome-wide screens to identify B-cell factors selectively important for the growth and survival of EBV-transformed Burkitt B cells vs LCLs.30 In contrast to a previous study that implicated CYB561D2 as a tumor suppressor in non–small cell lung cancer growth,31 our loss-of-function analysis highlighted CYB561A3 as critical for EBV+ Burkitt but not for LCL proliferation. Here, we investigated the roles of this little-studied ferrireductase in B-cell growth and survival.
Materials and methods
Cell culture and growth assay
The 293T cells were purchased from American Type Culture Collection (ATCC) and cultured in Dulbecco’s modified Eagle medium with 10% fetal bovine serum. P3HR-1, EBV+ Akata, and EBV– Akata cells were obtained from Elliott Kieff; GM12878 and GM11830 from Coriell; Mutu I/III and Kem I/III from Jeff Sample; and Daudi, SU-DHL4 diffuse large B-cell lymphoma, REH pre–B cell acute lymphoblastic leukemia (ALL), and RPMI 8226 myeloma cells from ATCC. All B-cell lines stably expressed Streptococcus pyogenes Cas9 and were grown in Roswell Park Memorial Institute (RPMI) 1640 with 10% fetal bovine serum and penicillin-streptomycin in a humidified chamber with 5% carbon dioxide. For growth analysis, cells were normalized to the same starting concentration, using the CellTiterGlo assay. Live cell numbers were quantitated at each time point by using the CellTiterGlo measurements, and values were corrected for tissue culture splitting. Live cell number fold change was calculated as a ratio of the value at the given time point divided by the input value.
CRISPR/Cas9 gene editing
Target cells were transduced with lentiviruses expressing Avana or Brunello single guide RNA (sgRNA) sequences, as listed in supplemental Table 1 (available on the Blood Web site), or with nontargeting control sgRNAs, as described previously.30 Transduced cells were selected by using puromycin 3 μg/mL.
CYB561A3 complementary DNA rescue
N-terminally HA-CYB561A3R (rescue) complementary DNA (cDNA) was synthesized by GenScript and inserted into the pLX_TRC313 vector, which contains a hygromycin resistance marker. A synonymous CYB561A3 mutation was engineered into the protospacer adjacent motif targeted by CYB561A3 #1 to confer resistance to Cas9 editing.
CYB561A3 alanine point mutagenesis
The pLX_TRC313-HA-CYB561A3R vector was used as the template for alanine point mutations. Q5 site-directed mutagenesis (E0554S; New England Biolabs) was used for point mutagenesis. Primers were designed per kit instructions, and mutagenesis was confirmed by using Sanger sequencing.
FerroOrange and replication protein A analysis
Cells were stained with 1 µM FerroOrange at 37°C for 50 minutes, washed, and analyzed by confocal or plate reader. For rhodamine B-[(1,10-phenanthrolin-5-yl)aminocarbonyl]benzyl ester (RPA) analysis, cells were incubated with 100 nM RPA at 37°C for 10 minutes, washed, and imaged by confocal or plate reader.
Seahorse flux analysis
Cells were seeded at 100 000 per well. Then, 3.5 µM oligomycin, 2 µM CCCP, and 100 nM piericidin A were added at the indicated time points. Oxygen consumption rates were measured by an Agilent Seahorse XF96 analyzer, using a Seahorse XF96 sensor cartridge.
Results
CYB561A3 is critical for Burkitt proliferation
To identify EBV-transformed B-cell dependency factors, the Avana sgRNA library was expressed in Cas9+ EBV-infected P3HR-1 Burkitt cells or in GM12878 LCLs, an Encode Project Tier 1 cell line.30 sgRNA abundance was quantitated in P3HR-1 and GM12878 at the end of the 21-day growth and survival screen, to identify CRISPR targets whose knockout (KO) impaired growth or survival. Of the 57 human genes that scored as selectively important for Burkitt vs LCL proliferation at a multiple-hypothesis test adjusted q < 0.05 cutoff, CYB561A3 was a top hit (Figure 1A). All 4 sgRNAs targeting CYB561A3 were highly depleted in P3HR-1, but not in GM12878 (Figure 1B; supplemental Figure 1A), suggesting a selectively important role for CYB561A3 in P3HR-1 proliferation. CYB561A3 scored more strongly than several well-characterized oncogenic Burkitt drivers, including BCL6, cyclin-dependent kinase 4, and cyclin D3.30,32,33 Intriguingly, Cancer Dependency Map (DepMap) CRISPR analysis34 further highlighted that CYB561A3 is a dependency factor for only the 3 Burkitt cell lines (Raji, Blue1, and BL70) of the 712 cancer cell lines tested, which span many tissues of origin. Some CYB561A3 CRISPR signal was also observed in several additional B-cell lymphomas of germinal center origin (Figure 1C). Genes with the closest DepMap CRISPR screen profiles to CYB51A3 were transcription factors important in B-cell differentiation: PAX5, MEF2B, EBF1, and POU2AF1/Oca-B (supplemental Figure 1B).
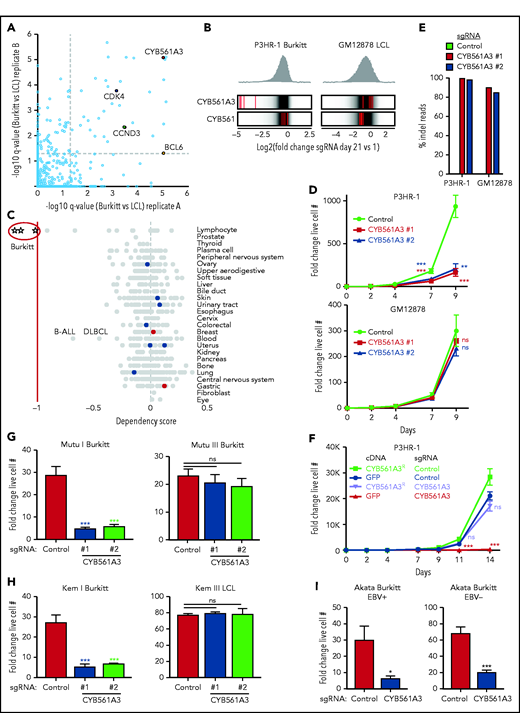
CYB561A3 is essential for the proliferation of Burkitt lymphoma cells. (A) Scatterplots showing the statistical significance of selected top hits that were selectively important for P3HR-1 Burkitt vs GM12878 LCLs. Statistical significance was quantitated by the STARS algorithm, using 2 biological replicates for each axis. (B) Distribution of Avana human genome-wide CRISPR screen sgRNA log2 fold-change values at day 21 vs input in Cas9+ P3HR-1 Burkitt lymphoma (left) or GM12878 LCL (right). Values for CYB561A3 and CYB561 targeting sgRNAs (red lines) are overlaid on gray gradients depicting all Avana sgRNA library values.30 Average day 21 vs input values from 4 screen biological replicates are shown. (C) DepMap CRISPR screen dependency scores34 for sgRNAs targeting CYB561A3 across cell lines from the indicated cancer cells of origin. Circles represent DepMap screen values for cell lines from the tissue of origin indicated at right. Negative values indicate selection against sgRNAs targeting CYB561A3 over a 21-day growth and survival screen. Values less than −1 (red vertical line) indicate the DepMap cutoff for CYB561A3 dependency. (D) Growth curve analysis of Cas9+ P3HR-1 (top) and GM12878 (bottom) with control or independent CYB561A3 sgRNAs, as indicated. (E) Indel-sequencing analysis of Cas9 activity at the CYB561A3 locus. Shown are the percentage of indels in P3HR-1 or GM12878 cells expressing the indicated control or CYB561A3 sgRNAs. (F) Growth curve analysis of Cas9+ P3HR-1 after expression of the indicated green fluorescent protein (GFP) control or CYB561A3R cDNAs and control or CYB561A3 sgRNA, as indicated. (G) Fold change live cell number of Mutu Burkitt cells with EBV latency I or III (Mutu I and III) from days 4 to 8 postexpression of CYB561A3 vs control sgRNAs. (H) Fold change live cell numbers of Kem I EBV latency I Burkitt and Kem III EBV latency III LCLs from days 4 to 8 postexpression of CYB561A3 vs control sgRNAs. (I) Fold-change live cell numbers from EBV+ Akata Burkitt cells with EBV latency I vs EBV– Akata from days 4 to 8 postexpression of CYB561A3 vs control sgRNAs. Mean ± standard deviation fold-change values from n = 3 biological replicates (E-I). *P < .05; **P < .01; ***P < .001. ns, nonsignificant (unpaired Student t test).
CYB561A3 is essential for the proliferation of Burkitt lymphoma cells. (A) Scatterplots showing the statistical significance of selected top hits that were selectively important for P3HR-1 Burkitt vs GM12878 LCLs. Statistical significance was quantitated by the STARS algorithm, using 2 biological replicates for each axis. (B) Distribution of Avana human genome-wide CRISPR screen sgRNA log2 fold-change values at day 21 vs input in Cas9+ P3HR-1 Burkitt lymphoma (left) or GM12878 LCL (right). Values for CYB561A3 and CYB561 targeting sgRNAs (red lines) are overlaid on gray gradients depicting all Avana sgRNA library values.30 Average day 21 vs input values from 4 screen biological replicates are shown. (C) DepMap CRISPR screen dependency scores34 for sgRNAs targeting CYB561A3 across cell lines from the indicated cancer cells of origin. Circles represent DepMap screen values for cell lines from the tissue of origin indicated at right. Negative values indicate selection against sgRNAs targeting CYB561A3 over a 21-day growth and survival screen. Values less than −1 (red vertical line) indicate the DepMap cutoff for CYB561A3 dependency. (D) Growth curve analysis of Cas9+ P3HR-1 (top) and GM12878 (bottom) with control or independent CYB561A3 sgRNAs, as indicated. (E) Indel-sequencing analysis of Cas9 activity at the CYB561A3 locus. Shown are the percentage of indels in P3HR-1 or GM12878 cells expressing the indicated control or CYB561A3 sgRNAs. (F) Growth curve analysis of Cas9+ P3HR-1 after expression of the indicated green fluorescent protein (GFP) control or CYB561A3R cDNAs and control or CYB561A3 sgRNA, as indicated. (G) Fold change live cell number of Mutu Burkitt cells with EBV latency I or III (Mutu I and III) from days 4 to 8 postexpression of CYB561A3 vs control sgRNAs. (H) Fold change live cell numbers of Kem I EBV latency I Burkitt and Kem III EBV latency III LCLs from days 4 to 8 postexpression of CYB561A3 vs control sgRNAs. (I) Fold-change live cell numbers from EBV+ Akata Burkitt cells with EBV latency I vs EBV– Akata from days 4 to 8 postexpression of CYB561A3 vs control sgRNAs. Mean ± standard deviation fold-change values from n = 3 biological replicates (E-I). *P < .05; **P < .01; ***P < .001. ns, nonsignificant (unpaired Student t test).
We validated CRISPR screen results using proliferation assays in Cas9+ P3HR-1 and GM12878. Independent CYB561A3 sgRNAs significantly diminished P3HR-1 but not GM12878 outgrowth (Figure 1D). High-frequency (>80%) CYB561A3 CRISPR editing in P3HR-1 and GM12878 was confirmed by insertion/deletion (indel) sequencing; because a suitable anti-CYB561A3 antibody could not be found, this was also confirmed by T7E1 assay using 2 independent primer sets (Figure 1E). On-target Cas9 effects were further validated by CYB561A3R cDNA, using a silent protospacer adjacent motif site point mutant refractory to Cas9 cutting (Figure 1F). EBV+ Daudi Burkitt cells were similarly sensitive to CYB561A3 depletion (supplemental Figure 1C), whereas CYB561A3 KO did not significantly affect GM11830 LCL proliferation (supplemental Figure 1D). Indel sequencing and T7E1 assay confirmed high-frequency GM11830 CYB561A3 CRISPR editing (supplemental Figure 1E-F).
We tested an isogenic pair of cell lines derived from an endemic Burkitt tumor sample, which differ only by EBV latency I vs III programs (Mutu I vs III). CYB561A3 sgRNAs repressed Mutu I, but not Mutu III proliferation, suggesting that the viral latency III program rescued CYB561A3 dependency (Figure 1G). Likewise, CYB561A3 inhibited proliferation of Kem I latency I endemic Burkitt lymphoma cells but not Kem III latency III LCLs established from the same tumor sample (Figure 1H). Using RNA-sequencing data,35 we found that EBV downregulated CYB561A3 messenger RNA levels by 48 hours’ post–B-cell infection (supplemental Figure 1G). CYB561A3 levels were also somewhat lower in Mutu III cells than in Mutu I cells (supplemental Figure 1H), although CYB561A3 remained expressed in GM12878 (supplemental Figure 1I). Latency I was not required for Burkitt CYB561A3 dependence, as Akata Burkitt cells cured of EBV remained similarly sensitive to CYB661A3 depletion as a reinfected EBV+ clone (Figure 1I), and 2 of the 3 DepMap Burkitt lines were EBV– (BL70 and Blue1) (Figure 1C). We also validated that CYB561A3 KO decreased proliferation of 3 EBV– B-cell lines with a moderate DepMap CRISPR signal: precursor B-cell ALL REH, diffuse large B-cell lymphoma SU-DHL4, and multiple myeloma RPMI 8226 cells (Figure 1C; supplemental Figure 1J).
CYB561A3 depletion causes Burkitt G2/M arrest and lysosome and mitochondrial damage
To investigate CYB561A3 KO effects on the Burkitt cell cycle, propidium iodide analysis was performed. At day 9 post-sgRNA expression, the time point at which CYB561A3 depletion first significantly decreased proliferation (Figure 1D), the proportion of P3HR-1 cells in G2/M was increased, indicating cell cycle arrest. GM12878 cell cycle, however, was not significantly altered by CYB561A3 depletion (Figure 2A). CYB561A3 KO effects on cell death became apparent by day 10, even though fluorescence-activated cell sorter assays for plasma membrane Annexin V remained negative, indicating the absence of apoptosis (supplemental Figure 2A). Likewise, the ferroptosis inhibitor ferrostatin 1 was unable to rescue CYB561A3 KO cells from death, suggesting that this iron-dependent programmed cell death pathway does not underlie the toxicity of CYB561A3 KO (supplemental Figure 2B). Fluorescence-activated cell sorter analysis revealed increased Burkitt cell size at this time point, which can be observed with necrotic cell death (Figure 2B; supplemental Figure 2C). Mitosox FACS analysis also indicated that CYB561A3 depletion increased mitochondria reactive oxygen species (Figure 2C).
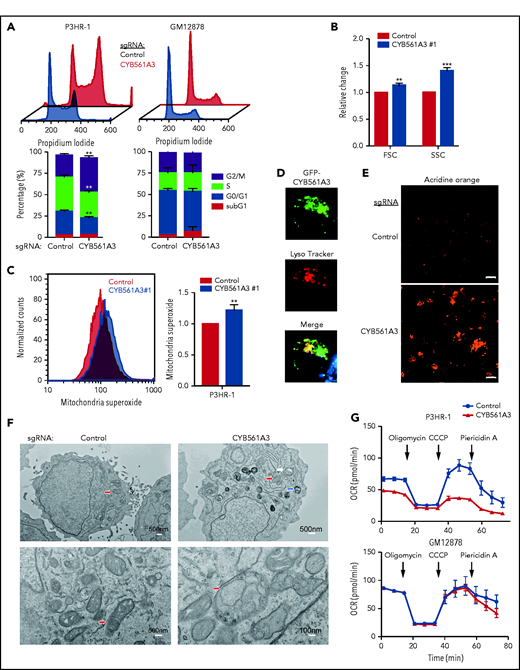
CYB561A3 KO causes Burkitt cell cycle arrest and lysosomal and mitochondrial damage. (A) Cell cycle analysis of P3HR-1 and GM12878 nine days after control or CYB561A3 sgRNA expression. Lower panel, mean ± standard deviation (SD) values from n = 3 replicates are shown. (B) Fluorescence-activated cell sorter forward scatter (FSC; cell size) and side scatter (SSC; internal complexity) mean ± SD values from n = 3 replicates obtained 12 days after P3HR-1 control or CYB561A3 sgRNA expression. (C) Fluorescence-activated cell sorter analysis of mitochondrial reactive oxygen species signals detected by mitoSOX in P3HR-1 cells 12 days after control or CYB561A3 sgRNA expression, with mean ± SD values from n = 3 replicates. (D) Immunofluorescence analysis of P3HR-1 transfected with a green fluorescent protein (GFP)-tagged CYB561A3 expression vector and stained with LysoTracker to visualize lysosomes. Shown below is the merge, together with Hoechst-stained nucleus. Image is representative of n = 3 replicates. (E) Acridine Orange (1 μg/mL) staining of lysosomes in P3HR-1 cells 12 days after control or CYB561A3 sgRNA expression. Scale bar indicates 10 μm. Representative images from n = 3 replicates are shown. (F) EM images of P3HR-1 twelve days after control or CYB561A3 sgRNA expression. Arrows indicate representative mitochondria (red), lysosomes (white), and autophagosomes (blue). White scale bar sizes are noted at bottom right. (G) Seahorse analysis of P3HR-1 and GM12878 cell oxygen consumption rate (OCR) 12 days after control (black) or CYB561A3 (red) sgRNA expression. Time points of oligomycin (3.5 µM), CCCP (2 µM), and piericidin A (100 nM) addition are indicated. Mean ± SD from n = 3 replicates are shown. **P < .01; ***P < .001. ns, nonsignificant (unpaired Student t test).
CYB561A3 KO causes Burkitt cell cycle arrest and lysosomal and mitochondrial damage. (A) Cell cycle analysis of P3HR-1 and GM12878 nine days after control or CYB561A3 sgRNA expression. Lower panel, mean ± standard deviation (SD) values from n = 3 replicates are shown. (B) Fluorescence-activated cell sorter forward scatter (FSC; cell size) and side scatter (SSC; internal complexity) mean ± SD values from n = 3 replicates obtained 12 days after P3HR-1 control or CYB561A3 sgRNA expression. (C) Fluorescence-activated cell sorter analysis of mitochondrial reactive oxygen species signals detected by mitoSOX in P3HR-1 cells 12 days after control or CYB561A3 sgRNA expression, with mean ± SD values from n = 3 replicates. (D) Immunofluorescence analysis of P3HR-1 transfected with a green fluorescent protein (GFP)-tagged CYB561A3 expression vector and stained with LysoTracker to visualize lysosomes. Shown below is the merge, together with Hoechst-stained nucleus. Image is representative of n = 3 replicates. (E) Acridine Orange (1 μg/mL) staining of lysosomes in P3HR-1 cells 12 days after control or CYB561A3 sgRNA expression. Scale bar indicates 10 μm. Representative images from n = 3 replicates are shown. (F) EM images of P3HR-1 twelve days after control or CYB561A3 sgRNA expression. Arrows indicate representative mitochondria (red), lysosomes (white), and autophagosomes (blue). White scale bar sizes are noted at bottom right. (G) Seahorse analysis of P3HR-1 and GM12878 cell oxygen consumption rate (OCR) 12 days after control (black) or CYB561A3 (red) sgRNA expression. Time points of oligomycin (3.5 µM), CCCP (2 µM), and piericidin A (100 nM) addition are indicated. Mean ± SD from n = 3 replicates are shown. **P < .01; ***P < .001. ns, nonsignificant (unpaired Student t test).
CYB561A3 colocalized with lysosomes in P3HR-1 as well as HT-1080 fibrosarcoma cells (Figure 2D; supplemental Figure 2D), as reported for macrophages.28 CYB561A3 KO enhanced the intensity of staining by acridine orange, which is protonated and trapped in acidified lysosomes (Figure 2E).36 Increased acridine orange signal was not evident in CYB561A3 KO GM12878 LCLs (supplemental Figure 2E). Live cell staining with the lysosomal marker Lysotracker Red was robust in CYB561A3-depleted P3HR-1 (supplemental Figure 2F), further implicating CYB561 in Burkitt cell lysosomal physiology.
The effects of CYB561A3 KO on Burkitt morphology were next characterized by electron microscopy (EM). Prominent lysosomes, multivesicular bodies, and autophagosomes, which in some instances colocalized with mitochondria, were evident in CYB561A3-depleted cells (Figure 2F; supplemental Figure 2G). Iron deficiency can trigger mitophagy, in which mitochondria are delivered to lysosomes for iron scavenging from mitochondrial reservoirs that include Fe-S clusters important for the respiratory chain.37-39 EM also revealed damaged mitochondria, which appeared highly fragmented in both P3HR-1 and Mutu I (supplemental Figure 2H-I). Consistent with mitochondrial impairment, Seahorse flux analysis revealed reduced basal and maximal oxygen consumption rates in P3HR-1 and Mutu I cells but not in GM12878 cells expressing CYB561A3 sgRNAs (Figure 2G; supplemental Figure 2J). EM exhibited frequent electron-dense cytoplasmic aggregates in CYB561A3-deficient cells, perhaps resulting from cell damage (supplemental Figure 2K). These results suggest that Burkitt but not LCLs require CYB561A3 for lysosomal and mitochondrial homeostasis. Notably, recent studies connect lysosomal dysfunction with altered mitochondrial metabolism due to iron depletion.22,23
CYB561A3 KO downregulates metal ion response genes and causes iron deficiency
To gain insights into CYB561A3's Burkitt roles, RNA sequencing was performed on P3HR-1 cells 10 days’ postexpression of control or CYB561A3 sgRNAs. TFRC was among the most induced gene, consistent with loss of bioavailable iron. Pathways most highly upregulated included lysosomal and lytic vacuole membrane roles, suggestive of key CYB561A3 activity within this compartment (Figure 3A-B). The most downregulated genes involved responses to endoplasmic reticulum stress and metal ions, including transcripts encoding the stress response transcription factor ATF5,40 the cysteine-rich antioxidant protein MT2A (which binds zinc and calcium),41 and the HSP70 family chaperones HSPA6 and HSPA1B (Figure 3A, C). Several HSP70 family members have key roles in Fe-S cluster biogenesis42 and assist cellular stress responses.43
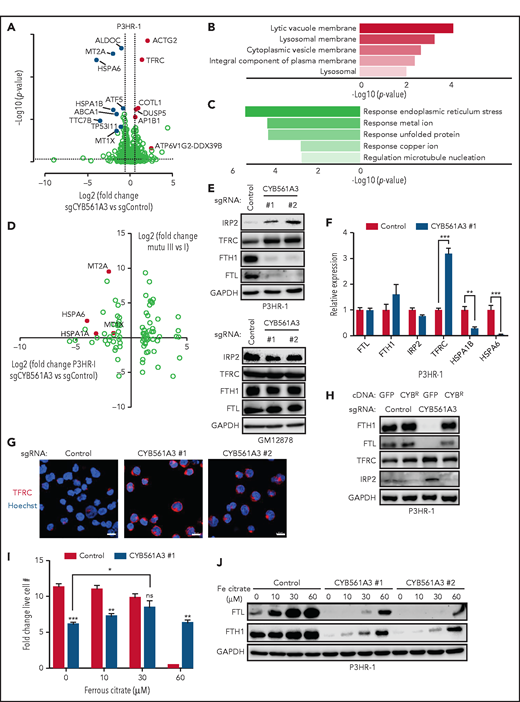
The absence of CYB561A3 will cause a P3HR-1 iron starvation response. (A) Volcano plot of differentially expressed genes in P3HR-1 twelve days after control or CYB561A3 sgRNA expression (n = 3 replicates). Selected genes upregulated (red) or downregulated (blue) by CYB561A3 depletion are highlighted. (B) Gene Ontology enrichment analysis of significantly upregulated cellular components in RNA-sequencing analysis of P3HR-1 cells with CYB561A3 vs control sgRNA expression. (C) Gene Ontology enrichment analysis of significantly downregulated biological processes in RNA-sequencing analysis of P3HR-1 cells with CYB561A3 vs control sgRNA expression. (D) Volcano plot analysis of log2 fold-change messenger RNA abundances in Mutu III vs Mutu I (y-axis) and in P3HR-1 with CYB561A3 vs control sgRNA expression (x-axis). (E) Immunoblot analysis of whole-cell lysates (WCL) from P3HR-1 (top) and GM12878 (bottom) at 10 days’ post-control or CYB561A3 sgRNA expression for the indicated proteins. (F) Mean ± SD values of quantitative polymerase chain reaction analysis of the indicated messenger RNA expression in P3HR-1 cells 10 days after control or CYB561A3 sgRNA expression from n = 3 replicates. (G) Immunofluorescence analysis of TFRC expression in P3HR-1 ten days after control or CYB561A3 sgRNA expression. Scale bar, 10 μm. Representative images from n = 2 replicates are shown. (H) Immunoblot analysis of WCL from P3HR-1 with control green fluorescent protein (GFP) or CYB561A3R (CYBR) cDNA 7 days’ post-sgRNA expression. (I) Mean ± SD values from P3HR-1 cells with control (black) or CYB561A3 (gray) sgRNA and cultured in the indicated concentration of ferrous citrate. Ferric citrate or phosphate-buffered saline was added 4 days’ post-sgRNA expression, and fold change was measured over the next 3 days. (J) Immunoblot analysis of WCL from P3HR-1 that expressed control or CYB561A3 sgRNA for 7 days and cultured in phosphate-buffered saline or ferrous citrate for days 4 to 7. Panels E, H, and J show representative blots from n = 3 replicates. *P < .05; **P < .01; ***P < .001. GAPDH, glyceraldehyde-3-phosphate dehydrogenase; ns, nonsignificant (unpaired Student t test).
The absence of CYB561A3 will cause a P3HR-1 iron starvation response. (A) Volcano plot of differentially expressed genes in P3HR-1 twelve days after control or CYB561A3 sgRNA expression (n = 3 replicates). Selected genes upregulated (red) or downregulated (blue) by CYB561A3 depletion are highlighted. (B) Gene Ontology enrichment analysis of significantly upregulated cellular components in RNA-sequencing analysis of P3HR-1 cells with CYB561A3 vs control sgRNA expression. (C) Gene Ontology enrichment analysis of significantly downregulated biological processes in RNA-sequencing analysis of P3HR-1 cells with CYB561A3 vs control sgRNA expression. (D) Volcano plot analysis of log2 fold-change messenger RNA abundances in Mutu III vs Mutu I (y-axis) and in P3HR-1 with CYB561A3 vs control sgRNA expression (x-axis). (E) Immunoblot analysis of whole-cell lysates (WCL) from P3HR-1 (top) and GM12878 (bottom) at 10 days’ post-control or CYB561A3 sgRNA expression for the indicated proteins. (F) Mean ± SD values of quantitative polymerase chain reaction analysis of the indicated messenger RNA expression in P3HR-1 cells 10 days after control or CYB561A3 sgRNA expression from n = 3 replicates. (G) Immunofluorescence analysis of TFRC expression in P3HR-1 ten days after control or CYB561A3 sgRNA expression. Scale bar, 10 μm. Representative images from n = 2 replicates are shown. (H) Immunoblot analysis of WCL from P3HR-1 with control green fluorescent protein (GFP) or CYB561A3R (CYBR) cDNA 7 days’ post-sgRNA expression. (I) Mean ± SD values from P3HR-1 cells with control (black) or CYB561A3 (gray) sgRNA and cultured in the indicated concentration of ferrous citrate. Ferric citrate or phosphate-buffered saline was added 4 days’ post-sgRNA expression, and fold change was measured over the next 3 days. (J) Immunoblot analysis of WCL from P3HR-1 that expressed control or CYB561A3 sgRNA for 7 days and cultured in phosphate-buffered saline or ferrous citrate for days 4 to 7. Panels E, H, and J show representative blots from n = 3 replicates. *P < .05; **P < .01; ***P < .001. GAPDH, glyceraldehyde-3-phosphate dehydrogenase; ns, nonsignificant (unpaired Student t test).
We next cross-compared Burkitt gene expression changes caused by CYB561A3 depletion to those caused by EBV latency programs.44 Multiple genes significantly downregulated by CYB561A3 depletion were instead upregulated by EBV latency III (Figure 3D; supplemental Figure 3A-B). These included HSP70 members and the metallothionines MT1A and MT2A, which are cysteine-rich proteins that sequester metal ions and that can protect cells from iron-induced oxidative stress.45 EBV upregulates MT2A in newly infected CD19+ B cells and in LCLs (supplemental Figure 3C). Using LCL chromatin immunoprecipitation–sequencing data sets,46,47 the EBV-encoded transcription factors EBNA2 and EBNA-LP (which are the first viral protein–encoding genes expressed upon primary B-cell infection) cooccupy the MT2A promoter but not the promoters of many other nearby metallothionine genes. All 5 NF-κB transcription factor subunits, which are activated in EBV latency III by the latent membrane protein 1 oncoprotein, also cooccupy the MT2A promoter site, suggesting mechanisms by which EBV upregulates MT2A (supplemental Figure 3D-E).
We hypothesized that CYB561A3 is an essential Burkitt Fe3+ reductase. To test this theory, we first used iron regulatory protein 2 (IRP2) levels as a readout of bioavailable iron abundance, as IRP2 protein is downregulated by the ubiquitin-ligase SCFFBXL5 E3 ligase in iron-replete cells.48 Consistent with an obligatory CYB561A3 role in Burkitt iron acquisition, CYB561A3 sgRNAs increased IRP2 levels in P3HR-1 and Mutu I but not in GM12878 or GM11830 LCLs (Figure 3E; supplemental Figure 3F). CYB561A3 KO diminished levels of ferritin heavy and light chains (FTH1 and FTL, respectively), whose protein expression is negatively regulated by IRP1/2.49 CYB561A3 KO also increased P3HR-1 TFRC levels, consistent with a cellular response to diminished iron (Figure 3E-G). CYB561A3R cDNA prevented these changes upon endogenous CYB561A3 KO (Figure 3H). CYB561A3 depletion also reduced ferritin heavy chain levels in REH, SU-DHL4, and RPMI 8226, indicative of roles in iron metabolism in these DepMap B cells with some CYB561A3 dependency (supplemental Figure 3G).
Ferrous citrate bypasses transferrin-mediated iron uptake. Supplementation with ferrous citrate 30 μM restored wild-type (WT) proliferation levels in CYB561A3 KO P3HR-1 (Figure 3I). CYB561A3 loss also protected cells from iron toxicity induced by the addition of ferrous citrate 60 μM. Because similarly elevated media iron concentrations cause Burkitt cell growth arrest,50 these data suggest that CYB561A3 deficiency buffers against increases in cellular labile iron pools. Ferritin levels were substantially higher in ferrous citrate–treated control cells than in CYB561A3 KO cells (Figure 3J).
Ascorbate and CYB561A3 electron shuttling roles in Burkitt iron acquisition
Ascorbic acid (vitamin C, ascorbate) is a potent antioxidant that serves as an electron donor for CYB561 proteins.51 Ascorbate can promote direct reduction of free or ferritin-bound Fe3+ to Fe2+ iron in lysosomes.52,53 Higher ascorbate concentrations cause hydrogen peroxide production and kill Burkitt cells, at least partly through Fenton reactions.54,55 Consistent with the hypothesis that ascorbate acts together with CYB561A3 in Burkitt iron metabolism, supplementation of 20 to 200 μM ascorbate rescued proliferation of CYB561A3 KO P3HR-1 and protected cells from the toxicity of ascorbic acid 400 μM (Figure 4A). Ascorbate supplementation also diminished loss of ferritin and downmodulated IRP2 and TFRC expression in CYB561A3-depleted cells (Figure 4B-C; supplemental Figure 4A). Arguing against antioxidant roles causing rescue effects, ascorbate did not substantially change levels of reactive oxygen species (supplemental Figure 4B). Furthermore, the antioxidant N-acetyl cysteine and the mitochondria-specific superoxide scavenger Mito-TEMPO failed to rescue CYB561A3 KO effects (supplemental Figure 4C-D).
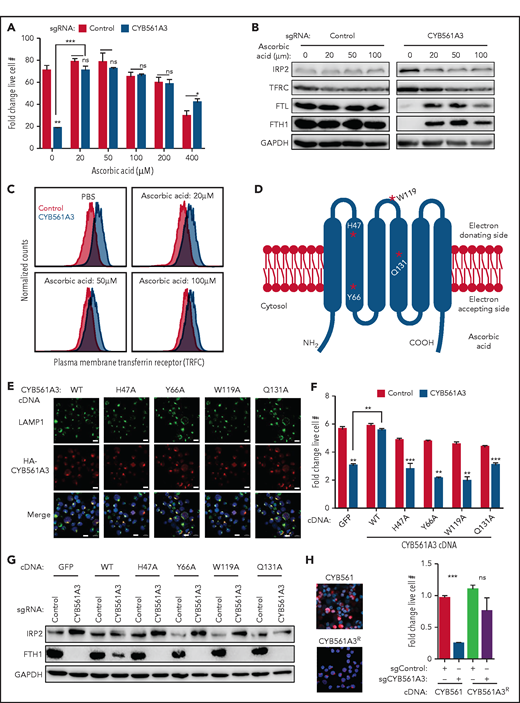
CYB561A3 ferrireductase activity is critical for Burkitt B-cell iron acquisition. (A) Mean ± standard deviation (SD) fold-change live cell values from n = 3 replicates of P3HR-1 with control (black) or CYB561A3 sgRNA (gray) expression and cultured in the indicated concentration of ascorbic acid. Phosphate-buffered saline or ascorbic acid was added at days 4 to 9 post-sgRNA expression. Fold change was measured from days 4 to 9. (B) Immunoblot analysis of whole-cell lysates from P3HR-1 expressing control or CYB561A3 sgRNAs and cultured in the indicated ascorbic acid concentrations, as in panel A. (C) Fluorescence-activated cell sorter analysis of plasma membrane TFRC expression in P3HR-1 expressing control (pink) or CYB561A3 (blue) sgRNAs. Phosphate-buffered saline or ascorbic acid was added from days 4 to 9 post-sgRNA expression, at which time fluorescence-activated cell sorter was done. Representative histograms from n = 3 replicates are shown. (D) Schematic model of CYB561A3. Red stars represent selected amino acids indicated in CYB561A3 electron transport. (E) Confocal microscopy analysis of P3HR-1 lysosomal marker LAMP1, antihemagglutinin (HA) tagged CYB561A3 WT, or indicated alanine point mutant stained for HA, and Hoechst-stained nuclei merge image. Scale bars, 10 μm. Representative images from n = 3 replicates are shown. (F) Mean ± SD values from n = 3 replicates of P3HR-1 with control (black) or CYB561A3 (gray) sgRNA and the, cDNA encoding control green fluorescent protein (GFP) or CYB561A3 WT or alanine point mutants. Fold change was measured from days 4 to 8 post-sgRNA expression. (G) Immunoblot analysis of whole-cell lysates from P3HR-1 expressing the indicated sgRNA and cDNA, as in panel F, at day 8 post-sgRNA expression. (H) CYB561 overexpression does not compensate for loss of CYB561A3. Stable expression of HA-epitope–tagged CYB561 vs CYB561A3R cDNAs was validated by confocal analysis of P3HR-1 stained with anti-HA antibody (left). Control or CYB561A3 sgRNAs were then expressed, as indicated. Mean ± SD fold-change live cell values from n = 3 replicates of cells with the indicated sgRNA and cDNA expression. Panels B and G show representative blots from n = 3 replicates. *P < .05; **P < .01; ***P < .001. ns, nonsignificant (unpaired Student t test).
CYB561A3 ferrireductase activity is critical for Burkitt B-cell iron acquisition. (A) Mean ± standard deviation (SD) fold-change live cell values from n = 3 replicates of P3HR-1 with control (black) or CYB561A3 sgRNA (gray) expression and cultured in the indicated concentration of ascorbic acid. Phosphate-buffered saline or ascorbic acid was added at days 4 to 9 post-sgRNA expression. Fold change was measured from days 4 to 9. (B) Immunoblot analysis of whole-cell lysates from P3HR-1 expressing control or CYB561A3 sgRNAs and cultured in the indicated ascorbic acid concentrations, as in panel A. (C) Fluorescence-activated cell sorter analysis of plasma membrane TFRC expression in P3HR-1 expressing control (pink) or CYB561A3 (blue) sgRNAs. Phosphate-buffered saline or ascorbic acid was added from days 4 to 9 post-sgRNA expression, at which time fluorescence-activated cell sorter was done. Representative histograms from n = 3 replicates are shown. (D) Schematic model of CYB561A3. Red stars represent selected amino acids indicated in CYB561A3 electron transport. (E) Confocal microscopy analysis of P3HR-1 lysosomal marker LAMP1, antihemagglutinin (HA) tagged CYB561A3 WT, or indicated alanine point mutant stained for HA, and Hoechst-stained nuclei merge image. Scale bars, 10 μm. Representative images from n = 3 replicates are shown. (F) Mean ± SD values from n = 3 replicates of P3HR-1 with control (black) or CYB561A3 (gray) sgRNA and the, cDNA encoding control green fluorescent protein (GFP) or CYB561A3 WT or alanine point mutants. Fold change was measured from days 4 to 8 post-sgRNA expression. (G) Immunoblot analysis of whole-cell lysates from P3HR-1 expressing the indicated sgRNA and cDNA, as in panel F, at day 8 post-sgRNA expression. (H) CYB561 overexpression does not compensate for loss of CYB561A3. Stable expression of HA-epitope–tagged CYB561 vs CYB561A3R cDNAs was validated by confocal analysis of P3HR-1 stained with anti-HA antibody (left). Control or CYB561A3 sgRNAs were then expressed, as indicated. Mean ± SD fold-change live cell values from n = 3 replicates of cells with the indicated sgRNA and cDNA expression. Panels B and G show representative blots from n = 3 replicates. *P < .05; **P < .01; ***P < .001. ns, nonsignificant (unpaired Student t test).
CYB561A3 residues important for ascorbate-dependent ferrireductase activity have been identified by using alanine point mutagenesis.29 These include CYB561A3 H47 (important for heme coordination), ascorbate electron acceptance region residue Y66, electron-donating region W119, and transmembrane residue Q131. To test whether CYB561A3 ferrireductase activity is important for Burkitt proliferation, we expressed rescue cDNAs encoding HA-tagged WT or each of these alanine point mutant CYB561A3 in P3HR-1. Immunofluorescence against HA exhibited similar levels of expression and colocalization with the lysosomal marker LAMP1 (Figure 4D-E). Although WT CYB561A3 cDNA rescued P3HR-1 proliferation after KO of endogenous CYB561A3, each of the point mutant cDNAs failed to do so (Figure 4F). Point mutant CYB561A3 cDNA also failed to block upregulation of IRP2 or depletion of FTH1, indicating that they were unable to prevent iron depletion upon loss of endogenous CYB561A3 (Figure 4G). Furthermore, a cDNA encoding the cytochrome b561 family member CYB561, which has nonlysomal ferrireductase roles in catecholamine synthesis, was unable to rescue CYB561A3 depletion (Figure 4H). These results suggest that lysosomal CYB561A3 ferrireductase activity underlies its Burkitt dependency factor role, likely with an ascorbate electron donor.
CYB561A3 KO depletes cellular and mitochondrial ferrous pools
Fe3+ typically enters cells in complex with transferrin and must be reduced to Fe2+for cytosolic transport. We tested CYB561A3 sgRNA effects on Burkitt and LCL Fe2+ pools using live cell FerroOrange imaging, which specifically detects Fe2+ but not Fe3+ or other bivalent metal ions. FerroOrange signal was significantly diminished in CYB561A3 KO P3HR-1, indicating depletion of ferrous iron, but not in GM12878 or GM11830 LCLs (Figure 5A; supplemental Figure 4E).
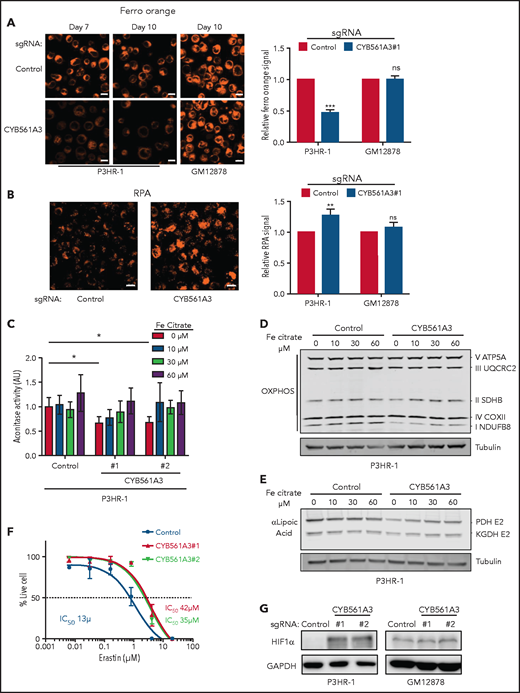
CYB561A3 KO depletes Burkitt cell ferrous iron. (A) Confocal microscopy analysis of FerroOrange-stained P3HR-1 or GM12878 expressing control or CYB561A3 sgRNAs for the indicated days. Shown at right are mean ± standard deviation (SD) values from n = 3 replicates of fluorescence-activated cell sorter mean FerroOrange signals. Scale bar, 10 μm. (B) Confocal analysis of RPA-stained P3HR-1 expressing control or CYB561A3 sgRNAs for 10 days. Shown at right are mean ± SD values from n = 3 replicates of fluorescence-activated cell sorter mean RPA values. (C) Aconitase activity assay from P3HR-1 cells with control or CYB561A3 sgRNAs and grown with the indicated amount of ferric citrate supplementation. Bar plots show mean ± SD aconitase activity. (D) Immunoblot analysis of OXPHOS subunits or tubulin load control from whole-cell lysates (WCL) of P3HR-1 with control or CYB561A3 sgRNAs and grown with the indicated amount of ferric citrate supplementation. (E) Immunoblot analysis of lipoic acid, which is conjugated to PDH-E2 and KGDH-E2 subunits or tubulin load control from WCL of P3HR-1 with control or CYB561A3 sgRNAs and grown with the indicated amount of ferric citrate supplementation. (F) Fifty percent inhibitory concentration (IC50) analysis of P3HR-1 after control (black) or CYB561A3 sgRNAs #1 (red) or #2 (green) expression and treated with the indicated erastin concentrations from days 9 to 12. Shown are mean ± SD values and calculated IC50 values from n = 3 replicates. (G) Immunoblot analysis of WCL from P3HR-1 and GM12878 at 12 days’ post-control or CYB561A3 sgRNA expression. Panels D, E, and G show representative blots from n = 3 replicates. *P < .05 by 1-way analysis of variance with Bonferroni posttest. **P < .01, ***P < .001 (unpaired Student t test). GAPDH, glyceraldehyde-3-phosphate dehydrogenase; HIF1α, hypoxia inducible factor 1 subunit α; ns, nonsignificant.
CYB561A3 KO depletes Burkitt cell ferrous iron. (A) Confocal microscopy analysis of FerroOrange-stained P3HR-1 or GM12878 expressing control or CYB561A3 sgRNAs for the indicated days. Shown at right are mean ± standard deviation (SD) values from n = 3 replicates of fluorescence-activated cell sorter mean FerroOrange signals. Scale bar, 10 μm. (B) Confocal analysis of RPA-stained P3HR-1 expressing control or CYB561A3 sgRNAs for 10 days. Shown at right are mean ± SD values from n = 3 replicates of fluorescence-activated cell sorter mean RPA values. (C) Aconitase activity assay from P3HR-1 cells with control or CYB561A3 sgRNAs and grown with the indicated amount of ferric citrate supplementation. Bar plots show mean ± SD aconitase activity. (D) Immunoblot analysis of OXPHOS subunits or tubulin load control from whole-cell lysates (WCL) of P3HR-1 with control or CYB561A3 sgRNAs and grown with the indicated amount of ferric citrate supplementation. (E) Immunoblot analysis of lipoic acid, which is conjugated to PDH-E2 and KGDH-E2 subunits or tubulin load control from WCL of P3HR-1 with control or CYB561A3 sgRNAs and grown with the indicated amount of ferric citrate supplementation. (F) Fifty percent inhibitory concentration (IC50) analysis of P3HR-1 after control (black) or CYB561A3 sgRNAs #1 (red) or #2 (green) expression and treated with the indicated erastin concentrations from days 9 to 12. Shown are mean ± SD values and calculated IC50 values from n = 3 replicates. (G) Immunoblot analysis of WCL from P3HR-1 and GM12878 at 12 days’ post-control or CYB561A3 sgRNA expression. Panels D, E, and G show representative blots from n = 3 replicates. *P < .05 by 1-way analysis of variance with Bonferroni posttest. **P < .01, ***P < .001 (unpaired Student t test). GAPDH, glyceraldehyde-3-phosphate dehydrogenase; HIF1α, hypoxia inducible factor 1 subunit α; ns, nonsignificant.
Given that mitochondria contain a large proportion of cellular iron stores, including in Fe-S clusters,56,57 we used live cell imaging to assess effects of CYB561A3 KO on mitochondrial Fe2+ abundance. Control and CYB561A3 sgRNA expressing P3HR-1 were stained with RPA, which accumulates in mitochondria and whose orange fluorescence signal is stoichiometrically quenched by Fe2+ but not by Fe3+.58 CYB561A3 sgRNA significantly increased RPA signal in P3HR-1 but not GM12878 (Figure 5B), indicative of decreased mitochondrial Fe2+ levels.
We examined whether CYB561A3 depletion affected mitochondrial Fe-S levels by probing the abundance of proteins whose stability is dependent on Fe-S. CYB561A3 KO reduced the activity of mitochondrial aconitase, which has a [4Fe-4S]. Fe citrate supplementation significantly rescued aconitase activity (Figure 5C). CYB561A3 KO resulted in a mild reduction in steady-state levels of OXPHOS complex I, which contains 8 Fe-S clusters (Figure 5D). Mitochondrial lipoic acid synthesis uses a [4Fe-4S] cluster as a sulfur donor and for conjugation to target proteins. CYB561A3 depletion also reduced levels of lipoylated pyruvate dehydrogenase (PDH) and α-ketoglutarate dehydrogenase (KGDH) (Figure 5E). Fe citrate supplementation partially restored these deficits. Collectively, these results suggest that CYB561A3 is important for Burkitt mitochondrial Fe-S physiology.
Ferroptosis is driven by redox-active Fe2+ Fenton catalysis and can be induced by erastin blockade of the xCT cystine/glutamate exchanger.59 To test CYB561A3 depletion effects on Burkitt ferroptosis, control or CYB561A3 KO P3HR-1 were treated with 6 erastin doses. Consistent with depletion of Fe2+, CYB561A3 sgRNAs caused erastin resistance, increasing the 50% inhibitory concentration from 13 μM to 35-42 μM (Figure 5F). Likewise, CYB561A3 KO in P3HR-1, but not GM12878, increased expression of hypoxia inducible factor 1 subunit α, a key regulator of Fe-S cluster biogenesis and iron-dependent electron transport chain physiology, whose expression is regulated at the protein level by iron-dependent prolyl hydroxylases (Figure 5G).60,61
Latency III–induced STEAP3 rescues CYB561A3 deficiency and has a key role in LCL iron metabolism
The absence of CYB561A3 dependence raised the question of how LCLs reduce imported Fe3+. We noted that sgRNAs targeting the ferrireductase STEAP3 were depleted from GM12878 but not P3HR-1 in our CRISPR screen (Figure 6A; supplemental Figure 5A). We validated independent STEAP3 sgRNA effects on GM12878 proliferation (Figure 6B). Successful CRISPR STEAP3 editing was confirmed by indel sequencing and T7EI assay (Figure 6C; supplemental Figure 5B-C). Interestingly, EBV upregulated STEAP3 in newly infected primary B cells (Figure 6D), whereas STEAP1-4 were expressed at very low levels in resting and in Burkitt B cells. RNA-sequencing analysis indicated that STEAP3 is the family member most highly expressed in LCLs.62 LCL chromatin immunoprecipitation–sequencing showed that Epstein-Barr nuclear antigen 3A and all 5 NF-κB transcription factor subunits bind to a site near the STEAP3 promoter marked by activating histone 3 lysine 27 acetylation (H3K27Ac) (Figure 6E).
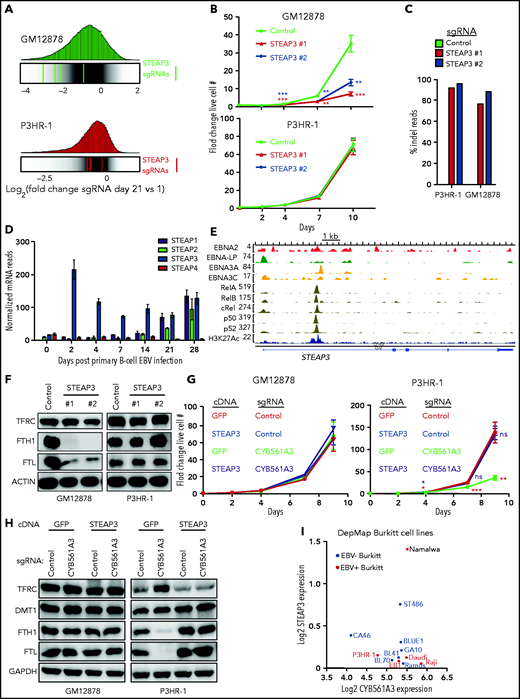
LCL is more dependent on iron reductase STEAP3 than Burkitt B cells. (A) Distribution of Avana human genome-wide CRISPR screen sgRNA log2 fold-change values at day 21 vs input in GM12878 (top) and P3HR-1 (bottom). Values for STEAP3 targeting sgRNAs are overlaid on gray gradients depicting all Avana sgRNA library values.30 Average day 21 vs input values from 4 screen biological replicates are shown. (B) Growth curve analysis of GM12878 (left) and P3HR-1 (right) at the indicated time points after expression of control or independent STEAP3 sgRNAs and puromycin selection. Mean ± standard deviation values from n = 3 replicates are shown. (C) Indel-sequencing analysis of Cas9 activity at the STEAP3 locus. Shown are the percentage of indels in P3HR-1 or GM12878 cells expressing the indicated control or STEAP3 sgRNAs. (D) RNA-sequencing analysis of STEAP family messenger RNAs at the indicated days postprimary human B-cell EBV infection.35 (E) Chromatin immunoprecipitation–sequencing tracks of the indicated Epstein-Barr nuclear antigens, NF-κB subunits, and H3K27 acetyl (H3K27ac) marks at the STEAP3 locus in LCLs. (F) Immunoblot analysis of WCLs from GM12878 (left) and P3HR-1 (right) 9 days after control or STEAP3 sgRNA expression. (G) Growth curve analysis of STEAP3 cDNA rescue effects on P3HR-1 (left) or GM12878 (right) with control or CYB561A3 sgRNAs. Shown are mean ± standard deviation values from n = 3 replicates. (H) Immunoblot analysis of WCL from GM12878 (left) and P3HR-1 (right) expressing the indicated control or CYB561A3 sgRNAs and cDNAs expressing green fluorescent protein (GFP) vs STEAP3. (I) Log2 normalized RNA-sequencing STEAP3 (y-axis) vs CYB561A3 (x-axis) values from EBV+ (red) and EBV– (blue) Burkitt lymphoma cell lines profiled by DepMap. Representative blots from n = 3 replicates are shown in panels F and H. *P < .05; **P < .01; ***P < .001. GAPDH, glyceraldehyde-3-phosphate dehydrogenase; ns, nonsignificant (unpaired Student t test).
LCL is more dependent on iron reductase STEAP3 than Burkitt B cells. (A) Distribution of Avana human genome-wide CRISPR screen sgRNA log2 fold-change values at day 21 vs input in GM12878 (top) and P3HR-1 (bottom). Values for STEAP3 targeting sgRNAs are overlaid on gray gradients depicting all Avana sgRNA library values.30 Average day 21 vs input values from 4 screen biological replicates are shown. (B) Growth curve analysis of GM12878 (left) and P3HR-1 (right) at the indicated time points after expression of control or independent STEAP3 sgRNAs and puromycin selection. Mean ± standard deviation values from n = 3 replicates are shown. (C) Indel-sequencing analysis of Cas9 activity at the STEAP3 locus. Shown are the percentage of indels in P3HR-1 or GM12878 cells expressing the indicated control or STEAP3 sgRNAs. (D) RNA-sequencing analysis of STEAP family messenger RNAs at the indicated days postprimary human B-cell EBV infection.35 (E) Chromatin immunoprecipitation–sequencing tracks of the indicated Epstein-Barr nuclear antigens, NF-κB subunits, and H3K27 acetyl (H3K27ac) marks at the STEAP3 locus in LCLs. (F) Immunoblot analysis of WCLs from GM12878 (left) and P3HR-1 (right) 9 days after control or STEAP3 sgRNA expression. (G) Growth curve analysis of STEAP3 cDNA rescue effects on P3HR-1 (left) or GM12878 (right) with control or CYB561A3 sgRNAs. Shown are mean ± standard deviation values from n = 3 replicates. (H) Immunoblot analysis of WCL from GM12878 (left) and P3HR-1 (right) expressing the indicated control or CYB561A3 sgRNAs and cDNAs expressing green fluorescent protein (GFP) vs STEAP3. (I) Log2 normalized RNA-sequencing STEAP3 (y-axis) vs CYB561A3 (x-axis) values from EBV+ (red) and EBV– (blue) Burkitt lymphoma cell lines profiled by DepMap. Representative blots from n = 3 replicates are shown in panels F and H. *P < .05; **P < .01; ***P < .001. GAPDH, glyceraldehyde-3-phosphate dehydrogenase; ns, nonsignificant (unpaired Student t test).
To gain insights into STEAP3 LCL roles, we next examined STEAP3 sgRNA effects on ferritin and transferrin abundance, as a proxy for their labile iron pool. Whereas STEAP3 KO did not alter ferritin expression in P3HR-1, it diminished GM12878 ferritin expression (Figure 6F). Remarkably, STEAP3 expression rescued P3HR-1 proliferation and prevented ferritin loss and transferrin upregulation in P3HR-1 cells upon CYB561A3 KO, indicating that STEAP3 can support iron metabolism when expressed in Burkitt cells (Figure 6G-H). Similar results were obtained in Mutu I (supplemental Figure 5D-F). Nearly all DepMap Burkitt cell lines have high CYB561A3 but low STEAP3 expression (Figure 6I). This pattern is unusual in DepMap cell lines but is also observed in a subset of pre–B-cell ALL cell lines and T-cell lymphomas (supplemental Figure 5G). An exception is the EBV+ Burkitt cell Namalwa, which carries 2 copies of the EBV genome integrated into host chromosomes and which has latency III expression, although no latent membrane protein 2A.63-65 CYB561A3 is most highly expressed among hematopoietic cells in plasmacytoid dendritic cells and B cells (supplemental Figure 6). Thus, we suggest that elevated STEAP3 expression may be an important factor in relieving cell dependency on CYB561A3. Alternatively, as yet identified factors may also (or instead) contribute to whether cells are dependent on CYB561A3 expression for survival.
Discussion
Burkitt lymphomas are the fastest growing human tumor, and iron demand increases in rapidly proliferating cancer cells. Here, we identified that the little-studied ferrireductase CYB561A3 is essential for iron acquisition in Burkitt cells (Figure 7). Our observations suggest that Burkitt cells specifically use CYB561A3 rather than STEAP3 to reduce Fe3+ imported by transferrin. STEAP3 has been implicated as a tumor suppressor and found to be a direct p53 transcriptional target.66,67 Therefore, it will be of interest to determine whether EBV uses CYB561A3 to support Burkitt-like hyperproliferation that occurs between days 3 and 7 after EBV infection but not during latency III– driven lymphoblastoid growth thereafter.12,13,68
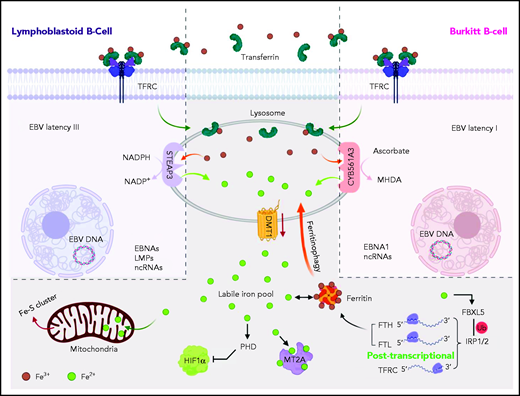
Model of CY561A3 and STEAP3 iron metabolism roles in Burkitt cells vs LCLs. Transferrin-bound Fe3+ iron is endocytosed by the transferrin receptor TFRC and delivered to lysosomes in both LCLs and Burkitt cells. Iron can also be delivered to B-cell lysosomes by ferritinophagy or by mitophagy. The acidic lysosomal microenvironment facilitates release of Fe3+, which is reduced for LCL cytosolic transport by STEAP3 to Fe2+, using NADPH as an electron donor. By contrast, Burkitt B cells with the EBV latency I program use the ferrireductase CYB561A3 to reduce Fe3+ to Fe2+, with ascorbate as the electron donor. The cytosolic labile iron pool then supplies a myriad of cellular functions, including iron-sulfur synthesis and respiration. Ferrous iron is also essential for suppression of hypoxia inducible factor 1 subunit α (HIF1α). The metallothionein MT2A binds ferrous iron, and its Burkitt cell expression is dependent on CYB561A3, presumably through an iron-dependent mechanism. In the absence of CYB561A3, Burkitt cells are rapidly depleted of labile iron; they induce an iron starvation response but nonetheless sustain catastrophic lysosomal and mitochondrial damage. LMPs, latent membrane proteins; NADP+, nicotinamide-adenine dinucleotide phosphate, oxidized form; ncRNAs, noncoding RNAs.
Model of CY561A3 and STEAP3 iron metabolism roles in Burkitt cells vs LCLs. Transferrin-bound Fe3+ iron is endocytosed by the transferrin receptor TFRC and delivered to lysosomes in both LCLs and Burkitt cells. Iron can also be delivered to B-cell lysosomes by ferritinophagy or by mitophagy. The acidic lysosomal microenvironment facilitates release of Fe3+, which is reduced for LCL cytosolic transport by STEAP3 to Fe2+, using NADPH as an electron donor. By contrast, Burkitt B cells with the EBV latency I program use the ferrireductase CYB561A3 to reduce Fe3+ to Fe2+, with ascorbate as the electron donor. The cytosolic labile iron pool then supplies a myriad of cellular functions, including iron-sulfur synthesis and respiration. Ferrous iron is also essential for suppression of hypoxia inducible factor 1 subunit α (HIF1α). The metallothionein MT2A binds ferrous iron, and its Burkitt cell expression is dependent on CYB561A3, presumably through an iron-dependent mechanism. In the absence of CYB561A3, Burkitt cells are rapidly depleted of labile iron; they induce an iron starvation response but nonetheless sustain catastrophic lysosomal and mitochondrial damage. LMPs, latent membrane proteins; NADP+, nicotinamide-adenine dinucleotide phosphate, oxidized form; ncRNAs, noncoding RNAs.
Whereas CYB561A3 uses ascorbic acid as the cytosolic electron donor, STEAP3 instead uses NADPH. Humans do not synthesize ascorbate due to a deficiency of an enzyme required for the last step in its biosynthesis.69 Nonetheless, lymphocytes have ascorbic acid concentrations of approximately 1 to 4 mM, 90% of which is cytosolic,70 suggesting ample supply for use in iron reduction. Ascorbate has electron donor roles relevant to the B-cell differentiation state, including with Fe2+-dependent histone demethylases and dioxygenases that control the epigenetic landscape.3 We speculate that Burkitt cell dependence on CYB561A3 may conserve NADPH for alternative functions, such as anabolic reactions required for rapid cell growth. Alternatively, germinal center regions have low oxygen tension, and perhaps CYB561A3 is better able to reduce iron in this microenvironment.71-73
We suspect that loss of CYB561A3 ferrireductase activity caused toxic buildup of iron within lysosomes, and yet this large reservoir of iron could not be mobilized for cytosolic transport in the absence of appropriate Fe3+ reduction. Several studies recently implicated lysosomal acidification as critical for ferric iron reduction and ferrous iron cytosolic transport in proliferating cells.22-24 CYB561A3 was among a small group of genes differentially required by Jurkat T cells upon treatment with agents that increase lysosomal pH, bafilomycin, and ammonium chloride.22 Although STEAP3 ferrireductase activity is optimal at acidic pH,74 we were unable to obtain evidence that Burkitt latency I lysosomes had higher pH than those of LCLs or latency III cells. Furthermore, pH gradients are often found across subcellular membranes containing CYB561 proteins in plants and animals and are likely important for CYB561 function.27 Yet-to-be identified factors may contribute to whether cells are dependent on CYB561A3 expression for survival.
MYC chromosomal translocations are a major Burkitt driver.32,33,75 MYC upregulates TFRC transcription,76 and repression of H-ferritin expression and induction of transferrin receptor are required for MYC-driven cell proliferation.76,77 MYC also activates expression of the cytosolic ferrous iron transporter DMT1 to increase the labile iron pool.76 DepMap identified that precursor B-ALL REH cells have the next highest CYB561A3 dependency following Burkitt cell lines, in which c-MYC protein is aberrantly stabilized.78
Endemic Burkitt lymphoma arises in areas of holoendemic malaria, where coinfection between EBV and plasmodium contribute to its etiology. Iron deficiency is common in regions of holoendemic malaria.79 CYB561A3 ferrireductase activity may offer a selective advantage to EBV-infected B cells at particular stages of transformation, including in latency I, and might thereby contribute to the etiology of endemic Burkitt lymphoma.80
Burkitt lymphoma is treated with high-intensity chemotherapy, which causes morbidity and carries significant risks of infection, cardiotoxicity, and secondary malignancies. These substantial side effects limit treatment options in resource-limited settings. Given the unique CYB561A3 dependence in Burkitt lymphomas, CYB561A3 may be an intriguing therapeutic target. Small molecule inhibitors of CYB561A3 activity or targeted protein degraders that target CYB561A3 for ubiquitin-dependent degradation therefore warrant exploration for the development of novel rational therapeutic approaches. Although a KO mouse model is not yet available, DepMap CRISPR data indicate that its inhibition may be well tolerated by most cell types.
Acknowledgments
The authors thank Maria Ericsson in the Harvard Medical School Electron Microscopy core for assistance with EM images.
This work was supported by the National Institutes of Health (National Institute of Allergy and Infectious Diseases, RO1 AI137337, and National Cancer Institute, RO1 CA228700 [B.E.G.]), Starr Cancer Foundation Project # I11-0043, Burroughs Wellcome Career Award in Medical Sciences, and an American Cancer Society Research Scholar Award and generous support from Sandra & George Schussel (B.E.G.), Howard Hughes Medical Institute (V.K.M.), and a Lymphoma Research Foundation award (R.G.).
Authorship
Contribution: Z.W., R.G., S.J.T., E.W., T.A., J.H.L., and Y.M. performed and analyzed the experiments; Z.W., C.J., S.J.T., Y.M., M.T., and R.G. performed the RNA-sequencing experiments, which were analyzed by R.G. and M.T.; bioinformatics analysis was performed by R.G. and M.T.; and R.G., V.K.M., and B.E.G supervised the study.
Conflict-of-interest disclosure: V.K.M. is on the scientific advisory board for and received equity from Janssen Pharmaceuticals and 5am Ventures. B.E.G. receives research support from AbbVie, unrelated to this study. The remaining authors declare no competing financial interests.
The current affiliation for C.J. is Department of Cancer Physiology, H. Lee Moffitt Cancer Center and Research Institute, Tampa, FL.
Correspondence: Benjamin E. Gewurz, 181 Longwood Ave, 8th Floor, Boston, MA 02115; e-mail: bgewurz@bwh.harvard.edu.
The RNA-sequencing data reported in this article have been deposited in the Gene Expression Omnibus database (accession number GSE149066) and will be released upon publication.
The online version of this article contains a data supplement.
There is a Blood Commentary on this article in this issue.
The publication costs of this article were defrayed in part by page charge payment. Therefore, and solely to indicate this fact, this article is hereby marked “advertisement” in accordance with 18 USC section 1734.

This feature is available to Subscribers Only
Sign In or Create an Account Close Modal