

Key Points
There was no association between genome-wide or C5-related gene variants and C5 levels; plasma CRP and C5 showed a linear relationship.
Increased levels of C5 were positively associated with future venous thromboembolic events in a nested case-control study.

Abstract
The role of complement in the pathogenesis of venous thromboembolism (VTE) is unclear. We wanted to investigate (1) whether plasma complement component C5 (C5) levels are influenced by genetic variants or chronic inflammation and (2) the association between plasma C5 and risk of future VTE in a nested case-control study of 415 patients with VTE and 848 age- and sex-matched controls derived from the Tromsø Study. Plasma C5 levels were measured at inclusion. Odds ratios (ORs) with 95% confidence intervals (95% CIs) for provoked and unprovoked VTE across tertiles of C5 concentrations were estimated by logistic regression. Adjustment for C-reactive protein (CRP) served as a proxy for general inflammation. Whole-exome sequencing and protein quantitative trait loci analyses were performed to assess genetic influence on C5 concentrations. There was no association between genome-wide or C5-related gene variants and C5 levels. The association between plasma C5 levels and VTE risk displayed a threshold effect, where subjects with C5 levels above the lowest tertile had increased risk of VTE. Subjects in tertile 3 (highest C5 levels) had an age- and sex-adjusted OR of 1.45 (95% CI, 1.07-1.96) compared with tertile 1 (lowest). These statistics were more pronounced for unprovoked VTE (OR, 1.70; 95% CI, 1.11-2.60). Adjustments for body mass index and CRP had minor impact on risk estimates. The OR increased substantially with shorter time between blood sampling and VTE event. In conclusion, plasma C5 was associated with risk of future VTE. C5 levels were not genetically regulated and were only slightly influenced by chronic inflammation.
Introduction
Venous thromboembolism (VTE), including deep vein thrombosis (DVT) and pulmonary embolism (PE), is a frequently occurring disease with severe complications and a high mortality rate.1,2 VTE is also a complex disease with several genetic and environmental risk factors involved.3 The mechanisms that initiate the formation of venous thrombi should be fully elucidated,4 and there is still a need to identify risk factors and to unravel pathophysiological pathways with potential for targeted prevention of VTE.
During the past decades, inflammation and coagulation have been shown to be overlapping processes involving many humoral and cellular components of the vasculature.5,6 The complement system is an important part of the innate immune system, and several points of intersection between the complement and coagulation systems may contribute to a prothrombotic phenotype upon complement activation.5 A few prospective observational studies have investigated the association between individual components of the complement system and risk of VTE. In a large Danish population–based cohort,7 subjects with plasma complement component C3 (C3) levels in the highest tertile had a 30% higher risk of VTE than did subjects in the lowest tertile. We recently showed that increasing levels of the final activation product of the complement cascade, the terminal complement complex C5b-9 (TCC), was associated with an increased risk of VTE.8 In addition, we reported that low levels of mannose-binding lectin, a major pattern-recognition molecule of the lectin pathway of complement activation, was associated with a lower risk of VTE.9
C5 is involved in hemostatic processes and plays a central role in complement system activation, as proteolytic cleavage of C5 releases the proinflammatory anaphylatoxin C5a, whereas C5b initiates the formation of the TCC.10 Membrane-inserted TCC, the membrane attack complex, may lyse cells such as erythrocytes, increasing the risk of thrombosis, as seen in paroxysmal nocturnal hemoglobinuria, which is now treated with complement inhibitors that partly reduce the risk of thrombosis.11 The soluble part of the TCC may also be inserted into cell membranes without subsequent lysis, instead forming small pores and inducing proinflammatory responses via calcium influx.12 This sublytic C5b-9 membrane insertion activates platelets13 and induces exposure of procoagulant lipids, such as phosphatidylserine (PS), on the surface of platelets and endothelial cells that are necessary for the assembly of the prothrombinase complex.14,15 Sublytic C5b-9 also induces the expression of adhesion molecules on endothelial cells and platelets16 and induces the secretion of von Willebrand factor and proinflammatory cytokines.17 In addition, C5a has been shown to induce tissue factor expression on endothelial cells18 and on monocytes in various disease states.19
Even though experimental studies indicate a role for C5 in the setting of venous thrombus formation, the impact of C5 as a risk factor for VTE in the general population remains unknown. In a murine inferior vena cava stenosis model of venous thrombosis, C5-deficient mice showed reduced fibrin formation, reduced exposure of negatively charged PS on adherent leukocytes and reduced clot burden after 48 hours compared with wild-type controls.20 To the best of our knowledge, no study has addressed whether C5 levels are influenced by gene variants or chronic inflammation. Therefore, the purpose of this study was (1) to investigate whether plasma C5 levels are influenced by genetic variants (using protein quantitative trait loci [pQTL] analysis of exome sequencing data) or chronic inflammation (assessed by C-reactive protein [CRP]) and (2) to explore the association between plasma C5 concentration and risk of future VTE.
Methods
Study population
The Tromsø Study is a single‐center, population‐based cohort study, with repeated health surveys of inhabitants of Tromsø, Norway.21 All inhabitants aged ≥25 years living in the municipality of Tromsø were invited to participate in the fourth survey (Tromsø 4), conducted in 1994 and 1995. A total of 27 158 subjects participated (77% of those invited) and were observed from the date of inclusion until an incident VTE, migration, death, or end of follow‐up (1 September 2007). All first lifetime VTE events were identified in the hospital discharge diagnosis registry, the autopsy registry, and the radiology procedure registry at the University Hospital of North Norway, which is the sole hospital in the Tromsø region. Trained personnel adjudicated and recorded each VTE by extensive review of medical records. A VTE was confirmed if the presence of signs and symptoms of PE or DVT (proximal or distal) was combined with objective confirmation by radiological procedures (ie, compression ultrasonography, venography, spiral computed tomography, perfusion‐ventilation scan, and/or pulmonary angiography) or autopsy. All cases were treated unless anticoagulation therapy was contraindicated, as previously described.22 A VTE occurring in the presence of 1 or more of the following factors was classified as provoked: surgery, trauma (within 8 weeks before the event), acute medical conditions (acute myocardial infarction, acute ischemic stroke, and acute infections), immobilization (confinement to bed >3 days or to a wheelchair within the past 8 weeks), or other factors specifically described by a physician in the medical record as provoking VTE (eg, intravascular catheterization).
During the follow‐up period (1994-2007), 462 individuals experienced a VTE event. For each case, 2 age‐ and sex‐matched controls (n = 924), who were alive at the index date of the VTE event, were randomly sampled from the source cohort. In total, 47 cases and 76 controls did not have available plasma samples of sufficient quality for the analyses. Thus, our final nested case-control study consisted of 415 cases and 848 controls.
The regional committee for medical and health research ethics approved the study, and all participants provided written informed consent.
Baseline measurements
Height (to the nearest centimeter) and weight (to the nearest 0.5 kg) were measured in participants wearing light clothing and no shoes. Body mass index (BMI) was calculated as weight divided by the square of height in meters (kg/m2). A self‐administered questionnaire was used to collect a detailed history of diabetes, previous cardiovascular disease (CVD) events (stroke, angina pectoris, and myocardial infarction), and cancer.
Plasma samples and storage
At inclusion in Tromsø 4 (1994‐1995), nonfasting blood was collected from an antecubital vein into 5‐mL vacutainers (Becton Dickinson, Le Pont de Claix, France) containing anticoagulant EDTA (K3‐EDTA 40 μL, 0.37 mol/L per tube). Platelet-poor plasma was prepared by centrifugation at 3000g for 10 minutes at room temperature and the supernatant was transferred to cryovials (Greiner Labortechnik, Nürtingen, Germany) in 1‐mL aliquots and stored at −80°C. Plasma samples were thawed in a water bath at 37°C for 5 minutes, followed by centrifugation for 2 minutes at 13 500g to obtain platelet‐free plasma.
Quantification of CRP and C5
Plasma levels of high‐sensitivity CRP were measured in duplicate with commercially available reagents by enzyme immunoassay (R&D Systems, Minneapolis, MN) in a 384-well microtiter format, using the combination of a Selma (Jena, Germany) pipetting robot and a BioTek (Winooski, VT) dispenser/washer (EL406). Absorption was read at 450 nm, with a wavelength correction set to 540 nm on an enzyme immunoassay plate reader (Synergy H1 Hybrid; BioTek). The intraindividual and interindividual coefficients of variation were 2.6% and 9.1%, respectively.
C5 was quantified according to the manufacturer’s instructions of a commercially available sandwich enzyme-linked immunosorbent assay (Abcam, Cambridge, United Kingdom). Optical densities were read at 450 nm with a wavelength correction of readings of 570 nm, on an Infinite M200 PRO plate reader (Tecan Trading AG, Männedorf, Switzerland). The manufacturer reports intraindividual and interindividual coefficients of variation of 5.0% and 8.6%, respectively. The reported average recovery rate was 101%.
Exome sequencing
Whole-exome sequencing was conducted on a subgroup of the study population consisting of 355 patients with VTE and 354 controls. The Agilent SureSelect 50-Mb capture kit with a high average coverage of 100 reads was used. The exome-sequenced genotypes were filtered23 and imputed,24 as previously described.
Statistical analysis
Statistical analyses were performed in R, version 3.6.1. Plasma C5 was categorized according to tertile cutoffs in the control population (27-52, 52-60, and 60-118 μg/mL) or used as a continuous variable. Means and proportions of baseline characteristics across tertiles of C5 were calculated by using descriptive statistics. The correlation between C5 and CRP was determined by Pearson’s correlation coefficient and boxplots. Logistic regression models were used to estimate odds ratios (ORs) for VTE with 95% confidence intervals (CIs) according to tertiles or per standard deviation (SD) of C5, adjusted for age, sex, BMI, and CRP. We also used a model with further adjustment for smoking, diabetes, history of CVD, and cancer. The lowest tertile of C5 served as the reference group. We also performed subgroup analyses of provoked and unprovoked VTE and of DVT and PE as outcomes.
Because the follow-up time in the source cohort was long (≥12 years for several individuals), the results based on baseline C5 measurement could have been influenced by regression dilution bias.25 To investigate this possibility, we performed analyses restricted on the maximum time between blood sampling in Tromsø 4 and the VTE events, while keeping all controls in the analyses. The logistic regression analyses of time restrictions were set to require at least 10 VTE events, and ORs were generated at every time point when a new VTE occurred and plotted as a function of this maximum time.
For the whole-exome data set, after filtering and imputation, there were 1 033 970 variants. These variants were checked for regulation of plasma C5 levels via a pQTL analysis. The pQTL analysis was performed on the whole genome as well as on restricted cis regions ±500 kb around the transcription start/stop of the C5 gene; the genes involved in the complement system are listed in supplemental Table 2 (available on the Blood Web site). The C5 cis region contained 549 variants, which gave a Bonferroni-corrected P-value threshold of .05/549 = 9.1 × 10⁻⁵ for the cis analysis. The complement-related genes contained 11 806 cis-region variants in total, which, with a Bonferroni‐based adjustment for multiple testing, gave a significance threshold of .05/11.806 = 4.23 × 10⁻⁶. The commonly used 5 × 10⁻⁸P threshold was used for the genome-wide analysis. The C5 plasma level data were transformed to a perfect standard normal distribution for the pQTL analysis, and age, sex, BMI, and VTE status were used as the adjusting variables. The pQTL analyses were performed by the EPACTS (Efficient and Parallelizable Association Container Toolbox) software (Ann Arbor, MI), and the EMMAX (Efficient Mixed Model Association eXpedited)26 test in EPACTS was used. EMMAX uses a mixed model to test for associations between quantitative traits and genetic variants while allowing for traditional adjustment variables and adjustment for genetic relatedness in the data. Based on the 709 persons included, the pQTL analysis detected single-nucleotide polymorphisms (SNPs) explaining >1.1% of the variance in C5 levels with 80% power and a 5% significance level.
Results
The baseline characteristics of VTE cases and controls are shown in Table 1. Patients with VTE had higher BMI (27.2 vs 26.1 kg/m2), and higher proportions had a history of cancer (6.2% vs 3.7%) than did the controls. The proportions with a history of CVD and diabetes were similar in cases and controls, and the proportion of smokers was lower in cases vs controls (29.5% vs 32.0%). The characteristics of study participants across tertiles of plasma C5 concentrations are shown in supplemental Table 1. Age, BMI, CRP, white blood cell count, and thrombocyte levels, as well as the proportion of men and subjects with a history of CVD increased across tertiles of plasma C5 levels, whereas the proportions of smokers, patients with diabetes, and subjects with a history of cancer were similar in all 3 categories (supplemental Table 1).
Distribution of baseline characteristics for cases and controls
| Cases (n = 415) | Controls (n = 848) | P | |
|---|---|---|---|
| C5, μg/mL | 60.4 | 58.2 | .003 |
| Age in years, y | 60 ± 14 | 60 ± 14 | .999 |
| Male sex | 48.4 (201) | 46.7 (396) | .603 |
| BMI, kg/m2 | 27.2 ± 4.5 | 26.1 ± 4.1 | <.001 |
| Smoking | 29.5 (123) | 32.0 (271) | .441 |
| Diabetes* | 4.1 (17) | 3.9 (33) | .995 |
| CVD* | 15.7 (65) | 15.6 (132) | .999 |
| Cancer* | 6.2 (26) | 3.7 (31) | .051 |
| hsCRP, mg/L | 1.7 ± 1.4 | 1.6 ± 1.4 | .077 |
| White blood cell count, ×109/L | 7.2 ± 2.9 | 7.0 ± 1.8 | .177 |
| Platelet count, ×109/L | 247 ± 57 | 244 ± 53 | .336 |
Data are means ± SD or percentages with number of cases or controls in parentheses.
hsCRP, high-sensitivity CRP.
Self-reported history of diabetes, cancer, or CVD (myocardial infarction, angina pectoris, or stroke) at baseline.
C5 levels increased across tertiles of plasma CRP levels (Figure 1). Correlation analysis (Pearson) revealed a significant correlation (r = 0.23; P = 1.1 × 1−16; n = 1258), and linear regression revealed that C5 levels increased 2.1 µg/mL per 1 mg/L increase in CRP.
![Boxplots of C5 across tertiles of CRP. The horizontal lines of the gray box define the 25% (Q1), 50% (median), and 75% (Q3) percentiles. The whiskers extend up to min(max[C5], Q3 + 1.5∗IQR) and down to max(min[C5], Q1-1.5∗IQR), where their interquartile range is IQR = Q3-Q1. All values plotted as solid, red circles.](https://ash.silverchair-cdn.com/ash/content_public/journal/blood/138/21/10.1182_blood.2021010822/5/m_bloodbld2021010822f1.png?Expires=1769097400&Signature=ndpEBdcO9hgjm7CBCCpXR3aIUPIb0gOq0tZR9Tl4aisMrNU7fUrwxaWJ-Yxo45-ZtbH3L~Vahl0y-6XFlBJGHlSdabmRE5w2WVL110OEXIOewNC~EYeC-yIdL5rQW0JPB8-s6yF0BNYdC7q9ghPl6ehsqxe84u4wW-PKiNbDlGl82x5cC~1HZ2tycmRsHOnn8J5TIASczmK2Ed2to5Mz~pGjFwzm8NfNoE~HON-1l4mCoOzhFmcoiMwN0yGv7zOZJm1vX3tgMDnDdWrno1AgW2uLPHpvPdF0ps2-XKjfVeKHskPcbDxlGTMTZCvUm~WmPcAKqCKkFUBjPMljLfwvaQ__&Key-Pair-Id=APKAIE5G5CRDK6RD3PGA)
Boxplots of C5 across tertiles of CRP. The horizontal lines of the gray box define the 25% (Q1), 50% (median), and 75% (Q3) percentiles. The whiskers extend up to min(max[C5], Q3 + 1.5∗IQR) and down to max(min[C5], Q1-1.5∗IQR), where their interquartile range is IQR = Q3-Q1. All values plotted as solid, red circles.
Boxplots of C5 across tertiles of CRP. The horizontal lines of the gray box define the 25% (Q1), 50% (median), and 75% (Q3) percentiles. The whiskers extend up to min(max[C5], Q3 + 1.5∗IQR) and down to max(min[C5], Q1-1.5∗IQR), where their interquartile range is IQR = Q3-Q1. All values plotted as solid, red circles.
To identify any potential genetic regulation of plasma C5 levels, we performed a pQTL analysis. Figure 2 shows the resulting Manhattan plot, after adjustment for age, sex, BMI, and VTE status, with the cis-region variants marked by blue squares and the complement-related variants by purple triangles. There was no statistically significant SNP in the genome-wide or the cis-region analysis. The complement-related genes investigated in the pQTL are listed in supplemental Table 2.

Manhattan plot of pQTL analysis of C5 and complement-related genes adjusted for age, sex, BMI, and VTE status. The dashed lines indicate the genome-wide (top) and C5 cis-region (lower) P-value thresholds for significance. The blue squares mark variants in the ±500 kb cis region around the transcription start/stop of the C5 gene. The purple triangles mark variants in the complement-related genes listed in supplemental Table 2.
Manhattan plot of pQTL analysis of C5 and complement-related genes adjusted for age, sex, BMI, and VTE status. The dashed lines indicate the genome-wide (top) and C5 cis-region (lower) P-value thresholds for significance. The blue squares mark variants in the ±500 kb cis region around the transcription start/stop of the C5 gene. The purple triangles mark variants in the complement-related genes listed in supplemental Table 2.
The characteristics of the patients with VTE are shown in Table 2. The mean age at the time of VTE was 67.4 years, and 48.4% of the cases were men. In total, 37.8% of the VTE events were PEs, and 62.2% were DVTs. Furthermore, 57.8% of the VTEs were classified as provoked, with surgery, trauma, and/or active cancer being the most common provoking factors (Table 2). The mean time from blood sampling to VTE was 7.4 years.
Characteristics of the VTE cases
| % (n) | |
|---|---|
| Age at VTE event, y | 67.4 ± 14 |
| Sex (male) | 48.4 (201) |
| DVT | 62.2 (258) |
| PE | 37.8 (157) |
| Unprovoked VTE | 42.2 (175) |
| Provoked VTE | 57.8 (240) |
| Surgery/trauma | 22.4 (93) |
| Active cancer | 21.4 (89) |
| Immobilization | 18.1 (75) |
| Acute medical condition | 15.4 (64) |
| Estrogens | 7.7 (32) |
| Other provoking factors | 3.9 (16) |
n = 415. Data are means ± SD or percentages with the number of cases in parentheses.
The ORs for VTE, DVT, and PE across tertiles of C5 concentrations are shown in Figure 3. In the analyses of overall VTE, the OR was increased in the 2 highest tertiles of C5 concentrations, with an OR of 1.48 (95% CI, 1.10-1.98) in T2 and 1.45 (95% CI, 1.07-1.96) in tertile 3 (T3) when compared with T1 after adjustment for age and sex. Further adjustment for BMI (model 2) slightly attenuated the OR to 1.46 (95% CI, 1.09-1.97) for T2 vs T1 (Figure 3). A similar threshold effect was observed when comparing T2 and T1 for unprovoked and provoked VTE (OR, 1.60; 95% CI, 1.06-2.44, and OR, 1.39; 95% CI, 0.98-1.99, respectively). Additional adjustment for CRP (model 3) yielded an OR for overall VTE of 1.40 (95% CI, 1.04-1.89) for T2 vs T1. The ORs from model 3 in the subcategories were similar to those described for model 2, with an OR for provoked VTE of 1.35 (95% CI, 0.94-1.94) and an OR for unprovoked VTE of 1.50 (95% CI, 0.99-2.31), when comparing T2 to T1 (Figure 3). Further adjustment for smoking, diabetes, history of CVD, and cancer did not change the risk estimates substantially (supplemental Figure 1). The risk of VTE also increased per SD (12.5 μg/mL) increase in C5 levels, with an age- and sex-adjusted OR of 1.17 (95% CI, 1.04-1.32; supplemental Table 3).
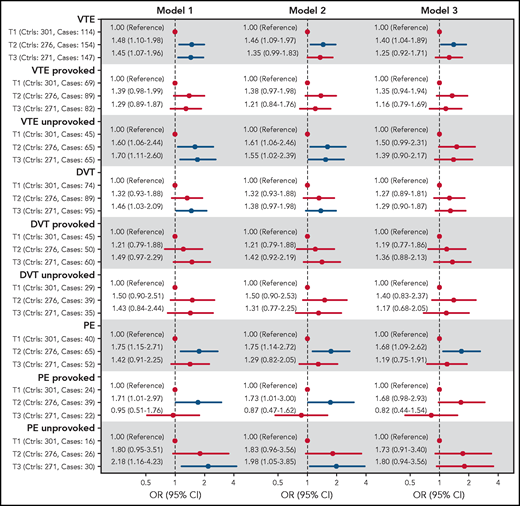
Forest plot showing ORs with 95% CIs for VTE and subgroups of VTE across tertiles of C5 plasma levels. Model 1: adjusted for age and sex. Model 2: adjusted for age, sex, and BMI. Model 3: adjusted for age, sex, and BMI and CRP.
Forest plot showing ORs with 95% CIs for VTE and subgroups of VTE across tertiles of C5 plasma levels. Model 1: adjusted for age and sex. Model 2: adjusted for age, sex, and BMI. Model 3: adjusted for age, sex, and BMI and CRP.
To consider the possibility of underestimating ORs because of regression dilution bias, we estimated ORs for overall, unprovoked, and provoked VTE among subjects with low (lowest tertile) vs high (highest tertile) plasma C5 as a function of time between blood sampling and VTE (Figure 4). The ORs were substantially higher when blood sampling was close to the VTE events, indicating substantial regression dilution over time. The ORs for overall VTE restricted to 2, 3, and 5 years of follow-up are also shown in Figure 5. At 2 years, the age- and sex-adjusted OR for T3 vs T1 was 4.81 (95% CI, 1.77-16.9), and at 5 years the corresponding OR was 1.87 (1.16-3.06). Boxplots showing the spread of C5 levels in all cases and controls as well as in cases with different restrictions on follow-up time are shown in supplemental Figure 2.
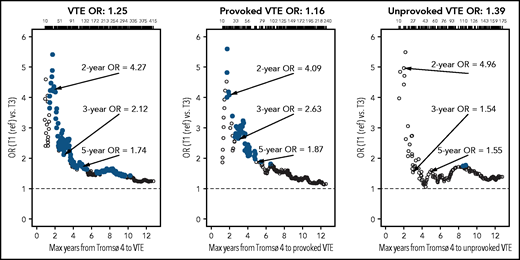
Plots of estimated ORs for overall VTEs and unprovoked and provoked VTE events as a function of maximum time from blood sampling for Tromsø 4 (1994‐1995) to the event (all controls were included in all analyses). Analyses are adjusted for age, sex, BMI, and CRP. Large, solid, blue circles indicate ORs with P < .05. Point estimates for 2, 3, and 5 years of follow-up are indicated, and the number of events are given at the top of each plot.
Plots of estimated ORs for overall VTEs and unprovoked and provoked VTE events as a function of maximum time from blood sampling for Tromsø 4 (1994‐1995) to the event (all controls were included in all analyses). Analyses are adjusted for age, sex, BMI, and CRP. Large, solid, blue circles indicate ORs with P < .05. Point estimates for 2, 3, and 5 years of follow-up are indicated, and the number of events are given at the top of each plot.
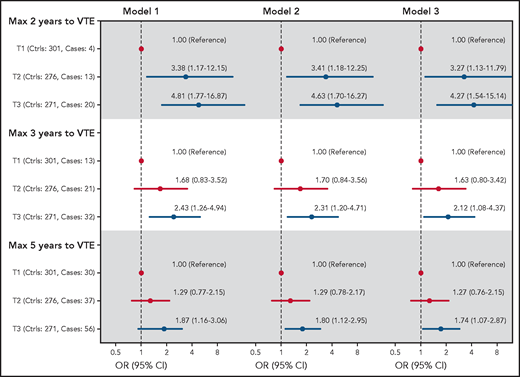
Forest plot showing ORs with 95% CIs for VTE across tertiles of C5 plasma levels at 2, 3, and 5 years of follow-up. Model 1: adjusted for age and sex. Model 2: adjusted for age, sex, and BMI. Model 3: adjusted for age, sex, BMI, and CRP.
Forest plot showing ORs with 95% CIs for VTE across tertiles of C5 plasma levels at 2, 3, and 5 years of follow-up. Model 1: adjusted for age and sex. Model 2: adjusted for age, sex, and BMI. Model 3: adjusted for age, sex, BMI, and CRP.
Discussion
In this study, we found that plasma C5 levels were slightly affected by inflammatory status and that subjects with low (lowest tertile) plasma C5 levels had a lower risk of future VTE. This threshold effect at tertile 2 was observed for all VTE outcomes (provoked/unprovoked and DVT/PE). Subjects with moderate or high C5 levels had increased VTE risk, particularly for unprovoked events, and PE in particular, compared with those with low C5 levels. The C5 levels were slightly affected by inflammatory status, and the risk estimates were modestly attenuated when adjusted for BMI and CRP. Further adjustment for smoking status, although indicated to affect C5 levels,27 did not alter the risk estimates. Moreover, adjustment for diabetes, history of CVD and cancer did not affect the risk estimates. The ORs for VTE were substantially higher when VTE occurred within the first years after blood sampling, indicating regression dilution bias related to the intraindividual fluctuation of C5 levels.25 Our pQTL analysis revealed no association between genome-wide, complement-related, or C5-related gene variants and plasma levels of C5. As our well-powered pQTL analysis found no significant SNPs, C5 plasma levels are unlikely to be considerably genetically regulated.
A clear temporal sequence between exposure and outcome, such as in our nested case-control study, is a prerequisite to establishing whether plasma C5 concentration is a risk factor for VTE. No previous observational study has investigated the association between plasma C5 levels and risk of future VTE. Even though our finding is unchallenged, circumstantial evidence supports a role of the complement system, and C5 in particular, in the pathogenesis of VTE. First, experimental studies have shown that pathological C5 activation induces TF expression in monocytes19 and neutrophils,28 induces the expression of adhesion molecules,16,29 induces exposure of procoagulant PS at cell surfaces,20 and promotes the release of procoagulant extracellular vesicles,15 all features that have been related to increased VTE risk.30-33 Second, proteolytic cleavage of C5 culminates in the formation of the terminal complement complex C5b-9, and high plasma levels of soluble C5b-9 have been associated with increased risk of VTE.8 Third, in our study, moderate and high plasma C5 levels displayed the strongest risk estimates for unprovoked VTE events, indicating that moderate and high C5 levels alone, independent of provoking factors, provided sufficient strength to exceed an individual’s threshold for thrombosis. Fourth, C5-deficient mice had reduced thrombus stability in a flow-restricted model,20 which may explain why the risk of PE, and of unprovoked PE in particular, was higher than for DVT in our study.
Our finding of an association between C5 levels and risk of VTE is in accordance with the results from a large Danish cohort showing that moderate and high levels of C3 are associated with increased risk of VTE.7 In agreement with our findings, they found a threshold effect where subjects with C3 levels in the lowest tertile had a lower risk of VTE, without any further concentration-dependent increased VTE risk at higher C3 levels.7 Furthermore, the magnitude of the risk estimates for VTE were similar for C3 and C5 levels in the highest compared with the lowest tertiles. Furthermore, the risk estimates for VTE for tertile 1 vs tertile 3 were comparable, and they were stronger for PE than for DVT in both studies.
Analyses of plasma components that fluctuate over time are expected to result in underestimations of the true risk in prospective studies with long follow-up, a phenomenon called regression dilution bias.25 Accordingly, we demonstrated that the OR for VTE among subjects with high compared with low plasma C5 levels increased substantially with shorter time between blood sampling and VTE events, indicating that C5 is a dynamic marker of VTE risk.
C5 has been assumed to be an acute-phase protein similar to C3 and C4.34 Therefore, we performed an analysis to determine the relationship between plasma CRP and C5 levels and found a weak linear relationship. This finding suggests that inflammatory responses enhance C5 synthesis and release, similar to C3 and C4.34 However, as a feedback mechanism of the initial inflammatory response, CRP can bind to C1q and activate the classic pathway of the complement system as well.35 Thus, CRP can be seen as both a confounder and a mediator of the relationship between C5 levels and VTE. In our study, adjustment for CRP only slightly attenuated the ORs, indicating that only a minor part of the relationship between C5 and VTE could be explained by differences in CRP levels.
Strengths of this study include the temporal sequence of exposure and outcome in a sample recruited from the general adult population with validated VTE events. The study also has limitations. It had somewhat limited power, and because the CIs were wide and included unity for some categories, our results should be interpreted with caution. Moreover, changes in C5 levels during follow-up could have resulted in underestimation of the OR, as indicated by the regression-dilution plot showing higher ORs when analyses were restricted to the first years after follow-up. Blood samples were drawn from 1994 through 1995 and stored at −80°C for up to 22 years. The long storage time may have affected the plasma C5 levels. However, as all samples were stored under the same conditions and for the same amount of time, regardless of case-control status, the storage effect is assumed to be similar in cases and controls and is therefore unlikely to have influenced the relative differences.
In summary, the results of our nested case‐control study show that C5 levels were slightly affected by chronic inflammation and that medium and high C5 levels were associated with increased risk of future VTE and unprovoked events in particular. No gene variants were found to regulate plasma C5, which may in part explain the substantial increased risk of VTE when the modifiable C5 levels were sampled close to the VTE event. Our findings provide further support for the role of individual components of the complement system in the pathogenesis of VTE.
Acknowledgments
K. G. Jebsen Thrombosis Research and Expertise Center (TREC) is supported by an independent grant from Stiftelsen Kristian Gerhard Jebsen. This study was also supported by the Norwegian Council on Cardiovascular Disease, the Odd Fellow Foundation, and the Simon Fougner Hartmann Family Fund.
Authorship
Contribution: E.W.S. analyzed the data and wrote and revised the manuscript; J.K.L. performed the laboratory analysis and revised the manuscript; K.H., O.S., and S.K.B. analyzed the data and participated in the revision of the manuscript; T.E.M., S.K.B., and J.-B.H. designed the study and participated in the writing and revision of the manuscript; and all authors read and approved the final manuscript.
Conflict-of-interest disclosure: The authors declare no competing financial interests.
Correspondence: Espen Waage Skjeflo, Department of Medicine, Nordland Hospital, P.O. Box 1480, 8092 Bodø, Norway; e-mail: espenwskjeflo@gmail.com.
For original data, please contact the corresponding author (espenwskjeflo@gmail.com).
The online version of this article contains a data supplement.
There is a Blood Commentary on this article in this issue.
The publication costs of this article were defrayed in part by page charge payment. Therefore, and solely to indicate this fact, this article is hereby marked “advertisement” in accordance with 18 USC section 1734.

This feature is available to Subscribers Only
Sign In or Create an Account Close Modal