

Key Points
Tumor-suppressive activity of miR-497/195 in BCP-ALL was mediated by inhibition of cell cycle progression and in vivo leukemia growth).
Cooperative activity of lost miR-497/195 expression and deletions of the cell cycle inhibitors CDKN2A/B resulted in poor patient outcome.

Abstract
We previously identified an association of rapid engraftment of patient-derived leukemia cells transplanted into NOD/SCID mice with early relapse in B-cell precursor acute lymphoblastic leukemia (BCP-ALL). In a search for the cellular and molecular profiles associated with this phenotype, we investigated the expression of microRNAs (miRNAs) in different engraftment phenotypes and patient outcomes. We found high expression of miR-497 and miR-195 (hereafter miR-497/195) in patient-derived xenograft samples with slow engraftment derived from patients with favorable outcome. In contrast, epigenetic repression and low expression of these miRNAs was observed in rapidly engrafting samples associated with early relapse. Overexpression of miR-497/195 in patient-derived leukemia cells suppressed in vivo growth of leukemia and prolonged recipient survival. Conversely, inhibition of miR-497/195 led to increased leukemia cell growth. Key cell cycle regulators were downregulated upon miR-497/195 overexpression, and we identified cyclin-dependent kinase 4 (CDK4)– and cyclin-D3 (CCND3)–mediated control of G1/S transition as a principal mechanism for the suppression of BCP-ALL progression by miR-497/195. The critical role for miR-497/195–mediated cell cycle regulation was underscored by finding (in an additional independent series of patient samples) that high expression of miR-497/195 together with a full sequence for CDKN2A and CDKN2B (CDKN2A/B) was associated with excellent outcome, whereas deletion of CDKN2A/B together with low expression of miR-497/195 was associated with clearly inferior relapse-free survival. These findings point to the cooperative loss of cell cycle regulators as a new prognostic factor indicating possible therapeutic targets for pediatric BCP-ALL.
Introduction
Despite advanced therapies that involve molecular risk stratification in pediatric B-cell precursor acute lymphoblastic leukemia (BCP-ALL),1 relapse is still associated with poor outcome.2 Thus, a better understanding of the molecular mechanisms of BCP-ALL is required to develop new effective therapeutic strategies.
In ALL, genetic lesions occur at a high frequency in genes coding for antiproliferative factors, which points to the importance of altered cell cycle regulation for leukemia development.3,4 Several reports show that targeting master regulators of cell proliferation, such as cyclin-dependent kinase (CDK)– and mammalian target of rapamycin (mTOR)–dependent pathways can effectively impair leukemia growth, indicating potential therapeutic strategies.5-8 Cell cycle control can be disturbed at different levels by direct mutation or deletion of regulators or by alteration of gene expression, including modifications by microRNAs (miRNAs). miRNAs are short noncoding RNAs that repress gene expression by binding to the 3' untranslated region of messenger RNAs, leading to their degradation or repression of translation.9 miRNAs have broad targeting properties, and they are important regulators of gene expression because they increase the complexity and cross-talk in gene networks.9,10 miRNA function is tightly regulated in the hematopoietic system.11-13 In ALL, miRNA expression is altered in different subtypes and is associated with sensitivity to therapy.14 Moreover, altered miRNA expression regulates leukemia cell function by promoting an oncogenic phenotype or counteracting uncontrolled growth.15-19
Here, we analyze the role and function of miRNAs in BCP-ALL by using a xenograft model in which patient-derived leukemia cells are transplanted into NOD/SCID mice. Previously, we demonstrated that the time between transplantation and onset of disease (time to leukemia, TTL) reflects patient outcome.20 Rapid engraftment (within 10 weeks, TTLshort) is indicative of a high risk for early relapse, whereas delayed leukemia onset (TTLlong) is associated with favorable outcome. In a search for molecular determinants of the engraftment phenotype, we analyzed miRNA expression profiles in TTLshort and TTLlong ALL xenograft samples. Higher expression of the miR-497 and miR-195 cluster (hereafter miR-497/195) was associated with slow engraftment and, most importantly, favorable patient outcome. Although miR-497/195 function in ALL was not previously characterized, a tumor suppressor role was described for both miRNAs in other tumors.21-25 In this study, we showed that the miR-497/195 cluster had a leukemia suppressive function that was mediated by inhibiting cell cycle progression by targeting regulators of G1/S transition such as cyclin-dependent kinase 4 (CDK4) and cyclin-D3 (CCND3). Moreover, repressed expression of miR-497/195 in high-risk leukemias cooperates with deletions of CDK inhibitor 2A and 2B (CDKN2A and CDKN2B [CDKN2A/B]) that lead to inferior relapse-free survival in patients.
Methods
Patient-derived xenograft (pdx) samples
BCP-ALL leukemia samples from pediatric patients were obtained at diagnosis after informed consent of patients and/or their legal guardians in accordance with the institution’s ethical review board. Leukemia cells were transplanted into NOD/SCID mice (NOD.CB17-Prkdcscid, Charles River, Sulzfeld, Germany) as previously described.20,26 Animal experiments were approved by Regional Council Tübingen. Cells were isolated from spleens at leukemia manifestation. Genome-wide methylation was assessed by methyl -CpG immunoprecipitation sequencing.
Small RNA sequencing (RNA-seq)
Total RNA was isolated from pdx ALL cells (TRIzol, Thermo Fisher Scientific), and libraries were prepared (TruSeq Small RNA Sample Preparation kit) and sequenced (Illumina HiSeq, Illumina). miRNA expression was investigated (miR&moRe pipeline27,28), and differentially expressed miRNAs were identified (R software with DESeq2 [a tool for differential gene expression analysis of RNA-seq data29]; Benjamini-Hochberg30 adjusted P ≤ .1). miRNA expression was analyzed by quantitative reverse-transcriptase polymerase chain reaction (qRT-PCR) using miRCURY or miScript (QIAGEN) and calculated using RNU6 and miR-103a-3p as a reference.31
pdx transduction
For overexpression, miR-497/195 was cloned in a lentiviral vector expressing mOrange2. Lentiviral particles produced by calcium-phosphate precipitation32 were used for pdx sample transduction.18 Sorted mOrange2-positive cells (BD FACSAria III, Becton Dickinson) were transplanted. mOrange2-positive cells were isolated from spleens and transplanted into secondary recipients. For miR-497/195 knockdown, pdx cells were transduced with miRZip anti-miRNA lentivectors (System Biosciences).
Gene expression profiling
RNA extracted (Quick-RNA Microprep kit, Zymo Research) from mOrange2-positive pdx cells was hybridized to Affymetrix GeneChip Human Gene 1.0 ST Arrays (Thermo Fisher Scientific). Differentially expressed genes were identified (Limma package, R; sva correction33; significance threshold, 0.05). Enrichment of significantly downregulated genes (adjusted P < .05) was analyzed with Enrichr.34
Leukemia cell culture
BCP-ALL lines NALM-6 and EU-3 (German Collection of Microorganisms and Cell Cultures [DSMZ]) were authenticated by short tandem repeat profiling and cultured in RPMI-1640 with 20% fetal calf serum, 1% L-glutamine, and 1% penicillin/streptomycin (Thermo Fisher Scientific). Cells were treated with 0.5 µM 5-aza-2-deoxycytidine (decitabine) (Sigma-Aldrich) or dimethyl sulfoxide (DMSO; Serva), and total RNA was extracted (TRIzol). Cells stained with CellTrace Violet Cell Proliferation Dye (Thermo Fisher Scientific) were exposed to palbociclib (Selleck Chemicals). pdx cells stained with 1 µM CellTrace Violet were cultured on OP9 cells (American Type Culture Collection [ATCC])35 and treated with palbociclib. Viability (forward scatter/side scatter), cell count, and CellTrace mean fluorescent intensity were measured (Attune NxT Flow Cytometer, Thermo Fisher Scientific). Cell cycle was assessed by staining with 4′,6-diamidino-2-phenylindole (DAPI), and Ki-67 mean fluorescent intensity was assessed with Alexa Fluor 647–conjugated anti-Ki-67 antibody (Becton Dickinson).
Statistical analyses
Statistical tests were performed with Prism 7 (GraphPad Software). Data can be accessed in the Gene Expression Omnibus (GEO) database (GSE141780). Additional methods are described in supplemental data, available on the Blood Web site.
Results
Poor-outcome leukemia is characterized by low expression of miR-497/195
Previously, we observed that short time to leukemia onset (TTLshort) in NOD/SCID mice transplanted with patient BCP-ALL cells is indicative of early relapse, whereas prolonged in vivo leukemia growth (TTLlong) predicts favorable patient outcome.20 In this study, we investigated small RNA expression profiles comparing leukemias with either TTLshort/poor outcome or TTLlong/favorable outcome phenotypes using small RNA-seq (N = 13 total leukemia samples: TTLshort, n = 6; TTLlong, n = 7; supplemental Table 1). As described for gene expression profiles, leukemia samples carrying specific chromosomal translocations and corresponding gene fusions are characterized by specific miRNA profiles,14 which might overshadow other differences in miRNA expression. Therefore, we focused our initial analysis on leukemia samples without recurrent gene fusions (KMT2A, BCR-ABL1, ETV6-RUNX1, TCF3-PBX1, TCF3-HLF, IGH2-CRLF2, and P2RY8-CRLF2) described in BCP-ALL.
We identified 13 significantly differentially expressed miRNAs, 2 upregulated and 11 downregulated in TTLshort/poor outcome leukemia (DESeq229; adjusted P < .1; Table 1; supplemental Figure 1A). For 5 miRNAs, we analyzed expression levels by qRT-PCR and confirmed the differential expression detected by small RNA-seq (supplemental Figure 1B). Of the 13 miRNAs identified, only 2 (miR-497 and miR-195) showed highest expression in TTLlong (normalized read count >1000) together with high logarithmic fold changes (LFCs < −2). They are the only 2 members of the miR-497/195 cluster expressed by the same precursor transcript sharing the same seed sequence that is responsible for target recognition.36 Interestingly, along with high expression of miR-497/195 in TTLlong/favorable-outcome ALL, tumor-suppressive functions have been described for miR-497/195 in other cancers.21-25 Therefore, we further studied miR-497/195 in ALL.
Comparison of TTLshort vs TTLlong ALL xenograft samples according to differentially expressed small RNAs
| Small RNA | LFC | Reads | Benjamini-Hochberg adjusted P | |
|---|---|---|---|---|
| TTLlong | TTLshort | |||
| hsa-miR-7974 | 2.2 | 68 | 330 | .07 |
| hsa-miR-29c-5p | 1.5 | 72 | 172 | .00 |
| hsa-miR-532-3p | −0.9 | 207 | 108 | .04 |
| hsa-miR-532-5p | −1.0 | 2643 | 1282 | .02 |
| hsa-miR-660-5p | −1.0 | 1868 | 875 | .07 |
| hsa-miR-188-5p | −1.2 | 138 | 63 | .05 |
| hsa-miR-502-3p | −1.5 | 136 | 51 | .00 |
| hsa-miR-501-5p | −2.3 | 47 | 12 | .01 |
| hsa-miR-195-5p | −2.4 | 2559 | 553 | .07 |
| hsa-miR-497-5p | −2.7 | 2294 | 389 | .08 |
| chr21_24250-3p | −3.2 | 114 | 3 | .07 |
| hsa-miR-371b-5p | −3.4 | 307 | 13 | .04 |
| hsa-miR-371a-5p | −5.4 | 59 | 0 | .00 |
Small RNA-seq, N = 13; total leukemia samples; TTLshort, n = 6; TTLlong, n = 7. Reads are mean of normalized read count from DESeq2 (a tool for differential gene expression analysis of RNA-seq data; see supplemental Figure 1A).
LFC, logarithmic (log2) fold change.
Low expression of miR-497/195 is associated with inferior patient outcome
In an extended cohort of 55 BCP-ALL pdx samples, including patients with recurrent genetic aberrations, miR-497 and miR-195 were significantly higher in TTLlong leukemias (Figure 1A). Intriguingly, samples from patients who had an early relapse within 2 years after diagnosis showed the lowest expression of both miRNAs (Figure 1B), and samples with high expression of the cluster showed a significantly longer time to leukemia onset upon xenotransplantation (Figure 1C).
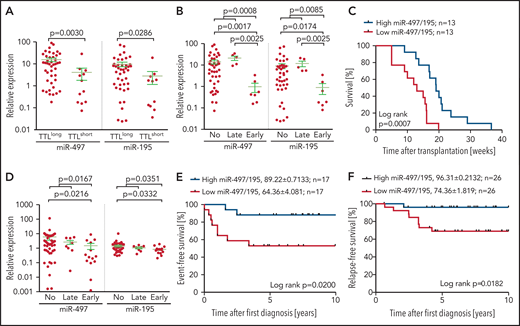
Expression of miR-497/195 in BCP-ALL xenograft and diagnostic samples. (A) Expression of miR-497/195 in an extended cohort of 55 pdx samples with TTLshort and TTLlong phenotypes assessed by qRT-PCR. Expression relative to healthy donor peripheral blood mononuclear cells compared between subgroups as indicated (Mann-Whitney U test, horizontal lines). (B) Expression of miR-497/195 in 55 pdx samples from patients who had early relapse, late relapse, or no relapse. (C) Time to leukemia onset (weeks) of NOD/SCID mice transplanted with patient cells, with high (upper quartile) or low (lower quartile) expression of miR-497/195 detected in the respective pdx samples. Expression of miR-497/195 is measured as log10 miR-497 + log10 miR-195 (log-rank test). (D) Expression of miR-497 and miR-195 in an independent cohort of 70 pediatric BCP-ALL diagnostic samples from patients with early, late, or no event (relapse or death in complete remission) assessed by TaqMan arrays.14 Expression relative to the mean of all the samples compared between subgroups as indicated (Mann-Whitney U test, horizontal lines). (E) Event-free survival of an independent cohort of patients with high (n = 17, upper quartile) or low (n = 17, lower quartile) expression of miR-497/195. Relapse and death in complete remission were included as “event” (log-rank test). (F) Relapse-free survival of 52 patients in an additional patient cohort, with high and low expression of miR-497/195 (above or below median). Expression of miR-497/195 is measured as log10 miR-497 + log10 miR-195 (log-rank test). Data are presented as mean ± standard error of the mean (SEM), in survival curves mean survival (%) ± SEM is indicated.
Expression of miR-497/195 in BCP-ALL xenograft and diagnostic samples. (A) Expression of miR-497/195 in an extended cohort of 55 pdx samples with TTLshort and TTLlong phenotypes assessed by qRT-PCR. Expression relative to healthy donor peripheral blood mononuclear cells compared between subgroups as indicated (Mann-Whitney U test, horizontal lines). (B) Expression of miR-497/195 in 55 pdx samples from patients who had early relapse, late relapse, or no relapse. (C) Time to leukemia onset (weeks) of NOD/SCID mice transplanted with patient cells, with high (upper quartile) or low (lower quartile) expression of miR-497/195 detected in the respective pdx samples. Expression of miR-497/195 is measured as log10 miR-497 + log10 miR-195 (log-rank test). (D) Expression of miR-497 and miR-195 in an independent cohort of 70 pediatric BCP-ALL diagnostic samples from patients with early, late, or no event (relapse or death in complete remission) assessed by TaqMan arrays.14 Expression relative to the mean of all the samples compared between subgroups as indicated (Mann-Whitney U test, horizontal lines). (E) Event-free survival of an independent cohort of patients with high (n = 17, upper quartile) or low (n = 17, lower quartile) expression of miR-497/195. Relapse and death in complete remission were included as “event” (log-rank test). (F) Relapse-free survival of 52 patients in an additional patient cohort, with high and low expression of miR-497/195 (above or below median). Expression of miR-497/195 is measured as log10 miR-497 + log10 miR-195 (log-rank test). Data are presented as mean ± standard error of the mean (SEM), in survival curves mean survival (%) ± SEM is indicated.
To further corroborate our finding, we investigated an independent cohort of 70 diagnostic BCP-ALL samples.14 In line with our previous findings, the lowest expression of both miRNAs was found in samples of patients who showed an early event (relapse or death) and significantly inferior survival (Figure 1D-E). Interestingly, in both cohorts, high expression of miR-497/195 was found in samples with ETV6-RUNX1 gene fusions or hyperdiploidy (supplemental Figure 2), 2 features associated with favorable outcome in BCP-ALL.37 Analyzing cluster expression in another diagnostic patient cohort (N = 52) with available information on the recently described risk factor IKZF1plus,38 low levels of miR-497/195 were associated with significantly reduced survival (Figure 1F). Moreover, low expression of miR-497/195 was identified as an independent adverse prognostic factor from the established risk factors of IKZF1plus, hyperleukocytosis, and older age (Table 2). Patients’ initial response to therapy (minimal residual disease levels) and sensitivity to in vivo modeled induction therapy was not associated with miR-497/195 expression, and low expression of miR-497/195 was not enriched at relapse (supplemental Figure 3).
Prognostic relevance of low expression of miR-497/195
| χ2P | HR (relapse) | 95% CI | |
|---|---|---|---|
| Expression of miR-497/195 below median | .002 | 12.4 | 2.5-62.3 |
| Age 10 years or older at diagnosis | .21 | 0.211 | 0.018-2.423 |
| WBC 50 g/L or higher | .21 | 3.103 | 0.520-18.520 |
| IKZF1plus | .64 | 2.031 | 0.106-38.906 |
| χ2P | HR (relapse) | 95% CI | |
|---|---|---|---|
| Expression of miR-497/195 below median | .002 | 12.4 | 2.5-62.3 |
| Age 10 years or older at diagnosis | .21 | 0.211 | 0.018-2.423 |
| WBC 50 g/L or higher | .21 | 3.103 | 0.520-18.520 |
| IKZF1plus | .64 | 2.031 | 0.106-38.906 |
Multivariate analysis on incidence of relapse with a Fine and Gray model (N = 52) was performed. Risk factors included are miR-497/195 expression below median (log10 miR-497 + log10 miR-195 < –0.5), age at diagnosis 10 years or older, white blood cell count (WBC) in peripheral blood at diagnosis 50 g/L or higher, IKZF1plus (deletion of IKZF1 co-occurring with deletions in CDKN2A, CDKN2B, PAX5, or PAR1 in the absence of ERG deletion38).
CI, confidence interval; HR, hazard ratio.
Expression of miR-497/195 is suppressed by promoter methylation
Expression of the miR-497/195 cluster was described as being regulated by methylation of an upstream CpG island in other cancers.21,39 To gain insight into the mechanisms of this process, we performed methylation analyses in our sample cohort. Consistent with reported findings, methylation of the described region was predominantly found in TTLshort leukemias with low expression of miR-497/195 (Figure 2A, α region). In addition, a similar methylation pattern was identified in an adjacent region that had not been previously described (Figure 2A, β region). Samples methylated in at least 1 region showed lower expression of miR-497/195 than nonmethylated samples (Figure 2B), and leukemias with methylation in both regions showed the lowest expression of miR-497/195 (Figure 2C), indicating that methylation of both regions contributes to regulation of miR-497/195. Exposure of ALL cell lines NALM-6 and EU-3 to the demethylating agent decitabine reduced miR-497/195 promoter methylation, which resulted in increased expression of miR-497/195 and reduced cell viability (Figure 2D-I), confirming that expression of the miR-497/195 cluster is epigenetically suppressed in TTLshort/early-relapse ALL.
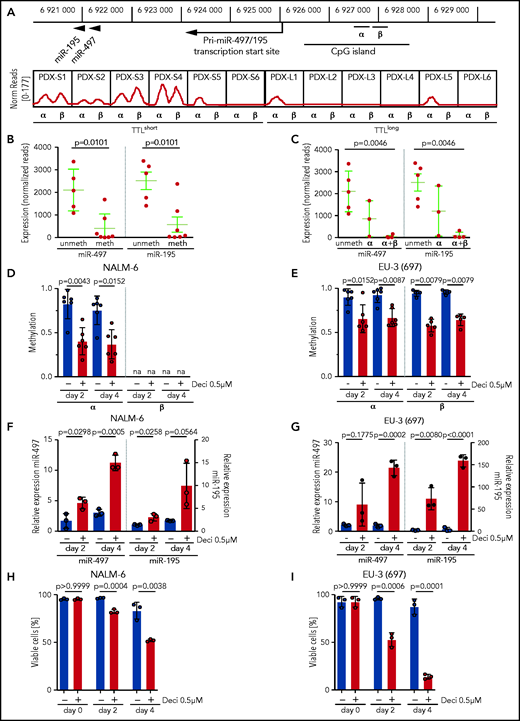
miR-497/195 regulation by promoter methylation in BCP-ALL. (A) Locus of miR-497/195, with the upstream CpG island and methylated region α (chr17: 6 926 487-6 926 780) and β (chr17: 6 926 900-6 927 200, identified in this study). In the lower panel, methylation status for the xenograft samples is shown as normalized (Norm) read count. (B) Expression of miR-497 and miR-195 in pdx samples methylated (meth) or nonmethylated (unmeth) in the promoter region. (C) Expression of miR-497 and miR-195 in pdx samples methylated in region α, region α and β (α+β), or nonmethylated. (D-E) Methylation level of regions α and β upon treatment with decitabine (Deci) 0.5 µM or dimethyl sulfoxide (DMSO) in cell lines (D) NALM-6 and (E) EU-3 (697), as assessed by MassARRAY. Individual data points represent the average of biological replicates for each amplicon belonging to the indicated region. na = not available. (F-G) Expression of miR-497 and miR-195 in cell lines (F) NALM-6 and (G) EU-3 (697) after 2 or 4 days of treatment with decitabine 0.5 µM; expression relative to untreated cells. (H-I) Percentage of viable cells in (H) NALM-6 and (I) EU-3 (697) treated with decitabine 0.5 µM or DMSO. Data are presented as mean ± SD compared between groups (Mann-Whitney U test, horizontal lines).
miR-497/195 regulation by promoter methylation in BCP-ALL. (A) Locus of miR-497/195, with the upstream CpG island and methylated region α (chr17: 6 926 487-6 926 780) and β (chr17: 6 926 900-6 927 200, identified in this study). In the lower panel, methylation status for the xenograft samples is shown as normalized (Norm) read count. (B) Expression of miR-497 and miR-195 in pdx samples methylated (meth) or nonmethylated (unmeth) in the promoter region. (C) Expression of miR-497 and miR-195 in pdx samples methylated in region α, region α and β (α+β), or nonmethylated. (D-E) Methylation level of regions α and β upon treatment with decitabine (Deci) 0.5 µM or dimethyl sulfoxide (DMSO) in cell lines (D) NALM-6 and (E) EU-3 (697), as assessed by MassARRAY. Individual data points represent the average of biological replicates for each amplicon belonging to the indicated region. na = not available. (F-G) Expression of miR-497 and miR-195 in cell lines (F) NALM-6 and (G) EU-3 (697) after 2 or 4 days of treatment with decitabine 0.5 µM; expression relative to untreated cells. (H-I) Percentage of viable cells in (H) NALM-6 and (I) EU-3 (697) treated with decitabine 0.5 µM or DMSO. Data are presented as mean ± SD compared between groups (Mann-Whitney U test, horizontal lines).
To analyze alternative mechanisms that regulate the expression of miR-497/195, we investigated copy number alterations that occur recurrently in ALL but did not find any association. Expression of miR-497/195 was higher or lower in samples with gain or deletion of chromosome 17p, the region including the cluster locus. However, patients with diploid chromosome 17p showed a large variation in miR-497/195 expression, indicating that numeral changes of the chromosomal arm alone do not determine miR-497/195 expression (supplemental Figure 4).
In vivo leukemia growth is regulated by miR-497/195 expression
Given the association of miR-497/195 expression with outcome and survival, we further addressed the impact of miR-497/195 on in vivo leukemia growth. miR-497/195 was experimentally overexpressed in 3 pdx ALL samples with low basal expression of miR-497/195 by lentiviral transduction. We transplanted miR-497/195 overexpressing and control cells (PDX-S2) in equal numbers (105 cells per mouse). After 10 weeks, recipients were euthanized, and leukemia loads of transduced cells were analyzed in spleen and bone marrow (Figure 3A). Strikingly, reduced leukemia loads with almost no engraftment of miR-497/195 overexpressing cells were observed in contrast to high tumor loads of control transduced cells (Figure 3B-C). Next, mOrange2-positive cells sorted from spleens of euthanized animals were transplanted into subsequent recipients (2 × 10⁴ cells per mouse; Figure 3A), who showed clearly delayed onset of leukemia (Figure 3D). miR-497/195 overexpression was confirmed before and after transplantation (supplemental Figure 5A-C). Two additional pdx samples were transduced, sorted, and transplanted. Upon transplantation into either primary (sample PDX-S7, 1.8 × 10⁵ cells per mouse; Figure 3E-F; supplemental Figure 5D) or secondary (sample PDX-L8, 5 × 10⁵ cells per mouse; Figure 3G-H; supplemental Figure 5E) recipients, a delayed engraftment of miR-497/195 overexpressing ALL cells and prolonged recipient survival was observed compared with control transduced cells in both experiments. In all animals, high leukemia infiltration in bone marrow and spleen was confirmed when the animals were euthanized at the onset of leukemia-related morbidity.
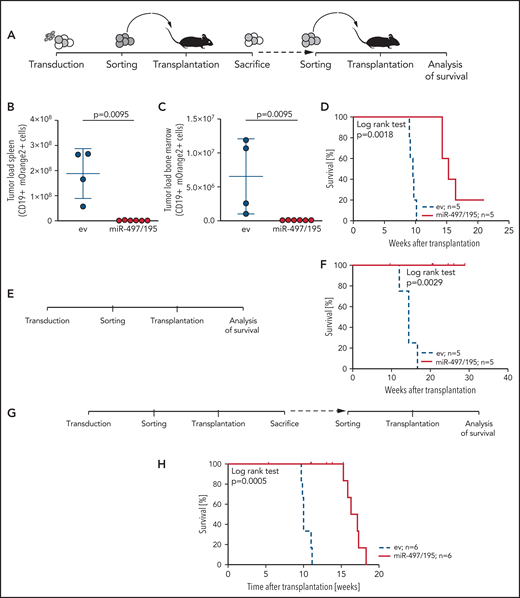
miR-497/195 overexpression impairs leukemia engraftment. (A) Experimental layout of in vivo experiment with transduced BCP-ALL cells from the PDX-S2 sample. (B-C) Leukemia loads of human CD19 (huCD19) and mOrange2-positive cells isolated in spleen and bone marrow of euthanized mice 10 weeks after transplantation of 105 cells per recipient. Results are pooled from 2 independent experiments. Comparison of empty vector (ev) control and miR-497/195 overexpression (Mann-Whitney U test, horizontal lines). (D) Kaplan-Meier curve for mice transplanted with 2 × 10⁴ mOrange2-positive cells isolated from mice in panel B (log-rank test). (E-F) Experimental layout and Kaplan-Meier curve for mice transplanted with 1.8 × 10⁵ transduced cells of PDX-S7 (log-rank test). (G-H) Experimental layout and Kaplan-Meier curve for mice transplanted with 5 × 10⁵ transduced cells of PDX-L8 (log-rank test). In all experiments the same cell number was transplanted in empty vector (ev) control and miR-497/195 groups. Data are presented as mean ± SD.
miR-497/195 overexpression impairs leukemia engraftment. (A) Experimental layout of in vivo experiment with transduced BCP-ALL cells from the PDX-S2 sample. (B-C) Leukemia loads of human CD19 (huCD19) and mOrange2-positive cells isolated in spleen and bone marrow of euthanized mice 10 weeks after transplantation of 105 cells per recipient. Results are pooled from 2 independent experiments. Comparison of empty vector (ev) control and miR-497/195 overexpression (Mann-Whitney U test, horizontal lines). (D) Kaplan-Meier curve for mice transplanted with 2 × 10⁴ mOrange2-positive cells isolated from mice in panel B (log-rank test). (E-F) Experimental layout and Kaplan-Meier curve for mice transplanted with 1.8 × 10⁵ transduced cells of PDX-S7 (log-rank test). (G-H) Experimental layout and Kaplan-Meier curve for mice transplanted with 5 × 10⁵ transduced cells of PDX-L8 (log-rank test). In all experiments the same cell number was transplanted in empty vector (ev) control and miR-497/195 groups. Data are presented as mean ± SD.
Thus, expression of miR-497/195 controls leukemia expansion in vivo, further confirming a tumor-suppressive function of this miRNA cluster in BCP-ALL. In agreement with this data, pdx leukemias characterized by low expression of miR-497/195 show higher frequencies of leukemia-initiating cells40 (supplemental Table 2).
The miR-497/195 cluster controls the regulation of the cell cycle
To understand the mechanism by which miR-497/195 controls leukemia growth, we analyzed potential targets of the miRNA cluster. Integrating miRNA profiles (small RNA-seq) and gene expression (microarray) data from our initial sample cohort,20 we identified putative target genes (TargetScan v7.0)41 that show an inverse correlation between transcript and miRNA expression profiles (negative regulation of target gene expression by the respective miRNA; Spearman r < −0.6). In accordance with co-regulated expression of the 2 miRNAs in the cluster, several predicted target genes were common to both miR-497 and miR-195 (supplemental Figure 6). Interestingly, functional enrichment analysis of identified putative targets revealed cellular proliferation as the most significantly associated biological process (Gene Ontology Biological Processes; supplemental Table 3). By addressing downstream effects of high expression of miR-497/195, we were able to analyze gene expression profiles in pdx leukemia cells with miR-497/195 overexpression showing delayed in vivo leukemia growth compared with control transduced cells (PDX-S2; Figure 3D). We identified 914 differentially expressed genes (empirical Bayes-moderated t statistics, Limma package; adjusted P < .05; Figure 4A; supplemental Figure 7; supplemental Table 4). Interestingly, among the downregulated genes, 2 were found that code for important cell cycle regulators that have also been described as validated targets of the miR-497/195 cluster: CDK4 coding for cyclin-dependent kinase 4 and CCND3 coding for its regulatory subunit cyclin D3.42,43 Upon overexpression of miR-497/195 in pdx ALL, lower expression of CDK4 and CCND3 was confirmed by qRT-PCR (Figure 4B-C). Conversely, increased levels of CDK4 and CCND3 messenger RNAs were found upon miR-195 knockdown (NALM-6; Figure 4D) and upon blocking miR-497/195 target sites of CDK4 and CCND3 transcripts (transfection of target site blockers; NALM-6; supplemental Figure 8). Moreover, significantly lower expression levels of CDK4 were found in pdx leukemias with high expression of miR-497/195 (N = 55; Figure 4E), and in another cohort of diagnostic samples from BCP-ALL patients (N = 52; Figure 4F). In addition, we found an enrichment of genes downregulated upon miR-497/195 overexpression with cell cycle annotated genes (Enrichr, Reactome_2016 pathways; adjusted P < .05; Gene Set Enrichment Analysis, Kyoto Encyclopedia of Genes and Genomes [KEGG] pathways) (supplemental Table 5; supplemental Figure 9), further indicating that the miR-497/195 cluster contributes to negative regulation of cellular cycling and proliferation in ALL, thereby mediating its tumor-suppressive function.
![miR-497/195 overexpression inhibits CDK4- and CCND3-mediated leukemia growth ex vivo. (A) Heatmap of 914 differentially expressed genes upon miR-497/195 overexpression in PDX-S2 (adjusted P < .05). (B) Downregulation of CCND3 and CDK4 messenger RNA (mRNA) levels in PDX-S2 and (C) in PDX-L8 cells upon miR-497/195 overexpression assessed by qRT-PCR (data are mean ± SD; Mann-Whitney U test). (D) CDK4 and CCND3 mRNA fold change in NALM-6 cells upon transduction with anti-miR-497 or anti-miR-195 miRZip constructs compared with scramble (scr) control vector, assessed by qRT-PCR (data are mean of triplicates ± SD; Student t test). (E-F) CCND3 and CDK4 mRNA levels in (E) xenograft samples (PXD) or (F) diagnostic samples from patients (PTS) with miR-497/195 expression above median (high) and below median (low) measured by qRT-PCR (data are mean ± SD; Mann-Whitney U test). (G) Downregulation at protein level of CDK4, CCND3, and RB1 phosphorylation on Ser708 upon miR-497/195 overexpression on PDX-S2 cells assessed by western blot. Loading control was β-actin. (H) Higher percentage of G1 cells (4′,6-diamidino-2-phenylindole [DAPI] staining), (I) lower cell count, (J) lower proliferation rate (lower decay in CellTrace Violet mean fluorescent intensity (MFI) relative to day 1 after staining and seeding) of miR-497/195 overexpressing PDX-S2 cells compared with empty vector (ev) control transduced cells cultured ex vivo on OP-9 feeder cells (data are mean ± SD of biological replicates: ev, n = 4-5; miR-497/195, n = 3; unpaired Student t-test. (I-J) Two-way analysis of variance (ANOVA). (K) Lower Ki-67 expression (MFI), (L) cell count, and (M) proliferation rate of miR-497/195 overexpressing PDX-L8 cells compared with ev control cultured ex vivo on OP-9 feeder cells (data are mean ± SD of biological replicates; ev, n = 6; miR-497/195, n = 6; two-way ANOVA). (N) Count of PDX-S2 green fluorescent protein-positive (GFP+) cells after transduction with anti-miR-497 or anti-miR-195 miRZip constructs or scr control cultured ex vivo on OP9 cells (data are mean of triplicates ± SD; two-way ANOVA). (O) Cell growth of PDX-L8 cells overexpressing control vector or miR-497/195 treated with palbociclib 0.1 or 1 µM cultured on OP9 cells. Growth was measured as count of palbociclib-treated cells relative to count of control cells at day 6 (data are mean ± SD; Student t test). (P) Cell growth of PDX-S6 cells transduced with miRZip or scr control construct and treated with palbociclib 0.1 or 1 µM cultured on OP9 cells. Treatment was started 4 days after transduction. Growth was measured as count of palbociclib-treated cells relative to count of control cells at day 7 of treatment (data are mean of triplicates ± SD; Student t test). ns, not significant.](https://ash.silverchair-cdn.com/ash/content_public/journal/blood/138/20/10.1182_blood.2020007591/7/m_bloodbld2020007591f4.png?Expires=1765893617&Signature=dN2yU7lmQEQWxAe2gWNEFmDJhvkt4E1R34EaozImNu2GVMTP4MLHFFy~~yXt-hKtz-MvcYQSVAdTSm4z6BW4mzKa9S3eccDwVIhTq6tuJ2LLO0k6JexNvoezqmxZs9wACjwat60XuDbfhebrkQzggO2Ac~KN-HAHRgyeIqdglI5Ds04soxNUIawLBYF2qpHjWeU4mjLQCNACoNN0MWG4YH~iM41TqLnP~6Fnp0kIRAqcdLlNLgphJ1Z6wt1VwS3IEmf2psnqjo1WasxD0GY6n~fEMU6pdSGvq8nF6uRQzrMnSkkKO13O-iIbx1rbLHepTuuCv26oUFgWshBKxQIA5w__&Key-Pair-Id=APKAIE5G5CRDK6RD3PGA)
miR-497/195 overexpression inhibits CDK4- and CCND3-mediated leukemia growth ex vivo. (A) Heatmap of 914 differentially expressed genes upon miR-497/195 overexpression in PDX-S2 (adjusted P < .05). (B) Downregulation of CCND3 and CDK4 messenger RNA (mRNA) levels in PDX-S2 and (C) in PDX-L8 cells upon miR-497/195 overexpression assessed by qRT-PCR (data are mean ± SD; Mann-Whitney U test). (D) CDK4 and CCND3 mRNA fold change in NALM-6 cells upon transduction with anti-miR-497 or anti-miR-195 miRZip constructs compared with scramble (scr) control vector, assessed by qRT-PCR (data are mean of triplicates ± SD; Student t test). (E-F) CCND3 and CDK4 mRNA levels in (E) xenograft samples (PXD) or (F) diagnostic samples from patients (PTS) with miR-497/195 expression above median (high) and below median (low) measured by qRT-PCR (data are mean ± SD; Mann-Whitney U test). (G) Downregulation at protein level of CDK4, CCND3, and RB1 phosphorylation on Ser708 upon miR-497/195 overexpression on PDX-S2 cells assessed by western blot. Loading control was β-actin. (H) Higher percentage of G1 cells (4′,6-diamidino-2-phenylindole [DAPI] staining), (I) lower cell count, (J) lower proliferation rate (lower decay in CellTrace Violet mean fluorescent intensity (MFI) relative to day 1 after staining and seeding) of miR-497/195 overexpressing PDX-S2 cells compared with empty vector (ev) control transduced cells cultured ex vivo on OP-9 feeder cells (data are mean ± SD of biological replicates: ev, n = 4-5; miR-497/195, n = 3; unpaired Student t-test. (I-J) Two-way analysis of variance (ANOVA). (K) Lower Ki-67 expression (MFI), (L) cell count, and (M) proliferation rate of miR-497/195 overexpressing PDX-L8 cells compared with ev control cultured ex vivo on OP-9 feeder cells (data are mean ± SD of biological replicates; ev, n = 6; miR-497/195, n = 6; two-way ANOVA). (N) Count of PDX-S2 green fluorescent protein-positive (GFP+) cells after transduction with anti-miR-497 or anti-miR-195 miRZip constructs or scr control cultured ex vivo on OP9 cells (data are mean of triplicates ± SD; two-way ANOVA). (O) Cell growth of PDX-L8 cells overexpressing control vector or miR-497/195 treated with palbociclib 0.1 or 1 µM cultured on OP9 cells. Growth was measured as count of palbociclib-treated cells relative to count of control cells at day 6 (data are mean ± SD; Student t test). (P) Cell growth of PDX-S6 cells transduced with miRZip or scr control construct and treated with palbociclib 0.1 or 1 µM cultured on OP9 cells. Treatment was started 4 days after transduction. Growth was measured as count of palbociclib-treated cells relative to count of control cells at day 7 of treatment (data are mean of triplicates ± SD; Student t test). ns, not significant.
miR-497/195 overexpression inhibits CDK4- and CCND3-mediated leukemia growth ex vivo. (A) Heatmap of 914 differentially expressed genes upon miR-497/195 overexpression in PDX-S2 (adjusted P < .05). (B) Downregulation of CCND3 and CDK4 messenger RNA (mRNA) levels in PDX-S2 and (C) in PDX-L8 cells upon miR-497/195 overexpression assessed by qRT-PCR (data are mean ± SD; Mann-Whitney U test). (D) CDK4 and CCND3 mRNA fold change in NALM-6 cells upon transduction with anti-miR-497 or anti-miR-195 miRZip constructs compared with scramble (scr) control vector, assessed by qRT-PCR (data are mean of triplicates ± SD; Student t test). (E-F) CCND3 and CDK4 mRNA levels in (E) xenograft samples (PXD) or (F) diagnostic samples from patients (PTS) with miR-497/195 expression above median (high) and below median (low) measured by qRT-PCR (data are mean ± SD; Mann-Whitney U test). (G) Downregulation at protein level of CDK4, CCND3, and RB1 phosphorylation on Ser708 upon miR-497/195 overexpression on PDX-S2 cells assessed by western blot. Loading control was β-actin. (H) Higher percentage of G1 cells (4′,6-diamidino-2-phenylindole [DAPI] staining), (I) lower cell count, (J) lower proliferation rate (lower decay in CellTrace Violet mean fluorescent intensity (MFI) relative to day 1 after staining and seeding) of miR-497/195 overexpressing PDX-S2 cells compared with empty vector (ev) control transduced cells cultured ex vivo on OP-9 feeder cells (data are mean ± SD of biological replicates: ev, n = 4-5; miR-497/195, n = 3; unpaired Student t-test. (I-J) Two-way analysis of variance (ANOVA). (K) Lower Ki-67 expression (MFI), (L) cell count, and (M) proliferation rate of miR-497/195 overexpressing PDX-L8 cells compared with ev control cultured ex vivo on OP-9 feeder cells (data are mean ± SD of biological replicates; ev, n = 6; miR-497/195, n = 6; two-way ANOVA). (N) Count of PDX-S2 green fluorescent protein-positive (GFP+) cells after transduction with anti-miR-497 or anti-miR-195 miRZip constructs or scr control cultured ex vivo on OP9 cells (data are mean of triplicates ± SD; two-way ANOVA). (O) Cell growth of PDX-L8 cells overexpressing control vector or miR-497/195 treated with palbociclib 0.1 or 1 µM cultured on OP9 cells. Growth was measured as count of palbociclib-treated cells relative to count of control cells at day 6 (data are mean ± SD; Student t test). (P) Cell growth of PDX-S6 cells transduced with miRZip or scr control construct and treated with palbociclib 0.1 or 1 µM cultured on OP9 cells. Treatment was started 4 days after transduction. Growth was measured as count of palbociclib-treated cells relative to count of control cells at day 7 of treatment (data are mean of triplicates ± SD; Student t test). ns, not significant.
CDK4 and its subunit CCND3 form a complex that phosphorylates retinoblastoma 1 (RB1), thereby inactivating repression of E2F transcription factors and leading to cell cycle promotion. Upon miR-497/195 overexpression in ALL cells, we found downregulation of both miR-497/195 targets CDK4 and CCND3 on a protein level and, in line with their function, reduced phosphorylation of RB1 (Figure 4G). We also found that genes significantly downregulated upon miR-497/195 overexpression were enriched in genes annotated as E2F transcription factor family targets (supplemental Table 6). In cell cycle analysis, miR-497/195 overexpressing pdx ALL cells showed a higher proportion of cells in G1 phase compared with control (Figure 4H), further indicating that suppression of CDK4-CCND3 by high expression of miR-497/195 results in decreased G1/S transition and cellular cycling. Accordingly, we found significantly decreased cellular proliferation of pdx ALL cells upon miR-497/195 overexpression (Figure 4I-M) and increased leukemia growth upon miR-497/195 knockdown (miRZip; Figure 4N). Moreover, blocking the binding of miR-497/195 to CDK4 and CCND3 target sites in NALM-6 cells resulted in increased cellular growth, along with higher expression of CDK4 and CCND3 (supplemental Figure 8).
On the basis of these findings, we evaluated the activity of the CDK4-CDK6 inhibitor palbociclib in ALL upon miR-497/195 knockdown, with high expression of CDK4 and CCND3 and increased cellular proliferation compared with ALL with miR-497/195 overexpression, low expression of CDK4 and CCND3, and reduced cell growth. Palbociclib-induced inhibition of cell growth was significantly reduced upon miR-497/195 overexpression compared with stronger growth inhibition in control transduced cells (Figure 4O). Conversely, miR-497/195 knockdown led to significantly stronger palbociclib-induced growth reduction than in control transduced cells (Figure 4P), pointing to a potential therapeutic approach for these leukemias. However, palbociclib showed ex vivo activity in pdx samples without significant differences between high and low constitutive expression of miR-497/195, probably as a result of limited ex vivo growth of primary pdx cells (supplemental Figure 10).
Taken together, these findings show that ALL with low expression of miR-497/195 is characterized by high levels of the cell cycle regulators CDK4 and CCND3 and by increased G1/S transition, cellular cycling, proliferation, and in vivo leukemia growth.
Loss of tumor-suppressive miR-497/195 expression cooperates with deletions of CDKN2A/B
We identified a tumor-suppressive function of miR-497/195 acting through repression of the important cell cycle regulator CDK4. Interestingly, the genes coding for the cyclin-dependent kinase inhibitors 2A and 2B (CDKN2A and CDKN2B) that are 2 major negative regulators of CDK4 are deleted in many cancers and loss of CDKN2A/B is a frequent event in BCP-ALL.44,45
Given that both miR-497/195 and CDKN2A/B exert their inhibitory functions on the same target molecule CDK4 and pathway, we hypothesized that low expression or loss of both regulators are cooperating events that lead to increased growth of leukemia and inferior outcome. Leukemias with both low expression of miR-497/195 and homozygous CDKN2A/B deletions displayed shorter engraftment times compared with those in other samples (Figure 5A). Accordingly, a significantly shorter leukemia-free survival was seen if both events were present compared with patients without co-occurring low expression of miR-497/195 and deletion of CDKN2A/B (Figure 5B). To further address this association of combined loss of miR-497/195 and CDKN2A/B with outcome, we analyzed expression levels of miR-497/195 in a cohort of leukemia samples derived from BCP-ALL patients at diagnosis with or without CDKN2A/B deletions (N = 52 patients with homozygous deletion of CDKN2A and CDKN2B matched to patients with a full sequence according to age, minimal residual disease risk, and leukocyte count). Deletions of CDKN2A/B are frequent events in ALL, but no consistent association with outcome and prognosis in BCP-ALL has been reported.46 In this cohort, survival of patients with deletions of CDKN2A/B was not significantly lower (supplemental Figure 11). Importantly, patients with concomitant loss of both regulators showed a significant inferior survival (Figure 5C), in line with cooperative activity of a lost tumor-suppressive function by low expression of miR-497/195 together with deleted CDKN2A/B resulting in poor patient outcome. We also considered the different subgroups separately: leukemias with co-occurring events (ie, low expression of miR-497/195 and deletion of homozygous CDKN2A/B), samples with either low expression of miR-497/195 or deletion of CDKN2A/B, and leukemias without both events. Most importantly, complete relapse-free survival was observed for patients with high expression of miR-497/195 and no deletions of CDKN2A/B, further emphasizing the importance of both negative cell cycle regulators (ie, expression of tumor-suppressive miR-497/195 and CDKN2A/B). Accordingly, patients with either one of the events showed an intermediate survival (Figure 5D, others).
![Co-occurring low expression of miR-497/195 and deletion of CDKN2A and CDKN2B are associated with inferior patient outcome. (A) TTL (weeks) for NOD/SCID mice transplanted with patient samples, grouped according to miR-497/195 expression and CDKN2A and CDKN2B deletion. Low miR-497/195, CDKN2A/B del: expression of miR-497/195 (log10 miR-497 + log10 miR-195) was below median; homozygous deletion of both CDKN2A and CDKN2B. Others includes samples with expression of miR-497/195 above median and/or heterozygous deletion or full sequence of CDKN2A, CDKN2B, or both. (B) Relapse-free survival (months) of patients who relapsed in the pdx cohort, grouped according to expression of miR-497/195 and deletion of CDKN2A and CDKN2B in the respective pdx samples (panel A). (C) Relapse-free survival (years) for patients from an independent cohort of diagnostic BCP-ALL samples, grouped according to expression of miR-497/195 and deletion of CDKN2A and CDKN2B. Low miR-497/195, CDKN2A/B del: expression of miR-497/195 was below median; homozygous deletion of both CDKN2A and CDKN2B. Others includes samples with expression of miR-497/195 above median and/or full sequence of CDKN2A and CDKN2B. (D) Relapse-free survival (years) of patients in panel C. Low miR-497/195, CDKN2A/B del: expression of miR-497/195 was below median; homozygous deletion of both CDKN2A and CDKN2B. High miR-497/195, CDKN2A/B non-del: expression of miR-497/195 was above median; full sequence of both CDKN2A and CDKN2B. Others are samples with high expression of miR-497/195 and deletion of CDKN2A and CDKN2B or low expression of miR-497/195 and full sequence of CDKN2A and CDKN2B. Mean survival [%] ± SEM is indicated. Log-rank test was used for data analysis. (E) Proposed mechanism of enhanced leukemia growth upon co-occurring low expression of miR-497/195 and deletion of CDKN2A and CDKN2B.](https://ash.silverchair-cdn.com/ash/content_public/journal/blood/138/20/10.1182_blood.2020007591/7/m_bloodbld2020007591f5.png?Expires=1765893617&Signature=bPochrSAZAwQNiN5JMHrToB0huHmuwYzK45RwDtbO6sV5D3M1ZZ55zmQ0uPiTMj50uZDj897FNFzp8pnjCV3mtQATfLjXjeR7Hk8-D~KvU2fero7BkPUekucbFu5nOi-ONo0-pYKLdnSSpJoqvNGLPQt3Jy31sxo3AfDt8Rb6-wtU4c8ng2LY1TA-iWcMpX77jqXW0VPHe0yxlZ4FkAxAWSCHWU~HX5awvvM43at0jsn8d~6LyZd2y5XjIv7eKr2gqYJflKksyd9EPc8U0ft4sjf5AH8kWOU8G9vn2P9wCm-722HN0zd9EgAaiugWT4cdJvMvnIP8syfezwb0VAnLQ__&Key-Pair-Id=APKAIE5G5CRDK6RD3PGA)
Co-occurring low expression of miR-497/195 and deletion of CDKN2A and CDKN2B are associated with inferior patient outcome. (A) TTL (weeks) for NOD/SCID mice transplanted with patient samples, grouped according to miR-497/195 expression and CDKN2A and CDKN2B deletion. Low miR-497/195, CDKN2A/B del: expression of miR-497/195 (log10 miR-497 + log10 miR-195) was below median; homozygous deletion of both CDKN2A and CDKN2B. Others includes samples with expression of miR-497/195 above median and/or heterozygous deletion or full sequence of CDKN2A, CDKN2B, or both. (B) Relapse-free survival (months) of patients who relapsed in the pdx cohort, grouped according to expression of miR-497/195 and deletion of CDKN2A and CDKN2B in the respective pdx samples (panel A). (C) Relapse-free survival (years) for patients from an independent cohort of diagnostic BCP-ALL samples, grouped according to expression of miR-497/195 and deletion of CDKN2A and CDKN2B. Low miR-497/195, CDKN2A/B del: expression of miR-497/195 was below median; homozygous deletion of both CDKN2A and CDKN2B. Others includes samples with expression of miR-497/195 above median and/or full sequence of CDKN2A and CDKN2B. (D) Relapse-free survival (years) of patients in panel C. Low miR-497/195, CDKN2A/B del: expression of miR-497/195 was below median; homozygous deletion of both CDKN2A and CDKN2B. High miR-497/195, CDKN2A/B non-del: expression of miR-497/195 was above median; full sequence of both CDKN2A and CDKN2B. Others are samples with high expression of miR-497/195 and deletion of CDKN2A and CDKN2B or low expression of miR-497/195 and full sequence of CDKN2A and CDKN2B. Mean survival [%] ± SEM is indicated. Log-rank test was used for data analysis. (E) Proposed mechanism of enhanced leukemia growth upon co-occurring low expression of miR-497/195 and deletion of CDKN2A and CDKN2B.
Co-occurring low expression of miR-497/195 and deletion of CDKN2A and CDKN2B are associated with inferior patient outcome. (A) TTL (weeks) for NOD/SCID mice transplanted with patient samples, grouped according to miR-497/195 expression and CDKN2A and CDKN2B deletion. Low miR-497/195, CDKN2A/B del: expression of miR-497/195 (log10 miR-497 + log10 miR-195) was below median; homozygous deletion of both CDKN2A and CDKN2B. Others includes samples with expression of miR-497/195 above median and/or heterozygous deletion or full sequence of CDKN2A, CDKN2B, or both. (B) Relapse-free survival (months) of patients who relapsed in the pdx cohort, grouped according to expression of miR-497/195 and deletion of CDKN2A and CDKN2B in the respective pdx samples (panel A). (C) Relapse-free survival (years) for patients from an independent cohort of diagnostic BCP-ALL samples, grouped according to expression of miR-497/195 and deletion of CDKN2A and CDKN2B. Low miR-497/195, CDKN2A/B del: expression of miR-497/195 was below median; homozygous deletion of both CDKN2A and CDKN2B. Others includes samples with expression of miR-497/195 above median and/or full sequence of CDKN2A and CDKN2B. (D) Relapse-free survival (years) of patients in panel C. Low miR-497/195, CDKN2A/B del: expression of miR-497/195 was below median; homozygous deletion of both CDKN2A and CDKN2B. High miR-497/195, CDKN2A/B non-del: expression of miR-497/195 was above median; full sequence of both CDKN2A and CDKN2B. Others are samples with high expression of miR-497/195 and deletion of CDKN2A and CDKN2B or low expression of miR-497/195 and full sequence of CDKN2A and CDKN2B. Mean survival [%] ± SEM is indicated. Log-rank test was used for data analysis. (E) Proposed mechanism of enhanced leukemia growth upon co-occurring low expression of miR-497/195 and deletion of CDKN2A and CDKN2B.
Taken together, we identified low expression of miR-497/195 as a characteristic feature of ALL associated with short NOD/SCID engraftment, early relapse, and poor outcome. miR-497/195 overexpression in primary pdx ALL cells significantly delayed leukemia engraftment and prolonged leukemia-free survival of recipient animals, confirming the tumor-suppressive function of miR-497/195 in BCP-ALL. Mechanistically, miR-497/195 was regulated by methylation of the promoter region. High expression of miR-497/195 led to reduced expression of the cell cycle promoters CDK4 and CCND3 and activation of the transcriptional repressor RB1, which ultimately resulted in reduced cellular cycling, proliferation and leukemia growth, whereas inhibition of miR-497/195 led to increased expression of CDK4 and CCND3 and greater proliferation of leukemia cells. Importantly, we identified a cooperative activity of lost miR-497/195–mediated cell cycle control together with deletion and lost expression of the important cell cycle repressors CDKN2A and CDKN2B (Figure 5E). The clinical importance of this finding is reflected by poor survival of BCP-ALL patients when both events occurred at the same time in contrast to excellent relapse-free survival of patients who showed high expression of the tumor-suppressive miR-497/195 cluster and no deletion of CDKN2A or CDKN2B in their leukemia cells.
Discussion
ALL is the most common pediatric cancer.47 Cure rates of up to 90% are achievable with current therapeutic strategies.1 However, recurrence of leukemia is associated with poor outcome.2 This emphasizes the need to further study mechanisms of high-risk disease to identify alternative therapeutic opportunities. ALL is characterized by different genomic alterations and epigenetic changes that are associated with disease aggressiveness48; the changes occur in genes coding for regulators involved in different cellular pathways.37 Alterations of specific genes are associated with clinical outcome, potentially serving as prognostic factors and markers for treatment stratification.38,49
CDKN2A and CDKN2B are the most frequently deleted genes in BCP-ALL,44 varying in different genetic subtypes.50CDKN2A and CDKN2B code for cyclin-dependent kinase inhibitors that inhibit cyclin-dependent kinases CDK4 and CDK6 and regulate cell cycle progression through tumor suppressor RB1 and transcription factor E2F.51 In addition, CDKN2A encodes an alternate open reading frame product that stabilizes the tumor suppressor p53 and inhibits cellular cycling. Thus, both genes control cell cycle G1/S progression, and the high frequency of deletion of CDKN2A and CDKN2B points to the crucial importance of altered cell cycle regulators for the development of many cancers including leukemia.3,52,53
Our study highlights the importance of tightly controlled cellular cycling in ALL. We identified low expression of the miR-497/195 miRNA cluster associated with unfavorable patient outcome and an aggressive in vivo engraftment phenotype upon transplantation onto immune-deficient mice. Interestingly, in line with the tumor suppressive function of miR-497/195 in ALL observed in our study, both miRNAs have been described to inhibit cellular proliferation in other cancers, including hematologic malignancies such as hepatocellular carcinoma,42 melanoma,54 chronic lymphocytic leukemia,24 and anaplastic large-cell lymphoma.55 Experimentally, we show that the miR-497/195 cluster impairs cell growth when overexpressed in primary patient-derived BCP-ALL samples resulting in delayed in vivo leukemia growth. This tumor-suppressive function is mediated by inhibition of cell cycle progression and decreased proliferation of leukemia cells. In this context, we previously identified hyperactivated mTOR signaling in TTLshort/early-relapse ALL and an increased susceptibility for mTOR inhibition,7,20 which indicates a tight connection between survival pathways and cell cycle control. Because higher expression of miR-497/195 is associated with lower risk of relapse, our data indicate a relevant role for the miR-497/195 cluster in controlling leukemia growth. Conversely, methylation-dependent downregulation of this tumor-suppressive miRNA cluster identified in high-risk leukemias leads to a more aggressive disease. Interestingly, similar to the mechanism identified in our work, another cell cycle promoter, CDK6, was found to be regulated by an epigenetically controlled miRNA (miR-124a) in ALL.19 This suggests a therapeutic potential for demethylating agents in leukemias with low expression of miR-497/195; however, the general hypomethylating activity of miR-497/195 requires further studies to evaluate potential clinical application.
In line with our findings, miR-497 and miR-195 have been reported to target CDK4 and CCND3.42 Accordingly, upon miR-497/195 overexpression, we found downregulated CDK4 and CCND3 together with decreased downstream signaling and cellular proliferation. Conversely, inhibition of miR-497/195 led to increased expression of CDK4 and CCND3 along with increased growth of leukemia. A stronger effect on target expression and function was observed upon inhibition of miR-195, indicating that while sharing the same seed regions, both miRNAs might mutually regulate their activity either by competing or by enhancing their functions. However, significantly correlated expression of miR-497 and miR-195 observed by others56 and us in different sample sets indicates tight co-regulation of both miRNAs in physiological and pathological conditions.
We showed that the miR-497/195 cluster controls leukemia cell cycling and proliferation by regulating CDK4 and CCND3. Given that the same CDK4 molecule and pathway are regulated by CDKN2A/B, albeit by a different mechanism of direct interaction, we hypothesized that both events cooperate, which results in increased proliferation of leukemia cells and poor outcome. In particular, upon deletion of CDKN2A/B and lost counter-regulation, tuning of CDK4 levels by miR-497/195 might become increasingly relevant. Accordingly, we found that deletion of CDKN2A and CDKN2B together with low expression of miR-497/195 is associated with early relapse, indicating that both alterations together contribute to disturbed cell cycle control, proliferation, rapid in vivo engraftment, and inferior patient outcome.
Deletions of CDKN2A and CDKN2B are frequent events in BCP-ALL, but their prognostic role is not clear. Some studies describe an association with poor prognosis, but others did not detect a prognostic relevance,43,46,57-65 which agrees with our observation of no significant differences in survival. Other outcome-related lesions coinciding with deletion of CDKN2A and CDKN2B50 might influence these results. For instance, the co-occurrence of deletions of CDKN2A/B and IKZF1 (encoding the B-cell developmental regulator Ikaros) characterizes a subgroup with poor prognosis in BCP-ALL.38 These results also highlight cell cycle regulation as a potential target in antileukemia therapy. CCND3, CDK4, and CDK6 are essential for leukemia cell proliferation, and downregulation results in cell cycle blockage which reduces cellular proliferation.5,66 Our data and that from previous reports5,6 notes that CDK inhibition effectively repressed leukemia growth and that the sensitivity of pdx ALL cells to palbociclib was modulated by miR-497/195 overexpression or knockdown. Thus, cell cycle inhibition seems to be an effective additional strategy for treating high-risk leukemias characterized by low levels of miR-497/195 and loss of cell cycle inhibitors.
Taken together, our data identified a tumor-suppressive function of miR-497/195 in BCP-ALL. Loss of miR-497/195–mediated control of cell cycle progression is associated with high-risk leukemia and inferior patient outcome. Accordingly, miR-497/195 overexpression inhibits G1/S transition regulated by CDK4 and CCND3, which leads to impaired leukemia growth in vitro and in vivo. Importantly, loss of miR-497/195–mediated cell cycle control together with deletion of the genes coding the cell cycle inhibitors CDKN2A and CDKN2B (a frequent genomic alteration in BCP-ALL) was significantly associated with inferior outcome and early leukemia recurrence. Impaired control of cellular proliferation by downregulated expression of miR-497/195 and lost tumor-suppressive function contributes to a high-risk leukemia phenotype, particularly in cooperation with other disturbances in cell cycle regulation. Thus, pharmacological cell cycle inhibition that functionally restores the regulating properties of miR-497/195 might be an effective therapeutic strategy for patients with high-risk ALL.
Acknowledgments
The authors thank Sevil Essig and Sandra Volk for excellent technical assistance and the Ulm University Sorting, Genomics, and Animal Facilities; Chiara Palmi, PhD, and Giovanni Cazzaniga, PhD (Department of Pediatrics, University of Milano-Bicocca, Fondazione Monza e Brianza per il Bambino e la sua Mamma/Ospedale San Gerardo, Monza, Italy) for supervision and assistance with multiplex ligation-dependent probe amplification analyses; Bernhard Gentner (San Raffaele Telethon Institute for Gene Therapy, IRCCS San Raffaele Scientific Institute, Milan, Italy) for providing research tools and information for microRNA overexpression; Birthe Fedders (University Medical Center Schleswig-Holstein, Christian-Albrechts-University, Kiel, Germany) for help with patient samples; and Marion Bähr (Division of Cancer Epigenomics, German Cancer Research Center, Heidelberg, Germany) for excellent technical assistance in MassARRAY analysis.
This work was supported by the International Graduate School of Molecular Medicine of Ulm University (E.B., S.D., A.N.); by grants from the German Research Foundation (SFB1074, B6 [K.-M.D., L.H.M.] and SFB1074, B11 [C.P.]), Italian Association for Cancer Research (AIRC IG #20052) (S.B., G.t.K.); Italian Ministry of Education, Universities and Research (PRIN 2017 #2017PPS2X4_003) (S.B., G.t.K.); Fondazione Umberto Veronesi Fellowship (E.G.), Ulm University Hertha Nathorff and Margarete von Wrangell Program (J.Z.), German Cancer Aid (DKH 110461) (R.C.), and Ulm University, Medical Faculty Baustein 3.2 and Clinician Scientist Program (F.S.).
Authorship
Contribution: E.B., K.-M.D., G.t.K., S.B., and L.H.M. conceived the study; E.B., A.N., J.M.B., D.W., V.M., Q.S., S.E., F.S., S.D., J.Z., and R.C. performed the research; M.Z., G.C., and M.S. provided patient samples and data; E.B., E.G., J.M.B., M.Z., D.W., J.Z., R.C., C.P., M.L.D.B., K.-M.D., G.t.K., S.B., and L.H.M. analyzed and interpreted data; E.B., K.-M.D., and L.H.M. wrote the paper; and all authors read and approved the manuscript.
Conflict-of-interest disclosure: The authors declare no competing financial interests.
The current affiliation for E.B. is Division of Molecular Hematology, Lund University, Lund, Sweden.
The current affiliation for S.D. is Munich University Medical Center, Munich, Germany.
Correspondence: Lüder Hinrich Meyer, Ulm University Medical Center, Eythstrasse 24, 89075 Ulm, Germany; e-mail: lueder-hinrich.meyer@uniklinik-ulm.de.
The online version of this article contains a data supplement.
There is a Blood Commentary on this article in this issue.
The publication costs of this article were defrayed in part by page charge payment. Therefore, and solely to indicate this fact, this article is hereby marked “advertisement” in accordance with 18 USC section 1734.

This feature is available to Subscribers Only
Sign In or Create an Account Close Modal