

Key Points
A data set of >170 000 microscopic images allows training neural networks for identification of BM cells with high accuracy.
Neural networks outperform a feature-based approach to BM cell classification and can be analyzed with explainability and feature embedding methods.

Abstract
Biomedical applications of deep learning algorithms rely on large expert annotated data sets. The classification of bone marrow (BM) cell cytomorphology, an important cornerstone of hematological diagnosis, is still done manually thousands of times every day because of a lack of data sets and trained models. We applied convolutional neural networks (CNNs) to a large data set of 171 374 microscopic cytological images taken from BM smears from 945 patients diagnosed with a variety of hematological diseases. The data set is the largest expert-annotated pool of BM cytology images available in the literature. It allows us to train high-quality classifiers of leukocyte cytomorphology that identify a wide range of diagnostically relevant cell species with high precision and recall. Our CNNs outcompete previous feature-based approaches and provide a proof-of-concept for the classification problem of single BM cells. This study is a step toward automated evaluation of BM cell morphology using state-of-the-art image-classification algorithms. The underlying data set represents an educational resource, as well as a reference for future artificial intelligence–based approaches to BM cytomorphology.
Introduction
Examination and differentiation of bone marrow (BM) cell morphologies are important cornerstones in the diagnosis of malignant and nonmalignant diseases affecting the hematopoietic system1-5 Although a large number of sophisticated methods, including cytogenetics, immunophenotyping, and, increasingly, molecular genetics, are now available, cytomorphologic examination remains an important first step in the diagnostic workup of many intra- and extramedullary pathologies. Having been established in the 19th century,6 the role of BM cytology is still central for its relatively quick and widespread technical availability.7 The method has been difficult to automatize, which is why, in a clinical routine workflow, microscopic examination and classification of single-cell morphology are still primarily performed by human experts. However, manual evaluation of BM smears can be tedious and time-consuming and are highly dependent on examiner skill and experience, especially in unclear cases.8 Hence, the number of high-quality cytological examinations is limited by the availability and experience of trained experts, whereas examiner classifications have been found to be subject to substantial inter- and intrarater variability.9-11 Furthermore, examination of individual cell morphologies is inherently qualitative, which makes the method difficult to combine with other diagnostic methods that offer more quantitative data.
Few attempts to automatize the cytomorphologic classification of BM cells have been undertaken. Most are based on extracting hand-crafted single-cell features from digitized images and using them to classify the cell in question.12,13 Additionally, the majority of previous studies of automated cytomorphologic classification focused on the classification of physiological cell types or peripheral blood smears,14-16 limiting their usability for classification of leukocytes in the BM for the diagnosis of hematological malignancies. Deep-learning approaches to BM cell classification have focused on relatively low numbers of samples or disease classes or did not make the corresponding data available publicly.17-20
Classification of natural images has undergone significant improvements in accuracy over the past few years, aided by the increasingly widespread use of convolutional neural networks (CNNs).21,22 In the meantime, this technology has also been applied to a variety of medical image interpretation tasks, including mitosis detection in histological sections of breast cancer,23 skin cancer detection,24 mammogram evaluation,25 and cytological classification in peripheral blood.11 However, the successful use of CNNs for image classification typically relies on the availability of a sufficient amount of high-quality image data and high-quality annotation, which can be difficult to access because of the expense involved in obtaining labels by medical experts.26,27 This is particularly true in situations like the cytomorphologic examination of BM, where there is no underlying technical gold standard, and human examiners are needed to provide the ground truth labels for network training and evaluation.
Here, we present a large data set of 171 374 expert-annotated single-cell images from 945 patients diagnosed with a variety of hematological diseases. To our knowledge, it is the largest image data set of BM cytomorphology available in the literature in terms of the number of diagnoses, patients, and cell images included. Therefore, it is a resource to be used for educational purposes and future approaches to automated image-based BM cell classification. We used the data set to train 2 CNN-based classifiers for single-cell images of BM leukocytes, 1 using ResNeXt, a recent model that proved successful in natural image classification, as well as a simpler sequential network architecture. We tested and compared the classifiers and found that they outperform previous methods while achieving excellent levels of accuracy for many cytomorphologic cell classes with direct clinical relevance. The fact that both classifiers, based on different models, attain good results increases the confidence in the robustness of our findings.
Methods
Data set selection and digitization
BM cytologic preparations were included from 961 patients diagnosed with a variety of hematological diseases at MLL Munich Leukemia Laboratory between 2011 and 2013. All patients had given written informed consent for the use of clinical data according to the Declaration of Helsinki. Images of single cells do not allow any patient-specific tracking. The study was approved by the MLL Munich Leukemia Laboratory internal institutional review board. The age range of included patients was 18.1 to 92.2 years, with a median of 69.3 years and a mean of 65.6 years. The cohort included 575 (59.8%) males and 385 (40.1%) females, as well as 1 (0.1%) patient of unknown gender.
All BM smears were stained according to standard protocols as used in daily routine. May-Grünwald-Giemsa/Pappenheim staining was used as published elsewhere.2
BM smears are digitized with an automated microscope (Zeiss Axio Imager Z2) in several steps. First, the entire slide is captured at low optical magnification (onefold magnification) to obtain an overview image. For an automatic system and to minimize the scanning duration, automated detection of the BM smear on the microscopic slide is necessary. The contour of the smear is identified by a combination of thresholding and k-means clustering methods.28 Then the BM smear region is determined and digitized by performing a "systematic meander" of the slide with a midlevel (fivefold) magnification objective. Relevant regions are selected by human experts and scanned automatically at high magnification (40× oil immersion objective) for the morphological cell analysis. All images are captured with a CCD camera mounted on a brightfield microscope (Zeiss Axio Imager Z2). The dimensions of the original images are 2452 × 2056 pixels, and the physical size of a camera pixel is 3.45 × 3.45 μm. For the localization of single cells, a method considering the foreground ratio of the high-resolution BM images is used.29 A quadratic region around each found cell center is presented to experienced cytologists at the Munich Leukemia Laboratory MLL to determine the ground truth classifications for single-cell images. A total of 945 patients was included in the final analysis data set. Diagnoses represented in the cohort include a variety of myeloid and lymphoblastic malignancies, lymphomas, and nonmalignant and reactive alterations, reflecting the sample entry of a large laboratory specializing in hematology (supplemental Figure 1, available on the Blood Web site).
From the examined regions, diagnostically relevant cell images were annotated into 21 classes according to the morphological scheme shown in Figure 1A. When annotating individual samples, morphologists were asked to annotate 200 cells per slide in accordance with routine practice. To avoid biasing the annotation for easily classifiable cell images, separate classes were included for artefacts, cells that could not be identified, and other cells belonging to morphological classes not represented in the scheme. From the annotated regions, 250 × 250-pixel images were extracted containing the respective annotated cell as a main content in the patch center (Figure 1A). No further cropping, filtering, or segmentation between foreground and background took place, leaving the algorithm with the task of identifying the main image content relevant for the respective annotation. To exclude correlations between different images in the data set, we screened for overlaps between images using the SIFT algorithm30 and discarded images for which overlapping local features were detected. The final number of images contained in each of the 21 morphological classes is shown in Table 1. Overall, the cleaned data set consists of 171 374 single-cell images.
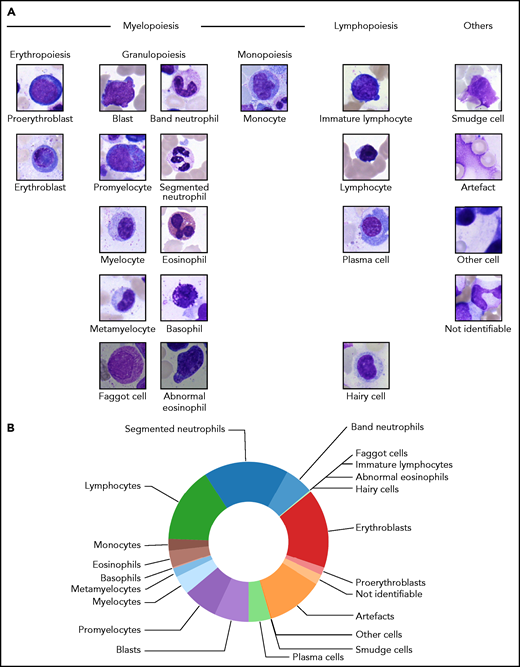
Structure of the 21 morphological classes of BM cells used in this study. (A) Ordering of the classes into hematopoietic lineages. In agreement with routine practice, major physiological classes of myelopoiesis and lymphopoiesis are included, as well as characteristic pathological classes and classes for artefacts and unclear objects. As detailed in the main text, all cells were stained using the May-Grünwald-Giemsa/Pappenheim stain, and imaged at ×40 magnification. (B) Distribution of the 171 374 nonoverlapping images of our data set into the classes used.
Structure of the 21 morphological classes of BM cells used in this study. (A) Ordering of the classes into hematopoietic lineages. In agreement with routine practice, major physiological classes of myelopoiesis and lymphopoiesis are included, as well as characteristic pathological classes and classes for artefacts and unclear objects. As detailed in the main text, all cells were stained using the May-Grünwald-Giemsa/Pappenheim stain, and imaged at ×40 magnification. (B) Distribution of the 171 374 nonoverlapping images of our data set into the classes used.
Class-wise precision and recall of the neural network classifier, as obtained by fivefold crossvalidation
| Class | Precisiontolerant | Recalltolerant | Precisionstrict | Recallstrict | Images* |
|---|---|---|---|---|---|
| Band neutrophils | 0.91 ± 0.02 | 0.91 ± 0.01 | 0.54 ± 0.03 | 0.65 ± 0.04 | 9 968 |
| Segmented neutrophils | 0.95 ± 0.01 | 0.85 ± 0.03 | 0.92 ± 0.02 | 0.71 ± 0.05 | 29 424 |
| Lymphocytes | 0.90 ± 0.03 | 0.72 ± 0.03 | 0.90 ± 0.03 | 0.70 ± 0.03 | 26 242 |
| Monocytes | 0.57 ± 0.05 | 0.70 ± 0.03 | 0.57 ± 0.05 | 0.70 ± 0.03 | 4 040 |
| Eosinophils | 0.85 ± 0.05 | 0.91 ± 0.03 | 0.85 ± 0.05 | 0.91 ± 0.03 | 5 883 |
| Basophils | 0.14 ± 0.05 | 0.64 ± 0.07 | 0.14 ± 0.05 | 0.64 ± 0.07 | 441 |
| Metamyelocytes | 0.68 ± 0.04 | 0.87 ± 0.03 | 0.30 ± 0.05 | 0.64 ± 0.08 | 3 055 |
| Myelocytes | 0.78 ± 0.03 | 0.91 ± 0.01 | 0.52 ± 0.05 | 0.59 ± 0.06 | 6 557 |
| Promyelocytes | 0.91 ± 0.02 | 0.89 ± 0.03 | 0.76 ± 0.05 | 0.72 ± 0.08 | 11 994 |
| Blasts | 0.79 ± 0.03 | 0.69 ± 0.03 | 0.75 ± 0.03 | 0.65 ± 0.03 | 11 973 |
| Plasma cells | 0.81 ± 0.06 | 0.84 ± 0.04 | 0.81 ± 0.06 | 0.84 ± 0.04 | 7 629 |
| Smudge cells | 0.28 ± 0.09 | 0.90 ± 0.10 | 0.28 ± 0.09 | 0.90 ± 0.10 | 42 |
| Other cells | 0.22 ± 0.06 | 0.84 ± 0.06 | 0.22 ± 0.06 | 0.84 ± 0.06 | 294 |
| Artefacts | 0.82 ± 0.05 | 0.74 ± 0.06 | 0.82 ± 0.05 | 0.74 ± 0.06 | 19 630 |
| Not identifiable | 0.27 ± 0.04 | 0.63 ± 0.04 | 0.27 ± 0.04 | 0.63 ± 0.04 | 3 538 |
| Proerythroblasts | 0.69 ± 0.09 | 0.85 ± 0.04 | 0.57 ± 0.09 | 0.63 ± 0.13 | 2 740 |
| Erythroblasts | 0.90 ± 0.01 | 0.83 ± 0.02 | 0.88 ± 0.01 | 0.82 ± 0.01 | 27 395 |
| Hairy cells | 0.80 ± 0.03 | 0.88 ± 0.02 | 0.35 ± 0.08 | 0.80 ± 0.06 | 409 |
| Abnormal eosinophils | 0.02 ± 0.03 | 0.20 ± 0.40 | 0.02 ± 0.03 | 0.20 ± 0.40 | 8 |
| Immature lymphocytes | 0.35 ± 0.11 | 0.57 ± 0.13 | 0.08 ± 0.03 | 0.53 ± 0.15 | 65 |
| Faggot cells | 0.17 ± 0.05 | 0.63 ± 0.27 | 0.17 ± 0.05 | 0.63 ± 0.27 | 47 |
Data are mean ± standard deviation. Results are shown for the tolerant evaluation, allowing for mix-ups between classes that are difficult to distinguish, and the strict evaluation.
Overall number of cell images contained in each class of the data set.
Cell types represented in our morphological classification scheme are present at very different frequencies on BM smears, resulting in a highly imbalanced distribution of training images (Figure 1B). Class imbalance is a challenging feature of many medical data sets31; in the present case, it arises from the uneven prevalence of different disease entities included and the different intrinsic prevalences of specific cell classes in a given sample. To counteract the class imbalance in the training process, we used data set augmentation21 and upsampled the training data to ∼25 000 images per class by performing a set of augmentation transformations. First, we used clockwise rotations by a random continuous angle in the range of 0° to 180°, as well as vertical and horizontal flips, shifts by up to 25% of the image weight and height, and shears by up to 20% of the image size. In addition to these geometric transformations, we included stain-color augmentation transformations, which have been shown to improve robustness and generalizability of the resulting classifier.32 Following the strategy proposed by Tellez et al,33 we first separated the eosin-like and the hematoxylin-like components according to the principal component analysis–based method of Macenko et al.34 These 2 stain components were perturbed using the method and default parameters of Tellez et al,33 thus simulating the variability in stain intensity.
Network structure and training
We used the ResNeXt-50 architecture developed by Xie et al,35 a successful image-classification network that obtained a second rank in image classification at the ImageNet Large Scale Visual Recognition Challenge 2016 competition.36 The network topology was used previously in the classification of peripheral blood smears,14 making it a natural choice for the morphologic classification of BM cells. One advantage of the ResNeXt architecture is its low number of hyperparameters. We kept the cardinality hyperparameter C = 32, as was done in the original study.35 Furthermore, we modified the network input to accept images with a size of 250 × 250 pixels and adjusted the number of output nodes to 22, of which 2 nodes were combined, yielding the 21 overall morphological classes of our annotation scheme. Overall, the resulting network possessed 23 059 094 trainable parameters. When generating class predictions on images, the output node with the highest activation determined the cell class prediction.
Networks were trained on NVIDIA Tesla V100 graphics processing units; training of the ResNeXt model took ∼48 hours of computing time. For the training of individual networks reported in this article, we used 80% of the available images for each class, whereas 20% were used for evaluation of the trained network. This stratified train-test split was performed in a random fashion. Data augmentation was performed after the train-test split. For fivefold crossvalidation, we performed a stratified split of the data set into 5 mutually disjoint folds, each containing ∼20% of the images in the respective cell class. We then trained 5 different networks for 13 epochs, where each individual network used a different fold for testing, and the remaining 4 folds for training of the network. Results were then averaged across the 5 different networks. To evaluate the robustness of our results with respect to network structure, we also trained a sequential model with a simpler architecture that has been used before to train a classifier for leukocytes in peripheral blood.11 The precise network architecture used is shown in supplemental Figure 5. With input and output channels adjusted to match those of the ResNeXt model, the sequential model contained a total of 303 694 trainable parameters. Distribution of data into test and training sets for the different folds was kept identical to the one used in training the ResNeXt model. The feature-based approach of Krappe et al13 used minimum redundancy selection37 of >6000 features per cell to train a support vector machine. Furthermore, a slightly different training strategy was used. Although the split into test and training data was kept identical for training the ResNeXt and the sequential CNN models, the feature-based approach used 70% of the data for training and 30% of the data for evaluation.13 To ensure that our results are robust with respect to this slight difference in split strategy, we trained a ResNeXt-50 model using a stratified split of the data into 70% training data and 30% test data. The results show only minor deviations from the fivefold crossvalidation results (supplemental Figure 6).
Results
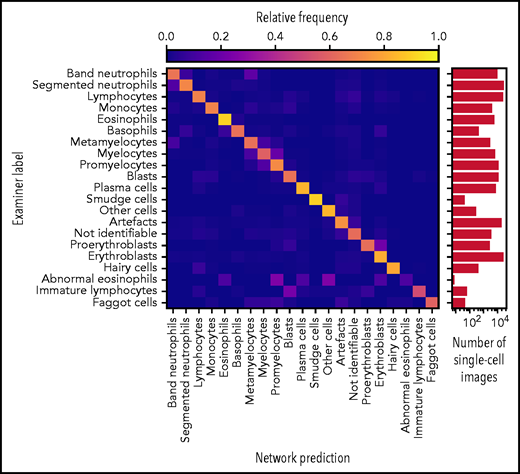
Accurate ResNeXt prediction for most morphological classes. Confusion matrix of the predictions obtained by the ResNeXt classifier on the test database annotated by gold standard labels provided by human experts. Plotted values were obtained by fivefold crossvalidation and are normalized row-wise to account for class imbalance. The number of single-cell images included in each category is indicated in the logarithmic plot on the right. Note the enhanced confusion probability between consecutive steps of granulopoiesis and erythropoiesis, as might be expected because of the unsharp delineations between individual morphological classes. Separate confusion maps of individual folds are shown in supplemental Figure 2.
Accurate ResNeXt prediction for most morphological classes. Confusion matrix of the predictions obtained by the ResNeXt classifier on the test database annotated by gold standard labels provided by human experts. Plotted values were obtained by fivefold crossvalidation and are normalized row-wise to account for class imbalance. The number of single-cell images included in each category is indicated in the logarithmic plot on the right. Note the enhanced confusion probability between consecutive steps of granulopoiesis and erythropoiesis, as might be expected because of the unsharp delineations between individual morphological classes. Separate confusion maps of individual folds are shown in supplemental Figure 2.
As has been noted before, precise differentiation of individual morphological classes can be difficult, in particular when they are closely related in the leukocyte differentiation lineage.13 As a result of this intrinsic uncertainty with regard to morphological classification, some predictions of the network can be considered tolerable, even though they differ from the ground truth label provided by the human annotator. As an example, a confusion between segmented and band neutrophils, which are consecutive morphological classes in the continuous process of myelopoiesis, can be considered tolerable. This consideration led Krappe et al13 to introduce so-called “tolerance classes” for the evaluation of their feature-based classifier on a related single-cell data set. For this study, similar tolerance classes were used (Figure 3A).
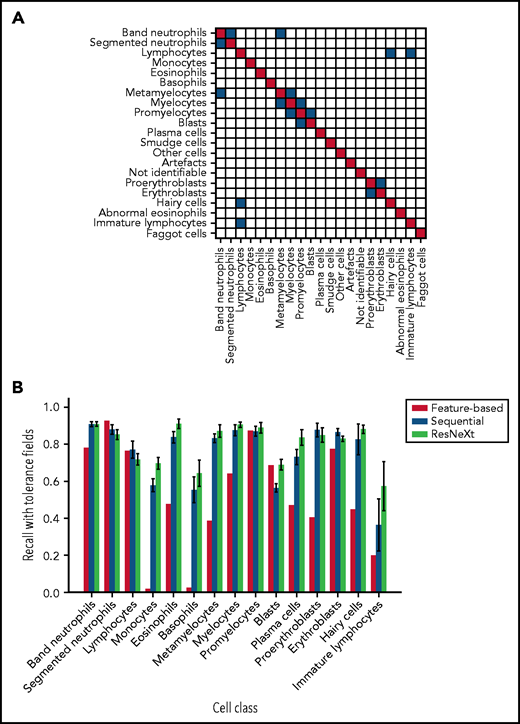
Both CNN models outperform the feature-based classifier in terms of tolerant class-wise recall. (A) Some morphological classes can be difficult to distinguish, so that a misclassification can be considered tolerable. Strict classification evaluation accepts only precise agreement of ground truth and network prediction, as shown in the red diagonal entries of the matrix. Mix-ups that are considered tolerable are colored blue. (B) Tolerance improvement for key classes. Error bars indicate standard deviation across 5 cross-validation folds. For segmented neutrophils and lymphocytes, performance of the feature-based classifier is slightly higher than of the neural networks. In all other classes, both CNNs consistently outperform the feature-based classifier of Krappe et al.13 This might be due to the distinctive signal of the nuclear shape of segmented neutrophils and lymphocytes in feature space. Additionally, ResNeXt outperforms the sequential network in several key classes, reflecting the greater complexity of the network used.
Both CNN models outperform the feature-based classifier in terms of tolerant class-wise recall. (A) Some morphological classes can be difficult to distinguish, so that a misclassification can be considered tolerable. Strict classification evaluation accepts only precise agreement of ground truth and network prediction, as shown in the red diagonal entries of the matrix. Mix-ups that are considered tolerable are colored blue. (B) Tolerance improvement for key classes. Error bars indicate standard deviation across 5 cross-validation folds. For segmented neutrophils and lymphocytes, performance of the feature-based classifier is slightly higher than of the neural networks. In all other classes, both CNNs consistently outperform the feature-based classifier of Krappe et al.13 This might be due to the distinctive signal of the nuclear shape of segmented neutrophils and lymphocytes in feature space. Additionally, ResNeXt outperforms the sequential network in several key classes, reflecting the greater complexity of the network used.
The values for precision and recall attained by the ResNeXt network for individual morphological classes are given in Table 1 as mean ± standard deviation across the 5 networks evaluated on the mutually disjoint folds (see “Methods”). A strict and a tolerant evaluation strategy were used: the former compares the network prediction with the ground truth label only, and the latter takes tolerance classes into account. The analogous analysis was also performed for the sequential model trained for comparison on the identical data. A confusion matrix analogous to Figure 2, as well as class-wise precision and recall values, are given in supplemental Figure 3 and supplemental Table 1. Overall, the sequential network attains similar, but somewhat inferior, performance values, in agreement with the comparative evaluation of both network architectures in the classification of peripheral blood cells from a data set of 15 malignant and nonmalignant cell classes relevant in acute myeloid leukemia.11
In a direct performance comparison of ResNeXt, the sequential model, and the feature-based approach of Krappe et al,13 the neural networks outperformed the feature-based classifier in all classes (Figure 3B) with the exception of segmented neutrophils and lymphocytes, where the average tolerance recall of our fivefold crossvalidation falls slightly below the tolerance recall of the feature-based method. This effect may be due to the distinctive signal of segmented neutrophils and lymphocytes in the feature space used in the classifier of Krappe et al,13 which explicitly includes parameters of nuclear shape. In contrast, the neural network classifiers used in this study do not rely on the extraction of handcrafted morphological parameters but extract the relevant features from the training data set.
As is expected for a data-driven method, the classifier performs less favorably for classes in which only few training images are available, such as faggot cells or pathological eosinophils. For image-classification tasks focused on recognition of these specific cell types, more training data would be required. Furthermore, training a binary classifier instead of a full multiclass classifier might yield better prediction performance.38
External validation
To test the generalizability of our model, evaluation of the network’s predictions on an external data set not used during training is required. At present, very few publicly available data sets that include single BM cells in sufficient number, imaging, and annotation quality exist, rendering evaluation of the generalizability of our network’s predictions challenging. We evaluated our model on an annotated data set from Choi et al20; 627 single-cell images from 30 slides of 10 patients are available with annotations for different stages of the erythroid and myeloid lineages. The data set includes images with different illuminations and image resolutions. Because no information about the physical pixel size was available, we scaled all single-cell images up to 250 × 250 pixels and generated predictions from the scaled images. Note that this may have led to input images of systematically different sizes compared with the images in our data set.
Of the 627 annotated images, 247 were assigned to the “artefact” and “not identifiable” categories, indicating that the network was not able to predict the class of these images. Predictions on the remaining 380 images are shown in Figure 4,indicating fair performance of the classifier on the external data set. In particular, most cells are classified correctly into their respective lineages. Given the different imaging and annotation strategies followed in the compilation of both data sets, a considerable amount of tolerable confusion between individual lineage steps is expected.
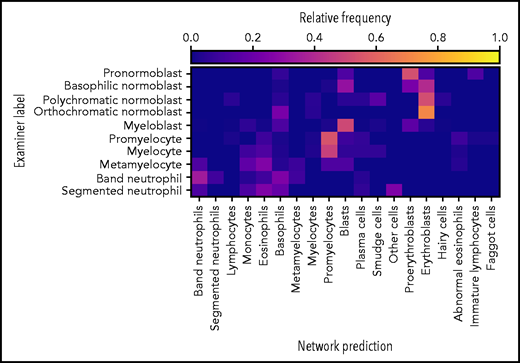
The network exhibits fair performance on an external data set. Of 627 single-cell images from an external data set, the network predicted classes on 380 images (61% of the data set). The confusion matrix shows fair agreement between the annotations of Choi et al20 and the network predictions, which possess slightly different, but compatible, classification schemes. Good agreement is generally observed with the exception of confusions within the myeloid and erythroid lineages.
The network exhibits fair performance on an external data set. Of 627 single-cell images from an external data set, the network predicted classes on 380 images (61% of the data set). The confusion matrix shows fair agreement between the annotations of Choi et al20 and the network predictions, which possess slightly different, but compatible, classification schemes. Good agreement is generally observed with the exception of confusions within the myeloid and erythroid lineages.
It must be noted that, compared with the internal data set, the external evaluation data set is relatively small and heterogeneous in terms of staining and background lighting. Furthermore, considerable differences in terms of imaging and annotation strategies exist. For example, the lymphoid lineage is not covered, and the annotation classes differ from those used in our data set. Nevertheless, the performance of the classifier on the external data set indicates that the model is able to generalize and recognize cases for which no confident prediction can be made. It might be expected that including additional information on the external data set (eg, matching the patch size or background brightness to the one used during training or matching the stain color distribution) would increase the performance of our classifier.
In the sequential model, a qualitatively similar performance is observed using the external data set (supplemental Figure 6), suggesting that generalization is robust against different network architectures.
Classification analysis and explainability
Because they are developed based on the training set in a data-driven way, the classification decisions of neural networks do not lend themselves to direct human interpretation. Nevertheless, to gain insight into the classification decisions used by these algorithms, a variety of explainability methods has recently been developed.39 To determine which regions of the input images are important for the network’s classification decisions, we analyzed the ResNeXt model with SmoothGrad40 and Grad-CAM,41 two recently developed algorithms that have been shown to fulfill basic requirements for explainability methods (ie, sensitivity to data and model parameter randomization).42 Results for key cell classes are shown in Figure 5, suggesting that the model has learned to focus on the relevant input of a single-cell patch (ie, the main leukocyte shown in it) while ignoring background features like erythrocytes, cell debris, or parts of other cells visible in the patch. Furthermore, specific defining structures that are known to be relevant to human examiners when classifying cells also seem to play a role in the network’s attention pattern, such as the cytoplasm of eosinophils and the cell membrane of hairy cells. Although, as post hoc classification explanations, these analyses do not in themselves guarantee the correctness of a particular classification decision, they may increase confidence that the network has learned to focus on relevant features of the single-cell images, and predictions are based on reasonable features.
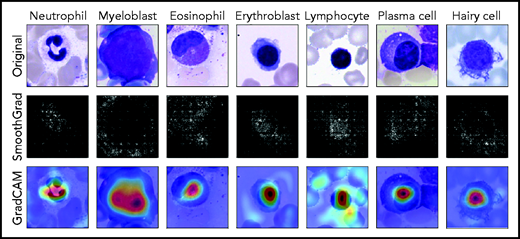
Network prediction analysis shows focus on relevant image regions. Original images classified correctly by the network are shown in the top row. As detailed in the main text, all cells were stained using the May-Grünwald-Giemsa/Pappenheim stain, and imaged at ×40 magnification. The middle row shows analysis using the SmoothGrad algorithm. The lighter a pixel appears, the more it contributes to the classification decision made by the network. Results of a second network analysis method, the Grad-CAM algorithm, are shown in the bottom row as a heat map overlaid on the input image. Image regions containing relevant features are colored red. Both analysis methods suggest that the network has learned to focus on the leukocyte while ignoring background structure. Note the attention of the network to features known to be relevant for particular classes, such as the cytoplasmic structure in eosinophils or the nuclear configuration in plasma cells.
Network prediction analysis shows focus on relevant image regions. Original images classified correctly by the network are shown in the top row. As detailed in the main text, all cells were stained using the May-Grünwald-Giemsa/Pappenheim stain, and imaged at ×40 magnification. The middle row shows analysis using the SmoothGrad algorithm. The lighter a pixel appears, the more it contributes to the classification decision made by the network. Results of a second network analysis method, the Grad-CAM algorithm, are shown in the bottom row as a heat map overlaid on the input image. Image regions containing relevant features are colored red. Both analysis methods suggest that the network has learned to focus on the leukocyte while ignoring background structure. Note the attention of the network to features known to be relevant for particular classes, such as the cytoplasmic structure in eosinophils or the nuclear configuration in plasma cells.
As a second test that the classifier has learned relevant and consistent information, we embedded the extracted features represented in the flattened final convolutional layer of the network with 2048 dimensions into 2 dimensions for each member of the test set using the Uniform Manifold Approximation and Projection (UMAP) algorithm.43 The result of the embedding is shown in Figure 6, suggesting that the classifier has extracted features that generally separate individual classes well; however, some classes, such as monocytes, can be challenging to distinguish from unrelated others, as reflected by their proximity to unrelated classes in the embedding. Additionally, the embedding shows that classes representing consecutive steps of cell development (eg, proerythroblasts and erythroblasts) are mapped to neighboring parts of feature space. This indicates that the network extracts relevant features indicative of the continuous nature of development between these classes.
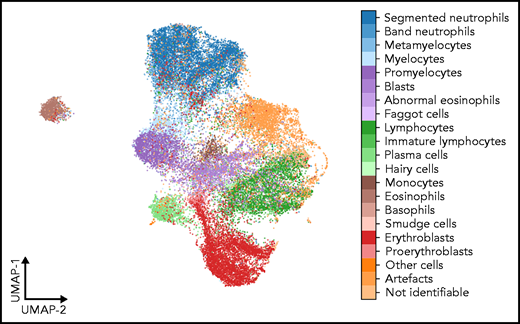
UMAP embedding of extracted features. UMAP embedding of the test set using the algorithm of McInnes et al.43 The flattened final convolutional layer of the ResNeXt-50 network containing 2048 features is embedded into 2 dimensions. Each point represents an individual single-cell patch and is colored according to its ground-truth annotation. All annotated classes are separated well in feature space. Cell types belonging to consecutive development steps tend to be mapped to neighboring positions, reflecting the continuous transition between the corresponding classes.
UMAP embedding of extracted features. UMAP embedding of the test set using the algorithm of McInnes et al.43 The flattened final convolutional layer of the ResNeXt-50 network containing 2048 features is embedded into 2 dimensions. Each point represents an individual single-cell patch and is colored according to its ground-truth annotation. All annotated classes are separated well in feature space. Cell types belonging to consecutive development steps tend to be mapped to neighboring positions, reflecting the continuous transition between the corresponding classes.
Discussion
Neural networks have been shown to be successful in a variety of image classification problems. In this study, we present a large annotated high-quality data set of microscopic images taken from BM smears from a large patient cohort that can be used as a reference for developing machine learning approaches to morphological classification of diagnostically relevant leukocytes. To our knowledge, this image database is the most extensive one available in the literature in terms of the numbers of patients, diagnoses, and single-cell images included.
We used the data set to train and test a state-of-the-art CNN for morphological classification. Overall, the results are encouraging, with high precision and recall values obtained for most diagnostically relevant classes. In direct comparison of recall values, our network clearly outperforms a feature-based classifier13,44 that was recently developed on the same data set for most morphological cell classes. Our findings are in line with experiences from other areas of medical imaging, where deep learning–based image classification tasks have achieved higher benchmarks than methods that require extraction of handcrafted features.27,45 The key ingredient to successful application of CNNs is a sufficiently large and high-quality training data set.21
Although CNNs have outperformed classifiers relying on handcrafted features across a wide range of tasks, the structure of their output usually does not lend itself to straightforward human interpretation. To address this drawback, a variety of explainability methods have been developed. In this study, we used the SmoothGrad and the Grad-CAM algorithms and found that the algorithm has indeed learned to focus on relevant regions of the single-cell image, as well as to pay attention to features known to be characteristic of specific cell classes. Furthermore, by analyzing the features extracted by the network using the UMAP embedding, we could confirm that the network has learned to stably separate morphological classes and map cells with morphological similarities into neighboring regions of feature space. Therefore, the features learned by the network to classify single-cell images appear robust and tolerant with respect to some label noise that cannot be avoided in a data-driven method relying on expert annotations. Future work may reduce the relevance of label noise (eg, by using semi- or unsupervised methods as have been applied to processes such as erythrocyte assessment46 or cell cycle reconstruction).47
In the present study, we primarily followed a single-center approach, with all BM smears included for training prepared in the same laboratory and digitized using the same scanning equipment. Within that setting, the network described in this study shows a very encouraging performance. External validation, although challenging because of the limited amount of available data, indicates that the method is generalizable to data obtained in other settings. Applicability to other laboratories and scanners may be increased further by using larger and more diverse data sets and including specific information on imaging and data handling in the image analysis pipeline.21,48 Further expansion of the morphological database, ideally in a multicentric study and including a range of scanner hardware, would likely increase the performance and robustness of the network, in particular for classes containing few samples in our data set. However, because of the number of cases and diagnoses included, we expect our data set to reasonably reflect the morphological variety for most cell classes. This study is concerned with assessing adult BM morphology. Extension to samples from infants and young children would be interesting, in particular for lymphoid cells. Further work is needed to evaluate the performance of our network in a real-world diagnostic setting. Given the variety of diagnostic modalities used in hematology, we anticipate that inclusion of complementary data (eg, from flow cytometry or molecular genetics) would further increase the quality of predictions that can be obtained by neural networks.
Acknowledgments
The authors thank Matthias Hehr for providing feedback on the manuscript. C. Matek and C. Marr acknowledge support from the German National Research foundation through grant SFB 1243. C. Marr received funding from the European Research Council under the European Union’s Horizon 2020 Research and Innovation Programme (grant agreement 866411).
Authorship
Contribution: C. Matek, C. Marr, and T.H. conceived the study; S.K. and C. Münzenmayer digitized samples; C. Matek trained and evaluated network algorithms and analyzed results; and all authors interpreted the results and wrote the manuscript.
Conflict-of-interest disclosure: The authors declare no competing financial interests.
Correspondence: Carsten Marr, Institute of Computational Biology, Helmholtz Zentrum München–German Research Center for Environmental Health, Ingolstädter Landstrasse 1, Neuherberg 85764, Germany; e-mail: carsten.marr@helmholtz-muenchen.de.
Data will be published upon acceptance via The Cancer Imaging Archive under https://wiki.cancerimagingarchive.net/pages/viewpage.action?pageId=101941770.
Data sharing requests should be sent to Carsten Marr (carsten.marr@helmholtz-muenchen.de).
The online version of this article contains a data supplement.
There is a Blood Commentary on this article in this issue.
The publication costs of this article were defrayed in part by page charge payment. Therefore, and solely to indicate this fact, this article is hereby marked “advertisement” in accordance with 18 USC section 1734.

This feature is available to Subscribers Only
Sign In or Create an Account Close Modal