

Key Points
Maturing human erythroblasts undergo dramatic nuclear condensation and changes in gene expression without accumulating heterochromatin.
Dynamic, maturation stage-specific changes in RNA polymerase II activity, regulated by HEXIM1, are essential for erythroid gene expression.

Abstract
The terminal maturation of human erythroblasts requires significant changes in gene expression in the context of dramatic nuclear condensation. Defects in this process are associated with inherited anemias and myelodysplastic syndromes. The progressively dense appearance of the condensing nucleus in maturing erythroblasts led to the assumption that heterochromatin accumulation underlies this process, but despite extensive study, the precise mechanisms underlying this essential biologic process remain elusive. To delineate the epigenetic changes associated with the terminal maturation of human erythroblasts, we performed mass spectrometry of histone posttranslational modifications combined with chromatin immunoprecipitation coupled with high-throughput sequencing, Assay for Transposase Accessible Chromatin, and RNA sequencing. Our studies revealed that the terminal maturation of human erythroblasts is associated with a dramatic decline in histone marks associated with active transcription elongation, without accumulation of heterochromatin. Chromatin structure and gene expression were instead correlated with dynamic changes in occupancy of elongation competent RNA polymerase II, suggesting that terminal erythroid maturation is controlled largely at the level of transcription. We further demonstrate that RNA polymerase II “pausing” is highly correlated with transcriptional repression, with elongation competent RNA polymerase II becoming a scare resource in late-stage erythroblasts, allocated to erythroid-specific genes. Functional studies confirmed an essential role for maturation stage-specific regulation of RNA polymerase II activity during erythroid maturation and demonstrate a critical role for HEXIM1 in the regulation of gene expression and RNA polymerase II activity in maturing erythroblasts. Taken together, our findings reveal important insights into the mechanisms that regulate terminal erythroid maturation and provide a novel paradigm for understanding normal and perturbed erythropoiesis.
Introduction
Erythropoiesis is the process that generates mature red blood cells from hematopoietic stem and progenitors. The terminal maturation of committed erythroid progenitors is associated with significant changes in gene expression in the context of a nucleus that dramatically decreases in size in preparation for enucleation and is regulated by the coordinated action of transcriptional regulators and epigenetic modifiers. The average person generates 150 million red cells per minute to maintain steady-state red cell levels and avoid the development of anemia.1 To support this impressive output, committed erythroid progenitors continue to rapidly divide as they terminally mature and progressively condense their nuclei, exiting cell cycle just prior to enucleation. The relationship between cell cycle, nuclear condensation, and gene expression remains incompletely understood, but notably, defects in these processes are associated with inherited anemias and myelodysplastic syndromes.2,3
In eukaryotes, all DNA is bound by histone proteins into chromatin. Posttranslational modifications (PTMs) of the N-terminal tails of these proteins are key regulators of chromatin structure and gene expression. The nuclei of mammalian erythroblasts condense to 1/10th of their original volume before enucleation.4 Despite extensive study, the precise mechanisms underlying this essential biologic process remain elusive; however, PTMs of histone proteins have been heavily implicated. Studies in murine erythroblasts suggested that histone deacetylation is important for nuclear condensation and subsequent enucleation5 and led to the hypothesis that histone deacetylation alters the electrostatic interaction of DNA with histone proteins, facilitating chromatin condensation. Histone methylation has also been implicated in erythroblast chromatin condensation.6 The condensed, 4′,6-diamidino-2-phenylindole (DAPI)-dense appearance of the nucleus in late-stage erythroblasts, coupled with studies in transformed murine erythroblasts,5 led to the assumption that nuclear condensation is associated with an accumulation of histone PTMs that typically mark repressed heterochromatin, such as histone H3 lysine 9 di- and tri-methylation (H3K9me2/3) and histone H3 lysine 27 di- and tri-methylation (H3K27me2/3). Contradicting this common assumption, multiple studies have demonstrated the abundance of heterochromatin protein 1, a canonical marker of heterochromatin necessary for the spreading of heterochromatin domains, decreases with maturation.5,7,8 In addition, studies using chromatin immunoprecipitation coupled with high-throughput sequencing (ChIP-seq) found that after commitment to terminal maturation, the heterochromatin landscape during subsequent stages of maturation was relatively stable.9–11 Most of these studies, however, looked at murine erythroblasts during early to mid-maturation. The chromatin landscape of late-stage human erythroblasts remains poorly understood.
We hypothesized that the terminal maturation of human erythroblasts is associated with changes in the abundance of specific histone PTMs. To address this hypothesis, we used mass spectrometry to perform an unbiased assessment of the abundance of histone PTMs in maturing human erythroblasts and ChIP-seq to determine how those marks were distributed throughout the genome. These studies demonstrated that erythroid maturation is associated with loss of histone marks associated with transcription elongation, without a corresponding increase in heterochromatin marks, suggesting that terminal erythroid maturation is controlled largely at the level of transcription. Further studies demonstrated that maturation stage-specific regulation of RNA polymerase II activity is essential for terminal erythroid maturation, and that HEXIM1 is a key regulator of RNA polymerase II activity and erythroid gene expression. Taken together, our findings suggest a novel paradigm for understanding the epigenetic mechanisms that govern erythropoiesis.
Methods
Cell culture for mass spectrometry and genomic studies
CD34 cells were supplied by the Yale Cooperative Center of Excellence in Hematology and cultured as previously outlined.8 Cells for mass spectrometry (Mod-Spec analysis; Active Motif), Ser2 and Ser5 Cut&Tag, and Ser5 ChIP-seq were collected at day 7 and day 10 of CD36 selected erythroid culture, as previously outlined8 and shown in Figure 1A. Basophilic and orthochromatic erythroblasts for H3K36me3 and H3K27me3 ChIP-seq studies were sorted from CD34+ erythroid cultures as previously described.5,9
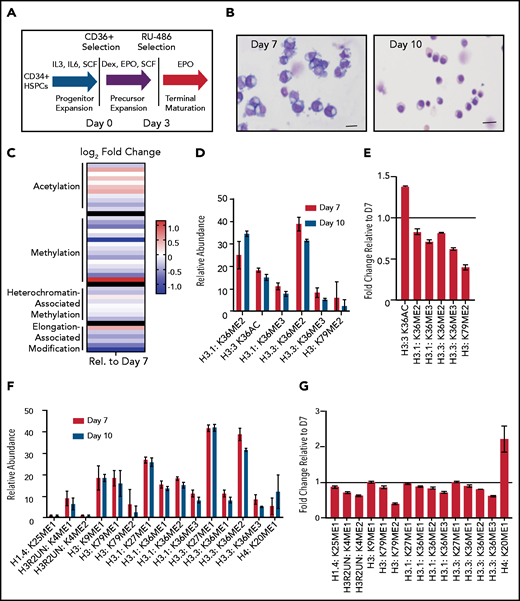
Terminal erythroid maturation is associated with loss of histone PTM associated with active transcriptional elongation. (A) Schematic demonstrating CD36 erythroid synchronization culture system. CD34-positive cells are expanded for 7 days before CD36 selection. CD36-positive cells are cultured for an additional 11 days allowing for terminal erythroid maturation. (B) Cytospins of cells at day 7 and day 10 of terminal erythroid maturation. (C) Heat map of changes in histone abundance during terminal erythroid maturation as determined by mass spectrometry. Values represent log2 fold change of day 10 compared with day 7 of terminal erythroid maturation. (D) Abundance of histone modifications associated with active transcription by RNA polymerase II on day 7 and day 10 of terminal maturation. (E) Fold change of transcription related histone marks at day 10 relative to day 7. (F) Abundance of histone methylation PTM at day 7 and day 10 of terminal maturation. Only histone PTM present at greater than 1% abundance are shown. (G) Fold change of histone methylation at day 10 relative to day 7. (H) Abundance of histone PTMs associated with heterochromatin at day 7 and day 10 of terminal maturation. Only histone PTMs with an abundance greater than 1% are shown. (I) Fold change of heterochromatin-associated PTMs at day 10 relative to day 7. (J) Abundance of histone acetylation at day 7 and day 10 of terminal maturation. Only histone PTMs with an abundance greater than 1% are shown. (K) Fold change of histone acetylation marks at day 10 relative to day 7. The data in this figure represent 2 biologic and 6 technical replicates. Error bars represent standard error of the mean.
Terminal erythroid maturation is associated with loss of histone PTM associated with active transcriptional elongation. (A) Schematic demonstrating CD36 erythroid synchronization culture system. CD34-positive cells are expanded for 7 days before CD36 selection. CD36-positive cells are cultured for an additional 11 days allowing for terminal erythroid maturation. (B) Cytospins of cells at day 7 and day 10 of terminal erythroid maturation. (C) Heat map of changes in histone abundance during terminal erythroid maturation as determined by mass spectrometry. Values represent log2 fold change of day 10 compared with day 7 of terminal erythroid maturation. (D) Abundance of histone modifications associated with active transcription by RNA polymerase II on day 7 and day 10 of terminal maturation. (E) Fold change of transcription related histone marks at day 10 relative to day 7. (F) Abundance of histone methylation PTM at day 7 and day 10 of terminal maturation. Only histone PTM present at greater than 1% abundance are shown. (G) Fold change of histone methylation at day 10 relative to day 7. (H) Abundance of histone PTMs associated with heterochromatin at day 7 and day 10 of terminal maturation. Only histone PTMs with an abundance greater than 1% are shown. (I) Fold change of heterochromatin-associated PTMs at day 10 relative to day 7. (J) Abundance of histone acetylation at day 7 and day 10 of terminal maturation. Only histone PTMs with an abundance greater than 1% are shown. (K) Fold change of histone acetylation marks at day 10 relative to day 7. The data in this figure represent 2 biologic and 6 technical replicates. Error bars represent standard error of the mean.
Detailed methods for mass spectrometry, genomic, and functional studies are included in supplemental Material, available on the Blood Web site.
Results
Histone marks associated with active transcriptional elongation decrease during terminal erythroid maturation
We cultured adult CD34+ hematopoietic stem and progenitor cells down the erythroid lineage using a semisynchronous culture system (Figure 1A).8 After expansion, erythroid progenitors were selected using CD36. The erythroid potential of CD36+ selected cells was confirmed by colony forming assay (supplemental Figure 1A), and the maturation stage confirmed by cytospin and imaging flow cytometric analyses (Figure 1B; supplemental Figure 1B). Mass spectrometry to assess the abundance of histone PTMs was performed on day 7 of erythroid maturation when the cells are at the intermediate stage of maturation, approximately early and late basophilic erythroblasts, and on day 10 of erythroid maturation, when the cells are at the late stage of maturation, predominately poly- and ortho-chromatic erythroblasts (Figure 1B).
Mass spectrometry revealed terminal erythroid maturation was associated with a striking decline in the abundance of H3K36me2/3 and H3K79me2 (Figure 1C-E; supplemental Figures 2 and 3; supplemental Table 1), histone PTMs that reflect active transcription through gene bodies.12,13 The decrease in H3K36me2 and H3K36me3 was associated with a dramatic increase in H3K36Ac (Figure 1C-E; supplemental Table 1). Although the functions associated with this mark are not well understood in mammalian cells, in plants and model organisms, it is removed as RNA polymerase II transcribes through a gene.14,15
The abundance of histone H4 lysine 20 mono-methylation (H4K20me1), which is implicated in erythroblast chromatin condensation,6,16 increased, but surprisingly, levels of histone methylations traditionally associated with heterochromatin, including H3K27me2/3, H3K9me2/3, and H4K20me3 (Figure 1C,F-I; supplemental Figures 2 and 3, supplemental Table 1), were similar in basophilic and orthochromatic erythroblasts, despite the dramatic difference in nuclear size and staining, suggesting that orthochromatic erythroblasts have more compacted chromatin (Figure 1B).
Acetylation of the histone H4 tail is particularly important for chromatin structure, with histone H4 lysine 16 acetylation promoting chromatin decompaction.17 Acetylation of H4K16 appeared to decrease during maturation; however, the levels of many histone acetylations, such as H3K27Ac and H3K9Ac, were similar between the 2 maturation stages, and several, such as H3K36Ac and H3K23Ac, appeared to increase (Figure 1C,J-K; supplemental Figures 2 and 3; supplemental Table 1), suggesting that selective, not global, histone deacetylation underlies erythroid maturation.
Loss of histone PTMs associated with transcriptional elongation are not associated with gain of heterochromatin
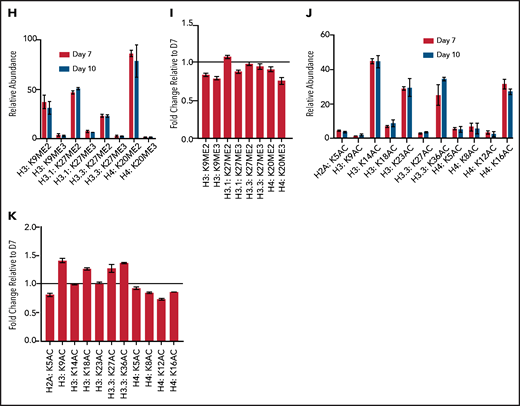
Our mass spectrometry studies demonstrated a global decline in marks that reflect active transcription, without a corresponding increase in the abundance of heterochromatin marks. To further explore this observation, we performed ChIP-seq for H3K36me3, a histone mark reflecting active transcription,12 and H3K27me3, a mark of facultative heterochromatin,18 in sorted populations of early basophilic erythroblasts and orthochromatic erythroblasts cultured from CD34+ hematopoietic stem and progenitor cells, similar to the day 7 and day 10 erythroblasts interrogated in our mass spectrometry studies. Biologic replicates were performed at each time point, with principal component analyses demonstrating segregation according to maturation stage and antibody used (supplemental Figure 4). As expected, H3K36me3 was distributed primarily over gene bodies, and H3K27me3 was located primarily at promoters, introns, and intergenic regions (Figure 2A). The genomic distribution of H3K36me3 did not differ between basophilic and orthochromatic erythroblasts. The genomic distribution of H3K27me3 was also relatively stable during maturation, although there was a small increase in H3K27me3 at promoters in orthochromatic erythroblasts (Figure 2A). As expected, genes that are highly expressed throughout maturation, such as GYPA, had robust enrichment for H3K36me3 in basophilic erythroblasts that was maintained in orthochromatic erythroblasts (Figure 2B), and genes such as FLI1, which are not expressed in committed erythroblasts, had no enrichment of H3K36me3 at either maturation stage (Figure 2C). Interestingly a subset of genes, which are downregulated during the maturation process, such as MYB (Figure 2D), had a dramatic loss of H3K36me3 without accumulation of H3K27me3.
Genomic regions that lose the elongation mark HK36me3 do not gain the heterochromatin mark H3K27me3. (A) Genomic distribution of H3K36me3 and H3K27me3 in intermediate (early basophilic erythroblasts) and late (orthochromatic) erythroblasts relative to known genomic features. Early and late erythroblasts for these studies were sorted from CD34+ cultures based on cell surface marker expression. The antibody used for these experiments cannot distinguish different isoforms of histone H3. (B-D) Occupancy of H3K36me3 and H3K27me3 in indicated erythroid populations at the glycophorin A (GYPA; B), FLI1 (C), and MYB (D) loci. (E) Gene ontogeny terms associated with regions that lose H3K36me3 during maturation. (F) Gene ontogeny terms associated with regions that gain H3K27me3 during maturation. (G) Heatmap depicting hierarchically clustered and z-score normalized differentially bound regions identified through maturation (basophilic erythroblast to orthochromatic erythroblast) for H3K36me3 and H3K27me3. (H) Occupancy of H3K36me3 and H3K27me3 in indicated erythroid populations at the Ankryin1 locus. Red arrow depicts erythroid ankyrin promoter and black arrow depicts the neural ankyrin promoter.
Genomic regions that lose the elongation mark HK36me3 do not gain the heterochromatin mark H3K27me3. (A) Genomic distribution of H3K36me3 and H3K27me3 in intermediate (early basophilic erythroblasts) and late (orthochromatic) erythroblasts relative to known genomic features. Early and late erythroblasts for these studies were sorted from CD34+ cultures based on cell surface marker expression. The antibody used for these experiments cannot distinguish different isoforms of histone H3. (B-D) Occupancy of H3K36me3 and H3K27me3 in indicated erythroid populations at the glycophorin A (GYPA; B), FLI1 (C), and MYB (D) loci. (E) Gene ontogeny terms associated with regions that lose H3K36me3 during maturation. (F) Gene ontogeny terms associated with regions that gain H3K27me3 during maturation. (G) Heatmap depicting hierarchically clustered and z-score normalized differentially bound regions identified through maturation (basophilic erythroblast to orthochromatic erythroblast) for H3K36me3 and H3K27me3. (H) Occupancy of H3K36me3 and H3K27me3 in indicated erythroid populations at the Ankryin1 locus. Red arrow depicts erythroid ankyrin promoter and black arrow depicts the neural ankyrin promoter.
Consistent with the mass spectrometry data, there was a net loss of H3K36me3 peaks as cells moved from basophilic to orthochromatic erythroblasts (1611 peaks gained and 7721 lost). Genes that lost H3K36me3 during maturation were enriched for pathways related to mitochondrial and ribosomal functions (Figure 2E), which are essential pathways in erythroblasts downregulated late in the maturation process.19,20 In contrast, the change in H3K27me3 was relatively balanced (5622 peaks gained, 7011 peaks lost). Regions that gained H3K27me3 were associated with pathways such as RANK/RANK ligand, interleukin 1, and chronic myeloid leukemia (Figure 2F).
We next compared changes H3K36me3 and H3K27me3 during maturation to determine more broadly whether regions that lost H3K36me3 became enriched for H3K27me3. Regions of H3K27me3 enrichment and H3K36me3 enrichment tended to be mutually exclusive, consistent with the inhibition of polycomb repressive complex 2 activity by H3K36me3.21 Intriguingly, most regions that lost enrichment for H3K36me3 during maturation did not become enriched for H3K27me3 (Figure 2G). Instead, genes that gained H3K27me3 frequently had some enrichment for H3K27me3 in basophilic erythroblasts and gained additional H3K27me3 during maturation. Inspection of these regions revealed that they were often associated with genes repressed early in erythroid commitment, such as MEIS1 and FLI1 (Figure 2D), or alternative promoters not used in erythroid cells, such as the neural promoter of ANKYRIN1 (Figure 2H).
Integration of RNA sequencing (RNA-seq) data (GSE53983) identified 2459 genes whose expression decreased more than twofold from basophilic erythroblast to orthochromatic erythroblasts without accumulating H3K27me3. Many of these genes lost H3K36me3 enrichment (supplemental Figure 5A-B). We next sought to determine whether erythroid maturation was associated with H3K27me3 accumulation at putative regulatory elements identified through assay for transposase accessible chromatin sequencing (ATAC-seq; GSE128266). As cells moved from basophilic to orthochromatic erythroblasts, they indeed had a net loss of chromatin accessibility, with 1832 sites lost and 654 sites gained. There was minimal overlap (43 of 1832), however, of the sites that lost chromatin accessibility and gained H3K27me3 enrichment (supplemental Figure 5C-F).
RNA polymerase II is maintained at erythroid-specific genes, despite a dramatic decline in its level during terminal maturation
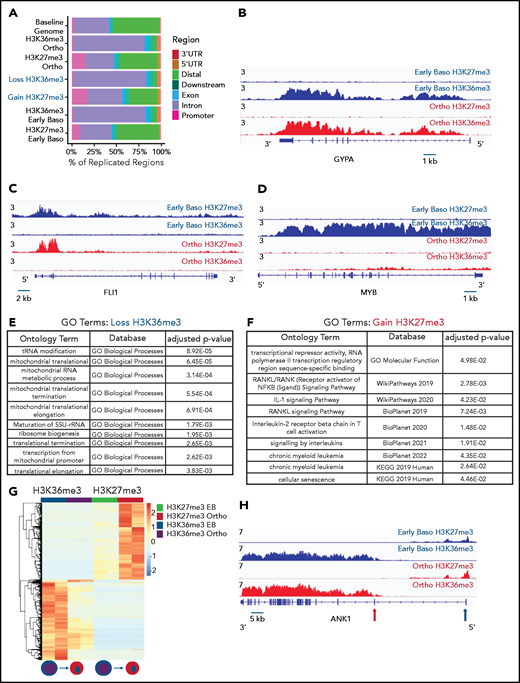
Based on these results, we hypothesized that changes in gene expression and the chromatin landscape were controlled at the level of transcription. RNA polymerase II (Pol II) pausing is a highly regulated mechanism of transcriptional regulation, whereby transcription is initiated but pauses 30 to 60 bp downstream of the transcription start site.22,23 After pausing, Pol II is phosphorylated on serine 5 (Ser5) of the C-terminal domain (CTD), with pause release requiring phosphorylation of serine 2 (Ser2) of the CTD by positive transcription factor β (pTEFb). We performed Cut&Tag24 for Ser2 and Ser5 CTD phosphorylated Pol II in intermediate- (day 7) and late- (day 10) stage erythroblasts from the culture system shown in Figure 1A. Consistent with a global decline in Pol II levels (Figure 3A), there was a dramatic decrease in occupancy of both Ser2 and Ser5 Pol II during maturation (Figure 3C; supplemental Figure 6). However, peaks associated with erythroid-specific genes, such as the globins, were maintained or even increased in size (Figure 3B), suggesting that maturing erythroblasts have robust mechanisms in place to direct and maintain elongation competent Pol II at erythroid-specific loci. Consistent with this hypothesis, regions with the highest intensity of Ser2 and Ser5 Pol II occupancy were highly enriched for essential pathways in erythroid cells (Figure 3D). We next compared changes in the occupancy of Ser2 Pol II to changes in the epigenetic landscape of maturing erythroblasts. The decline in Ser2 Pol II correlated with a decrease in H3K36me3 but not with an accumulation of H3K27me3 or loss of ATAC accessibility at promoter regions (Figures 3E-F).
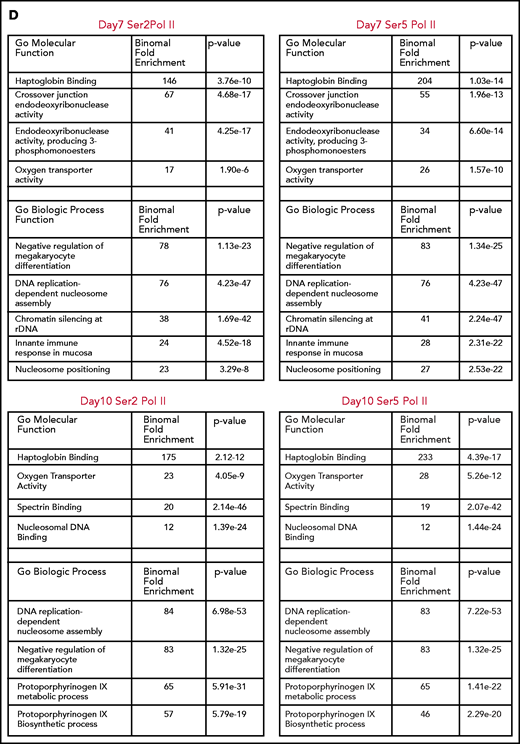
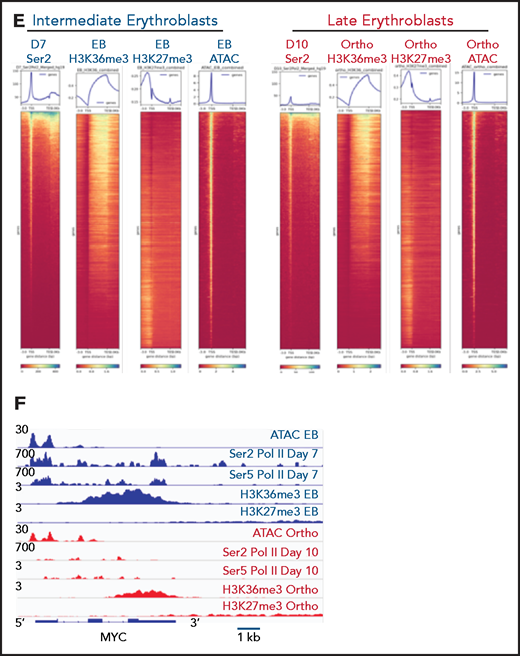
Dynamic changes in RNA polymerase II occupancy during terminal maturation. (A) Western blot demonstrating levels of serine 2 phosphorylated (Ser2), serine 5 phosphorylated (Ser5), and total RNA polymerase II (Pol II) in day 4, day 7, and day 10 cells from the erythroid culture shown in Figure 1A. Histone H4 is used as a loading control. (B) Ser2 and Ser 5 Pol II occupancy at the α globin gene (i) and RPS19 (ii) gene in intermediate (day 7) and late (day 10) erythroblasts from the culture system shown in Figure 1A. (C) Heatmap depicting occupancy of Ser2 and Ser5 Pol II intermediate (Day 7) and late (Day 10) erythroblasts as determined by cut and tag. (D) Gene ontogeny analyses via GREAT of the top 1000 regions of Ser2 and Ser5 Pol II occupancy in intermediate (day 7) and late (day 10) erythroblasts. (E) Chromatin changes associated with loss of Ser2 Pol II occupancy during maturation. The heatmaps are ordered according to Ser2 Pol II occupancy in day 7 cells. (F) Changes in chromatin accessibility, Ser2 Pol II, Ser5 Pol II, H3K36me3 and H3K27me3 occupancy at the MYC locus during erythroid maturation.
Dynamic changes in RNA polymerase II occupancy during terminal maturation. (A) Western blot demonstrating levels of serine 2 phosphorylated (Ser2), serine 5 phosphorylated (Ser5), and total RNA polymerase II (Pol II) in day 4, day 7, and day 10 cells from the erythroid culture shown in Figure 1A. Histone H4 is used as a loading control. (B) Ser2 and Ser 5 Pol II occupancy at the α globin gene (i) and RPS19 (ii) gene in intermediate (day 7) and late (day 10) erythroblasts from the culture system shown in Figure 1A. (C) Heatmap depicting occupancy of Ser2 and Ser5 Pol II intermediate (Day 7) and late (Day 10) erythroblasts as determined by cut and tag. (D) Gene ontogeny analyses via GREAT of the top 1000 regions of Ser2 and Ser5 Pol II occupancy in intermediate (day 7) and late (day 10) erythroblasts. (E) Chromatin changes associated with loss of Ser2 Pol II occupancy during maturation. The heatmaps are ordered according to Ser2 Pol II occupancy in day 7 cells. (F) Changes in chromatin accessibility, Ser2 Pol II, Ser5 Pol II, H3K36me3 and H3K27me3 occupancy at the MYC locus during erythroid maturation.
Maturation stage-specific changes in the pausing index are associated with changes in gene expression
The pausing index, also referred to as the “traveling ratio,” is a ratio of the amount of Pol II at the promoter region and the remainder of the gene body,22 with a pausing index of >4 indicating a high rate of Pol II pausing. As Ser5 Pol II accumulates at the transcription start site and is also present on Pol II that is actively transcribing through the gene body, it is frequently used to calculate the pausing index.25 The pausing index was significantly higher at day 7 than at day 10, with a higher percentage of genes having a pausing index >4 (Figure 4A-B). In the day 7 intermediate erythroblasts, the pausing index was significantly associated with transcriptional repression (Figure 4C). Downregulated genes with a pausing index >4 were enriched for pathways associated with RNA processing, mitochondrial, and ribosomal functions (Figure 4D). Many of these functions are silenced during the late stages of maturation, as mature red cells do not have mitochondria or ribosomes. Consistent with decreased transcription, most genes with a pausing index >4 in the intermediate erythroblasts lost Ser2 and Ser5 Pol II at both the promoter and the gene body during maturation (Figure 4E-F). In contrast, many erythroid genes, such as the globins and glycophorin A (GYPA), maintained their high level of Ser2 and Ser5 Pol II (Figure 4G-H). In day 10 erythroblasts, which are preparing for enucleation, the average pausing index was lower (Figure 4A-C), and changes in gene expression were no longer as highly correlated to the pausing index (Figure 4C). Together these data suggest that temporal control of Pol II activity is a key regulator of gene expression during terminal erythroid maturation.
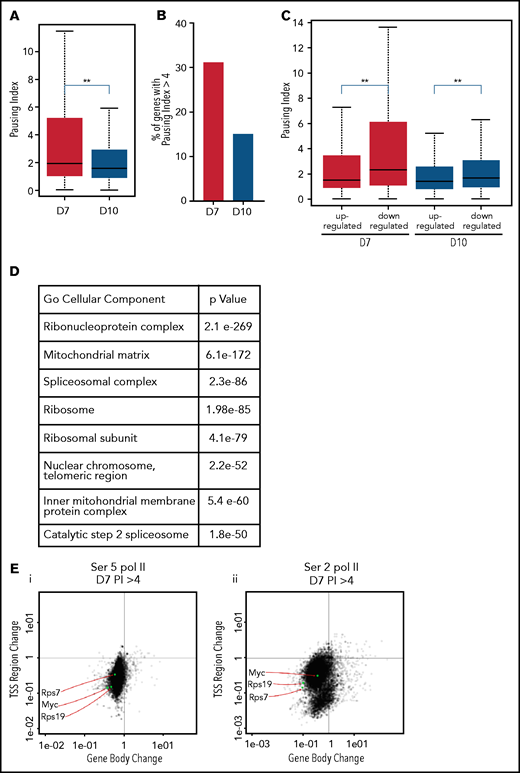
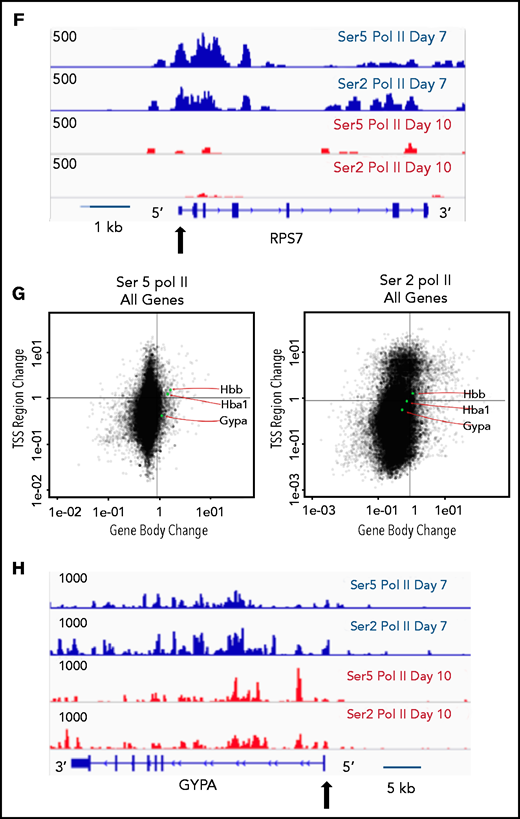
The pausing index changes during terminal maturation and is associated with transcriptional repression. (A) Pausing index in day 7 and day 10 cells, as determined by Ser5 Pol II ChIP-seq. Similar results were obtained with Ser5 and Ser2 cut and tag (supplemental Figure 11). ** P < 2.2e-16. (B) Percent of genes with pausing index >4 in day 7 and day 10 cells, determined by analyses of Ser5 Pol II ChIP-seq. (C) Pausing index at upregulated and downregulated genes at day 7 and day 10, determined by analyses of Ser5 Pol II ChIP-seq. (D) Pathway analyses of downregulated genes with pausing index >4. (E) Quadrant plots showing the change in Ser 2 Sol II and Ser 5 Pol II occupancy at the promoter and gene body as cells mature from day 7 to day 10. The plots show genes that have a pausing index >4 in day 7 cells, with Ser5 Pol II (i) and Ser2 Pol II (ii). (F) Changes in Ser2 Pol II and Ser5 Pol II occupancy at the RPS7 locus, which has a PI >4 at day 7, during erythroid maturation. Black arrow denotes the promoter. (G) Quadrant plots showing the change in Ser2 and Ser5 Pol II occupancy at the promoter and gene body for all genes during maturation, with the location of erythroid specific genes highlighted. (H) Changes in Ser2 Pol II and Ser 5 Pol II occupancy at the GYPA locus, which is a highly expressed gene during erythroid maturation, and maintains high levels of Ser2 Pol II and Ser5 Pol II. Black arrow denotes the promoter. **P < 0.2.2e-16.
The pausing index changes during terminal maturation and is associated with transcriptional repression. (A) Pausing index in day 7 and day 10 cells, as determined by Ser5 Pol II ChIP-seq. Similar results were obtained with Ser5 and Ser2 cut and tag (supplemental Figure 11). ** P < 2.2e-16. (B) Percent of genes with pausing index >4 in day 7 and day 10 cells, determined by analyses of Ser5 Pol II ChIP-seq. (C) Pausing index at upregulated and downregulated genes at day 7 and day 10, determined by analyses of Ser5 Pol II ChIP-seq. (D) Pathway analyses of downregulated genes with pausing index >4. (E) Quadrant plots showing the change in Ser 2 Sol II and Ser 5 Pol II occupancy at the promoter and gene body as cells mature from day 7 to day 10. The plots show genes that have a pausing index >4 in day 7 cells, with Ser5 Pol II (i) and Ser2 Pol II (ii). (F) Changes in Ser2 Pol II and Ser5 Pol II occupancy at the RPS7 locus, which has a PI >4 at day 7, during erythroid maturation. Black arrow denotes the promoter. (G) Quadrant plots showing the change in Ser2 and Ser5 Pol II occupancy at the promoter and gene body for all genes during maturation, with the location of erythroid specific genes highlighted. (H) Changes in Ser2 Pol II and Ser 5 Pol II occupancy at the GYPA locus, which is a highly expressed gene during erythroid maturation, and maintains high levels of Ser2 Pol II and Ser5 Pol II. Black arrow denotes the promoter. **P < 0.2.2e-16.
Terminal erythroid maturation is associated with dramatic changes in the levels of RNA polymerase II and key regulators of RNA polymerase II pausing
HEXIM1 is a key regulator of Pol II activity. HEXIM1 sequesters pTEFb in a ribonuclear complex with the 7SK RNA inhibiting its ability to phosphorylate Pol II.26-28 The HEXIM1-7SK complex can also be tethered at promoters, making pTEFb available for “on-site” activation of target genes following its release from the complex.29 HEXIM1 is highly expressed in erythroid cells compared with most other cell types, with expression peaking in intermediate erythroblasts at both the RNA and protein levels. 7SK is also highly expressed in erythroblasts and its expression increases during maturation (supplemental Figure 7). Conversely, expression of CCNT1 and CKD9, the components of pTEFb, steadily decline during terminal maturation, and the level of both total and elongation competent (Ser2 and Ser2/Ser5 CTD phosphorylated) Pol II decreases dramatically (Figure 4A; supplemental Figure 7). These data further suggest that maturing erythroblasts have robust mechanisms for controlling the level of elongation competent Pol II at each maturation stage.
HEXIM1 is essential for terminal erythroid maturation
The level of HEXIM1 regulates the amount of elongation competent Pol II,30 and a previous shRNA screen implicated HEXIM1 in terminal erythroid maturation.31 To test the function of Pol II pausing dynamics in maturing erythroblasts, we first disrupted HEXIM1 expression using CRISPR/cas9 genome editing in HUDEP2 cells, an E6/E7 immortalized erythroid line resembling intermediate erythroblasts.32 We generated 3 independent HUDEP2 lines with heterozygous disruption of HEXIM1. In addition, we generated 3 lines with heterozygous HEXIM1 disruption in KITCAT cells and a HUDEP2 cell line that has been engineered to grow in absence of stem cell factor.33 All 6 cell lines HEXIM1+/− lines had decreased levels of HEXIM1 protein (Figure 5A-B; supplemental Figure 8), and expression of the 7SK RNA was modestly affected (Figure 5C). These lines had similar viability to control cells when in expansion media but had decreased viability and proliferation during maturation (Figure 5D-F; supplemental Figure 8), with poor viability making it difficult to accurately assess their maturation potential. Despite repeated attempts, we were unable to generate HEXIM1-null lines, implying HEXIM1 is essential in erythroid cells (supplemental Figure 8). shRNA knockdown of HEXIM1 resulted in a similar phenotype (Figure 5B-D,G-J), with HUDEP2 lines expressing shRNA targeting HEXIM1 demonstrating impaired maturation (Figure 5I).
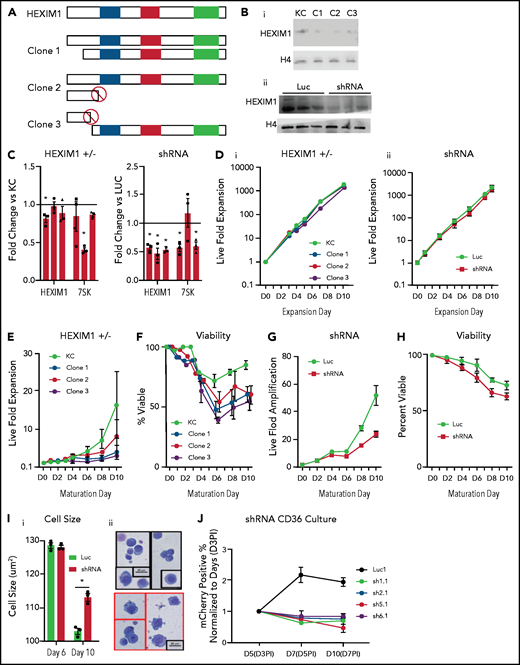
HEXIM1 disruption impairs erythroid cell proliferation and viability. (A) Schematic demonstrates the genetic mutations in the alleles of HEXIM1 for the 3 clonal KITCAT cell lines. (B) Western blot showing HEXIM1 protein levels in KITKAT HEXIM1 ± and KITCAT control lines (KC; i). Western blot showing HEXIM1 protein levels in HUDEP2 cells expressing shRNA targeting HEXIM1 (ii). For both blots, H4 is used as a loading control. (C) HEXIM1 and 7SK levels in KITKAT HEXIM1 ± lines and HUDEP2 cell lines expressing pooled shRNA targeting HEXIM1 or luciferase control. (D) Live fold expansion of clonal HEXIM1 ± mutant lines (i) and shRNA HEXIM1 lines (ii) in expansion conditions. (E) Live fold expansion of HEXIM1 ± mutant lines in maturation conditions. (F) Viability of clonal HEXIM1 ± mutant lines in maturation conditions. (G) Live fold expansion of HUDEP2 lines expressing shRNA targeting HEXIM1 in maturation conditions. (H) Viability of HUDEP2 lines expressing shRNA targeting HEXIM1 in maturation conditions. (I) Imaging flow cytometric quantification of cell size (i) and representative cytospins (ii). (J) Live fold expansion of cells expressing indicated mCherry-HEXIM1 shRNA or luciferase control. Cells were transduced on day 3 (D3) following CD36 selection in the CD34+ erythroid culture system shown in Figure 1A. Data are presented as % of mCherry positive cells relative to day 3 after infection (D3PI). Error bars for all figures represent standard error of the mean of 3 independent cultures. *P < .05 compared with control.
HEXIM1 disruption impairs erythroid cell proliferation and viability. (A) Schematic demonstrates the genetic mutations in the alleles of HEXIM1 for the 3 clonal KITCAT cell lines. (B) Western blot showing HEXIM1 protein levels in KITKAT HEXIM1 ± and KITCAT control lines (KC; i). Western blot showing HEXIM1 protein levels in HUDEP2 cells expressing shRNA targeting HEXIM1 (ii). For both blots, H4 is used as a loading control. (C) HEXIM1 and 7SK levels in KITKAT HEXIM1 ± lines and HUDEP2 cell lines expressing pooled shRNA targeting HEXIM1 or luciferase control. (D) Live fold expansion of clonal HEXIM1 ± mutant lines (i) and shRNA HEXIM1 lines (ii) in expansion conditions. (E) Live fold expansion of HEXIM1 ± mutant lines in maturation conditions. (F) Viability of clonal HEXIM1 ± mutant lines in maturation conditions. (G) Live fold expansion of HUDEP2 lines expressing shRNA targeting HEXIM1 in maturation conditions. (H) Viability of HUDEP2 lines expressing shRNA targeting HEXIM1 in maturation conditions. (I) Imaging flow cytometric quantification of cell size (i) and representative cytospins (ii). (J) Live fold expansion of cells expressing indicated mCherry-HEXIM1 shRNA or luciferase control. Cells were transduced on day 3 (D3) following CD36 selection in the CD34+ erythroid culture system shown in Figure 1A. Data are presented as % of mCherry positive cells relative to day 3 after infection (D3PI). Error bars for all figures represent standard error of the mean of 3 independent cultures. *P < .05 compared with control.
HEXIM1 overexpression enhances erythroid proliferation and disrupts terminal maturation
To further delineate the role of Pol II pausing dynamics in maturing erythroblasts, we overexpressed (OE) HEXIM1 in HUDEP2 cells (Figure 6A; supplemental Figure 9). In contrast to the tumor suppressor effects of HEXIM1 OE in some cell types,30 HEXIM1 OE did not impact HUDEP2 viability. In expansion conditions, HEXIM1 OE resulted in enhanced proliferation with a decreased doubling time (Figure 6B-C) and the cells appeared more heterogeneous in size and morphology than controls (Figure 6D). During maturation, there was also a proliferative advantage (Figure 6E). The cells continued to appear more heterogeneous than controls, and there was an increase in cell and nuclear size coupled with a dramatic increase in the level of CD235a (GYPA) (Figure 6E-G; supplemental Figure 10), suggesting HEXIM1 OE dysregulates erythroid maturation.
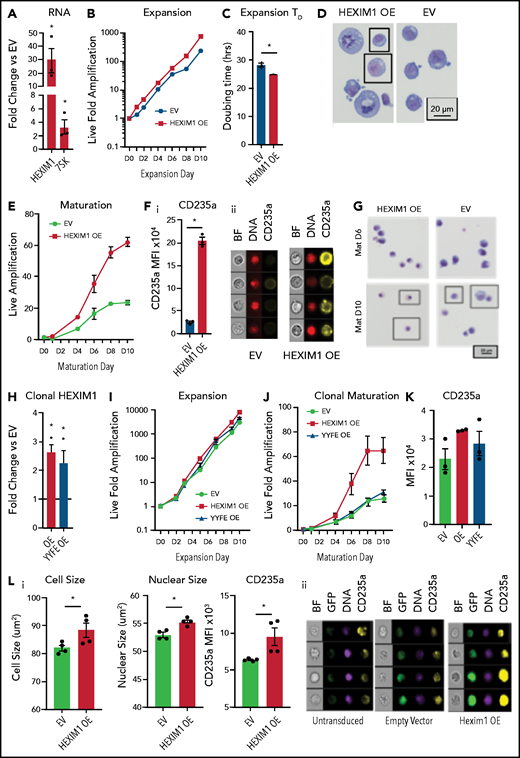
HEXIM1 OE promotes erythroid expansion. (A) HEXIM1 and 7SK levels in HUDEP2 cultures with OE of HEXIM1. (B) Live fold expansion HEXIM1 OE and EV control cultures in expansion conditions. (C) Quantified doubling time for HEXIM1 OE compared with empty vector. (D) Cytosopins of HEXIM1 OE and EV cultures. (E) Live fold expansion HEXIM1 OE and EV control cultures in maturation conditions. (F) Quantification of CD235a levels in HEXIM1 OE and EV control cells on 4 days of maturation (i). Representative images from IDEAS software showing brightfield (BF), DNA (DRAQ5 staining), and CD235a (GYPA) staining (ii). (G) Cytopsins of HEXIM1 OE and EV cultures on day 6 and day 10 of maturation. (H) Expression of HEXIM1 in clonal lines of HUDEP2 cells expressing EV, WT HEXIM1, or HEXIM1 containing 2 amino acid substitutions: Y271F and Y274F (YYFF). (I) Live fold expansion of clonal lines expressing EV, WT HEXIM1, or YYFF HEXIM1 in expansion conditions. (J) Live fold expansion for indicated lines in maturation conditions. (K) CD235a levels in indicated populations. (L) Imaging flow cytometric analyses of HEXIM1 OE and EV cells following HEXIM1 OE on day 3 of the CD34+ erythroid culture shown in Figure 1A. (i) Quantification of cell size, nuclear size, and CD235a expression. (ii) Representative images from Ideas software. *P < .05 compared with empty vector control line.
HEXIM1 OE promotes erythroid expansion. (A) HEXIM1 and 7SK levels in HUDEP2 cultures with OE of HEXIM1. (B) Live fold expansion HEXIM1 OE and EV control cultures in expansion conditions. (C) Quantified doubling time for HEXIM1 OE compared with empty vector. (D) Cytosopins of HEXIM1 OE and EV cultures. (E) Live fold expansion HEXIM1 OE and EV control cultures in maturation conditions. (F) Quantification of CD235a levels in HEXIM1 OE and EV control cells on 4 days of maturation (i). Representative images from IDEAS software showing brightfield (BF), DNA (DRAQ5 staining), and CD235a (GYPA) staining (ii). (G) Cytopsins of HEXIM1 OE and EV cultures on day 6 and day 10 of maturation. (H) Expression of HEXIM1 in clonal lines of HUDEP2 cells expressing EV, WT HEXIM1, or HEXIM1 containing 2 amino acid substitutions: Y271F and Y274F (YYFF). (I) Live fold expansion of clonal lines expressing EV, WT HEXIM1, or YYFF HEXIM1 in expansion conditions. (J) Live fold expansion for indicated lines in maturation conditions. (K) CD235a levels in indicated populations. (L) Imaging flow cytometric analyses of HEXIM1 OE and EV cells following HEXIM1 OE on day 3 of the CD34+ erythroid culture shown in Figure 1A. (i) Quantification of cell size, nuclear size, and CD235a expression. (ii) Representative images from Ideas software. *P < .05 compared with empty vector control line.
OE of HEXIM1 in HUDEP2 cells resulted in approximately 30-fold increase in HEXIM1 (Figure 6A). To study more physiologic levels of HEXIM1 OE, we used single cell dilution to generate clonal lines of HUDEP2 cells with an approximate two- to threefold increase in HEXIM1 expression (Figure 6H; supplemental Figure 9B-C). In addition, we created clonal lines of HUDEP2 cells expressing a HEXIM1 construct containing 2 amino acid substitutions, Y271F and Y274F(YYFF), which prevent phosphorylation of HEXIM1 and impair release of pTEFb from the 7SK complex.34 Clonal lines with HEXIM1 OE had a phenotype similar to bulk OE cells, with increased proliferation and CD235a expression (Figure 6J-K), that was partially rescued by the YYFF construct, suggesting HEXIM1’s ability to bind and release pTEFb contributes to the HEXIM1 OE phenotype.
We next overexpressed HEXIM1 in the human CD34+ erythroid culture system shown in Figure 1A, transducing cells on day 3 after CD36 selection. HEXIM1 OE resulted in dysregulation of erythroid maturation, with a delay in phenotypic and immunophenotypic maturation, and a dramatic elevation of CD235a levels (Figure 6L; supplemental Figure 10). Together, these data demonstrate the functional importance of the pathway controlling Pol II activity during terminal erythroid maturation.
HEXIM1 levels regulate erythroid gene expression and phosphorylation of RNA polymerase II
We next performed RNA-seq on 3 independent clonal lines with the following perturbations of HEXIM1 expression: HEXIM1 OE, HEXIM1 YYFF, HEXIM1+/−, and empty vector (EV) control. When comparing HEXIM1 OE with EV control, downregulated genes were associated with a variety of nonerythroid pathways, whereas upregulated genes were enriched for pathways related to heme synthesis (Figure 7A-C; supplemental Figure 9). In contrast, when comparing HEXIM1+/− lines to control, upregulated genes were enriched for a variety of nonerythroid pathways, whereas the downregulated genes were enriched for terms related to heme synthesis (Figure 7D-E; supplemental Figure 9). Comparing YYFF and EV lines, there were 214 genes downregulated and 49 upregulated genes, which were not significantly enriched for any pathways. Notably, YYFF lines clustered near the EV control in principle component analyses (Figure 7G), and expression of the YYFF construct did not significantly impact the expression of the heme synthesis or other erythroid-specific genes.

Hexim1 OE alters erythroid gene expression and RNA polymerase II phosphorylation. (A) Heatmap showing genes that are differentially expressed in HEXIM1 OE compared with empty vector (EV) control. (B) Volcano plot of genes differentially expressed in HEXIM1 OE compared with EV control. (C) Gene set enrichment analyses using the ENRICHR platform of genes upregulated in EV compared with control. (D) Heatmap showing genes that are differentially expressed in HEXIM1+/− crispr lines(+/−) compared with EV control. (E) Volcano plot of genes differentially expressed in HEXIM1+/− compared with EV control. (F) Gene set enrichment analyses using the ENRICHR platform of genes downregulated in HEXIM1+/− compared with control. (G). Principle component analyses of HEXIM1 OE, EV, YYFF, and ±RNA-seq studies. (H) Western blot showing Ser2 Pol II levels in EV, HEXIM1 OE, and YYFF lines (ii) with quantification (i). (I) ChIP-qPCR for Ser2 and Ser5 Pol II at the GYPA locus in HEXIM1 OE, EV, and shRNA lines. Ser2 and Ser5 Pol II occupancy at the promoter and gene body (i). Pausing index in indicated lines (ii). (J) ChIP-qPCR for Ser2 and Ser5 Pol II at the RPS19 locus in HEXIM1 OE, EV, and shRNA lines. Ser2 and Ser5 Pol II occupancy at the promoter and gene body (i). Pausing index is shown in the indicated lines (ii). *P < .05. Western blot data represent 3 independent blots of distinct cultures. ChIP-PCR data represent 2 to 3 biologic replicates.
Hexim1 OE alters erythroid gene expression and RNA polymerase II phosphorylation. (A) Heatmap showing genes that are differentially expressed in HEXIM1 OE compared with empty vector (EV) control. (B) Volcano plot of genes differentially expressed in HEXIM1 OE compared with EV control. (C) Gene set enrichment analyses using the ENRICHR platform of genes upregulated in EV compared with control. (D) Heatmap showing genes that are differentially expressed in HEXIM1+/− crispr lines(+/−) compared with EV control. (E) Volcano plot of genes differentially expressed in HEXIM1+/− compared with EV control. (F) Gene set enrichment analyses using the ENRICHR platform of genes downregulated in HEXIM1+/− compared with control. (G). Principle component analyses of HEXIM1 OE, EV, YYFF, and ±RNA-seq studies. (H) Western blot showing Ser2 Pol II levels in EV, HEXIM1 OE, and YYFF lines (ii) with quantification (i). (I) ChIP-qPCR for Ser2 and Ser5 Pol II at the GYPA locus in HEXIM1 OE, EV, and shRNA lines. Ser2 and Ser5 Pol II occupancy at the promoter and gene body (i). Pausing index in indicated lines (ii). (J) ChIP-qPCR for Ser2 and Ser5 Pol II at the RPS19 locus in HEXIM1 OE, EV, and shRNA lines. Ser2 and Ser5 Pol II occupancy at the promoter and gene body (i). Pausing index is shown in the indicated lines (ii). *P < .05. Western blot data represent 3 independent blots of distinct cultures. ChIP-PCR data represent 2 to 3 biologic replicates.
Consistent with the role of HEXIM1 in sequestering pTEFb, Western blot demonstrated a decrease in global levels of Ser2 Pol II in both the HEXIM1 OE and YYFF lines (Figure 7H). Furthermore, perturbation of HEXIM1 levels affected Ser2 and Ser5 Pol II occupancy and the pausing index at GYPA, which is highly expressed during erythroid maturation and is significantly upregulated in HEXIM1OE (fold change 1.7, P-adjusted 0.017; supplemental Figure 9). HEXIM1 levels also affected Ser2 and Ser5 Pol II occupancy at RPS19, which is repressed during late maturation (Figure 7I-J). Together, these data suggest that HEXIM1-mediated control of Pol II activity is essential for maintaining appropriate patterns of gene expression during erythroid maturation.
Discussion
Our data revealed that terminally maturing human erythroblasts have a decline in histone PTMs associated with active transcription, without an increase in the abundance of histone PTMs typically associated with heterochromatin. Gene expression instead correlated with dynamic changes in the occupancy of Ser2 and Ser5 Pol II. Together, these data suggest a new paradigm for erythroid maturation, where control of Pol II activity is an essential mechanism of gene regulation before enucleation, with elongation competent pol II becoming a scarce resource allocated to erythroid specific genes during the late stages of erythroid maturation.
The body’s incessant demand for red cells requires the unique coupling of terminal maturation with rapid proliferation of red cell precursors. DNA replication through heterochromatin is slow and typically occurs late in s-phase.35-37 Long-term silencing of genes through energy-expensive heterochromatin formation and maintenance seems wasteful in the setting of a cell that is destined to enucleate within three to four cell divisions. Our data instead suggests that gene expression during terminal maturation is controlled at the level of transcription. Consistent with a central role for Pol II regulation during terminal maturation, constitutive knockout of several different factors that regulate RNA polymerase II activity result in embryonic lethality because of anemia38,39 or are essential for adult erythropoiesis.40,41 Regulation of Pol II appears to be robust at the intermediate erythroblast stage of maturation, where a pausing index >4 is correlated with transcriptional repression. We speculate that pausing may actually be a misnomer in this population of cells, as active transcription is not likely to resume at many of these genes prior to enucleation. Indeed, these genes are enriched for mitochondrial and ribosomal pathways that are repressed during the late stages of erythropoiesis, and they lose occupancy of both Ser2 and Ser5 Pol II during maturation. The correlation between the pausing index and transcriptional repression was less dramatic in the day 10 late-stage erythroblasts, which are close to enucleation. In this cell population, genes that retain elongation competent RNA polymerase II are enriched for essential erythroid genes, such as the globins. We speculate that these genes, whose product are required in high quantities by reticulocytes and erythrocytes, are robustly transcribed until enucleation. To date, transcriptomic studies of erythropoiesis have been limited to steady state assessments. Studies profiling nascent transcription at distinct stages of erythropoiesis are likely to be highly informative.
HEXIM1 is also called hexamethylene bisacetamide-inducible protein 1. Consistent with the ability of hexamethylene bisacetamide to drive the expression of globins in transformed cell lines, HEXIM1 OE promoted the expression of erythroid-specific genes, particularly those involved in heme synthesis. In parallel, HEXIM1 OE repressed many nonerythroid genes and was associated with a decline in the global level of Ser2 Pol II. Expression of YYFF HEXIM1, which impairs pTEFb release from the 7SK complex,34 was also associated with a global decline in Ser2 Pol II but did not activate erythroid-specific genes. Together, these data demonstrated that HEXIM1 plays a role in both transcriptional activation and repression during erythropoiesis and highlight the central role of the HEXIM1–7SK–pTEFb complex in the regulation of the erythroid gene expression program.
Heterochromatin was originally defined by the intensity of staining in cytologic assays42; however, it is now more commonly defined by histone PTMs. During terminal erythroid maturation, the nucleus condenses to approximately 1/10th of its original volume in the span of 3 to 4 cell divisions, and it also stains more intensely with DAPI. Our results indicate that despite these morphologic changes, the abundance of PTMs associated with heterochromatin does not increase, revealing a unique disconnect between heterochromatin defined by DAPI-dense staining and heterochromatin defined by histone PTMs. Despite intensive study, the chromatin factors that drive chromatin condensation during terminal erythroid maturation remain elusive, with information on the terminal maturation of human erythroblasts particularly lacking. Based on the work of our group and others, there are likely multiple chromatin changes that promote chromatin condensation during terminal erythroid maturation, including accumulation of H4K20me16 and declines in specific histone acetylation marks.43,44 Multiple studies have associated active transcription with chromatin decompaction.45,46 Our results bring up the intriguing hypothesis that in conjunction with more active mechanisms of chromatin condensation such as deacetylation of select histone residues, regulation of Pol II, and subsequent decrease in transcription of nonerythroid genes may facilitate chromatin compaction before enucleation.
The mechanisms by which elongation competent Pol II is allocated to erythroid-specific genes during terminal maturation are not well understood. GATA1 target genes appeared to be particularly sensitive to perturbation of HEXIM1 levels, consistent with studies that found cross-talk between GATA1 and pTEFb activity.47,48 N-terminal truncating mutations in GATA1, termed GATA1s, are associated with Diamond Blackfan anemia-like disease49,50 and with the transient myeloproliferative disorder that occurs in infants with Down syndrome.51 The GATA1s mutation fails to activate the erythroid transcription program,52,53 raising the possibility that loss of the N terminus impairs the ability of GATA1 to direct or maintain elongation competent Pol II at erythroid-specific genes. Apart from GATA1s, there are many inherited and acquired anemias for which the causative mutation is known, but the mechanism by which the mutation causes erythroid failure is unclear.54-58 Continued dissection of the molecular mechanisms regulating chromatin structure and gene expression during terminal erythroid maturation will provide an essential context for understanding the mechanisms underlying these anemias and developing effective therapies.
Acknowledgments
This work was supported, in part, by National Institutes of Health, National Institute of Diabetes and Digestive and Kidney Diseases grants P01DK032094, U54DK106857, R01DK124777, and R01DK104920.
Authorship
Contribution: Z.C.M., M.G., T.C., K.L.-G., and H.Y. performed experiments; Z.C.M., K.M., J.M., T.C., C.P., V.P.S., P.G.G., and L.A.S. analyzed data; and Z.C.M., K.M., P.G.G., N.M., and L.A.S. wrote the manuscript.
Conflict-of-interest disclosure: The authors declare no competing financial interests.
Correspondence: Laure Steiner, 601 Elmwood Ave, Box 703, Rochester, NY 14642 ; e-mail: laurie_steiner@urmc.rochester.edu.
The ChIP-seq and RNA-seq data presented in this paper have been deposited in GEO (GSE155849, GSE155848, GSE155847). Other datasets analyzed in this work include GSE128266 (ATAC seq in sorted populations of erythroblasts from CD34+ erythroid cultures), GSE53983 (RNA-seq in sorted populations of populations of erythroblasts from CD34+ erythroid cultures).
The online version of this article contains a data supplement.
There is a Blood Commentary on this article in this issue.
The publication costs of this article were defrayed in part by page charge payment. Therefore, and solely to indicate this fact, this article is hereby marked “advertisement” in accordance with 18 USC section 1734.

This feature is available to Subscribers Only
Sign In or Create an Account Close Modal