

Key Points
Persistence or de novo occurrence of KRAS mutations characterize MM patients at disease relapse.
Next-generation KRAS-targeting constrained ethyl antisense oligonucleotide AZD4785 specifically silences KRAS, leading to an anti-MM effect.

Abstract
Alterations in KRAS have been identified as the most recurring somatic variants in the multiple myeloma (MM) mutational landscape. Combining DNA and RNA sequencing, we studied 756 patients and observed KRAS as the most frequently mutated gene in patients at diagnosis; in addition, we demonstrated the persistence or de novo occurrence of the KRAS aberration at disease relapse. Small-molecule inhibitors targeting KRAS have been developed; however, they are selective for tumors carrying the KRASG12C mutation. Therefore, there is still a need to develop novel therapeutic approaches to target the KRAS mutational events found in other tumor types, including MM. We used AZD4785, a potent and selective antisense oligonucleotide that selectively targets and downregulates all KRAS isoforms, as a tool to dissect the functional sequelae secondary to KRAS silencing in MM within the context of the bone marrow niche and demonstrated its ability to significantly silence KRAS, leading to inhibition of MM tumor growth, both in vitro and in vivo, and confirming KRAS as a driver and therapeutic target in MM.
Introduction
The oncoprotein KRAS is a small GTPase acting as an on-off molecular switch, cycling between inactive and active status depending on its binding to guanosine diphosphate (GDP) or guanosine triphosphate (GTP), respectively. Under physiological conditions, there is a well-maintained balance between GDP- and GTP-bound states, with the first typical of quiescent cells and the latter characterized by engagement of effectors, resulting in activation of signal transduction cascades, such as the MAPK pathway and phosphatidylinositol 3-kinase (PI3K)/AKT and TIAM1/RAC1 cascades.1-5 This equilibrium is lost during tumor transformation, when clonal cells may present with KRAS mutations, leading to a constitutive activation of KRAS and a persistent GTP-bound status, independent of the presence of extracellular stimuli, thus resulting in enhanced tumor cell growth.
Mutant KRAS has been shown to play a crucial role as a driver of solid tumor oncogenesis,5,6 and its occurrence as the most frequently mutated gene has also been reported within the context of multiple myeloma (MM),7-11 demonstrating its crucial role as modulator of MM pathogenesis. MM patients harboring KRAS mutations present with more aggressive disease features (higher bone marrow [BM] tumor burden, lower hemoglobin level, and more frequent bone lytic lesions). Importantly, KRAS, but not NRAS, mutations have been associated with shorter overall and progression-free survival,9 thus suggesting that the negative prognostic relevance of RAS mutations in MM is mainly driven by KRAS mutations. Functionally, mutant KRAS, but not NRAS, has been reported to be associated with MAPK pathway activation, within the context of MM.12,13
Several attempts have been made to therapeutically target KRAS, aiming to achieve an antitumor effect. Indirect strategies have been designed to silence KRAS-mutant downstream effector signaling cascades, including MAPK and PI3K inhibitors, without showing promising clinical activity in KRAS-driven tumors.14 Other studies have described the importance of KRAS-induced metabolic reprogramming within the context of pancreatic ductal adenocarcinoma and lung cancer, thus suggesting an alternative way to indirectly target KRAS, via silencing of specific metabolic targets.15-17 The KRASG12C mutation, which encodes an oncogenic isoform with a glycine-to-cysteine alteration at residue 12, has enabled the design of selective small-molecule inhibitors that covalently bind cysteine-12 and lock the protein in a GDP-bound inactive form.18-21 Second-generation molecules, with improved potency and pharmacokinetic properties, have demonstrated antitumor activity in preclinical studies.21-23 These inhibitors represent promising novel agents, although they can target only the KRASG12C-specific subset among patients with KRAS mutations.
Nucleic acid–based strategies, including antisense oligonucleotides (ASOs), have been adopted in an effort to inhibit, through downregulation, difficult-to-target genes, and recent progress in ASO chemistry has improved the drug-like properties of these molecules.24,25 Recent studies have reported on AZD4785, a high-affinity 2’-4’ constrained ethyl (cEt) residue containing therapeutic ASO developed to potently and selectively target KRAS.26,27 AZD4785 was well tolerated in preclinical models, showing a lack of adverse effects in nonhuman primates and rodents, despite its ability to target both mutant and wild-type (WT) KRAS isoforms, with robust KRAS knockdown ex vivo and antitumor activity within the context of lung cancer.26,27 Importantly, AZD4785 has been designed to bind the KRAS 3' UTR, thus targeting all KRAS-mutant isoforms and resulting in a broad therapeutic window across different tumor types associated with different KRAS-mutant isoforms. Here, we present the primary pharmacology and antitumor activity of the potent cET-modified anti-KRAS ASO as a tool to investigate the functional sequelae of KRAS silencing, within the specific context of MM, taking into consideration the supportive role of the BM niche.
Methods
Cells
A detailed description is provided in the data supplement.
Reagents
A detailed description is provided in the data supplement.
Western blot analysis
A detailed description is provided in the data supplement.
Quantitative reverse transcription polymerase chain reaction analysis
A detailed description is provided in the data supplement.
Transcriptome profiling
A detailed description is provided in the data supplement.
ASOs
Generation 2.5 ASOs were synthesized as previously described. The generation 2.5 human KRAS ASOs used in this study were AZD4785/Ionis 651987 (GCTATTAGGAGTCTTT), Ionis 696018 (CTCTTGATTTGTCAGC), and Ionis 746275 (TCTTGATTTGTCAGCA). Simple letters indicate DNA, underlined letters indicate cEt-modified bases, and italicized letters indicate O-(2-methoxyethyl) bases.27
Growth inhibition, viability, cell cycle, apoptosis, and mitosox assay
A detailed description is provided in the data supplement.
Survival
Survival impact of KRAS expression levels on overall survival (OS) was evaluated by interrogating the CoMMpass data set (IA12 release). The entire cohort was divided in quartiles of KRAS expression, and the first and fourth quartiles were analyzed. Kaplan-Meier plots were generated showing OS. The log-rank test was used to compute P values.
In vivo studies
A detailed description is provided in the data supplement.
Statistical analysis
Data are expressed as the mean ± standard error of the mean. P values were generated using the 2-tailed Student t test. The Student t test was used to compare differences between the 2 groups. A P value <.05 was considered statistically significant. The log-rank test was used to compute P values and analyze survival data.
Results
KRAS mutations during MM disease progression
We analyzed 756 MM patients from the IA12 release of the CoMMpass data set and confirmed KRAS to be the most frequently mutated gene in patients with MM at first diagnosis (supplemental Figure 1A). To corroborate its driver role throughout the disease course, we analyzed the variant allelic frequency (VAF) of its mutations in 27 patients who had serial sampling of relapsed phases. A KRAS mutation was present at any time point in 32.1% of patients (Figure 1A). The mutational spectrum followed a clear missense pattern on known hotspots, typical of oncogenes. Substitutions at codon 61 represented a vast majority, followed by codons 12 and 13 (supplemental Figure 1B). In 39.3%, the mutation only appeared at relapse (Figure 1A). Although there was some VAF variability, we observed that the mutation was never lost at relapse and gained clonality in a majority of patients (Figure 1B), thus suggesting how its oncogenic role is, if anything, more pronounced at late disease stages. Indeed, in an analysis of an independent cohort of late-stage MM patients who were refractory to both immunomodulatory drugs and proteasome inhibitors,28 we further confirmed KRAS to be the most frequently mutated target (supplemental Figure 1C).
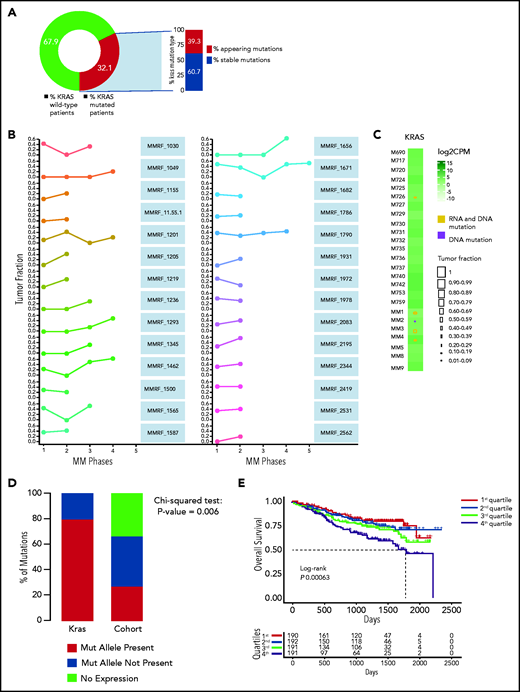
Persistence or de novo occurrence of the KRAS aberration at myeloma relapse and prognostic impact of KRAS in MM. (A) Pie chart of KRAS mutation dynamics in MM patients (n = 27) with serial sampling of relapsed phases. Distribution of KRAS mutations as either appearing mutations or stable. (B) Plot of KRAS tumor fraction trend. Each plot represents a patient. The x-axis shows the stage of sampling (1 = diagnosis and 2-5 = relapse). The y-axis represents the tumor fraction. (C) Heatmap showing KRAS expression levels in relapsed/refractory (RR) MM patients (green). Yellow and purple squares represent the presence or absence, respectively, of expression of the mutation in RNA, and the square size is proportional to its tumor fraction in DNA. (D) Stacked bar chart showing, for KRAS (left) and all other mutations in the RR MM cohort (right), the proportion of mutations that are expressed (green) and not expressed in the presence of gene expression (yellow) and how many genes are not expressed altogether (blue). (E) Kaplan-Meier curves showing the prognostic impact of KRAS in term of OS using the CoMMpass data set. The log-rank test was used to compute P value. First through fourth quartiles are represented in blue, green, red, and dark yellow, respectively. (F) Gene network plot representing pathways significantly upregulated in the fourth KRAS expression quartile compared with the first. Brown dots represent the pathway, with diameter proportional to the size; small dots represent the genes, with each color coded based on its fold change.
Persistence or de novo occurrence of the KRAS aberration at myeloma relapse and prognostic impact of KRAS in MM. (A) Pie chart of KRAS mutation dynamics in MM patients (n = 27) with serial sampling of relapsed phases. Distribution of KRAS mutations as either appearing mutations or stable. (B) Plot of KRAS tumor fraction trend. Each plot represents a patient. The x-axis shows the stage of sampling (1 = diagnosis and 2-5 = relapse). The y-axis represents the tumor fraction. (C) Heatmap showing KRAS expression levels in relapsed/refractory (RR) MM patients (green). Yellow and purple squares represent the presence or absence, respectively, of expression of the mutation in RNA, and the square size is proportional to its tumor fraction in DNA. (D) Stacked bar chart showing, for KRAS (left) and all other mutations in the RR MM cohort (right), the proportion of mutations that are expressed (green) and not expressed in the presence of gene expression (yellow) and how many genes are not expressed altogether (blue). (E) Kaplan-Meier curves showing the prognostic impact of KRAS in term of OS using the CoMMpass data set. The log-rank test was used to compute P value. First through fourth quartiles are represented in blue, green, red, and dark yellow, respectively. (F) Gene network plot representing pathways significantly upregulated in the fourth KRAS expression quartile compared with the first. Brown dots represent the pathway, with diameter proportional to the size; small dots represent the genes, with each color coded based on its fold change.
We next investigated the relationship between KRAS mutations and expression in a cohort of 25 patients for whom DNA and RNA sequencing data were available. KRAS was mutated in 5 of 25 patients, and expression levels were not different between WT and mutant cases (Figure 1C). The KRAS-mutated allele was expressed in all but 1 mutated case with a very low VAF (Figure 1C). This was in sharp contrast to the fraction of expressed mutations overall, which were expressed in only 25% of cases (Figure 1D). In CoMMpass, KRAS mutations were evenly distributed across KRAS expression quartiles (supplemental Table 1), suggesting these are not subject to missense mediated decay and do not affect the stability of RNA. The mutational status of KRAS had no impact on early progression in CoMMpass29 and no impact on survival in independent data sets.7 On the contrary, KRAS expression levels showed an adverse impact of KRAS on OS in the CoMMpass data set; specifically, patients with KRAS expression levels in the highest quartile showed significantly poorer OS compared with the others (log-rank P = .00063; Figure 1E). Gene ontology analysis of the differentially expressed transcripts between the highest and lowest KRAS expression quartiles showed a significant enrichment (false discovery rate <0.01) of KRAS downstream targets in the former, including ERK (Figure 1F; supplemental Figure 1D).
AZD4785 specifically targets KRAS in MM cells
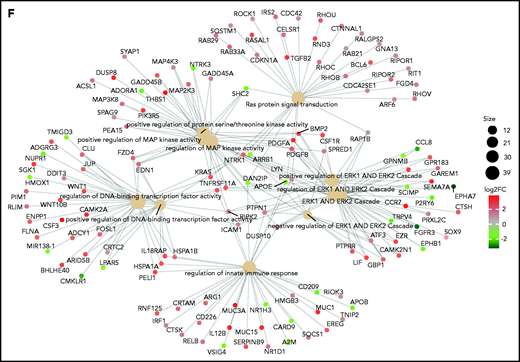
We first evaluated the ability of AZD4785 to specifically inhibit KRAS in both KRAS-mutant (MM1S, MM.1R, RPMI.8226, and KMS20) and WT MM cells (OPM2, KMS11, and KMS12). The U266 line (BRAF mutated) was used as a control for off target effects. AZD4785 treatment depleted KRAS messenger RNA mRNA in all tested MM cell lines irrespective of KRAS mutational status, without affecting NRAS or HRAS expression level (Figure 2A; supplemental Figure 2A). KRAS silencing was not observed in MM cells upon exposure to a control ASO. AZD4785-dependent silencing of KRAS mRNA correlated with a significant decrease in KRAS protein with no impact on NRAS or HRAS (Figure 2B). In KRAS-mutant solid tumors, MAPK pathway activity has been shown to be dependent upon KRAS, and transcript end points have been reported to be robust biomarkers of MAPK pathway activity.27 Therefore, we next investigated the effect of AZD4785 on downstream MAPK transcripts DUSP6 and ETV4; AZD4785 significantly inhibited both DUSP6 and ETV4 in MM cells harboring KRAS mutations, consistent with these cells being dependent upon mutant KRAS for MAPK pathway activity. In contrast, AZD4785 treatment did not inhibit DUSP6 or ETV4 in KRAS WT MM cells, with an upregulation being observed (Figure 2C; supplemental Figure 2B). We next investigated the modulation of DUSP and ETV isoforms in additional MM lines and found inhibition of DUSP and ETV isoforms at the transcriptome level in AZD4785-tretaed KRAS-mutated MM cells (MM.1S and KMS20), as opposed to OPM2 and U266 (Figure 2D). Importantly, the effectiveness of AZD4785 in specifically inhibiting KRAS was also demonstrated in MM patient BM-derived CD138+ cells (supplemental Figure 3A), along with a strong inhibition of DUSP6 and ETV4 (when detectable; supplemental Figure 3B). Consistent with the observed AZD4785-dependent KRAS mRNA depletion, transcriptome profiling of primary BM-derived MM CD138+ cells showed a significant inhibition of KRAS-related gene sets (supplemental Figure 3C). Importantly, a significant decrease of KRAS protein was demonstrated in primary BM-derived MM CD138+ cells, coupled with significant inhibition of phosphorylated ERK (p-ERK; supplemental Figure 3D). Overall, these findings provide evidence for a specific AZD4785-dependent silencing of KRAS in MM cells, including both MM cell lines and primary BM-derived plasma cells, associated with a significant inhibition of the MAPK pathway.
Selective and potent KRAS silencing in MM cells exposed to AZD4785. (A) Human KRAS, HRAS, and NRAS mRNA levels were evaluated by quantitative reverse transcription polymerase chain reaction (qRT-PCR) using the 2−ΔΔCt method, with normalization to glyceraldehyde-3-phosphate dehydrogenase (GAPDH), in MM.1S, U266, MM.1R, RPMI.8226, OPM2, and KMS12 cells after 48 hours of treatment with AZD4785 at the indicated concentrations. ASO control (ctrl)–treated cells were used as control. (B) MM.1S, U266, MM.1R, KMS20, OPM2, and KMS12 cells were cultured in the presence or absence of AZD4785 or ASO ctrl at the indicated concentrations for 48 hours. MM cells were then harvested, and cell lysates were subjected to western blot using anti-KRAS, -HRAS, -NRAS, and -GAPDH antibodies. (C) Human DUSP6 and ETV4 mRNA levels were evaluated by qRT-PCR using the 2−ΔΔCt method, with normalization to GAPDH, in MM.1S, U266, MM.1R, RPMI.8226, OPM2, and KMS12 cells after 48 hours of treatment with AZD4785 at the indicated concentrations. ASO ctrl–treated cells were used as ctrl. (D) MM.1S, KMS20, OPM2, and U266 cells were exposed to AZD4785 (0-3 μM) for 48 hours and subjected to wide transcriptome profiling. Significant inhibition of DUPS- and ETV-related gene sets was found in KRAS-mutated cells, as assessed by gene set enrichment analysis. Normalized enrichment score (NES) was generated by comparing AZD4785-treated vs untreated cells. NES, nominal P value, and false discovery rate (FDR) q value are reported for each plot. n.s., not significant.
Selective and potent KRAS silencing in MM cells exposed to AZD4785. (A) Human KRAS, HRAS, and NRAS mRNA levels were evaluated by quantitative reverse transcription polymerase chain reaction (qRT-PCR) using the 2−ΔΔCt method, with normalization to glyceraldehyde-3-phosphate dehydrogenase (GAPDH), in MM.1S, U266, MM.1R, RPMI.8226, OPM2, and KMS12 cells after 48 hours of treatment with AZD4785 at the indicated concentrations. ASO control (ctrl)–treated cells were used as control. (B) MM.1S, U266, MM.1R, KMS20, OPM2, and KMS12 cells were cultured in the presence or absence of AZD4785 or ASO ctrl at the indicated concentrations for 48 hours. MM cells were then harvested, and cell lysates were subjected to western blot using anti-KRAS, -HRAS, -NRAS, and -GAPDH antibodies. (C) Human DUSP6 and ETV4 mRNA levels were evaluated by qRT-PCR using the 2−ΔΔCt method, with normalization to GAPDH, in MM.1S, U266, MM.1R, RPMI.8226, OPM2, and KMS12 cells after 48 hours of treatment with AZD4785 at the indicated concentrations. ASO ctrl–treated cells were used as ctrl. (D) MM.1S, KMS20, OPM2, and U266 cells were exposed to AZD4785 (0-3 μM) for 48 hours and subjected to wide transcriptome profiling. Significant inhibition of DUPS- and ETV-related gene sets was found in KRAS-mutated cells, as assessed by gene set enrichment analysis. Normalized enrichment score (NES) was generated by comparing AZD4785-treated vs untreated cells. NES, nominal P value, and false discovery rate (FDR) q value are reported for each plot. n.s., not significant.
AZD4785 inhibits MM cell growth and molecular mechanisms underlying AZD4785 antitumor activity
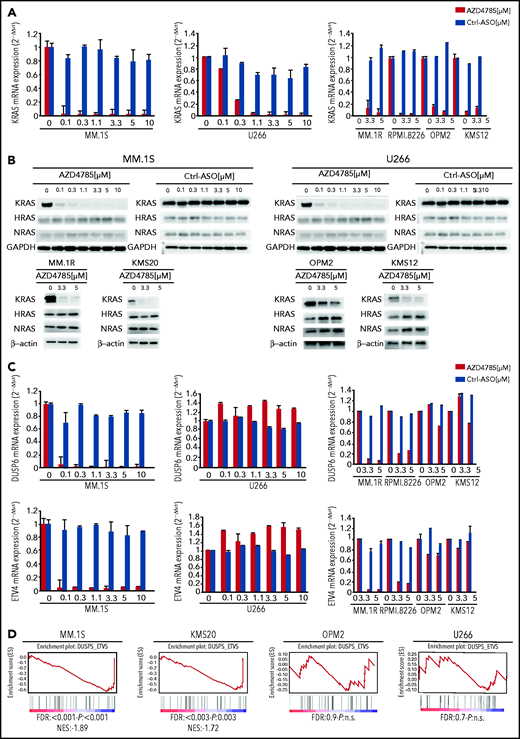
To further understand the molecular mechanisms of AZD4785-dependent activity in MM, transcriptome profiling of AZD4785-treated MM cells, including both KRAS-mutant (MM.1S and KMS20) and WT MM cells (OPM2), was explored. The U266 line was used as control for off-target effects. By performing genome-wide RNA transcriptome profiling, we first documented successful KRAS mRNA silencing in all AZD4785-treated cells, as compared with control (Figure 3A). We next compared AZD4785-treated vs untreated MM cells, leading to the identification of significant differences in their transcriptome in terms of biological processes (Figure 3B). A differential impact on MM cells was shown, depending on their KRAS mutational status, with KRAS WT OPM2 cells showing a lack of differentially expressed genes in AZD4785-treated cells vs control by SAM analysis at the same stringency level (q = 0; fold change >2) as for all other human myeloma cell lines (Figure 3C; supplemental Figure 4A). Of note, only mutant cells showed a significant downmodulation of KRAS- and MAPK-related gene sets; they were either not significantly enriched or demonstrated an opposite trend or showed less profound downmodulation in KRAS WT cells (Figure 3D; supplemental Figure 5A).
AZD4785-dependent modulation of transcriptome of MM cells. (A) Normalized expression levels of KRAS transcript from clariom D profiling in MM.1S, MKS20, OP12, and U266 cell lines after 48 hours of AZD4785 exposure (3 μM), as compared with control (ctrl; q value 0 from SAM analysis); percentage of ctrl of AZD4785-treated vs untreated is shown. (B) Plot of the 20 most significant gene ontology biological process terms enriched in MM1S, KMS20, and U266 differentially expressed (DE) protein coding gene lists. (C) Heatmaps of DE transcripts in AZD4785-treated (3 μM; 48 hours) vs ctrl replicates in MM1S, KMS20, and U266 cell lines by SAM analysis (q = 0; absolute FC value > 2), respectively. Blue-red color scale was used to set rows with mean of 0 and standard deviation 1 of 1. Of note, OPM2 cells only presented with DE KRAS level; no other DE transcripts were observed. (D) MM.1S, KMS20, OPM2, and U266 cells were exposed to AZD4785 (0-3 μM) for 48 hours and subjected to wide transcriptome profiling, showing significant inhibition of KRAS-related gene sets in KRAS-mutated cells, as assessed by gene set enrichment analysis. Normalized enrichment score (NES) was generated by comparing AZD4785-treated vs untreated cells. NES, nominal P value, and false discovery rate (FDR) q value are reported for each plot. *P < .001. IFN-γ, interferon γ; n.s., not significant.
AZD4785-dependent modulation of transcriptome of MM cells. (A) Normalized expression levels of KRAS transcript from clariom D profiling in MM.1S, MKS20, OP12, and U266 cell lines after 48 hours of AZD4785 exposure (3 μM), as compared with control (ctrl; q value 0 from SAM analysis); percentage of ctrl of AZD4785-treated vs untreated is shown. (B) Plot of the 20 most significant gene ontology biological process terms enriched in MM1S, KMS20, and U266 differentially expressed (DE) protein coding gene lists. (C) Heatmaps of DE transcripts in AZD4785-treated (3 μM; 48 hours) vs ctrl replicates in MM1S, KMS20, and U266 cell lines by SAM analysis (q = 0; absolute FC value > 2), respectively. Blue-red color scale was used to set rows with mean of 0 and standard deviation 1 of 1. Of note, OPM2 cells only presented with DE KRAS level; no other DE transcripts were observed. (D) MM.1S, KMS20, OPM2, and U266 cells were exposed to AZD4785 (0-3 μM) for 48 hours and subjected to wide transcriptome profiling, showing significant inhibition of KRAS-related gene sets in KRAS-mutated cells, as assessed by gene set enrichment analysis. Normalized enrichment score (NES) was generated by comparing AZD4785-treated vs untreated cells. NES, nominal P value, and false discovery rate (FDR) q value are reported for each plot. *P < .001. IFN-γ, interferon γ; n.s., not significant.
On the basis of the transcriptome peculiarity of AZD4785-treated MM cells, we next interrogated the functional impact of AZD4785-mediated KRAS depletion on MM cells. MM cells were treated with increasing doses of AZD4785 or ASO control. AZD4785 significantly impaired proliferation and survival of KRAS-mutant MM cells in a dose-dependent fashion, whereas at the same concentrations, KRAS WT cells were not significantly affected (Figure 4A; supplemental Figure 6A). Conversely, healthy donor–derived peripheral blood mononuclear cells were confirmed to be insensitive to AZD4785 treatment (supplemental Figure 6B), thus suggesting a favorable therapeutic index in MM treatment. Consistent with transcriptional biomarkers, AZD4785-treated KRAS-mutant MM cells presented with a more robust downregulation of downstream MAPK and PI3K signaling effectors, including p-ERK, p-MEK, p-RSK90, and p-AKT, respectively, as compared with KRAS WT MM cells (Figure 4B) or U266 (supplemental Figure 6C). Mechanistically, transcriptome analysis of AZD4785-treated MM cells showed a significant inhibition of cell cycle–related gene sets (Figure 4C); these mRNA changes led to a phenotype of MM cells that presented with arrested cell cycle progression, as shown by G0/G1 phase increase and S phase downregulation (Figure 4D). In addition, a potential effect of AZD4785 on modulating a proapoptotic phenotype was investigated, revealing the ability of AZD4785-mediated KRAS depletion to induce apoptosis in KRAS-mutant cells (Figure 4E). Induction of programmed cell death in AZD4785-treated cells was supported by induction and cleavage of PARP and BIM; this was documented in all KRAS-mutated cells (Figure 4E). KRAS WT cells were not significantly affected (supplemental Figure 6D).
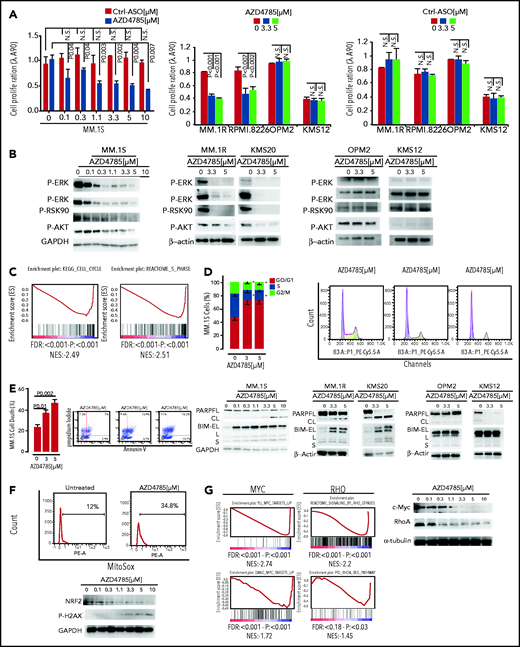
In vitro functional sequelae observed in MM cells exposed to AZD4785. (A) MM.1S, MM.1R, RPMI.8226, OPM2, KMS12, and U266 cells were exposed to AZD4785 or ASO control (ctrl) for 72 hours at the indicated concentrations. Cell proliferation was evaluated by CellTiter Glo. Average of triplicate experiments ± standard deviation (SD) is shown. (B) MM.1S cells were cultured in the presence or absence of AZD4785 (0-10 μM; 48 hours). MM.1R, KMS20, OPM2, and KMS12 cells were cultured in the presence or absence of AZD4785 or ASO ctrl at the indicated concentrations for 48 hours. MM cells were then harvested, and cell lysates were subjected to western blot using anti–p-ERK, –p-MEK, –p-RSK90, –p-AKT, and –glyceraldehyde-3-phosphate dehydrogenase (GAPDH) antibodies. (C) MM.1S cells were exposed to AZD4785 (3 μM) for 48 hours and subjected to wide transcriptome profiling, showing a significant inhibition of different cell cycle–related gene sets, as assessed by gene set enrichment analysis (GSEA). Normalized enrichment score (NES) was generated by comparing AZD4785-treated vs untreated cells. NES, nominal P value, and false discovery rate (FDR) q value are reported for each plot. (D) Cytofluorimetric analysis of cell cycle performed using AZD4785-treated MM.1S cells (48 hours). Average of triplicate experiments ± SD is shown. (E) Annexin V/proteasome inhibitor staining was performed using AZD4785-treated MM.1S cells (48 hours). Average of triplicate experiments ± SD is shown. MM.1S cells were cultured in the presence or absence of AZD4785 at the indicated concentrations for 48 hours. MM.1R, KMS20, OPM2, and KMS12 cells were cultured in the presence or absence of AZD4785 or ASO ctrl at the indicated concentrations for 48 hours. MM cells were then harvested, and cell lysates were subjected to western blot using anti-BIM, -PARP, -GAPDH, and –β-actin antibodies. (F) Cytofluorimetric analysis of mtROS production in MM1S cells exposed to AZD4785 (3 μM; 48 hours). MM.1S cells were cultured in the presence or absence of AZD4785 (0-10 μM; 48 hours). MM.1R, KMS20, OPM2, and KMS12 cells were cultured in the presence or absence of AZD4785 or ASO ctrl (0-10 μM; 48 hours). MM cells were then harvested, and cell lysates were subjected to western blot using anti-NRF2, –p-H2AX, and -GAPDH antibodies. (G) MM.1S cells were exposed to AZD4785 (0-3 μM) for 48 hours and subjected to wide transcriptome profiling, showing a significant inhibition of c-Myc– and ρ-related gene sets, as assessed by GSEA. NES was generated by comparing AZD4785-treated vs untreated cells. NES, nominal P value, and FDR q value are reported for each plot. MM.1S cells were cultured in the presence or absence of AZD4785 (0-10 μM; 48 hours). MM cells were then harvested, and cell lysates were subjected to western blot using anti–c-Myc, -RhoA, and –α-tubulin antibodies. n.s., not significant.
In vitro functional sequelae observed in MM cells exposed to AZD4785. (A) MM.1S, MM.1R, RPMI.8226, OPM2, KMS12, and U266 cells were exposed to AZD4785 or ASO control (ctrl) for 72 hours at the indicated concentrations. Cell proliferation was evaluated by CellTiter Glo. Average of triplicate experiments ± standard deviation (SD) is shown. (B) MM.1S cells were cultured in the presence or absence of AZD4785 (0-10 μM; 48 hours). MM.1R, KMS20, OPM2, and KMS12 cells were cultured in the presence or absence of AZD4785 or ASO ctrl at the indicated concentrations for 48 hours. MM cells were then harvested, and cell lysates were subjected to western blot using anti–p-ERK, –p-MEK, –p-RSK90, –p-AKT, and –glyceraldehyde-3-phosphate dehydrogenase (GAPDH) antibodies. (C) MM.1S cells were exposed to AZD4785 (3 μM) for 48 hours and subjected to wide transcriptome profiling, showing a significant inhibition of different cell cycle–related gene sets, as assessed by gene set enrichment analysis (GSEA). Normalized enrichment score (NES) was generated by comparing AZD4785-treated vs untreated cells. NES, nominal P value, and false discovery rate (FDR) q value are reported for each plot. (D) Cytofluorimetric analysis of cell cycle performed using AZD4785-treated MM.1S cells (48 hours). Average of triplicate experiments ± SD is shown. (E) Annexin V/proteasome inhibitor staining was performed using AZD4785-treated MM.1S cells (48 hours). Average of triplicate experiments ± SD is shown. MM.1S cells were cultured in the presence or absence of AZD4785 at the indicated concentrations for 48 hours. MM.1R, KMS20, OPM2, and KMS12 cells were cultured in the presence or absence of AZD4785 or ASO ctrl at the indicated concentrations for 48 hours. MM cells were then harvested, and cell lysates were subjected to western blot using anti-BIM, -PARP, -GAPDH, and –β-actin antibodies. (F) Cytofluorimetric analysis of mtROS production in MM1S cells exposed to AZD4785 (3 μM; 48 hours). MM.1S cells were cultured in the presence or absence of AZD4785 (0-10 μM; 48 hours). MM.1R, KMS20, OPM2, and KMS12 cells were cultured in the presence or absence of AZD4785 or ASO ctrl (0-10 μM; 48 hours). MM cells were then harvested, and cell lysates were subjected to western blot using anti-NRF2, –p-H2AX, and -GAPDH antibodies. (G) MM.1S cells were exposed to AZD4785 (0-3 μM) for 48 hours and subjected to wide transcriptome profiling, showing a significant inhibition of c-Myc– and ρ-related gene sets, as assessed by GSEA. NES was generated by comparing AZD4785-treated vs untreated cells. NES, nominal P value, and FDR q value are reported for each plot. MM.1S cells were cultured in the presence or absence of AZD4785 (0-10 μM; 48 hours). MM cells were then harvested, and cell lysates were subjected to western blot using anti–c-Myc, -RhoA, and –α-tubulin antibodies. n.s., not significant.
It has been reported that mutant KRAS may be responsible for induction of mitochondrial oxidative stress (mtROS).30 However, other studies have highlighted the existence of opposite effects of oncogenic RAS on redox balance, demonstrating antioxidant pathways in mutant RAS–driven tumor progression. KRAS mutation has been reported to activate NRF2 via the Raf-Mek-Erk pathway, within the context of pancreatic cancer and non–small-cell lung cancer models.31,32 We therefore investigated whether AZD4785 could affect mtROS and demonstrated an increase of mtROS in AZD4785-treated MM cells, paralleled by extensive DNA damage, as shown by enhanced p-H2AX, and inhibition of the oxidative stress–protective transcription factor NRF2 (Figure 4F). These findings therefore provide additional mechanistic insights that could, at least in part, explain the proapoptotic phenotype exerted by AZD4785.
KRAS-mutant cancer cells may display Myc dependency, and the drug-induced cytotoxicity in KRAS-mutant cells is contingent on Myc silencing.33 Moreover, the literature has also reported on the oncogenic role of c-Myc in MM, demonstrating anti-MM effects resulting from BRD4 inhibitor–dependent activity.34 We therefore examined the effect of AZD4785 on MYC protein expression and found that AZD4785 resulted in c-Myc downmodulation in a dose-dependent manner. This was also supported by the reprogramming of the MM cell transcriptome signature, as shown by gene set enrichment analysis (Figure 4G). The AZD4785-dependent inhibition of ERK could explain the observed c-Myc silencing. In addition, the effect on other KRAS effector pathways on the Myc protein, such as Ras homolog family member A (RhoA), was investigated, revealing the ability of AZD4785 to inhibit signaling by Rho GTPases, as shown by gene set enrichment analysis. Importantly, dose-dependent inhibition of RhoA was confirmed at the protein level (Figure 4G).
AZD4785-dependent antitumor activity is maintained even in the presence of the supportive BM milieu
Given the crucial role of the BM niche in supporting MM cell growth and dissemination, we next sought to evaluate the efficacy of AZD4785 in targeting MM cells within the context of the BM milieu by coculture of MM cells with patient-derived BM mesenchymal stromal cells (MSCs). Interestingly, AZD4785 induced a dose-dependent inhibition of cell proliferation in both KRAS-mutant and WT MM cells in the presence of BM MSCs (supplemental Figure 7A). To gain additional insights into the mechanisms underlying the effect of AZD4785 within the context of the BM milieu, we next examined the functional role of AZD4785 in regulating BM stromal cell (BMSC)–dependent adhesion in myeloma. MM cells were cultured with increasing doses of AZD4785 in the presence of BMSCs for 24 hours. We found an AZD4785-dependent impairment of MM cell adhesion toward primary BMSCs in both KRAS-mutant and WT MM cells (supplemental Figure 7B). These effects were further corroborated by the significant inhibition of mRNA levels of SRC and paxillin, key adhesion molecules, in both MM.1S and U266 cells (supplemental Figure 7C). It is important to highlight the effect of the BM microenvironment on increasing KRAS expression, especially in both KRAS-mutant and WT cocultured MM cells (supplemental Figure 7C). This increase in KRAS expression, which is inhibited by AZD4785, may explain why enhanced antiproliferative activity is observed in coculture vs monoculture, even for KRAS WT cells.
AZD4785-dependent anti-MM activity is enhanced when used in combination with conventional anti-MM agents
To investigate whether other standard-of-care anti-MM agents could potentiate the efficacy of AZD4785, we treated MM cells with combinations of AZD4785 and proteasome inhibitors (bortezomib and carfilzomib), immunomodulatory agents (thalidomide, lenalidomide, and pomalidomide), and corticosteroids (dexamethasone). We found that AZD4785-dependent anti-MM activity was enhanced by the combinatory use of steroid, proteasome inhibitors, and immunomodulatory agents but not thalidomide (Figure 5A; supplemental Figure 8A). Particularly, the significantly lower rate of MM cell proliferation driven by the combinatory use of AZD4785 and bortezomib could be explained, at least in part, by a more robust arrest of cell cycle progression, in terms of both higher percentage of tumor cells in sub-G0/G1 and lower percentage in S phase, coupled with potentiated G2/M arrest (Figure 5B). Moreover, AZD4785 plus bortezomib combinatory treatment enhanced apoptotic cell death, as demonstrated by the increase of annexin-V+ apoptotic cells (Figure 5B). This phenotype was further corroborated at the protein level, with the combinatory regimen demonstrating enhanced inhibition of MAPK and PI3K signaling, including p-ERK, p-MEK, p-CRAF, and p-AKT. Of note, AZD4785 was able to overcome the bortezomib-dependent activation of p-AKT (Figure 5C). Given our findings showing AZD4785-dependent induction of mtROS, and considering the ability of proteasome inhibitors to enhance oxidative stress,35-41 we investigated the effect of the combinatory regimen and found a more robust mtROS induction upon AZD4785 plus bortezomib treatment, as compared with each agent used alone (Figure 5D). NF-κB activation represents a target of KRAS-induced oncogenesis.42-45 To gain additional insights into other mechanisms supporting the enhanced anti-MM activity exerted by the combinatory regimen, we evaluated the ability of AZD4785 plus bortezomib to modulate NF-κB activation. Nuclear extracts were investigated, showing that tumor necrosis factor-α–induced nuclear NF-κB/p65 recruitment was significantly lower in tumor cells exposed to AZD4785 used in combination with bortezomib, as compared with each drug used as a single agent (Figure 5E).
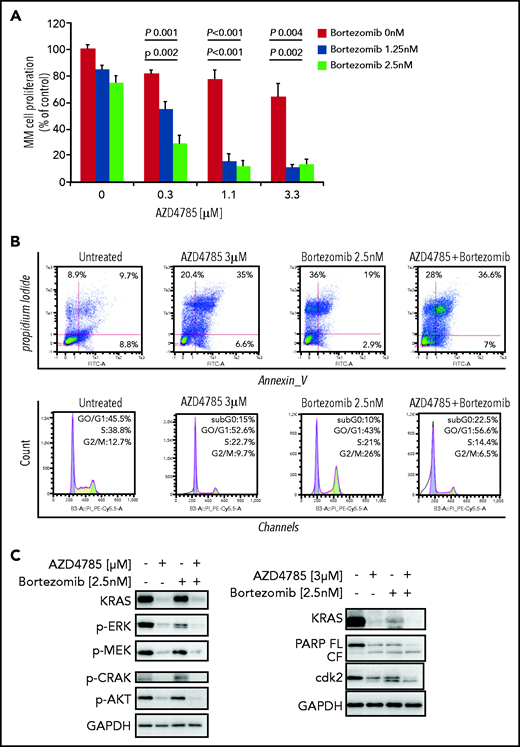
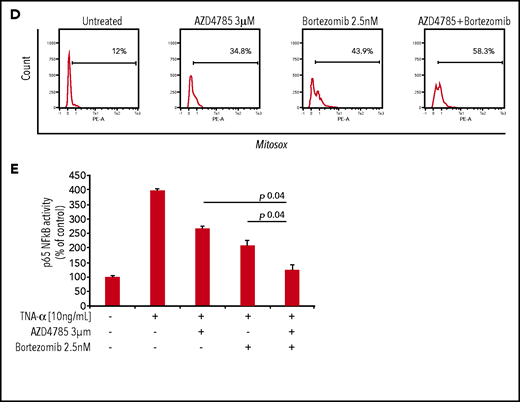
AZD4785 potentiates bortezomib-induced anti-MM activity. MM.1S cells were treated with AZD4785 (0.3-3 μM) or bortezomib (1.25-2.5 nM) as a single agent or in combination. Modulation of cell proliferation at 72 hours (A) and apoptosis and cell cycle progression at 48 hours (B) was tested on MM cells using MTS, annexin V/proteasome inhibitor (PI), and PI staining, respectively. Average of triplicate experiments ± standard deviation is shown. (C) MM cells were treated with AZD4785 (3 μM) for 48 hours in the presence or absence of bortezomib (2.5 nM) added for the last 24 hours of treatment; cell lysates were subjected to western blot using anti-KRAS, –p-ERK, –p-MEK, –p-CRAF, –p-AKT, -PARP, -cdk2, and –glyceraldehyde-3-phosphate dehydrogenase (GAPDH) antibodies. (D) MM cells were treated with either AZD4785 (3 μM) for 48 hours in the presence or absence of bortezomib (2.5 nM) for the last 24 hours of treatment and subjected to cytofluorimetric analysis of mtROS production (Mitosox). (E) MM cells were treated with AZD4785 (3 μM) for 48 hours in the presence of absence of bortezomib (2.5 nM) for the last 4 hours of treatment and then exposed tumor necrosis factor-α (TNF-α; 10 ng/mL) for the last 20 minutes. Nuclear lysates were extracted and subjected to evaluation of p65/NF-κB activation.
AZD4785 potentiates bortezomib-induced anti-MM activity. MM.1S cells were treated with AZD4785 (0.3-3 μM) or bortezomib (1.25-2.5 nM) as a single agent or in combination. Modulation of cell proliferation at 72 hours (A) and apoptosis and cell cycle progression at 48 hours (B) was tested on MM cells using MTS, annexin V/proteasome inhibitor (PI), and PI staining, respectively. Average of triplicate experiments ± standard deviation is shown. (C) MM cells were treated with AZD4785 (3 μM) for 48 hours in the presence or absence of bortezomib (2.5 nM) added for the last 24 hours of treatment; cell lysates were subjected to western blot using anti-KRAS, –p-ERK, –p-MEK, –p-CRAF, –p-AKT, -PARP, -cdk2, and –glyceraldehyde-3-phosphate dehydrogenase (GAPDH) antibodies. (D) MM cells were treated with either AZD4785 (3 μM) for 48 hours in the presence or absence of bortezomib (2.5 nM) for the last 24 hours of treatment and subjected to cytofluorimetric analysis of mtROS production (Mitosox). (E) MM cells were treated with AZD4785 (3 μM) for 48 hours in the presence of absence of bortezomib (2.5 nM) for the last 4 hours of treatment and then exposed tumor necrosis factor-α (TNF-α; 10 ng/mL) for the last 20 minutes. Nuclear lysates were extracted and subjected to evaluation of p65/NF-κB activation.
Systemic delivery of AZD4785 exerts antitumor activity in xenograft MM models
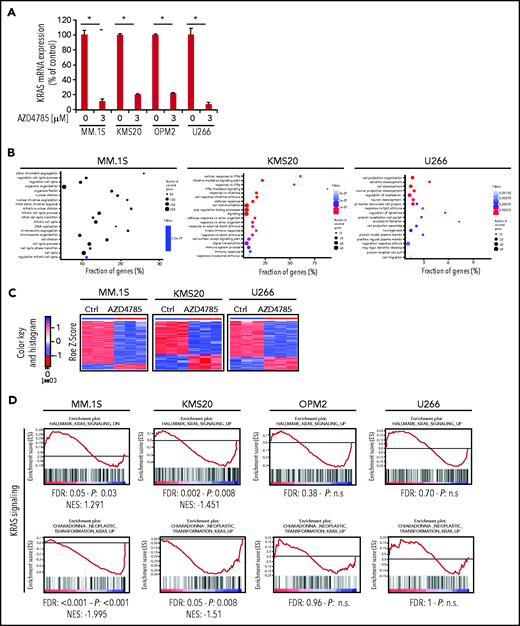
Systemic delivery of AZD4785 in preclinical lung tumor xenograft models has been demonstrated to reach sufficient exposure to achieve robust knockdown of tumor KRAS and drive growth inhibition of KRAS-dependent cell line– and patient-derived subcutaneous tumors.27 Therefore, the impact of AZD4785 on KRAS expression and growth of MM tumors in vivo was initially investigated in subcutaneous xenografts of MM.1S expressing the luciferase reporter gene (MM.1S-Luc). Treatment of mice bearing MM.1S-Luc tumors for 1 week with daily dosing of AZD4785 led to a significant reduction in the expression of KRAS mRNA in tumor tissue (60%; P < .0001) and a reduction in downstream MAPK pathway activity, with a decrease in DUSP6 mRNA (70%; P < .0001; Figure 6A). Consistent with the transcriptome data, immunohistochemical staining confirmed the presence of KRAS protein silencing (Figure 6B). Furthermore, treatment of mice with AZD4785 was able to significantly impair the growth of subcutaneous MM.1S-Luc tumors (P 0.0015; Figure 6C).
![AZD4785 exerts anti-MM activity as demonstrated using different in vivo models . (A-C) CB-17 severe combined immunodeficiency (SCID) mice bearing subcutaneous xenograft MM.1S-Luc tumors were treated with either vehicle (phosphate-buffered saline [PBS]; 5× per week), ASO control (ctrl; 50 mg/kg; 5× per week), or AZD4785 (50 mg/kg; 5× per week). (A) KRAS and DUSP6 mRNA were measured in tumors collected 2 hours post–last dose after 5 days of dosing by quantitative reverse transcription polymerase chain reaction (qRT-PCR). The expression was normalized to POLR2A and expressed relative to PBS. Data are shown as individual tumor data and treatment group geometric mean, and SE. ***P .0001. (B) KRAS protein in tumors collected 2 hours post–last dose after 5 days of dosing was detected by immunohistochemistry. Representative images and quantification of cytoplasmic KRAS (H score) are shown. Data represent individual tumor data and treatment group mean and standard deviation. Magnification ×20. *P = .037; **P = .002. (C) AZD4785 significantly inhibited MM.1S-Luc tumor growth compared with vehicle control (90.69%; P = .0015) 17 days after the initiation of treatment. Data are shown as the geometric mean of tumor volume and SE. (D) SCID/Bg mice were injected with MM.1S GFP+/Luc+ cells and treated with either ASO ctrl (25 mg/kg; 5× per week) or AZD4785 (25 mg/kg; 5× per week). Ex vivo quantification of KRAS membrane expression in harvested femur BM. PBS-treated mice were used as control. Magnification ×20. (E) SCID/Bg mice were injected with MM.1S GFP+/Luc+ cells and treated with ASO ctrl (25 mg/kg; 5× per week) or AZD4785 (25 mg/kg; 5× per week). Kaplan-Meier survival curve; P value determined by the log-rank test. (F) SCID/Bg mice were injected with MM.1S GFP+/Luc+ cells and treated with either vehicle PBS (5× per week), ASO ctrl (25 mg/kg; 5× per week), AZD4785 (25 mg/kg; 5× per week), bortezomib (0.5 mg/kg; 2× per week), or the combination of AZD4785 plus bortezomib. Detection of tumor growth was performed by measuring bioluminescence imaging (BLI) intensity at different time points post–MM cell injection (weeks 2, 3, and 4). (G) Visualization of MM cell BM colonization was evaluated within the indicated BM area of cleared skulls; green, MM.1S GFP+; red, immunostaining for murine CD31; white, bone stromal collagen visualized by second harmonic generation. Inhibition of MM cell colonization with femur BM as evaluated by immunostaining for human (h) CD138. Hematoxylin and eosin (HE) staining (magnification ×20 and ×40). (H) BM mononuclear cells were harvested ex vivo from femurs, subjected to RNA extraction, and evaluated for KRAS, DUSP6, and ETV4 mRNA levels by using qRT-PCR (2−ΔΔCt), with normalization to GAPDH. *P < .05. s.q., subcutaneous.](https://ash.silverchair-cdn.com/ash/content_public/journal/blood/138/18/10.1182_blood.2020010572/4/m_bloodbld2020010572f6a.png?Expires=1769108413&Signature=vEl1vUafPLWF1dNXEZL9mtlvYRJ4HDlwikw4p3xV1vPPZ5vSNiagrTQD7aofKLcerOWjmu6LiijO1PpVEtNdDXi50-2nz5Qr32SpTwK0rxPC8ufFHlDaKWwOGQ8bj4UKb1o7qoxU3IK-8new85TFU-sFN8c6hFiFo9s08bmltU8cSKDL~nNhjbv4TSp5NvRe9TQd9l7WM7AWTFM62Kp1CgPMnOmTCgsYZkAnpM8yfmiAsuHyPuyK~0xQFri2~J~03pL5dztNXc-mixZdGkk3y9eSDQ0Fvch9hLib85bpqSGMGsOXVY5TlAhSGlI1SocuW5V4I03d3HSOKt-QV4LM~A__&Key-Pair-Id=APKAIE5G5CRDK6RD3PGA)
![AZD4785 exerts anti-MM activity as demonstrated using different in vivo models . (A-C) CB-17 severe combined immunodeficiency (SCID) mice bearing subcutaneous xenograft MM.1S-Luc tumors were treated with either vehicle (phosphate-buffered saline [PBS]; 5× per week), ASO control (ctrl; 50 mg/kg; 5× per week), or AZD4785 (50 mg/kg; 5× per week). (A) KRAS and DUSP6 mRNA were measured in tumors collected 2 hours post–last dose after 5 days of dosing by quantitative reverse transcription polymerase chain reaction (qRT-PCR). The expression was normalized to POLR2A and expressed relative to PBS. Data are shown as individual tumor data and treatment group geometric mean, and SE. ***P .0001. (B) KRAS protein in tumors collected 2 hours post–last dose after 5 days of dosing was detected by immunohistochemistry. Representative images and quantification of cytoplasmic KRAS (H score) are shown. Data represent individual tumor data and treatment group mean and standard deviation. Magnification ×20. *P = .037; **P = .002. (C) AZD4785 significantly inhibited MM.1S-Luc tumor growth compared with vehicle control (90.69%; P = .0015) 17 days after the initiation of treatment. Data are shown as the geometric mean of tumor volume and SE. (D) SCID/Bg mice were injected with MM.1S GFP+/Luc+ cells and treated with either ASO ctrl (25 mg/kg; 5× per week) or AZD4785 (25 mg/kg; 5× per week). Ex vivo quantification of KRAS membrane expression in harvested femur BM. PBS-treated mice were used as control. Magnification ×20. (E) SCID/Bg mice were injected with MM.1S GFP+/Luc+ cells and treated with ASO ctrl (25 mg/kg; 5× per week) or AZD4785 (25 mg/kg; 5× per week). Kaplan-Meier survival curve; P value determined by the log-rank test. (F) SCID/Bg mice were injected with MM.1S GFP+/Luc+ cells and treated with either vehicle PBS (5× per week), ASO ctrl (25 mg/kg; 5× per week), AZD4785 (25 mg/kg; 5× per week), bortezomib (0.5 mg/kg; 2× per week), or the combination of AZD4785 plus bortezomib. Detection of tumor growth was performed by measuring bioluminescence imaging (BLI) intensity at different time points post–MM cell injection (weeks 2, 3, and 4). (G) Visualization of MM cell BM colonization was evaluated within the indicated BM area of cleared skulls; green, MM.1S GFP+; red, immunostaining for murine CD31; white, bone stromal collagen visualized by second harmonic generation. Inhibition of MM cell colonization with femur BM as evaluated by immunostaining for human (h) CD138. Hematoxylin and eosin (HE) staining (magnification ×20 and ×40). (H) BM mononuclear cells were harvested ex vivo from femurs, subjected to RNA extraction, and evaluated for KRAS, DUSP6, and ETV4 mRNA levels by using qRT-PCR (2−ΔΔCt), with normalization to GAPDH. *P < .05. s.q., subcutaneous.](https://ash.silverchair-cdn.com/ash/content_public/journal/blood/138/18/10.1182_blood.2020010572/4/m_bloodbld2020010572f6b.png?Expires=1769108413&Signature=2ExcmBTJsF-TDg6LB90acPF8eK3bWftfWd79S2VOptIZdrcrzY0Z~F-lXwyjkh6MyjZwAY~Y3Benso7pam3R1UaIYicrNZAjZImSfyJ1pAEcN4TVPtr8B4197ldMVHp8H1VYS~0G0cNMzx0DjR~lFadPOHPGWwGD6XfpDOR2FZESou4nIeVtAxrJS8sQyuSthw~tXeE2XMjmC0IyQUqX0BLbO3UF4TddRb7LXnHMc5pZIOT-CbhbenpK7zYFSYc0SVq6zNDJqgeb2ztj7mg4OV5w-X9JGq3mECqXPlrx076B0RmPAi0r2NsHyJ96fG8RXsDWPfX3fh62P1i23ZEg4w__&Key-Pair-Id=APKAIE5G5CRDK6RD3PGA)
AZD4785 exerts anti-MM activity as demonstrated using different in vivo models . (A-C) CB-17 severe combined immunodeficiency (SCID) mice bearing subcutaneous xenograft MM.1S-Luc tumors were treated with either vehicle (phosphate-buffered saline [PBS]; 5× per week), ASO control (ctrl; 50 mg/kg; 5× per week), or AZD4785 (50 mg/kg; 5× per week). (A) KRAS and DUSP6 mRNA were measured in tumors collected 2 hours post–last dose after 5 days of dosing by quantitative reverse transcription polymerase chain reaction (qRT-PCR). The expression was normalized to POLR2A and expressed relative to PBS. Data are shown as individual tumor data and treatment group geometric mean, and SE. ***P .0001. (B) KRAS protein in tumors collected 2 hours post–last dose after 5 days of dosing was detected by immunohistochemistry. Representative images and quantification of cytoplasmic KRAS (H score) are shown. Data represent individual tumor data and treatment group mean and standard deviation. Magnification ×20. *P = .037; **P = .002. (C) AZD4785 significantly inhibited MM.1S-Luc tumor growth compared with vehicle control (90.69%; P = .0015) 17 days after the initiation of treatment. Data are shown as the geometric mean of tumor volume and SE. (D) SCID/Bg mice were injected with MM.1S GFP+/Luc+ cells and treated with either ASO ctrl (25 mg/kg; 5× per week) or AZD4785 (25 mg/kg; 5× per week). Ex vivo quantification of KRAS membrane expression in harvested femur BM. PBS-treated mice were used as control. Magnification ×20. (E) SCID/Bg mice were injected with MM.1S GFP+/Luc+ cells and treated with ASO ctrl (25 mg/kg; 5× per week) or AZD4785 (25 mg/kg; 5× per week). Kaplan-Meier survival curve; P value determined by the log-rank test. (F) SCID/Bg mice were injected with MM.1S GFP+/Luc+ cells and treated with either vehicle PBS (5× per week), ASO ctrl (25 mg/kg; 5× per week), AZD4785 (25 mg/kg; 5× per week), bortezomib (0.5 mg/kg; 2× per week), or the combination of AZD4785 plus bortezomib. Detection of tumor growth was performed by measuring bioluminescence imaging (BLI) intensity at different time points post–MM cell injection (weeks 2, 3, and 4). (G) Visualization of MM cell BM colonization was evaluated within the indicated BM area of cleared skulls; green, MM.1S GFP+; red, immunostaining for murine CD31; white, bone stromal collagen visualized by second harmonic generation. Inhibition of MM cell colonization with femur BM as evaluated by immunostaining for human (h) CD138. Hematoxylin and eosin (HE) staining (magnification ×20 and ×40). (H) BM mononuclear cells were harvested ex vivo from femurs, subjected to RNA extraction, and evaluated for KRAS, DUSP6, and ETV4 mRNA levels by using qRT-PCR (2−ΔΔCt), with normalization to GAPDH. *P < .05. s.q., subcutaneous.
AZD4785 exerts anti-MM activity as demonstrated using different in vivo models . (A-C) CB-17 severe combined immunodeficiency (SCID) mice bearing subcutaneous xenograft MM.1S-Luc tumors were treated with either vehicle (phosphate-buffered saline [PBS]; 5× per week), ASO control (ctrl; 50 mg/kg; 5× per week), or AZD4785 (50 mg/kg; 5× per week). (A) KRAS and DUSP6 mRNA were measured in tumors collected 2 hours post–last dose after 5 days of dosing by quantitative reverse transcription polymerase chain reaction (qRT-PCR). The expression was normalized to POLR2A and expressed relative to PBS. Data are shown as individual tumor data and treatment group geometric mean, and SE. ***P .0001. (B) KRAS protein in tumors collected 2 hours post–last dose after 5 days of dosing was detected by immunohistochemistry. Representative images and quantification of cytoplasmic KRAS (H score) are shown. Data represent individual tumor data and treatment group mean and standard deviation. Magnification ×20. *P = .037; **P = .002. (C) AZD4785 significantly inhibited MM.1S-Luc tumor growth compared with vehicle control (90.69%; P = .0015) 17 days after the initiation of treatment. Data are shown as the geometric mean of tumor volume and SE. (D) SCID/Bg mice were injected with MM.1S GFP+/Luc+ cells and treated with either ASO ctrl (25 mg/kg; 5× per week) or AZD4785 (25 mg/kg; 5× per week). Ex vivo quantification of KRAS membrane expression in harvested femur BM. PBS-treated mice were used as control. Magnification ×20. (E) SCID/Bg mice were injected with MM.1S GFP+/Luc+ cells and treated with ASO ctrl (25 mg/kg; 5× per week) or AZD4785 (25 mg/kg; 5× per week). Kaplan-Meier survival curve; P value determined by the log-rank test. (F) SCID/Bg mice were injected with MM.1S GFP+/Luc+ cells and treated with either vehicle PBS (5× per week), ASO ctrl (25 mg/kg; 5× per week), AZD4785 (25 mg/kg; 5× per week), bortezomib (0.5 mg/kg; 2× per week), or the combination of AZD4785 plus bortezomib. Detection of tumor growth was performed by measuring bioluminescence imaging (BLI) intensity at different time points post–MM cell injection (weeks 2, 3, and 4). (G) Visualization of MM cell BM colonization was evaluated within the indicated BM area of cleared skulls; green, MM.1S GFP+; red, immunostaining for murine CD31; white, bone stromal collagen visualized by second harmonic generation. Inhibition of MM cell colonization with femur BM as evaluated by immunostaining for human (h) CD138. Hematoxylin and eosin (HE) staining (magnification ×20 and ×40). (H) BM mononuclear cells were harvested ex vivo from femurs, subjected to RNA extraction, and evaluated for KRAS, DUSP6, and ETV4 mRNA levels by using qRT-PCR (2−ΔΔCt), with normalization to GAPDH. *P < .05. s.q., subcutaneous.
To further confirm the results obtained using the subcutaneous xenograft mouse model, an additional in vivo study was performed adopting a disseminated humanized MM model.46-48 We first provided evidence for demonstrating the ability of AZD4785 to inhibit KRAS protein, as shown by immunohistochemistry performed ex vivo on harvested femur BM (Figure 6D). Importantly, AZD4785-treated mice showed improved survival (Figure 6E).
We investigated the antitumor effect of AZD4785 used as monotherapy or in combination with bortezomib, evaluating both tumor progression and MM cell dissemination in vivo. Both bortezomib and AZD4785 as single agents delayed MM tumor growth as compared with control mice, whereas the combinatory regimen exerted a significantly higher antitumor effect (Figure 6F), thus further corroborating our findings. Reduced cell dissemination was also confirmed by using 2-photon microscopy, looking at the skull bone marrow niches (Figure 6G). Importantly, proof of inhibited MM cell colonization was also demonstrated by reduced CD138+ MM colonization ex vivo from harvested femur BM (Figure 6G).
We further confirmed that the observed antitumor effect resulted from efficacious AZD4785-induced KRAS mRNA inhibition, along with DUSP6 and ETV4 suppression, which was even more significant with the AZD4785 plus bortezomib combinatory regimen (Figure 6H). No difference was observed in terms of HRAS and NRAS modulation (supplemental Figure 9A). We next validated the modulation of NF-κB ex vivo, showing a significantly higher inhibition of NF-κB activation in MM cells harvested from the femur BM of mice exposed to the combinatorial use of AZD4785 and bortezomib (supplemental Figure 9B).
Taken together, these findings provide evidence that KRAS-mutant MM is dependent on KRAS for tumor growth and progression in preclinical in vivo models of the disease. Treatment with the KRAS-targeting ASO AZD4785 can delay MM tumor growth in both subcutaneous and disseminated models. Importantly, the antitumor effect can be enhanced by combining AZD4785 with bortezomib.
Discussion
AZD4785 is a first-in-class next-generation cEt ASO compound that selectively targets and downregulates KRAS mRNA, leading to silencing of the related protein. It acts as a selective KRAS inhibitor, without activity against NRAS or HRAS. Importantly, it has been designed to specifically bind to the 3' UTR of KRAS, aiming to target and inhibit all KRAS-mutant isoforms, thus displaying broader therapeutic potential across several KRAS-dependent tumor types.
We now report KRAS to be the most frequently mutated gene not only in the setting of newly diagnosed MM, but in the relapse setting as well; we found KRAS mutations at relapse in 39.3% of mutated patients. Moreover, KRAS somatic aberrations at diagnosis were stable throughout the disease course, thus suggesting a clear oncogenic role in MM chemoresistance. These findings prompted us to investigate the possibility of targeting KRAS mutants in MM using AZD4785 and of using AZD4785 as a tool to dissect the functional sequelae of KRAS targeting in MM.
To determine the validity of AZD4785 as a tool for investigating KRAS silencing in MM, we first confirmed that MM cells showed productive uptake of AZD4785. In the absence of a delivery reagent, AZD4785 led to specific and potent knockdown of KRAS at both mRNA and protein levels. The doses that were shown to induce significant KRAS silencing are considered to be clinically achievable, as previously reported.27,49 This effect was also documented using primary MM BM-derived plasma cells. Therefore, we could use AZD4785 as a tool to investigate the potential mechanisms underlying AZD4785-dependent anti-MM activity resulting from a selective KRAS silencing in MM cells and to provide functional validation of silenced KRAS in MM.
AZD4785 led to modulation of the expected KRAS-regulated pathways, including both PI3K/AKT and ERK.50-52 Of note, Myc has been reported to act as a critical regulator of KRAS-mediated oncogenesis;53 indeed, MAPK induces ERK1/2 phosphorylation, leading to Myc protein stability.54 We now provide evidence of the ability of AZD4785-dependent KRAS inhibition to downregulate c-Myc expression, resulting from AZD4785-mediated inhibition of PI3K/AKT, ERK, and Rho signaling.
Increased mtROS was demonstrated in AZD4785-treated MM cells, paralleled by extensive DNA damage, as shown by enhanced p-H2AX, together with inhibition of the oxidative stress–protective transcription factor NRF2. Overall, our finding of AZD4785-induced mtROS, paralleled by inhibition of NRF2, points toward a potential antioxidant pathway exerted by KRAS mutation in MM. It has been shown that upregulation of NRF2 is, at least in part, KRAS driven, thus contributing to cell proliferation and chemoresistance within the context of pancreatic ductal adenocarcinoma.55 Moreover, it has been reported that c-Myc may increase NRF2 transcription.56 Therefore, considering the AZD4785-dependent c-Myc inhibition, we may hypothesize that the observed NRF2 inhibition could result from both reduced c-Myc–dependent negative feedback and AZD4785-induced mtROS responsible for the downregulation of the oxidative stress–protective transcription factor NRF2.
The phenotype acquired by AZD4785-treated MM cells was characterized by the inhibition of tumor cell proliferation, arrest of MM cell cycle progression, and induction of apoptosis. The more profound phenotypic consequence of AZ4785 treatment in KRAS-mutant MM cells compared with KRAS WT MM cells, with minimal or absent inhibition of MM cell growth, when KRAS WT cells were exposed to AZD4785 in the absence of primary MM BM-derived MSCs should be noted. Of note, within an in vitro system mimicking MM biology, we were able to demonstrate for the first time the upregulation of KRAS in MM cells when in contact with BMSCs, which ultimately led to an increased sensitivity of KRAS WT MM cells to AZD4785. We may therefore hypothesize that the different KRAS expression level may, at least in part, drive a different sensitivity to AZD4785, with higher baseline of KRAS expression leading to greater efficacy of the cET-modified anti-KRAS ASO. These findings are consistent with previous studies reporting a correlation between KRAS addiction and KRAS amplification, with the latter being a useful biomarker for response to therapeutic strategies targeting KRAS-addicted neoplasias.57-59 Indeed, our findings indicate how MM patient–derived BM tumor plasma cell cases were sensitive to AZD4785, independent of mutational KRAS status.
The antitumor activity of AZD4785 in MM was documented using 2 different in vivo models, showing an AZD4785-dependent anti-MM effect not only as monotherapy but also in combination with bortezomib. Importantly, the combined KRAS silencing and proteasome inhibition resulted in a more potent anti-MM effect, with the demonstration of stronger inhibition of p-ERK and p-AKT, thus suggesting the ability of AZD4785 to overcome bortezomib-induced p-AKT upregulation.
AZD4785 downregulates key signaling pathways regulated by KRAS, including both MAPK and PI3K/AKT, which are key signaling cascades involved in the modulation of cell survival, cell cycle progression, cytoskeletal organization, and cell dissemination. In particular, stronger inhibition was documented in KRAS-mutant MM cells compared with KRAS WT MM cells. Of note, although MEK/ERK inhibition was reported to neutralize ERK phosphorylation without altering the AKT phosphorylation status of MM cells,60 we now demonstrate a concomitant p-AKT and p-ERK blockade upon AZD4785 treatment, which is likely to be required for robust antitumor activity and prevention of resistance through parallel pathway activation.
ASO-mediated concomitant knockdown of both WT and mutant KRAS not only has antitumor activity in KRAS-driven tumors, but also importantly has a confirmed preclinical safety profile in both rodent and nonhuman primate species. Tolerability of ASO-mediated WT KRAS knockdown in mice was confirmed using potent murine selective cEt-KRAS ASOs and in cynomolgus monkeys with AZD4785, which can effectively target both human and monkey KRAS.49 The tolerated safety profile may be explained, at least in part, by the lack of AZD4785-induced silencing of NRAS and HRAS isoforms, which may be able to compensate for the specific AZD4785-induced KRAS depletion. Importantly, robust KRAS ASO-induced WT KRAS knockdown in murine and monkey liver was shown to have minimal impact on known MAPK pathway–regulated transcripts, supporting the hypothesis that the functional loss of KRAS in normal adult tissues may be compensated for by other RAS isoforms.
In summary, our findings demonstrate the persistence or de novo occurrence of the KRAS aberration at MM disease relapse and provide evidence for the efficacious targeting of KRAS mutants in MM, resulting in antitumor activity.
Acknowledgments
This work was supported by AstraZeneca (Cambridge, United Kingdom), the European Hematology Association, Italian Association for Cancer Research (AIRC) grant IG 24689, the Fondazione Regionale per la Ricerca Biomedica, Transcan-2 ERA-NET, and the Associazione Italiana Contro le Leucemie-Linfomi e Mieloma Brescia (A.M.R.); by AIRC grant IG 16722 and the Italian Ministry of Health (Ricerca Corrente 2019) (A.N.); Fondazione Cariplo grant 2016-0570 (A.G.); AIRC grant IG 2019-ID.23151 (R. Ronca); by a fellowship from Fondazione Veronesi (F.M.); and by grant 817997 from the European Research Council under the EU Horizon 2020 Research and Innovation Programme (N.B.).
Authorship
Contribution: A.M.R., A. Sacco, and C.F. conceived and designed the study; A.M.R., A. Sacco, C.F., M.M., and S.R. wrote the manuscript; A.M.R., M.M., and S.R. supervised the study; A. Sacco, C.F., A.G., and V.P. performed in vitro studies; A.S.R. and R.M. identified AZD4785; A.B., R. Ribolla, A.T., C.C., and G.R. provided patient samples; B.Z. and N.B. performed KRAS mutational analysis; C.F., R. Ronca, and F.M. performed xenograft disseminated in vivo studies; C. Ravelli and S.M. performed 2-photon microscopy; A.M.R., S.R., A.N., J.H., H.A., G.B., A.S.R., and M.P. reviewed the manuscript; K.T. and V.F. performed transcriptome profiling; B.W. and H.C. were responsible for design, acquisition, analysis, and interpretation of some in vivo studies; C. Rooney was responsible for design, data analysis and interpretation, and manuscript review; S.E.W. and P.L.M. were responsible for design, acquisition, analysis, and interpretation of immunohistochemical data; A. Staniszewska was responsible for acquisition and analysis of RT-PCR data of some in vivo study samples; and L.H. designed some in vivo studies.
Conflict-of-interest disclosure: A.M.R. reports research funding from AstraZeneca, the European Hematology Association, Transcan-2 ERA-NET, and the Italian Association for Cancer Research and honoraria from Amgen, Celgene, and Janssen. N.B. reports honoraria from Amgen, Celgene, and Janssen. A.S.R. and R.M. are employees and shareholders of Ionis Pharmaceuticals. B.W., H.C., C. Rooney, S.E.W., P.L.M., M.M., H.A., A. StaniszewskaSt., L.H., and S.R. are employees and shareholders of AstraZeneca Pharmaceuticals. The remaining authors declare no competing financial interests.
Correspondence: Aldo M. Roccaro, ASST Spedali Civili di Brescia, Clinical Research Development and Phase I Unit, P.le Spedali Civili di Brescia, n. 1 - 25123, Brescia, BS, Italy; e-mail: aldomaria.roccaro@asst-spedalicivili.it.
CoMMpass data: dbGaP accession code phs000748.v1.p1; variant call format: European Genome-phenome Archive accession no. EGAD00001005098; transcriptome profiling: Gene Expression Omnibus accession no. GSE149833.
The online version of this article contains a data supplement.
The publication costs of this article were defrayed in part by page charge payment. Therefore, and solely to indicate this fact, this article is hereby marked “advertisement” in accordance with 18 USC section 1734.

This feature is available to Subscribers Only
Sign In or Create an Account Close Modal