

Key Points
LSD1 inhibition promotes γ-globin induction but blocks erythroid differentiation.
Simultaneous LSD1 and RUNX1 inactivation of erythroid progenitors promotes erythroid differentiation and γ-globin synthesis.

Abstract
Histone H3 lysine 4 methylation (H3K4Me) is most often associated with chromatin activation, and removing H3K4 methyl groups has been shown to be coincident with gene repression. H3K4Me demethylase KDM1a/LSD1 is a therapeutic target for multiple diseases, including for the potential treatment of β-globinopathies (sickle cell disease and β-thalassemia), because it is a component of γ-globin repressor complexes, and LSD1 inactivation leads to robust induction of the fetal globin genes. The effects of LSD1 inhibition in definitive erythropoiesis are not well characterized, so we examined the consequences of conditional inactivation of Lsd1 in adult red blood cells using a new Gata1creERT2 bacterial artificial chromosome transgene. Erythroid-specific loss of Lsd1 activity in mice led to a block in erythroid progenitor differentiation and to the expansion of granulocyte-monocyte progenitor–like cells, converting hematopoietic differentiation potential from an erythroid fate to a myeloid fate. The analogous phenotype was also observed in human hematopoietic stem and progenitor cells, coincident with the induction of myeloid transcription factors (eg, PU.1 and CEBPα). Finally, blocking the activity of the transcription factor PU.1 or RUNX1 at the same time as LSD1 inhibition rescued myeloid lineage conversion to an erythroid phenotype. These data show that LSD1 promotes erythropoiesis by repressing myeloid cell fate in adult erythroid progenitors and that inhibition of the myeloid-differentiation pathway reverses the lineage switch induced by LSD1 inactivation.
Introduction
Sickle cell disease (SCD) results from a single amino acid change in the human β-globin protein. Hemoglobin S polymerizes in hypoxic red blood cells (RBCs) causing RBC deformation, increased fragility, and destruction, leading to pathological organ damage, episodic acute pain, and early death.1,2 Studies have shown that the pathophysiology and severity of SCD are reduced by increased levels of fetal hemoglobin (HbF).2 β-thalassemia major (TM; aka Cooley’s anemia) can arise through the inheritance of many mutations that lead to diminished or altered expression of the adult β-globin gene.3 However, coinheritance of hereditary persistence of HbF alleles, leading to a benign elevation in HbF levels, significantly ameliorates SCD and TM disease pathology, making HbF reactivation a rational therapeutic target for treating the β-globinopathies.4-9 Notably, mutations in the binding sites for multiple transcription factors (TFs) in the γ-globin promoters, including Bcl11a, LRF, GATA1, and DRED, confer hereditary persistence of HbF.9-13 The corepressor subunits of DRED and BCL11a include a scaffold protein, NCoR1, that recruits the epigenetic modifying enzymes DNMT1 and LSD1 to chromatin TF binding sites11,14-16.
LSD1/KDM1A is a histone modifying enzyme that removes methyl groups from histone H3 (H3K4 and H3K9).17,18 Inhibition of LSD1 derepresses γ-globin transcription, leading to induction of HbF in cultures of human hematopoietic stem and progenitor cells (HSPCs)16 at levels that are of possible therapeutic benefit to patients with SCD or TM. In vivo administration of RN-1, an LSD1 inhibitor (LSD1i), robustly activated HbF synthesis and significantly reduced the pathological consequences of SCD in animal models.19-21 These data indicate that safe efficient LSD1 inhibition would lead to robust HbF induction in human erythroid cells.
Given the possible benefit of LSD1 inhibition for HbF induction, it becomes important to understand its broader activities. Pan-hematopoietic Lsd1 inactivation using Mx1Cre22 or by messenger RNA (mRNA) knockdown23 in mice impaired erythropoiesis and expanded HSPCs, demonstrating that LSD1 plays multiple roles in hematopoiesis. Thus, a detailed mechanistic understanding of how LSD1 inhibition specifically affects definitive erythropoiesis is a critical issue that must be addressed before we can assess the genuine therapeutic potential of LSD1 inhibition.
Here, we report the generation of erythroid-specific inducible Cre mice that allowed us to conditionally inactivate Lsd1 in adult erythroid cells. During the analysis of erythroid-restricted Lsd1 conditional knockout (CKO) animals, we discovered that LSD1 plays a critical role in repressing myeloid gene expression. Furthermore, we found that most granulocyte-monocyte progenitors (GMPs) produced upon Lsd1 loss were derived from erythroid progenitors and that PU.1, a key myeloid TF, was induced in erythroid colony-forming unit (CFU-E) cells. We discovered that pharmacological inhibition of LSD1 in erythroid-directed human CD34+ HSPCs reactivated myeloid regulatory genes and impaired erythroid differentiation. Finally, we showed that simultaneous inactivation of Lsd1 and either Pu.1 or Runx1 rescued the erythroid differentiation defect caused by inhibition of LSD1 alone. Thus, LSD1 inactivation impairs erythropoiesis through a mechanism in which myeloid gene expression is induced in erythroid progenitors, leading to an erythroid-to-myeloid cell fate conversion. Furthermore, coincident inhibition of LSD1 and myeloid differentiation rescue the Lsd1 loss-of-function (LOF)-induced block in erythroid differentiation.
Methods
Erythroid differentiation of human CD34+ cells
Human CD34+ HSPCs were purchased from the Fred Hutchinson Cancer Research Center and were cultured and differentiated into mature erythroid cells using a standard 3-phase culture system.24 Experiments were repeated using cells from ≥2 donors.
LSD1 inhibition assay
A fluorescent in vitro LSD1 inhibition assay (Cayman Chemicals) was performed according to the manufacturer’s instructions.
HPLC
On the day that erythroid differentiation terminated, cells were washed with phosphate-buffered saline, and the cell pellets were lysed; the contents were then subjected to high-performance liquid chromatography (HPLC) analyses using a Bio-Rad CDM System CDM 5.1 VII instrument.
Total RNA isolation and qRT-PCR analyses
Total RNA was isolated from cells using TRIzol reagent (Thermo Fisher Scientific) or an RNeasy Micro Kit (QIAGEN). Complementary DNA was synthesized using SuperScript III Reverse Transcriptase (Thermo Fisher Scientific). Quantitative reverse transcriptase polymerase chain reaction (qRT-PCR) was performed using FastStart SYBR Green MasterMix on an ABI StepOnePlus instrument (Thermo Fisher Scientific). Sequences of all primers used in this study are listed in supplemental Table 1 (available on the Blood Web site).
BAC recombination
Bacterial artificial chromosome (BAC) recombination and the 196-kbp mouse Gata1 BAC clone (RP23-443E19) were described previously.25,26 Recombinant BAC DNA was purified by NucleoBond BAC100 and submitted for microinjection into fertilized C57BL6 ova (Transgenic Animal Model core, University of Michigan).
Mice
Two CreERT2 BAC lines (G1BCreERT2), L245 and L259, were interbred with Cre reporter mice R26 TdTomato27 (The Jackson Laboratory) and/or Lsd1f/f mutant mice.28G1BCreERT2 activity in 8- to 12-week-old mice was induced by tamoxifen injection (Tx; 2 mg intraperitoneally on alternate days for 14 days; 7 injections). All animal procedures were approved by the University of Michigan Institutional Animal Care and Use Committee (Protocol PRO00009778: 9 July 2020 to 9 July 2023).
Peripheral blood analyses
Peripheral blood was analyzed on a Hemavet, as per the manufacturer’s instructions.
Genomic DNA qPCR
Genomic DNAs were purified from flow-sorted mouse basophilic erythroblasts (BasoEs). To quantify Lsd1 deletion efficiency, quantitative polymerase chain reaction (qPCR) was performed with Lsd1 primer pairs that annealed to genomic sequences within (P1) or outside of (P2) the 2 LoxP sites flanking Lsd1 exon 6 (Figure 3H).28,29
Flow cytometry
Total bone marrow (BM) isolation and subsequent antibody or annexin V staining protocols were described previously.30,31 Antibodies used for flow cytometry are listed in supplemental Table 2.
Chromatin immunoprecipitation
Chromatin immunoprecipitation (ChIP) assays were conducted as described previously.15
Colony-forming unit assay
Isolated total mouse BM cells or purified sorted cell populations were counted and seeded into MethoCult M3434 or M3334 (STEMCELL Technologies), according to the manufacturer’s instructions, for enumeration of burst-forming unit-erythroid (BFU-E), colony-forming unit-granulocyte, monocyte (CFU-GM), colony-forming unit-granulocyte, erythroid, monocyte, megakaryocyte (CFU-GEMM), or CFU-E colonies. After differentiation of human CD34+ HSPCs for 4 or 7 days, cells were seeded into MethoCult H4435 Enriched (STEMCELL Technologies), according to the manufacturer’s instructions, for enumeration of BFU-E, CFU-GM, CFU-GEMM, and CFU-E colonies.
CRISPR HUDEP2 knockouts
Genome editing of PU.1 or RUNX1 in HUDEP2 cells was accomplished as described previously.15 Four clones of each were generated using 2 single guide RNAs (sgRNAs). Properly targeted mutation was confirmed by Sanger sequencing (supplemental Figures 13 and 14), whereas nontargeting sgRNAs containing scrambled guides were used to generate negative control clones. One clone (P2-4) likely bore a large genomic DNA deletion (data not shown).
Results
LSD1i’s induce HbF but block erythroid differentiation
LSD1i’s (eg, TCP) initially showed promise for use as SCD therapeutics because of their ability to stimulate abundant fetal γ-globin expression.16 However, all commercial inhibitors that we tested also partially blocked erythroid differentiation. One novel LSD1i examined here, CCG50, was designed to bind reversibly to the catalytic center of LSD1, thus differing from many of the current commercial inhibitors. We found that CCG50, which is structurally identical to GSK-690, efficiently and specifically inhibited LSD1 with an 50% inhibitory concentration of 115 nM (supplemental Figure 1A).
To determine whether CCG50 (LSD1i) induced γ-globin expression, we tested human CD34+ HSPCs (supplemental Figure 1B).24,32 In this assay, human proerythroblasts first express CD71 (transferrin receptor), followed by CD235a (glycophorin A), and then lose CD71 as cells mature.24,33 Most cells expressed 1 (14% CD71) or both (70% CD71+ CD235a+) antigens by culture day 7 (supplemental Figure 1C). After differentiation induction following the removal of hydrocortisone and interleukin-3, >90% of untreated cells expressed both erythroid markers by day 11, whereas by day 18, 20% of the cells had matured to become CD71− (Figure 1A).
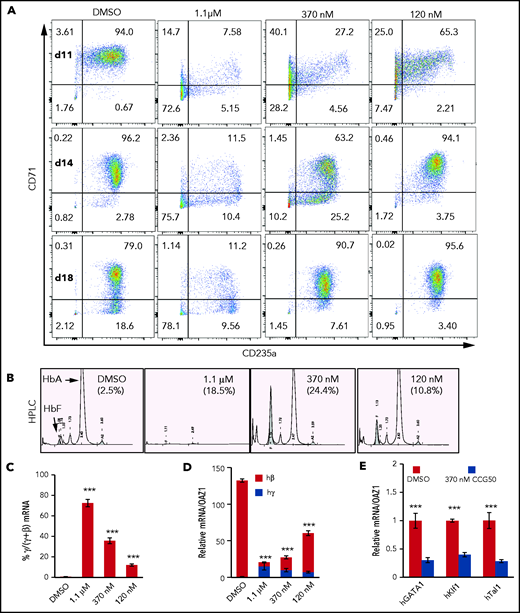
LSD1 inhibition activates γ-globin transcription but blocks erythroid differentiation. (A) Representative flow cytometry plots of human CD34+ HSPCs undergoing erythroid differentiation after 11, 14, and 18 days (d) in culture. Cells were treated with DMSO or with 1.1 μM, 370 nM, or 120 nM LSD1i (CCG050). Cells were monitored for CD71 and CD235a cell surface markers, whose acquisition reflect maturing erythroid differentiation stages.33 Numbers in each quadrant indicate the percentage of gated cells. Results are representative of experiments performed using CD34+ HSPCs from 2 healthy adult donors. (B) Representative HPLC chromatograms of day-18 cells cultured or not with CCG050 from panel A. HbF percentages are indicated in parentheses. (C) Percentage of γ-globin transcripts in total β-like (γ+β) globin mRNAs at day 14. (D) mRNA abundance of γ-globin and β-globin (normalized to OAZ1 internal control mRNA)15 at day 14. The γ-globin transcript abundance in DMSO-treated cells was arbitrarily set at 1. (E) Transcript levels of key erythroid TFs GATA1, KLF1, and TAL1 (normalized to OAZ1 mRNA) were reduced in day-14 cells treated with 370 nM LSD1i CCG050. Transcript levels of each mRNA in DMSO-treated cells were arbitrarily set at 1. Data are mean ± standard deviation from 3 replicates. ***P < .001, unpaired Student t test. h, human.
LSD1 inhibition activates γ-globin transcription but blocks erythroid differentiation. (A) Representative flow cytometry plots of human CD34+ HSPCs undergoing erythroid differentiation after 11, 14, and 18 days (d) in culture. Cells were treated with DMSO or with 1.1 μM, 370 nM, or 120 nM LSD1i (CCG050). Cells were monitored for CD71 and CD235a cell surface markers, whose acquisition reflect maturing erythroid differentiation stages.33 Numbers in each quadrant indicate the percentage of gated cells. Results are representative of experiments performed using CD34+ HSPCs from 2 healthy adult donors. (B) Representative HPLC chromatograms of day-18 cells cultured or not with CCG050 from panel A. HbF percentages are indicated in parentheses. (C) Percentage of γ-globin transcripts in total β-like (γ+β) globin mRNAs at day 14. (D) mRNA abundance of γ-globin and β-globin (normalized to OAZ1 internal control mRNA)15 at day 14. The γ-globin transcript abundance in DMSO-treated cells was arbitrarily set at 1. (E) Transcript levels of key erythroid TFs GATA1, KLF1, and TAL1 (normalized to OAZ1 mRNA) were reduced in day-14 cells treated with 370 nM LSD1i CCG050. Transcript levels of each mRNA in DMSO-treated cells were arbitrarily set at 1. Data are mean ± standard deviation from 3 replicates. ***P < .001, unpaired Student t test. h, human.
At the lowest LSD1i concentration tested, the differentiation pattern at day 11 (Figure 1A) resembled that of day-7 controls (supplemental Figure 1C), with the majority as double-positive precursors. From day 14 through day 18, a majority of cells remained CD71+CD235a+; only 3% to 4% converted to the more mature CD71−CD235a+ phenotype. In contrast, at the highest concentration of LSD1i tested (1.1 μM), >70% of cells remained double negative (Figure 1A). Hence, CCG50 exhibited the same erythroid differentiation inhibitory effect as did previously tested LSD1i’s.
We next assessed HbF synthesis by HPLCs in day-18 cells that were cultured or not with LSD1i. At all concentrations tested, LSD1i induced γ-globin and HbF above baseline (Figure 1B). LSD1i enhanced the γ/(γ+β) mRNA ratio in a dose-dependent manner (Figure 1C), but total β-like globin (γ+β) mRNA declined upon increasing LSD1i (Figure 1D), as did the expression of erythroid TFs (Figure 1E). Taken together, the data indicate that low to moderate LSD1 inhibition robustly induces HbF, whereas higher concentrations impair erythroid differentiation.
Generation of conditional erythroid lineage–specific deleter mice
We next investigated whether genetic Lsd1 loss in vivo would inhibit adult erythroid differentiation. Although Mx1-Cre,34EpoR-Cre,35 and Vav1-Cre36 strains have been used previously in genetic LOF studies, none were ideal for generating conditional alleles (CKO) in adult RBCs. To this end, we generated erythroid lineage-specific Tx-inducible Cre transgenic lines.
We targeted a mouse Gata1 BAC (G1B), known to faithfully recapitulate Gata1 expression,25,31,37 with a Tx-inducible CreERT2 fusion gene38 inserted at the start codon of Gata1 (supplemental Figure 2) to generate G1BCreERT2 mice. This BAC was microinjected into C57Bl/6J zygotes to generate transgenic lines L245 and L259. To determine the lineage specificity and activity of Cre recombinase in the lines, we crossed them with R26T reporter mice to generate compound R26T:G1BCreERT2 mutants to assess Cre recombinase activation.27R26T:G1BCreERT2 mice were injected or not with Tx over the course of 2 weeks, at which time total BM cells from the mice were costained with CD71 and Ter119 antibodies to assess erythroid differentiation and Cre activation.
As murine erythroid cells mature, they acquire CD71 expression (gate II; Figure 2A) before coexpressing Ter119 and CD71 (gate III) and then gradually lose CD71 (gate IV) to finally express only Ter119 (gate V).39 No tandem tomato (TdT) signal that would be generated by loxP excision of the stop signal from the R26T locus was detected in the BM of the 2 untreated R26T:G1BCreERT2 lines, indicating that Cre activity was not “leaky” (blue graphs, Figure 2B). Fraction I (nonerythroid BM) cells were almost completely TdT−, whereas >90% of the cells in fraction II (erythroid lineage-committed cells) were fluorescent (red graphs, Figure 2B). TdT intensity diminished during differentiation, possibly through a combination of chromatin condensation, TdT turnover, and dilution (Figure 2B). Very few TdT+ cells were present in the nonerythroid (B220/Gr1/CD11b/CD3ε+) cell population (red graph, supplemental Figure 3), indicating that Cre was active almost exclusively in the erythroid lineage. The 2 transgenic lines shared similar profiles (Figure 2B; supplemental Figure 3); therefore, only line L259 was used in subsequent experiments.
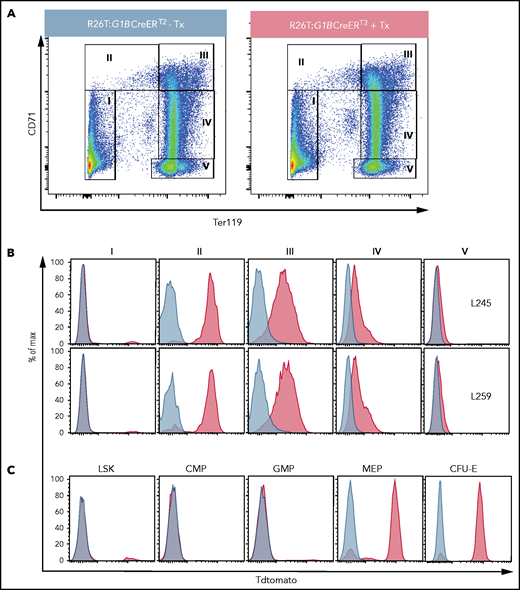
Inducible erythroid-specific G1BCreERT2 expression is initiated at the MEP stage. (A) Representative flow cytometry plots showing gating strategies for the anti-CD71 and anti-Ter119 antibodies used to identify progressively more mature erythroid cells (from stages II to V) among BM cells from untreated R26T:G1BCreERT2 line 259 mice (left panel) or R26T:G1BCreERT2 line 259 mice treated with 2 mg of Tx (2 mg for 5 times every other day; right panel). (B) Representative flow graphs showing TdTomato epifluorescence in cell fractions I through V (gated as in A) from vehicle-treated (blue graphs) or Tx-treated (red graphs) R26T:G1BCreERT2 murine transgenic line L245 (upper panels) or line L259 (lower panels) BM cells. (C) Representative flow graphs showing TdTomato epifluorescence in the BM LSK, CMP (Lin−cKit+Sca1−CD34+CD16/32−), GMP (Lin−cKit+Sca1−CD34+CD16/32+), MEP (Lin−cKit+Sca1−CD34−CD16/32−), and CFU-E (Lin−cKit+Sca1−CD16/32−CD41−CD150−CD105+) cell populations in untreated (blue graphs) or Tx-treated (red graphs) R26T:G1BCreERT2 (line 259) cells. More detailed gating strategies are shown in supplemental Figures 5 and 6.
Inducible erythroid-specific G1BCreERT2 expression is initiated at the MEP stage. (A) Representative flow cytometry plots showing gating strategies for the anti-CD71 and anti-Ter119 antibodies used to identify progressively more mature erythroid cells (from stages II to V) among BM cells from untreated R26T:G1BCreERT2 line 259 mice (left panel) or R26T:G1BCreERT2 line 259 mice treated with 2 mg of Tx (2 mg for 5 times every other day; right panel). (B) Representative flow graphs showing TdTomato epifluorescence in cell fractions I through V (gated as in A) from vehicle-treated (blue graphs) or Tx-treated (red graphs) R26T:G1BCreERT2 murine transgenic line L245 (upper panels) or line L259 (lower panels) BM cells. (C) Representative flow graphs showing TdTomato epifluorescence in the BM LSK, CMP (Lin−cKit+Sca1−CD34+CD16/32−), GMP (Lin−cKit+Sca1−CD34+CD16/32+), MEP (Lin−cKit+Sca1−CD34−CD16/32−), and CFU-E (Lin−cKit+Sca1−CD16/32−CD41−CD150−CD105+) cell populations in untreated (blue graphs) or Tx-treated (red graphs) R26T:G1BCreERT2 (line 259) cells. More detailed gating strategies are shown in supplemental Figures 5 and 6.
Because mouse Gata1 is expressed in megakaryocytes (Mks) and other myeloid cells,40 we examined Cre activity in Mk progenitors (MkPs), Mks, and mast cells (supplemental Figures 4 and 5). The data show that the G1BAC does not contain the Mk or mast cell Gata1 regulatory element(s) or that endogenous GATA1 is expressed in only a subset of those lineages. Thus, the G1BCreERT2 mouse represents a novel inducible genetic tool that is faithfully expressed in the erythroid lineage.
Hematopoietic expression of G1BCreERT2
We next investigated the expression of G1BCreERT2 within the hematopoietic hierarchy. BM cells were harvested from untreated or Tx-treated R26T:G1BCreERT2 mice and then stained to distinguish Lin−Sca1+cKit+ (LSK) cells (HSPCs), common myeloid progenitors (CMPs), GMPs, megakaryocyte-erythroid progenitors (MEPs), and CFU-E cells using conventional cell surface markers41 (Figure 2C; supplemental Figures 5-7). Of the LSK cells, ∼5% were TdT+ after CreERT2 activation, which may represent erythroid-primed progenitor cells (red graph, Figure 2C).42 As anticipated, no CMP or GMP cells were labeled (Figure 2C), whereas in contrast, 85% of MEPs and 90% of CFU-E cells were TdT+ (Figure 2C). The data indicate that the Cre activity of G1BCreERT2 mice is detected as early as the MEP stage and thereafter in dedicated erythroid differentiation stages.
Erythroid progenitor deficiencies in Lsd1 CKO mice
Previously, Kerenyi et al22 reported prenatal lethality as a result of defective erythropoiesis following Lsd1 deletion. To investigate the effects of Lsd1 conditional erythroid loss in adult animals, we examined C57Bl/6 G1BCreERT2 mice crossed with Lsd1 homozygous floxed (Lsd1f/f) congenic mice.28Lsd1f/f:G1BCreERT2 (Lsd1 CKO) or G1BCreERT2 (control) mice were administered Tx every other day for 2 weeks; mice were euthanized for hematological analysis 12 hours after the final injection, unless otherwise noted. Complete blood counts indicated that Lsd1 CKO mice were anemic, because all erythroid parameters were significantly affected (Table 1), whereas white blood cell counts were indistinguishable between Lsd1 CKO and control mice. Platelets were elevated significantly in Lsd1 CKO mice (Table 1).
Differential peripheral blood analysis of Lsd1-CKO mice and controls
| Cell type | Controls | Lsd1-CKO mice |
|---|---|---|
| WBC, ×103/mL | 5.47 ± 1.62 | 5.46 ± 1.41 |
| PLT , ×103/mL | 785 ± 125 | 1032 ± 210* |
| RBC, ×106/mL | 9.76 ± 0.46 | 7.7 ± 0.7** |
| Hb, g/dL | 12.67 ± 0.4 | 9.66 ± 0.67*** |
| HCT, % | 43.4 ± 2.71 | 31.12 ± 2.15*** |
| MCV, fL | 44.47 ± 0.68 | 40.1 ± 1.12*** |
| MCH, pg | 13.00 ± 0.26 | 12.42 ± 0.43 |
Mice were injected intraperitoneally with 2 mg of Tx on alternate days for 14 days (7 injections) prior to euthanization. Data are mean ± standard deviation from 3 to 8 mice.
Hb, hemoglobin; HCT, hematocrit; MCH, mean corpuscular hemoglobin; MCV, mean corpuscular volume; PLT, platelets; WBC, white blood cells.
*P < .05, **P < .01, ***P < .001, unpaired Student t test.
To investigate the basis for the anemia in Lsd1 CKO mice, we performed in vitro colony assays on BM cells. The data showed that CFU-GEMM numbers were indistinguishable in Lsd1 CKO and control animals (Figure 3A). Interestingly, there were slightly, but significantly, more (colony-forming unit-granulocyte, monocyte, or GM) in Lsd1 CKO BM (Figure 3A). Among committed erythroid progenitor populations, BFU-E and CFU-E cells were quantitatively (Figure 3A) and qualitatively (Figure 3B) reduced, thus indicating a severe depletion in the erythroid progenitor population as a result of Lsd1 loss. Hence, the anemia in Lsd1 CKO mice resulted from a pronounced reduction in the number of erythroid progenitors.
![Effects of Lsd1 deletion in erythroid cells of CKO mice.Lsd1 CKO and control mice were administered 7 intraperitoneal injections of Tx on alternate days. Total BM cells were harvested and processed for colony assays and flow cytometric analyses. (A) Colony numbers of CFU-GEMM (GEMM), CFU-GM (GM), BFU-E, and CFU-E cells per 105 BM cells from control and Lsd1 CKO mice. (B) Representative micrographs of BFU-E from control or Lsd1 CKO mice taken at low or high (inset) magnification on day 10 of the CFU assay. Scale bars, 200 μM. (C) No statistically significant difference in the spleens (as percentages of body weights [wt.]) was observed between control and Lsd1 CKO mice. (D) Representative flow cytometry plots displaying the gating for CFU-E cells from control and Lsd1 CKO mice. (E) Bar graph showing absolute numbers of CFU-E cells in control and Lsd1 CKO mice (per 2 femurs + 2 tibias). (F) Representative flow cytometric plots showing the gating strategy for defining CD71+Ter119+ erythroid precursor cells (upper panels) that were subsequently gated by CD44 staining vs forward scatter (FSC) to separate BasoEs, PolyEs, and OrthoEs (lower panels). (G) Absolute numbers of BasoEs, PolyEs, and OrthoEs in control and Lsd1 CKO BM. (H) Deletion efficiency of Lsd1 floxed alleles in flow-sorted BasoEs was determined by qPCR. Primer pair P1 detects Lsd1 genomic DNA flanked by the 2 loxP sites, whereas primer pair P2 detects Lsd1 genomic DNA that is unaffected by Cre-mediated deletion. Data are mean ± standard deviation. *P < .05; **P < .01; ***P < .001, unpaired Student t test.](https://ash.silverchair-cdn.com/ash/content_public/journal/blood/138/18/10.1182_blood.2021011682/4/m_bloodbld2021011682f3.png?Expires=1767703525&Signature=SR6ldO1V9g44Gg64XarI--J2TTQFVSPq4EkNj~-Fy0C7Rr20a3aMMEXejWNOgaKfgfamLCr00khCp~fOVt3fkcbLAXiyHjZrK5WkgiTKh0ex19AoN9aDv5sNRg-hqfM1-srsSTVTkGU~~enpB0dBrsailWeUAaCkap1GAycj92wIwuPNj~6t4bHTt~vgVERysa~5RXmAhAmng-ENptkY~Z2DFgjjnuz4fSNtYZEZvl4rOWHlEVSV8uDgRs0xxO5tl4XCjkdKqRnz0RcIDz4y3o9SWWUQ3troHVEA9j8VEvtD7QvvzDxUSOtuTWXLV2LkDfJS9TLUqwqkoIs45MBD7A__&Key-Pair-Id=APKAIE5G5CRDK6RD3PGA)
Effects of Lsd1 deletion in erythroid cells of CKO mice.Lsd1 CKO and control mice were administered 7 intraperitoneal injections of Tx on alternate days. Total BM cells were harvested and processed for colony assays and flow cytometric analyses. (A) Colony numbers of CFU-GEMM (GEMM), CFU-GM (GM), BFU-E, and CFU-E cells per 105 BM cells from control and Lsd1 CKO mice. (B) Representative micrographs of BFU-E from control or Lsd1 CKO mice taken at low or high (inset) magnification on day 10 of the CFU assay. Scale bars, 200 μM. (C) No statistically significant difference in the spleens (as percentages of body weights [wt.]) was observed between control and Lsd1 CKO mice. (D) Representative flow cytometry plots displaying the gating for CFU-E cells from control and Lsd1 CKO mice. (E) Bar graph showing absolute numbers of CFU-E cells in control and Lsd1 CKO mice (per 2 femurs + 2 tibias). (F) Representative flow cytometric plots showing the gating strategy for defining CD71+Ter119+ erythroid precursor cells (upper panels) that were subsequently gated by CD44 staining vs forward scatter (FSC) to separate BasoEs, PolyEs, and OrthoEs (lower panels). (G) Absolute numbers of BasoEs, PolyEs, and OrthoEs in control and Lsd1 CKO BM. (H) Deletion efficiency of Lsd1 floxed alleles in flow-sorted BasoEs was determined by qPCR. Primer pair P1 detects Lsd1 genomic DNA flanked by the 2 loxP sites, whereas primer pair P2 detects Lsd1 genomic DNA that is unaffected by Cre-mediated deletion. Data are mean ± standard deviation. *P < .05; **P < .01; ***P < .001, unpaired Student t test.
Effects of Lsd1 deletion in erythroid cells of CKO mice.Lsd1 CKO and control mice were administered 7 intraperitoneal injections of Tx on alternate days. Total BM cells were harvested and processed for colony assays and flow cytometric analyses. (A) Colony numbers of CFU-GEMM (GEMM), CFU-GM (GM), BFU-E, and CFU-E cells per 105 BM cells from control and Lsd1 CKO mice. (B) Representative micrographs of BFU-E from control or Lsd1 CKO mice taken at low or high (inset) magnification on day 10 of the CFU assay. Scale bars, 200 μM. (C) No statistically significant difference in the spleens (as percentages of body weights [wt.]) was observed between control and Lsd1 CKO mice. (D) Representative flow cytometry plots displaying the gating for CFU-E cells from control and Lsd1 CKO mice. (E) Bar graph showing absolute numbers of CFU-E cells in control and Lsd1 CKO mice (per 2 femurs + 2 tibias). (F) Representative flow cytometric plots showing the gating strategy for defining CD71+Ter119+ erythroid precursor cells (upper panels) that were subsequently gated by CD44 staining vs forward scatter (FSC) to separate BasoEs, PolyEs, and OrthoEs (lower panels). (G) Absolute numbers of BasoEs, PolyEs, and OrthoEs in control and Lsd1 CKO BM. (H) Deletion efficiency of Lsd1 floxed alleles in flow-sorted BasoEs was determined by qPCR. Primer pair P1 detects Lsd1 genomic DNA flanked by the 2 loxP sites, whereas primer pair P2 detects Lsd1 genomic DNA that is unaffected by Cre-mediated deletion. Data are mean ± standard deviation. *P < .05; **P < .01; ***P < .001, unpaired Student t test.
Splenomegaly was not observed in Lsd1 CKO mice (Figure 3C). Consistent with the colony assays, flow cytometry showed that the absolute number of CFU-E cells in Lsd1 CKO mice was reduced (Figure 3D-E). Based on AnnexinV (AV) staining,43 this reduction was not attributable to increased apoptosis of CFU-E cells (supplemental Figure 8). Thus, Lsd1 CKO leads to a severe block in erythroid progenitors, especially at the CFU-E stage, leading to fewer mature RBCs. We found that the absolute cell number at each stage in more mature erythroblasts (BasoEs, polychromatic erythroblasts [PolyEs], or orthochromatic erythroblasts [OrthoEs) was also reduced (Figure 3F-G),39 so we asked whether increased apoptosis might account for the reduction in late erythroid cells in Lsd1 CKO mice. Early and late apoptotic cells (AV+DAPI− and AV+DAPI+, respectively31) were analyzed in BasoEs, PolyEs, and OrthoEs in Lsd1 CKO and control mice. Late apoptosis in the BasoE and PolyE populations in Lsd1 CKO mice was reduced, whereas cell death in OrthoEs was unchanged (supplemental Figure 9). Finally, we found that the cell cycle in CD71+Ter119+ precursor cells was unaffected (supplemental Figure 10). Together, the data indicate that adult Lsd1 CKO leads to a block in erythroid progenitor cell differentiation via a mechanism that is independent of programmed cell death or cell cycle alteration. We also quantified Cre-mediated deletion efficiency in flow-sorted BasoE cells; the data showed that >80% had deleted the loxP-flanked DNA (Figure 3H). Hence, G1BCreERT2 achieved efficient conditional Lsd1 inactivation in adult erythroid precursor cells.
Lsd1 CKO erythroid progenitors acquire myeloid characteristics
To this point, the data indicated that Lsd1 conditional LOF results in a marked reduction in the number of definitive erythroid progenitor cells, whereas the colony assays indicated that the GM colony number had increased (Figure 3A). To investigate this curious observation, we hypothesized that Lsd1-inactivated erythroid progenitor cells might have acquired myeloid features through a lineage switch that impaired erythroid differentiation. To test this hypothesis, we examined the LSK, CMP, MEP, and GMP populations in Lsd1 CKO mice (Figure 4A-B; supplemental Figure 7); the data showed that the absolute numbers of LSK cells, CMPs, and MEPs were comparable in CKO and control groups. However, consistent with the hypothesis that erythroid progenitors were being diverted into myeloid cells, the GMP population increased significantly (Figure 4A-B). Curiously, we also detected prominent expansion of a new Lin−c-Kit+Sca1−CD16/32+CD34− cell population (Figure 4A).
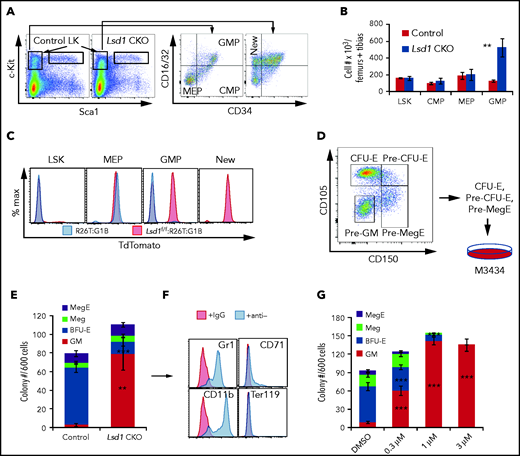
LSD1 LOF shifts erythroid differentiation potential to the GM lineage. Representative flow cytometry plots showing the gating strategies for LSK cells, CMPs, GMPs, and MEPs (A) and their absolute cell numbers (B) in Tx-treated Lsd1 CKO or control mouse BM cells. (C) TdTomato epifluorescence was analyzed in individual cell populations of Tx-treated R26T:G1BCreERT2 control mice (blue graphs) or Lsd1 CKOT mice (red graphs). (D) Erythroid progenitors give rise to GM colonies in LSD1-CKO BM. Sorted CFU-E, pre–CFU-E, and pre-MegE cells from Tx-treated control and Lsd1 CKO mice were pooled for seeding in colony-forming unit assays. (E) Colony types (Meg, mixed MegE, GM, and BFU-E per 600 sorted cells) were quantified. (F) Representative flow cytometry plots of pooled GM colonies picked from Lsd1-CKO mice. The cells were stained with anti-Gr1, anti-CD11b, anti-Ter119, or anti-CD71 antibody. (G) Colony numbers of Megs, MegEs, CFU-GM, and BFU-E (per 600 sorted cells) from control mice treated with DMSO or different concentrations of CCG50 LSD1i. Data are mean ± standard deviation from 3 mice. **P < .01, ***P < .001, unpaired Student t test.
LSD1 LOF shifts erythroid differentiation potential to the GM lineage. Representative flow cytometry plots showing the gating strategies for LSK cells, CMPs, GMPs, and MEPs (A) and their absolute cell numbers (B) in Tx-treated Lsd1 CKO or control mouse BM cells. (C) TdTomato epifluorescence was analyzed in individual cell populations of Tx-treated R26T:G1BCreERT2 control mice (blue graphs) or Lsd1 CKOT mice (red graphs). (D) Erythroid progenitors give rise to GM colonies in LSD1-CKO BM. Sorted CFU-E, pre–CFU-E, and pre-MegE cells from Tx-treated control and Lsd1 CKO mice were pooled for seeding in colony-forming unit assays. (E) Colony types (Meg, mixed MegE, GM, and BFU-E per 600 sorted cells) were quantified. (F) Representative flow cytometry plots of pooled GM colonies picked from Lsd1-CKO mice. The cells were stained with anti-Gr1, anti-CD11b, anti-Ter119, or anti-CD71 antibody. (G) Colony numbers of Megs, MegEs, CFU-GM, and BFU-E (per 600 sorted cells) from control mice treated with DMSO or different concentrations of CCG50 LSD1i. Data are mean ± standard deviation from 3 mice. **P < .01, ***P < .001, unpaired Student t test.
To test whether the expanded GMP population in Lsd1 CKO mouse BM arose from the erythroid lineage, we generated Lsd1f/f:G1BCreERT2:R26T triple-mutant mice (Lsd1 CKOT) to lineage trace TdT fluorescence in the expanded GMP population of Lsd1 CKO mice. Because erythroid cells, but not GMPs, in G1BCreERT2:R26T mice were labeled by TdT (Figure 2C), we reasoned that the surfeit GMP population in Lsd1 CKOT mice would be TdT+ if it was derived from erythroid precursors.
As anticipated, LSK cells in Lsd1 CKOT mice were unlabeled, whereas MEP cells were TdT+ (Figure 4C), consistent with earlier observations (Figure 2C). In contrast, GMP cells were TdT− in Tx-treated control mice (Figure 2C), whereas 60% of the GMPs in Lsd1 CKOT BM were TdT+ (Figures 2C and 4C), consistent with the increase in GMP cell number (Figure 4A-B). Based on prior observations (Figure 2; supplemental Figures 3 and 4), we concluded that the LSD1-deficient TdT+ GMP cells likely originated from an erythroid progenitor.
We asked whether these new GMP-like cells (Figure 4B) might be differentially susceptible to programmed cell death; we found that late apoptosis was reduced by 50% (supplemental Figure 11), suggesting that the erythroid-derived GMPs were resistant to apoptosis and may differentiate into more mature myeloid cells. To test this hypothesis, we flow sorted CFU-E, pre–CFU-E, and pre-megakaryocytic/erythroid progenitor (pre-MegE) cells from control and Lsd1 CKO BM and then seeded these progenitor populations as a mixture to test their differentiation potential (Figure 4D). The majority of these progenitors from control mice gave rise to BFU-E, Megakaryocytic (Meg), and MegE colonies, as well as to a few GM colonies. In contrast, erythroid progenitors from Lsd1 CKO mice largely shifted from BFU-E to GM lineages (Figure 4E). To determine whether the CFU-GM colonies derived from Lsd1 CKO erythroid progenitors are myeloid cells, we pooled individual clones and examined them for the expression of Gr1 and CD11b (myeloid markers) or CD71 and Ter119 (erythroid markers). The majority of these individual GM colonies were composed of cells that were Gr1+ or CD11b+; none expressed Ter119+, and only a small fraction of the cells were CD71+ (Figure 4F), demonstrating that they are almost exclusively myeloid colonies that arose from erythroid progenitors.
To test the hypothesis, using an orthogonal strategy, that LSD1 inhibition leads to an erythroid-to-myeloid cell fate switch (EMS), we isolated wild-type CFU-E, pre–CFU-E, and pre-MegE cells by flow sorting and treated them with increasing concentrations of LSD1i. Consistent with the genetic Lsd1 LOF analysis (Figure 4E), treatment of these cells with LSD1i induced EMS in a dose-dependent manner (Figure 4G). Taken together, the data validate the hypothesis that Lsd1 CKO or LSD1 pharmacological inhibition in erythroid progenitor cells leads to an erythroid-to-myeloid cell fate conversion.
Pu.1 is activated at the CFU-E stage in Lsd1 CKO mice
To better understand the molecular basis for why Lsd1 LOF in erythroid progenitors might lead to gain of GMP characteristics, we flow sorted CFU-E cells from Lsd1 CKO and control mice (Figure 3D) and performed gene expression analysis. We found that Lsd1 mRNA was reduced by >90%. PU.1 is a well characterized myeloid TF,44-46 and transcriptional activation of Pu.1 is regulated by RUNX1 in HSPCs.47 Consistent with the observed increase in GMP activity in Lsd1 CKO mice, Pu.1 expression was sevenfold higher in Lsd1 CKO CFU-E cells. In the same cells, Gata1 mRNA was reduced slightly, but significantly, which is another indication of impaired erythroid differentiation, whereas Runx1 levels were unchanged (Figure 5A).
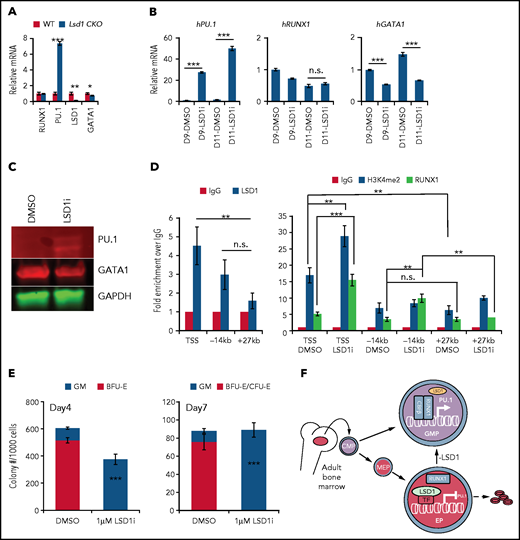
LSD1 directly inhibits myeloid differentiation genes in erythroid cells. (A) Relative mRNA levels of RUNX1, PU.1, LSD1, and GATA1 (normalized to 18s ribosome RNA) in sorted CFU-E cells from Tx-treated control and Lsd1-CKO mouse BM. (B) Relative mRNA levels of PU.1, RUNX1, or GATA1 (normalized to OAZ115) in day-9 (D9) or day-11 (D11) erythroid-differentiated human CD34+ cells assayed by qRT-PCR. Cells were expanded in the presence of DMSO or 370 nM LSD1i. (C) Protein levels of PU.1 or GATA1 in the same cells as in (B) assayed by western blotting. (D) ChIP-qPCR analysis of LSD1, H3K4me2, and RUNX1 binding at sites in the PU.1 locus in day-11 human CD34 erythroid differentiated cells in the presence of DMSO or 370 nM LSD1i. (E) Colony numbers of CFU-GM and erythroid colony per 1000 CD34+ erythroid differentiated cells from day 4 or day 7 treated with DMSO or 370 nM LSD1i. Data are mean ± standard deviation. (F) LSD1 maintains normal erythropoiesis by repressing PU.1 transcription in erythroid progenitors. LSD1 gene deletion or protein inhibition leads to aberrant activation of PU.1, likely through RUNX1, and shifts the differentiation potential from erythroid to myeloid. *P < .05, **P < .01, ***P < .001, unpaired Student t test. h, human; IgG, immunoglobulin G; n.s., not significant; TSS, PU.1 TSS; WT, wild-type; −14kb, PU.1 enhancer; +27 kb, random sequence control.
LSD1 directly inhibits myeloid differentiation genes in erythroid cells. (A) Relative mRNA levels of RUNX1, PU.1, LSD1, and GATA1 (normalized to 18s ribosome RNA) in sorted CFU-E cells from Tx-treated control and Lsd1-CKO mouse BM. (B) Relative mRNA levels of PU.1, RUNX1, or GATA1 (normalized to OAZ115) in day-9 (D9) or day-11 (D11) erythroid-differentiated human CD34+ cells assayed by qRT-PCR. Cells were expanded in the presence of DMSO or 370 nM LSD1i. (C) Protein levels of PU.1 or GATA1 in the same cells as in (B) assayed by western blotting. (D) ChIP-qPCR analysis of LSD1, H3K4me2, and RUNX1 binding at sites in the PU.1 locus in day-11 human CD34 erythroid differentiated cells in the presence of DMSO or 370 nM LSD1i. (E) Colony numbers of CFU-GM and erythroid colony per 1000 CD34+ erythroid differentiated cells from day 4 or day 7 treated with DMSO or 370 nM LSD1i. Data are mean ± standard deviation. (F) LSD1 maintains normal erythropoiesis by repressing PU.1 transcription in erythroid progenitors. LSD1 gene deletion or protein inhibition leads to aberrant activation of PU.1, likely through RUNX1, and shifts the differentiation potential from erythroid to myeloid. *P < .05, **P < .01, ***P < .001, unpaired Student t test. h, human; IgG, immunoglobulin G; n.s., not significant; TSS, PU.1 TSS; WT, wild-type; −14kb, PU.1 enhancer; +27 kb, random sequence control.
To explore how LSD1 inhibition in erythroid progenitor cells derepressed expression of common myeloid markers, we performed qRT-PCR on human erythroid differentiation-induced CD34+ cells in the absence or presence of LSD1i’s after 14 days of suspension culture (supplemental Figure 1B). Consistent with the in vivo mouse data, 2 LSD1i’s each activated the myeloid regulatory genes PU.1 and CEBPA, whereas GATA1 was significantly reduced (supplemental Figure 12A). Notably, treatment with LSD1i significantly induced RUNX1 expression (supplemental Figure 12A), even though erythroid lineage Lsd1 CKO does not affect Runx1 expression in murine CFU-E cells (Figure 5A). Because PU.1 is a well-known transcriptional target of RUNX1, we also asked whether the induction of RUNX1 is a primary contributor to PU.1 activation. To do so, we analyzed RUNX1, PU.1, and GATA1 mRNAs 9 or 11 days after the induction of CD34+ cell erythroid differentiation (supplemental Figure 1B). Surprisingly, although PU.1 was significantly induced by day 9 and day 11 (either 2 or 4 days after LSD1i addition), the expression of RUNX1 did not increase. These data suggest that the endogenous level of RUNX1 is sufficient to activate PU.1 after the LSD1-mediated repressive complex was inactivated. Consistent with the changes in the abundance of mRNA, PU.1 protein was also significantly induced, whereas GATA1 was slightly diminished (Figure 5C).
To address whether LSD1 directly transcriptionally regulated PU.1, we performed ChIP assays in human erythroid HUDEP2 cells.48 The results show that LSD1 is usually bound at the transcriptional start site (TSS) of the PU.1 gene (supplemental Figure 12B). When we performed ChIP assays after 11 days of erythroid differentiation in CD34+ cells, we again found LSD1 bound at the TSS of the PU.1 gene (Figure 5D, left panel). Interestingly, LSD1i treatment significantly enhanced the H3K4me2 signal at the TSS of PU.1, indicating that LSD1 likely represses PU.1 transcription by removing the H3K4 methyl marks normally associated with gene activation (Figure 5D, right panel). Notably, CCG50 treatment also leads to increased occupancy of RUNX1 at the TSS and −14 kb enhancer of PU.1, suggesting that the endogenous level of RUNX1 plays a key role in PU.1 activation after the LSD1-mediated repression machinery is inhibited (Figure 5D, right panel).
To determine whether LSD1i also induces EMS in natural erythroid progenitors, we performed CFU assays on human CD34+ cell differentiation after 4 or 7 days of erythroid culture (supplemental Figure 1B). The addition of LSD1i completely altered the differentiation potential of these erythroid progenitors into a myeloid lineage fate change (Figure 5E).
In summary, these data indicate that LSD1 normally acts to repress PU.1 expression to maintain unidirectional lineage potential at erythroid progenitor cell stages. Once LSD1 is deleted or LSD1 protein is inactivated by inhibitors, PU.1 is induced in erythroid progenitors, likely through activity of RUNX1,47 which initiates the GMP cascade while simultaneously impairing erythroid differentiation (Figure 5F).
Pu.1 or Runx1 LOF rescues the LSD1i-mediated block of erythroid differentiation
To test whether the RUNX1/PU.1 axis plays a functional role in blocking erythroid differentiation after LSD1 genetic or pharmacological loss, we generated PU.1 and RUNX1 homozygous mutant HUDEP2 cells (supplemental Figures 13 and 14) and asked whether ablation of either gene could rescue the erythroid differentiation block caused by LSD1 inhibition. LSD1i treatment significantly reduced the percentage of erythroid cells in control HUDEP2 cultures (Figure 6A; supplemental Figure 15), underscoring the conclusion that LSD1i treatment impairs erythroid differentiation. Remarkably, that reduced cell percentage was rescued by PU.1 or RUNX1 ablation (Figure 6A; supplemental Figure 15). LSD1i treatment of control HUDEP2 cells repressed γ-globin, β-globin, and GATA1 expression and activated PU.1, effects that were rescued in the PU.1 or RUNX1 LOF mutant HUDEP2 clones (Figure 6B). The data show that RUNX1/PU.1 activation plays a key role in blocking the erythroid lineage differentiation induced by LSD1 inhibition.
![Pu.1 or Runx1 genetic loss rescues erythroid differentiation inhibition induced by blocking LSD1 activity. (A) CD71 and CD235a flow cytometric analysis of 3 independent nontargeting sgRNA-infected cells (wild-type [WT]), 4 independent PU.1−/− HUDEP2 clones, or 4 HUDEP2 Runx1−/− clones treated with DMSO (control) or 300 nM CCG50. Data are the average percentage of CD71+CD235a+ cells from multiple clones in supplemental Figure 15. Impaired erythroid differentiation (as reflected by the reduced percentage of CD71+CD235a+ cells) in the WT group after CCG50 treatment was rescued by PU.1 or RUNX1 knockout. (B) mRNA levels of γ-globin, β-globin, GATA1, and PU.1 in random sgRNA control cells and P3-18 (PU.1−/−) or R2-47 (RUNX1−/−) LOF clones after treatment with DMSO or 300 nM CCG50. Data are mean ± standard deviation. *P < .05, **P < .01, ***P < .001, unpaired Student t test.](https://ash.silverchair-cdn.com/ash/content_public/journal/blood/138/18/10.1182_blood.2021011682/4/m_bloodbld2021011682f6.png?Expires=1767703525&Signature=YTMAb-0JCroPcr~oTDzyNzN2-5jrl2WZlbDqjWE1fDc6TNvOs~pjVFN1wUkfV4vbU4V6vE2hJ4XRksFZweeAnrodf3Wk~V4SRbu7S9ffMxQm4FlFjLdUM24GkgNP34g~PSYtT2kXmHVHOdDeDMW3FN1QoMeKZ23GENNyD~2l~Kx4PXieItSOpH2JHt0WVh7NQMFdYqMSbxahZ1ALoeSKo54u6amBzCffpq9I5VvtYdlw3zrjtcJtKy608FKzFyrbsmD-UNMSHox2PWWu06YJKSAL90vzYvSOWeUeJ96OyaYGj6VMF6PY8mi1yx0~yeYCpdV44fcvXI2yw0ZWmPDnsA__&Key-Pair-Id=APKAIE5G5CRDK6RD3PGA)
Pu.1 or Runx1 genetic loss rescues erythroid differentiation inhibition induced by blocking LSD1 activity. (A) CD71 and CD235a flow cytometric analysis of 3 independent nontargeting sgRNA-infected cells (wild-type [WT]), 4 independent PU.1−/− HUDEP2 clones, or 4 HUDEP2 Runx1−/− clones treated with DMSO (control) or 300 nM CCG50. Data are the average percentage of CD71+CD235a+ cells from multiple clones in supplemental Figure 15. Impaired erythroid differentiation (as reflected by the reduced percentage of CD71+CD235a+ cells) in the WT group after CCG50 treatment was rescued by PU.1 or RUNX1 knockout. (B) mRNA levels of γ-globin, β-globin, GATA1, and PU.1 in random sgRNA control cells and P3-18 (PU.1−/−) or R2-47 (RUNX1−/−) LOF clones after treatment with DMSO or 300 nM CCG50. Data are mean ± standard deviation. *P < .05, **P < .01, ***P < .001, unpaired Student t test.
Pu.1 or Runx1 genetic loss rescues erythroid differentiation inhibition induced by blocking LSD1 activity. (A) CD71 and CD235a flow cytometric analysis of 3 independent nontargeting sgRNA-infected cells (wild-type [WT]), 4 independent PU.1−/− HUDEP2 clones, or 4 HUDEP2 Runx1−/− clones treated with DMSO (control) or 300 nM CCG50. Data are the average percentage of CD71+CD235a+ cells from multiple clones in supplemental Figure 15. Impaired erythroid differentiation (as reflected by the reduced percentage of CD71+CD235a+ cells) in the WT group after CCG50 treatment was rescued by PU.1 or RUNX1 knockout. (B) mRNA levels of γ-globin, β-globin, GATA1, and PU.1 in random sgRNA control cells and P3-18 (PU.1−/−) or R2-47 (RUNX1−/−) LOF clones after treatment with DMSO or 300 nM CCG50. Data are mean ± standard deviation. *P < .05, **P < .01, ***P < .001, unpaired Student t test.
RUNX1i’s rescue the LSD1i-mediated block of erythroid differentiation
Because LSD1i’s have been proposed as potential therapeutic agents for SCD, we next asked whether pharmacological inhibition of the RUNX1/PU.1 pathway could rescue the erythroid differentiation–blocking effects of LSD1i. Because no effective PU.1 inhibitor is commercially available, we asked whether Ro5-3335, a reported RUNX1 inhibitor (RUNX1i),49 or a better characterized RUNX1i, AI-10-104,50 could rescue the erythroid differentiation defect caused by LSD1i treatment.
Each RUNX1i was added to CD34+ media at the same time as LSD1i, and erythroid cell maturation was examined at day 11 by flow cytometry (supplemental Figure 1B). Treatment with LSD1i inhibited erythroid differentiation and reduced production of CD71+CD235a+ erythroid cells (Figure 7A). However, treatment of cultures with LSD1i plus RUNX1i rescued the differentiation block in a dose-dependent manner (Figure 7A). Although RUNX1i cotreatment rescued the erythroid differentiation block induced by LSD1i, significant cell death was also observed at day 11 after the addition of Ro5-3335 (∼40% to 50% of cells are DAPI+ [dead cells] at 10 μM Ro5-3335 treatment; data not shown). To exclude the effect of RUNX1i-induced cell death during erythroid differentiation, we also analyzed cells at day 9, just 2 days after initiating inhibitor cotreatment (supplemental Figure 16A), and determined that treatment with either RUNX1i rescued the LSD1i-mediated erythroid differentiation block (supplemental Figure 16B).
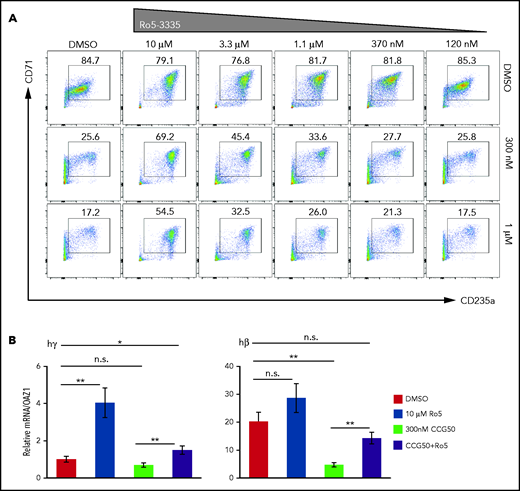
RUNX1i cotreatment partially rescues the erythroid-to-myeloid conversion by LSD1i. (A) CD71/CD235a staining of human CD34+ cells showing erythroid differentiation at day 11, after 4 days of treatment with CCG50 alone (300 nM or 1 μM), RUNX1i Ro5-3335 alone (10 μM-120 nM) or both. (B) mRNA abundance of γ-globin and β-globin at day 11 after inhibitor treatments. γ-Globin transcripts in DMSO were arbitrarily set at 1. Data are mean ± standard deviation. *P < .05, **P < .01, unpaired Student t test. h, human; n.s., not significant.
RUNX1i cotreatment partially rescues the erythroid-to-myeloid conversion by LSD1i. (A) CD71/CD235a staining of human CD34+ cells showing erythroid differentiation at day 11, after 4 days of treatment with CCG50 alone (300 nM or 1 μM), RUNX1i Ro5-3335 alone (10 μM-120 nM) or both. (B) mRNA abundance of γ-globin and β-globin at day 11 after inhibitor treatments. γ-Globin transcripts in DMSO were arbitrarily set at 1. Data are mean ± standard deviation. *P < .05, **P < .01, unpaired Student t test. h, human; n.s., not significant.
Finally, we examined γ- and β-globin expression after treating the CD34+ erythroid differentiation cultures with RUNX1i, LSD1i, or both, at day 11 of induced differentiation (Figure 7B). RUNX1i cotreatment with LSD1i significantly rescued globin gene expression and, surprisingly, γ-globin expression was induced fourfold by RUNX1i treatment alone, suggesting that RUNX1 may play a previously uncharacterized LSD1-independent role in fetal globin gene repression (Figure 7B). Together, the data show that inhibition of RUNX1 partially rescues the differentiation block induced by LSD1i treatment of human erythroid precursor cells.
Discussion
GATA1 was previously reported to directly repress PU.1 expression by binding to GATA consensus sites near the TSS of PU.1 in erythroblasts.51 We confirmed LSD1 binding at these same sites in human erythroid cells. Notably, in a recent study, GATA1 was reported to repress the expression of CEBPA, another myeloid TF that is activated by PU.1, by recruiting LSD1 to the enhancer of the CEBPA gene in erythroleukemia cells,52 reinforcing the conclusion that LSD1 normally represses the myeloid potential of erythroid cells. Based on these observations, we suggest that disruption of the normal erythroid transcriptional network by LSD1 deletion or inhibition leads to the EMS phenotype reported here. In the future, it will be interesting to test whether erythroid differentiation blocked by LSD1 LOF or inhibition is due to GATA1 reduction, PU.1 activation, or possibly both.
In this study, we illustrated that committed erythroid progenitors retain the capacity to switch to myeloid cells by modifying the activity of the epigenetic enzyme LSD1, which may exemplify a mechanism applicable to other hematopoietic lineages. In contrast to the normal early lineage commitment in the HSPC compartment suggested by recent single-cell RNA sequencing studies, the abnormal lineage switch identified here may represent the acquisition of a preleukemia condition or some other developmental deficiency. In this regard, it will be of interest to reconsider the developmental aberrations induced by mutation of other epigenetic enzymes.
PU.1 forced overexpression impairs erythroid differentiation and leads to erythroleukemia.53 Mice that express GATA1 at 5% of wild-type levels also display an increased propensity for erythroleukemia.40 In this study, we detected the expansion of a GMP-like population, as well as a new immunophenotypic population of Lin−cKit+Sca1−CD34−CD16/32+ cells, in Lsd1 CKO mice. Because GATA1 likely recruits LSD1 to repress PU.1 expression in erythroid cells, whether these unusual cells represent harbingers of a preleukemic state or a previously undiscovered myeloid progenitor state will require further study. In this regard, long-term monitoring of any increased propensity for leukemogenesis in Lsd1 CKO mice may be of interest.
Increased levels of LSD1 have been detected in different neoplasms, and LSD1 was shown to play a key role in carcinogenesis, highlighting the potential therapeutic effect of LSD1i’s in cancer and myelodysplastic syndrome.54 However, current LSD1i’s have multiple side effects, thus lessening their utility for development of targeted therapeutics.55 In this regard, the mechanisms of LSD1 action revealed in this study may illuminate a path to the development of safer and more effective therapeutic compounds for the treatment of SCD and TM. From the data presented here, one could envision a safe and effective binary therapeutic that induces HbF (by blocking LSD1 activity) while promoting normal erythroid differentiation (by blocking the induction of PU.1 and/or RUNX1).
Acknowledgments
The authors thank colleagues at the University of Michigan (Sojin An, Uhnsoo Cho, Susan Hagen, Pil Li, and Mathivanan Packiarajan) for assistance and insight.
This work was supported by the National Institutes of Health, National Heart, Lung, and Blood Institute (grants U01 HL117658 and P01 HL146372) (J.D.E. and A.W.) and the Cooley’s Anemia Foundation (L.Y.), as well as a center of excellence award from the National Institutes of Health, National Institute of Diabetes and Digestive and Kidney Diseases (U54 DK106829) to the Fred Hutchinson Cancer Center to support the isolation and distribution of normal human hematopoietic stem and progenitor (CD34+) cells to the scientific community.
Authorship
Contribution: L.Y., G.M., R.K., K.-C.L., and J.D.E. conceived and/or designed the study and wrote and revised the manuscript; L.Y., G.M., C-J.K., E.S., Y.W., S.A.S., N.J., and K.-C.L. acquired and analyzed data; and L.Y., G.M., C.-J.K., A.W., T.M., R.K., M.Y., M.G.R., J.P., J.H.B., K.-C.L., and J.D.E. interpreted data.
Conflict-of-interest disclosure: The authors declare no competing financial interests.
Correspondence: James Douglas Engel, Department of Cell and Developmental Biology, University of Michigan, 3035 BSRB, 109 Zina Pitcher Place, Ann Arbor, MI 49109; e-mail: engel@umich.edu.
Data sharing requests should be sent to Lei Yu (leyu@med.umich.edu).
The online version of this article contains a data supplement.
There is a Blood Commentary on this article in this issue.
The publication costs of this article were defrayed in part by page charge payment. Therefore, and solely to indicate this fact, this article is hereby marked “advertisement” in accordance with 18 USC section 1734.

This feature is available to Subscribers Only
Sign In or Create an Account Close Modal