

Key Points
Using primary manufacturing and health delivery data, we report the observed implementation costs associated with hemophilia gene therapy.
Gene therapy for severe hemophilia B was the most cost-effective strategy compared with factor replacement therapies in the United States.

Abstract
Adeno-associated virus (AAV)-mediated gene therapy is a novel treatment promising to reduce morbidity associated with hemophilia. Although multiple clinical trials continue to evaluate efficacy and safety, limited cost-effectiveness data have been published. This study compared the potential cost-effectiveness of AAV-mediated factor IX (FIX)-Padua gene therapy for patients with severe hemophilia B in the United States vs on-demand FIX replacement and primary FIX prophylaxis, using either standard or extended half-life FIX products. A microsimulation Markov model was constructed, and transition probabilities between health states and utilities were informed by using published data. Costs were aggregated by using a microcosting approach. A time horizon from 18 years old until death, from the perspective of a third-party payer in the United States, was conducted. Gene therapy was more cost-effective than both alternatives considering a $150 000/quality-adjusted life-year threshold. The price for gene therapy was assumed to be $2 000 000 in the base case scenario; however, one of the 1-way sensitivity analyses was conducted by using observed manufacturing, administration, and 5-year follow-up costs of $87 198 for AAV-mediated gene therapy vector as derived from the manufacturing facility and clinical practice at St Jude Children’s Research Hospital. One-way sensitivity analyses revealed 10 of 102 scenarios in which gene therapy was not cost-effective compared with alternative treatments. Notably, gene therapy remained cost-effective in a hypothetical scenario in which we estimated that the discounted factor concentrate price was 20% of the wholesale acquisition cost in the United States. Probabilistic sensitivity analysis estimated gene therapy to be cost-effective at 92% of simulations considering a $150 000/quality-adjusted life-year threshold. In conclusion, based on detailed simulation inputs and assumptions, gene therapy was more cost-effective than on-demand treatment and prophylaxis for patients with severe hemophilia B.
Introduction
Hemophilia, a group of X-linked genetic disorders impairing the coagulation cascade, occurs in 21 per 100 000 live male births: 82% of patients have hemophilia A (factor VIII [FVIII] deficiency), and 18% have hemophilia B (factor IX [FIX] deficiency).1 Symptoms encompass a continuum of spontaneous or trauma-induced bleeding events into soft tissues or joints, ranging from mild to fatal in severity.2 Patients with severe hemophilia (<1% factor activity) experience long-term morbidities, including hemophilic arthropathy, a condition often requiring surgical intervention.3
The standard of care for hemophilia B is replacement of the missing clotting factor. Historically, the first treatment modality included on-demand factor replacement after a bleed. Over the past 50 years, several innovations have supplanted this approach. Prophylaxis reduced bleeding episodes and minimized long-term morbidity compared with on-demand therapy.4,5 Lately, clinical trials have explored adeno-associated virus (AAV)-mediated gene therapy, anticipated to eliminate infusion requirements for a prolonged time by introducing a functional FIX gene into a patient’s liver cells after a single outpatient peripheral vein infusion.6-8
Balancing the cost of on-demand, prophylactic, and gene transfer treatment options with the expected effectiveness of each therapy remains poorly described. Multiple hemophilia B gene therapy clinical trials are underway assessing the safety and long-term effectiveness of AAV-mediated FIX vector infusion. However, at this critical time, government programs and insurance payers will soon be required to make important financing decisions based on limited comparative data. The aim of the current study was to inform the decision-making process through a comprehensive, cost-effectiveness analysis by comparing the cost and potential cost-effectiveness of AAV–FIX–Padua gene therapy for severe hemophilia B (<1% factor activity) vs those of on-demand and prophylactic factor replacement therapies.
Methods
Model structure
A cost-utility microsimulation Markov model of patients with severe hemophilia B in the United States was developed (Figure 1). The health states included in the model were: “alive,” “alive with joint damage,” and “dead.” For the first 2 states, patients could experience 2 complications: (1) minor bleeds, defined as an uncomplicated joint or superficial muscle bleed requiring 2 days of FIX administration at home; and (2) major bleeds, defined as a deep muscle bleed with neuromuscular injury or a deep laceration requiring 5 days of hospitalization.9-11 Input parameters for the model relied on published literature, peer-reviewed clinical trial findings whenever possible, conservative assumptions when necessary, and finally an extensive range of sensitivity analyses to account for uncertainty. A 1-week cycle length was chosen to ensure mutually exclusive health states, and trackers were used to retain patient history on the individual level to allow for heterogeneity across the simulants. An annual discounting rate of 3% was applied to all costs and effects.12 Analyses were conducted by using TreeAge Pro Healthcare 2020 and R 4.0.2.13-15 Supplemental Table 1 (available on the Blood Web site) summarizes methodologic definitions, and the supplemental Methods elaborates on our methodologic approach.
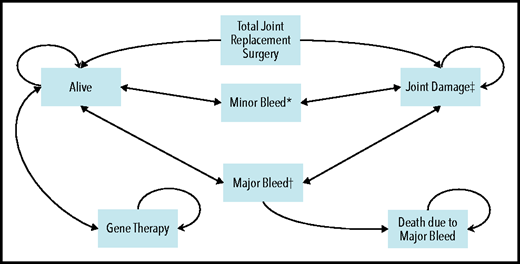
Overall schematic of Markov model with health states and complications. *Minor bleed: required 2 days of treatment at home. This assumption was based on the clotting factor coverage needed for an uncomplicated joint or superficial muscle bleed (as per Lexicomp). It is also aligned with the assumptions used in 2 other hemophilia cost-effectiveness models.9,-11 †Major bleed: required 5 days of hospitalization. This assumption was based on the clotting factor coverage needed for a deep muscle with neuromuscular injury or deep laceration (as per Lexicomp). It is also aligned with the assumptions used in 2 other hemophilia cost-effectiveness models.9-11 ‡Joint damage: development of joint damage started at 8 years of age,69,70 and eventually the patient required total joint replacement surgery. First surgery was performed at 37 years of age,66 and the second and third surgeries (if needed) were performed at 47 and 52 years, respectively. Patients could die at any stage in the model, and this mortality is accounted for by a background mortality rate. Circular arrows indicate that patients could remain in the same health state for multiple consecutive cycles.
Overall schematic of Markov model with health states and complications. *Minor bleed: required 2 days of treatment at home. This assumption was based on the clotting factor coverage needed for an uncomplicated joint or superficial muscle bleed (as per Lexicomp). It is also aligned with the assumptions used in 2 other hemophilia cost-effectiveness models.9,-11 †Major bleed: required 5 days of hospitalization. This assumption was based on the clotting factor coverage needed for a deep muscle with neuromuscular injury or deep laceration (as per Lexicomp). It is also aligned with the assumptions used in 2 other hemophilia cost-effectiveness models.9-11 ‡Joint damage: development of joint damage started at 8 years of age,69,70 and eventually the patient required total joint replacement surgery. First surgery was performed at 37 years of age,66 and the second and third surgeries (if needed) were performed at 47 and 52 years, respectively. Patients could die at any stage in the model, and this mortality is accounted for by a background mortality rate. Circular arrows indicate that patients could remain in the same health state for multiple consecutive cycles.
Base case treatment strategies
To provide an opportunity to study different treatment perspectives, 3 treatment strategies were investigated as base case scenarios: on-demand FIX replacement, primary FIX prophylaxis, and AAV-mediated FIX–Padua gene therapy. Supplemental Table 2 presents a comparative analysis of different FIX vectors currently under development. Gene therapy product was administered to patients aged 18 years, due to lack of safety data in children. Based on 2 peer-reviewed reports of AAV-mediated FIX-Padua clinical trials, we modeled the post–gene therapy FIX level as 34 IU/dL because the reported mean post–gene therapy FIX activity was 34% (±18.7%; n = 10; range: 14%-81%) at 49 weeks and 47% (n = 3; range: 33%-57%) at 26 weeks, for each study, respectively.7,8 We used the more conservative figure. For all treatment strategies, the impact of using either standard half-life factor IX (SHL-FIX) or extended half-life FIX (EHL-FIX) products was examined. For gene therapy, the added cost of lifelong prophylaxis for both factor products was incorporated after the clinical effectiveness of gene therapy had waned. Therefore, 2 approaches for each of the 3 treatment strategies were studied and labeled Approaches A to F.
To account for the uncertainty of sustained benefit after gene therapy, we took a conservative approach to factor-level degradation in the base case and assumed: (1) an annual decrement of 1 IU/dL in factor level; (2) when the FIX level dropped below 25 IU/dL, minor bleeds occurred incrementally between posttreatment years 9 and 30,16 requiring on-demand factor treatments; and (3) with a FIX level below 3 IU/dL, patients again required prophylaxis. Because published hemophilia B trial data have yet to show sustained grade 3 or 4 adverse events post–gene therapy, we assumed no adverse events or infusion failures in our model6-8,17 (supplemental Assumptions).
Patient population, time horizon, and perspective
A cohort of 500 000 male patients with severe hemophilia B in the United States was simulated. Although the prevalence of severe hemophilia B patients in the United States is approximated at 1500,18 the purpose of sample size in simulation modeling is not to model the actual population size but rather establish stability in the final model outputs because outcomes are reported as the average value per patient. Moreover , because the microsimulation model incorporates parameter-level heterogeneity and retains history for each individual patient, best-practice simulation guidelines instruct by including a large sample to mitigate the impact of outliers.19,20 The 500 000 sample size was selected after running the simulation for 100 000, 500 000, and 1 000 000 simulants and establishing that the average results remained stable in the last 2 sample sizes. The time horizon of the analysis started at the youngest age at which patients could receive gene therapy treatment (currently 18 years of age) and extended until death. Costs were analyzed from the perspective of a third-party payer in the United States.
Costs and utilities
Table 1 summarizes parameters and their data sources; supplemental Tables 3 to 9 and supplemental Figure 1 display detailed model inputs. Costs were aggregated by using a microcosting approach. The bulk of the overall costs, the factor concentrate costs, were calculated by multiplying the wholesale acquisition cost (WAC) by the body weight of the average United States male in every year of life to dynamically update the dose with each simulation cycle.21-23 To account for various EHL-FIX products, we conducted a comparative analysis (supplemental Tables 9 and 10) and selected the more cost-effective option for the model. Because the official price of gene therapy has not yet been decided, a cost of $2 000 000 was assumed for the gene therapy product based on proposed pricing announcements and a previous publication.24,25 For costing purposes, we assumed that the gene therapy product was administered during a single outpatient visit based on published clinical trial protocols.8 Inpatient stays were costed by using the World Health Organization Choosing Interventions that are Cost-Effective tool (WHO-CHOICE tool).26 Outpatient visits, investigations, and imaging studies were costed based on Current Procedural Terminology line items obtained from billing reports of patients with hemophilia B at St Jude Children’s Research Hospital (SJCRH) and their correlate physician/service fee listed on the Centers for Medicare & Medicaid Services database.27 Utilities were inputted using published data measured by EQ-5D, a standardised health-related quality of life survey developed by EuroQOL group and widely used in health economic evaluations. EQ-5D survey results assessing quality of life related to hemophilia were used for all health states. Additional details are provided in the supplemental Methods.
Inputs used to populate the microsimulation Markov model
| Parameter | Value | Reference | ||
|---|---|---|---|---|
| Weight | Age-dependent Example: 30 years old: 89.30 kg | CDC NHANES22,23 | ||
| Cost-effectiveness threshold | $150 000 per added QALY | Institute for Clinical and Economic Review45 | ||
| Dosage | Supplemental Table 4 | BeneFix package insert46; ALPROLIX package insert47; Lexicomp9; Srivastava et al, 20205 | ||
| Costs Clotting factor (base case) Clotting factor (sensitivity analysis) Hospital bed/night Investigations Total joint replacement surgery (excluding factor concentrate) Gene therapy base case cost Gene therapy manufacturing cost (sensitivity analysis) Gene therapy follow-up cost | • SHL-FIX (BeneFix): $1.41/IU • EHL-FIX (ALPROLIX)*: $3.24/IU • SHL-FIX: $0.3/IU • EHL-FIX: $0.65/IU $995 Supplemental Tables 5 and 6 $13 187 $2 000 000 Total: $77 289 Direct costs: $48 917, indirect costs (58% of direct costs): $28 372 (Table 2) $9909 | WAC obtained from Redbook Online from Micromedex Solutions Knight et al, 200310; Farrugia et al, 201333; Miners, 200932; International Medical Products Price Guide (MSH) online database49 WHO-CHOICE Tool26 Centers for Medicare & Medicaid Services Online Database27 Medicare Procedure Price Lookup Online Database50; Centers for Medicare & Medicaid Services Online Database27 Cook et al, 202025; Wall Street Journal, 202024 Direct estimate of manufacturing cost from Children’s GMP, LLC, at SJCRH30 Centers for Medicare & Medicaid Services Online Database27 | ||
| Utilities On-demand Prophylaxis Gene therapy Joint damage decrement Minor bleed decrement Major bleed decrement Total joint replacement surgery decrement Injection decrement | 0.6705 – (0.0019 × age) 0.9378 – (0.0026 × age) Assumed to be the same as United States general population utilities (supplemental Figure 1) Depends on the year of joint damage; ranges between −0.14 and −0.38 (supplemental Table 4) −0.06 (for 1 wk) −0.18 (for 1 wk) −0.14 (for 1 mo) −0.0004 | Noone et al, 201351 Farrugia et al, 201333 Ara and Brazier, 201052 Szende et al, 201453 Carroll et al, 201954 Hoxer et al, 201955 Cook et al, 202025 | ||
| Transition probabilities/rates | ||||
| Annual bleeding rate (minor and major) Hospitalization Joint damage and total joint replacement surgery Mortality | Minor bleeds: • Prophylaxis: 1.2-5.5 • On-demand: 9.0-35.1 Major bleeds: • Prophylaxis: 0-0.2 • On-demand: 0.1-0.62 Post–gene therapy: No bleeding for 9 y, then minor bleeds occurred as the factor level dropped. Eventually, patient moved back to prophylaxis when the factor level dropped below 3 IU/dL (supplemental Table 4) Major bleed: hospitalization for 5 d per episode • Prophylaxis: None • On-demand/inhibitor: 1-3 per lifetime Supplemental Table 4 | Chen et al, 201756; Windyga et al, 201457; Collins et al, 201858; Kavakli et al, 201659; Powell et al, 201360; Lambert et al, 200761; Valentino et al, 201462; Santagostino et al, 201663; Shih et al, 201964; Ludlam et al, 200065; Soucie et al, 201816 BeneFix package insert46; ALPROLIX package insert47; Lexicomp9; Colowick et al, 200011; Knight et al, 200310 Castaman 201841; Lin et al, 201866 CDC WONDER,67 Hassan et al, 202068 | ||
CDC, Centers for Disease Control and Prevention; NHANES, National Health and Nutrition Examination Survey.
Several FIX-EHL products were analyzed. ALPROLIX was selected for inclusion in the model over IDELVION because based on the cost per unit and the package insert dosing instructions, it was the more cost-effective option. Comparative analysis of ALPROLIX vs IDELVION is available in supplemental Tables 9 and 10.
Main outcomes
The primary outcomes of this analysis were costs, quality-adjusted life-years (QALYs), and incremental cost-effectiveness ratio (ICER) per QALY gained associated with each treatment strategy (definitions are provided in supplemental Table 1). Secondary outcomes included number of bleeds and joint surgeries, life expectancy, and impact on quality of life.
Sensitivity analyses
One-way sensitivity analyses for key input parameters were performed by varying one input at a time while holding others constant at their base case estimates. In total, 102 different scenarios were conducted, representing the output from 17 scenario variations based off the 6 base case treatment approaches (2 approaches: SHL-FIX and EHL-FIX for each of the 3 treatment strategies [on-demand treatment, prophylaxis, and gene therapy]).
For the scenario variations, the altered key parameters were as follows. First, the long-term effectiveness of gene therapy was varied in 8 different scenarios. Four scenarios assumed a post–gene therapy FIX starting level of 34 IU/dL, similar to the base case, and were varied as follows: (1) a best-case scenario assumed that the effectiveness of gene therapy lasted forever; (2) a 2 IU/dL FIX annual decrement and switch to prophylaxis at FIX level <3 IU/dL; (3) a 1 IU/dL FIX annual decrement and switch to prophylaxis <15 IU/dL to test costs and effectiveness associated with maintaining a FIX trough level between 10% and 20%5; and (4) a 2 IU/dL FIX annual decrement and switch to prophylaxis <15 IU/dL. The 4 other scenarios assumed a post–gene therapy FIX starting level of 23 IU/dL as indicated by a recent, non–peer-reviewed publication.28 Because we assume minor bleeds occur at <25 IU/dL, in these 4 scenarios, patients experienced spontaneous minor bleeds immediately and were initially managed by using on-demand treatment. The first scenario variation assumed a 1 IU/dL FIX annual decrement and switch to prophylaxis at an FIX level <3 IU/dL. The other 3 scenario variations were defined as stated in scenarios 2 to 4 but with the new factor starting level.
Second, 4 scenarios tested the impact of different gene therapy and FIX prices on the final outcomes. The price of gene therapy was assumed to be $1 000 000,29 $3 000 000,24 and the at-cost manufacturing and delivery price derived by using actual pilot-scale phase 1/2 primary microcosting data obtained from the current Good Manufacturing Practice (cGMP) production campaign by Children’s GMP, LLC at SJCRH.30Table 2 details the item-line list of manufacturing costs associated with the production of a batch of AAV-mediated gene therapy vectors and the stepwise approach to calculate the cost per dose. The cost of AAV-vector was based on the direct costs (labor, supplies, and outside testing) with an indirect rate of 58%.31 The manufacturing process consisted of 10 runs of a 2-plasmid transient transfection of suspension HEK293 cells in a 200-L stirred-tank bioreactor producing 5 × 10¹⁶ viral genomes of product. Furthermore, to assess variability in negotiated factor concentrate pricing (possibly due to bulk purchase discounts or other purchasing mechanisms), we evaluated a hypothetical scenario in which we assumed a discounted factor concentrate price 20% the reported WAC in the United States. The discounted price was based on published unit SHL-FIX price ranges from the United Kingdom10,32,33 (Table 1).
Microcosting itemized list showing the manufacturing costs for gene therapy
| Microcosting list of gene therapy manufacturing costs for 73 patients* | ||||
|---|---|---|---|---|
| Task | Total labor cost | Supplies | Other expenses | Total direct cost in US$ |
| Viral production cell licensing fee | $15 166 | $74 000 | $20 000 | $109 166 |
| Quality assurance master batch production records and associated documentation | $32 921 | $300 | $0 | $33 221 |
| Drug substance cGMP manufacturing Quality control Quality assurance | $394 698 $75 037 $81 371 | $2 297 770 $57 015 $14 000 | $0 $339 500 $0 | $2 692 467 $471 552 $68 977 |
| Drug product | ||||
| cGMP manufacturing | $17 198 | $18 750 | $0 | $95 771 |
| Quality control | $8628 | $7950 | $9500 | $26 078 |
| Quality assurance | $13 395 | $50 | $0 | $13 445 |
| 36-Mo stability study | $37 271 | $37 100 | $21 000 | $95 371 |
| Total direct costs | $675 685 | $2 507 335 | $390 000 | $3 573 019 |
| Gene therapy manufacturing cost per dose calculations and assumptions | ||||
|---|---|---|---|---|
| Variable | Calculations | Value | ||
| Batch size (L) | None | 200 | ||
| Yield per liter of bioreactor volume | None | 2.50E+13 | ||
| Total no. of batches | None | 10 | ||
| Total vg titer from total no. of batches | Batch size (L) × yield per liter bioreactor volume × total no. of batches | 5.00E+16 | ||
| vg dose/kg | None | 8.00E+12 | ||
| Patient weight at 18 y per kg | None | 75.6 | ||
| vg per dose based on patient weight | vg dose/kg × patient weight (kg) | 6.05E+14 | ||
| Total no. of patient doses | ([Total no. of vials – vials needed for testing + 10% extra] × total vg/vial)/vg per dose based on patient weight | 73.042 | ||
| Fill volume per vial (mL) | None | 5.3 | ||
| Concentration of drug product (vg/mL) | None | 3.00E+12 | ||
| Total vg/vial | Fill volume per vial (mL) × concentration of drug product (vg/mL) | 1.59E+13 | ||
| Total no. of vials | Total vg from total no. of batches/total vg/vial | 3144.65 | ||
| Vials needed for testing | None | 333 | ||
| Vials needed for testing + 10% extra | None | 366.3 | ||
| Direct cost per dose ($) | Total direct cost/total no. of patient doses | $48 917 | ||
| Cost per dose ($) | Direct cost per dose ($) × 1.58 | $77 289 | ||
vg, viral genomes.
The number of patients has been rounded down from 73.042. Calculations above show how the number was derived.
Third, 3 scenarios varied the infusion age of gene therapy from 18 years in the base case to 25, 45, and 65 years of age. Finally, we tested the impact of an up-front post–gene therapy infusion failure rate of 2%34 and 5% on all outcome measures.
Probabilistic sensitivity analyses were conducted by simultaneously varying multiple input parameters across prespecified statistical distributions in 1000 iterations. Parameters are detailed in supplemental Table 4 and the supplemental Sensitivity section.
Results
Primary results
Excluding surgeries, the average annual inclusive undiscounted health care costs for a 30-year-old patient with severe hemophilia B receiving on-demand treatment were $427 628 for SHL-FIX and $292 286 for EHL-FIX. The analogous annual costs for prophylaxis were $559 779 for SHL-FIX and $776 331 for EHL-FIX. Factor concentrate costs represented 99.2%, 99.8%, and 88.9% of the overall costs of on-demand treatment, prophylaxis, and gene therapy, respectively. Undiscounted lifetime costs are provided in supplemental Table 11 and supplemental Figure 2.
The base case results are presented in Table 3. The gene therapy approach with the lowest cost per QALY was used as reference and compared with the 5 other approaches to calculate the ICER. Based on the model’s assumptions, gene therapy was less costly and yielded greater health benefits (dominant) than on-demand treatment or prophylaxis. When patients who received SHL-FIX prophylaxis after gene therapy–induced FIX levels have waned (Approach E) were compared with those who received EHL-FIX prophylaxis after gene therapy (Approach F), the latter generated slightly higher QALYs but was not cost-effective.
Base case average microsimulation results for 18-y-old until death time horizon, gene therapy infusion age 18 y old, in US dollars and QALYs
| Outcome | On-demand | Prophylaxis | Gene therapy | |||
|---|---|---|---|---|---|---|
| Standard half-life FIX | Extended half-life FIX | Standard half-life FIX | Extended half-life FIX | Standard half-life FIX | Extended half-life FIX | |
| Approach A | Approach B | Approach C | Approach D | Approach E | Approach F | |
| Costs | $11 596 617 | $7 917 721 | $15 109 058 | $20 324 299 | $6 293 502 | $7 315 914 |
| (11 586 467- 11 606 767)* | (7 911 165- 7 924 277)* | (15 101 499-1 5 116 617)* | (20 314 604- 20 333 993)* | (6 288 817- 6 298 187)* | (7 309 727- 7 322 100)* | |
| QALYs | 11.81 | 12.20 | 20.95 | 21.57 | 23.00 | 23.04 |
| (11.80-11.81)* | (12.20-12.21)* | (20.94-20.95)* | (21.56-21.58)* | (22.99-23.01)* | (23.03-23.05)* | |
| Cost/QALY | $981 932 | $648 994 | $721 196 | $942 248 | $273 631 | $317 531 |
| Gene ICER† | Dominant‡ | Dominant‡ | Dominant‡ | Dominant‡ | Reference§ | $25 560,300‖ |
Results are presented in boldface font for 3 treatment strategies: on-demand treatment, prophylaxis, and gene therapy, 2 approaches each: standard half-life FIX and extended half-life FIX. Approaches are labeled A to F. Supplemental Table 1 provides further definitions of standard health economics terms, and the supplemental Methods provides details regarding the methodologic approach.
95% Confidence intervals are presented between parentheses in regulat face font for all costs and QALYs.
ICER of gene therapy reference treatment approach vs alternative in costs per added QALY.
Gene therapy reference treatment approach is dominant (less costly and yields more QALYs).
Gene therapy approach with the lower cost per QALY was used as the reference and compared with the 5 other approaches.
Gene therapy reference treatment approach yields less QALYs but remains cost-effective considering a $150 000/QALY threshold.
Secondary results
Over a time horizon of 18 years old until death, patients receiving on-demand, prophylactic, or gene therapy treatment had respective averages of 992, 184, and 111 minor bleeds; 20, 6, and 3 major bleeds; 2, 0, and 0 total joint replacement surgeries; and 74, 75, and 76 life-years lived (supplemental Table 12). The clinical impacts associated with on-demand treatment reduced patient’s quality of life by 54%, equivalent to 31 undiscounted healthy life-years lost, compared with 26% for prophylaxis and 20% for gene therapy (supplemental Figure 2).
Uncertainty analysis
To determine the uncertainty around the base case results, 95% confidence ellipses of the 500 000 simulants were drawn to show the uncertainty of gene therapy ICERs compared with those of on-demand and prophylaxis replacement, respectively (Figure 2; supplemental Table 13). Gene therapy was dominant compared with SHL-FIX and EHL-FIX on-demand treatment, with respective probabilities of 90% and 56% and was dominant compared with SHL-FIX and EHL-FIX prophylaxis, with respective probabilities of 78% and 69%.
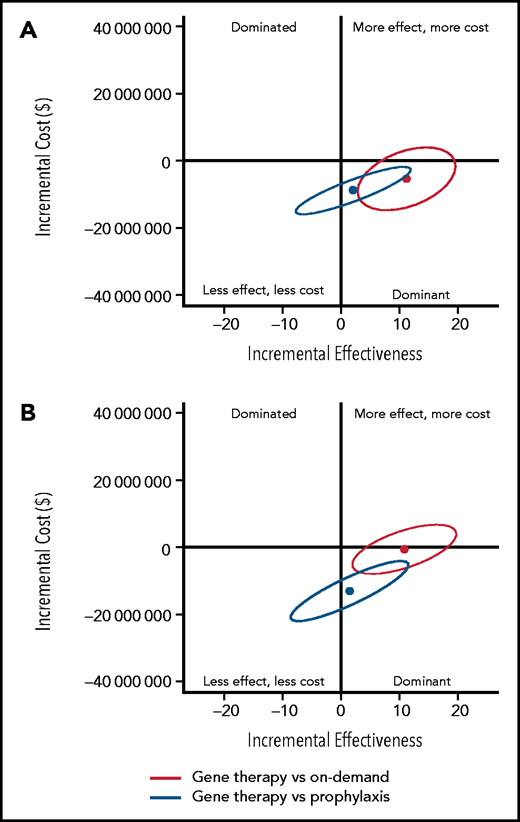
Uncertainty analysis of base case incremental costs and effectiveness of gene therapy compared with prophylaxis and on-demand replacement treatments. (A) Gene therapy compared with standard half-life FIX prophylaxis and on-demand treatments. (B) Gene therapy compared with extended half-life FIX prophylaxis and on-demand treatments. The y-axis represents the incremental costs of gene therapy compared with on-demand treatment or prophylaxis. The x-axis represents the incremental effects on a scale of –20 QALYs to 20 QALYs. Each dot represents the mean of the 500 000 simulants, and the ellipse surrounds 95% of the results. All results in the dominant quadrant are favorable for gene therapy and represent data points for which gene therapy is less costly and more effective than the alternative strategy. All results in the dominated quadrant are unfavorable for gene therapy and represent data points for which gene therapy is more costly and less effective compared with the alternative strategy. Results that lie within the right upper quadrant are considered cost-effective if the cost per QALY is equal to or below the threshold of $150 000/QALY. Above the threshold of $150 000/QALY, gene therapy is not considered cost-effective.
Uncertainty analysis of base case incremental costs and effectiveness of gene therapy compared with prophylaxis and on-demand replacement treatments. (A) Gene therapy compared with standard half-life FIX prophylaxis and on-demand treatments. (B) Gene therapy compared with extended half-life FIX prophylaxis and on-demand treatments. The y-axis represents the incremental costs of gene therapy compared with on-demand treatment or prophylaxis. The x-axis represents the incremental effects on a scale of –20 QALYs to 20 QALYs. Each dot represents the mean of the 500 000 simulants, and the ellipse surrounds 95% of the results. All results in the dominant quadrant are favorable for gene therapy and represent data points for which gene therapy is less costly and more effective than the alternative strategy. All results in the dominated quadrant are unfavorable for gene therapy and represent data points for which gene therapy is more costly and less effective compared with the alternative strategy. Results that lie within the right upper quadrant are considered cost-effective if the cost per QALY is equal to or below the threshold of $150 000/QALY. Above the threshold of $150 000/QALY, gene therapy is not considered cost-effective.
One-way sensitivity analyses
Table 4, supplemental Table 14, and supplemental Figure 3 show the results of 1-way sensitivity analysis scenarios using a time horizon of 18 years old until death. In the 8 scenario variations testing the long-term effectiveness of gene therapy, the intervention was either dominant or cost-effective compared with prophylaxis. On the other hand, gene therapy was either dominant or cost-effective in 6 of 8 scenario variations, and 3 of 8 scenario variations compared with SHL-FIX and EHL-FIX on-demand treatment approaches, respectively (Table 3). However, QALYs yielded by on-demand treatment were on average 43% to 50% lower than those associated with gene therapy.
One-way sensitivity analysis scenarios showing whether gene therapy is cost-effective vs on-demand and prophylaxis FIX replacement upon changing 1 parameter at a time
| Variations | No. | Altered parameter | On-demand | Prophylaxis | Gene therapy | ||||
|---|---|---|---|---|---|---|---|---|---|
| Standard half-life FIX | Extended half-life FIX | Standard half-life FIX | Extended half-life FIX | Standard half-life FIX | Extended half-life FIX | ||||
| (Approach A) | (Approach B) | (Approach C) | (Approach D) | (Approach E) | (Approach F) | ||||
| Gene therapy effectiveness in IU/dL | 1 | Starting level 34, annual decrement 0 | Reference | ||||||
| 2 | Starting level 34, annual decrement 2, switch at 3 | $262 930 | Reference | $9 046 671 | |||||
| 3 | Starting level 23, annual decrement 1, switch at 3 | $126 952 | Reference | $9 180 457 | |||||
| 4 | Starting level 23, annual decrement 2, switch at 3 | $100 274 | $488 374 | Reference | $8 568 882 | ||||
| 5 | Starting level 34, annual decrement 1, switch at 15 | $140 009 | Reference | $9 605 377 | |||||
| 6 | Starting level 34, annual decrement 2, switch at 15 | $109 567 | $499 266 | Reference | $8 665 383 | ||||
| 7 | Starting level 23, annual decrement 1, switch at 15 | $176 396 | $573 397 | Reference | $8 635 833 | ||||
| 8 | Starting level 23, annual decrement 2, switch at 15 | $372 979 | $792 777 | $85 731 | $19 939 915 | Reference | $8 564 752 | ||
| Cost in USD | 9 | Cost of gene therapy: Manufacturing cost | Reference | $25 560 300 | |||||
| 10 | Cost of gene therapy: $1 000 000 | Reference | $25 560 300 | ||||||
| 11 | Cost of gene therapy: $3 000 000 | Reference | $25 560 300 | ||||||
| 12 | Cost of FIX: 20% of wholesale acquisition cost | $35 486 | $116 709 | Reference | $4 481 850 | ||||
| Age at infusion | 13 | Age at infusion: 25 y | Reference | $15 555 425 | |||||
| 14 | Age at infusion: 45 y | $379 654 | Reference | $14 020 363 | |||||
| 15 | Age at infusion: 65 y | $268 118 | $682 517 | $25 729 958 | Reference | $10 851 282 | |||
| Failure rate | 16 | Post–gene therapy infusion failure rate 2% | Reference | $22 117 700 | |||||
| 17 | Post–gene therapy infusion failure rate 5% | Reference | $17 583 486 | ||||||
▪ Gene therapy approach with the lower cost per QALY was used as the reference and compared to the 5 other approaches.
▪ Gene therapy reference treatment approach is dominant (less costly and yields more QALYs).
▪ Gene therapy reference treatment approach is more costly but remained cost-effective considering a $150 000/QALY threshold.
▪ Gene therapy reference treatment approach is not cost-effective considering a $150 000/QALY threshold.
▪ Gene therapy reference treatment approach yields less QALYs but remains cost-effective considering a $150 000/QALY threshold.
Detailed results are presented in supplemental Table 14.
Total cost of manufacturing, administering, and 5-year follow-up of AAV-mediated FIX gene therapy, excluding development cost, was $87 198 per patient (manufacturing cost, $77 289; administration with follow-up cost, $9909) as retrieved from cGMP in SJCRH (Table 2; Table 4, Variation 9). Gene therapy remanied dominant when we assumed a gene therapy price of: manufacturing cost, $1 000 000 and $3 000 000. Moreover, when we assumed that the price of factor recombinant product was 20% of the reported WAC (assumed price of $0.3/IU and $0.65/IU compared with WAC of $1.41/IU and $3.24 for SHL-FIX and EHL-FIX, respectively) (Table 4,Variation 12), gene therapy remained dominant compared with SHL-FIX and EHL-FIX prophylaxis and cost-effective compared with SHL-FIX and EHL-FIX on-demand treatment approaches.
Finally, when we assumed a post–gene therapy failure rate of 2% or 5%, gene therapy remained dominant compared with both prophylaxis and on-demand treatments (Table 4,Variations 16 and 17).
Probabilistic sensitivity analysis
Because gene therapy followed by SHL-FIX prophylaxis (Approach E) was the more cost-effective treatment approach, and as such defined throughout the analyses as the reference approach, the probabilistic sensitivity analysis was conducted by using the SHL-FIX treatment approach. Results showed that gene therapy was estimated to be cost-effective in 43%, 75%, and 92% of simulations at a willingness-to-pay threshold of $50 000/QALY, $100 000/QALY, and $150 000/QALY, respectively (Figure 3; supplemental Figure 4).
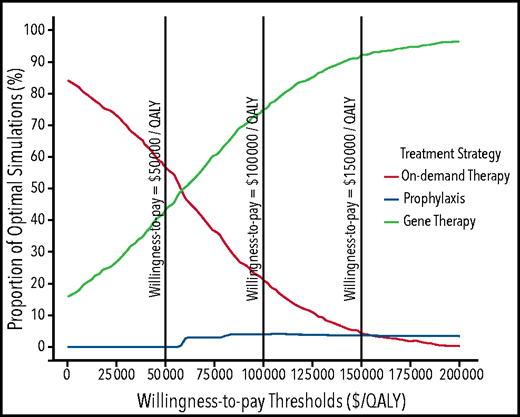
Probabilistic sensitivity analysis results showing acceptability curves for the 3 treatment strategies over an 18-years-old until death time horizon for patients treated by using standard half-life FIX. Acceptability curves plot the probability that a given therapy is the “optimal” choice (y-axis), at a given willingness-to-pay threshold (x-axis). At a willingness-to-pay threshold of $50 000, on-demand treatment, prophylaxis, and gene therapy were cost-effective at respective probabilities of 57%, 0%, and 43%. At a willingness-to-pay threshold of $100 000, on-demand treatment, prophylaxis, and gene therapy were cost-effective at respective probabilities of 21%, 4%, and 75%. At a willingness-to-pay threshold of $150 000, on-demand treatment, prophylaxis, and gene therapy were cost-effective at respective probabilities of 4%, 4%, and 92%. On-demand and gene therapy treatment curves intersect at a willingness-to-pay threshold of $60 000/QALY, indicating that gene therapy is cost-effective in >50% of the simulations compared with on-demand treatment if a willingness-to-pay threshold of $60 000/QALY or more is considered. Similarly, prophylaxis and on-demand treatment curves intersect at a willingness-to-pay threshold of $156 000/QALY, indicating that prophylaxis is cost-effective in >50% of the simulations compared with on-demand treatment if a willingness-to-pay threshold of $156 000/QALY is considered.
Probabilistic sensitivity analysis results showing acceptability curves for the 3 treatment strategies over an 18-years-old until death time horizon for patients treated by using standard half-life FIX. Acceptability curves plot the probability that a given therapy is the “optimal” choice (y-axis), at a given willingness-to-pay threshold (x-axis). At a willingness-to-pay threshold of $50 000, on-demand treatment, prophylaxis, and gene therapy were cost-effective at respective probabilities of 57%, 0%, and 43%. At a willingness-to-pay threshold of $100 000, on-demand treatment, prophylaxis, and gene therapy were cost-effective at respective probabilities of 21%, 4%, and 75%. At a willingness-to-pay threshold of $150 000, on-demand treatment, prophylaxis, and gene therapy were cost-effective at respective probabilities of 4%, 4%, and 92%. On-demand and gene therapy treatment curves intersect at a willingness-to-pay threshold of $60 000/QALY, indicating that gene therapy is cost-effective in >50% of the simulations compared with on-demand treatment if a willingness-to-pay threshold of $60 000/QALY or more is considered. Similarly, prophylaxis and on-demand treatment curves intersect at a willingness-to-pay threshold of $156 000/QALY, indicating that prophylaxis is cost-effective in >50% of the simulations compared with on-demand treatment if a willingness-to-pay threshold of $156 000/QALY is considered.
Cost-effectiveness threshold analysis
The following analyses were conducted by using gene therapy followed by SHL-FIX (Approach E) as the reference treatment rather than gene therapy followed by EHL-FIX (Approach F), because it was the more cost-effective approach between the 2 and thus would lead to a lower threshold. First, we conducted a cost-effectiveness threshold analysis to identify a threshold price at which gene therapy ceased being cost-effective. Using the base case assumptions, gene therapy (Approach E) remains cost-effective compared with Approaches A, B, C, and D (defined in Tables 3 and 4) if priced below $9 000 000, $5 500 000, $11 150 000, and $16 250 000, respectively (supplemental Table 15). Second, in an additional ad hoc analysis, using the discounted FIX cost of 20% the reported WAC price (Table 4, Variation 12), we estimated that Approach E remains cost-effective compared with Approaches A, B, C, and D if priced below $3 500 000, $2 500 000, $2 750 000, and $3 500 000. Third, when we identified a cost-effectiveness threshold based on age at gene therapy infusion, Approach E remained cost-effective compared with Approaches A, B, and C if injected before 55, 33, and 88 years of age, and was always cost-effective compared with Approach D.
To estimate the potential economic market value for gene therapy, we conducted a secondary threshold analysis assuming all eligible severe hemophilia B patients in the United States were to receive gene therapy (∼447 patients), based on a prevalence of 1 467 individuals and after excluding children, AAV8-positive patients, and FIX-inhibitor patients.18 Based on SJCRH cGMP facility data, the manufacturing cost to produce enough vector to treat all 447 patients was $34 500 000. Using these assumptions, if a gene therapy product was marketed at a price of $2 000 000, a pharmaceutical entity could generate a return on investment of $859 500 000 (minus expenditures such as manufacturing infrastructure, clinical trial conduct, regulatory approvals, and patient and provider education costs).
Discussion
This report is the first comprehensive cost and cost-effectiveness analysis from a United States third-party payer perspective of 3 treatment strategies for severe hemophilia B with analytic and outcomes implications generalizable to analyses of other diseases amenable to gene therapy interventions. We found that AAV-mediated gene therapy for severe hemophilia B seemed dominant over prophylaxis and on-demand factor replacement therapies, with few scenario exceptions. The main driver behind the high cost of replacement therapies was the price of clotting factors used to treat different types of hemophilia, of which 7 brands were ranked among the 10 most expensive medications per Medicare beneficiary.35 Our conclusions are based on detailed microcosting inputs and consideration of clinically relevant treatment scenarios, including new EHL-FIX products.
To our knowledge, this report is the first detailed microcosting analysis of the costs associated with the manufacturing and implementation of a gene therapy product. This finding provides important new data at a time when the price of gene therapy has raised greater public attention. Recently, it was announced that one gene therapy product for hemophilia A may be priced between $2 000 000 and $3 000 000, making it one of the most expensive drugs in the world.24 This publicly announced price is consistent with our secondary ad hoc cost-effectiveness threshold analysis results. However, by conducting a microcosting analysis of the AAV8 vector manufacturing process and requirements needed to deliver the product, we add further data to the complex public discourse surrounding drug pricing and extend the conversation beyond preference-based cost-effectiveness analyses. For example, the Institute for Clinical and Economic Review (ICER) recently published a report addressing the cost-effectiveness of valoctocogene roxaparvovec compared with prophylaxis for patients with hemophilia A. Despite efforts to obtain cost data, ICER noted that gene therapy manufacturers turned down the invitation to submit research, development, and manufacturing costs, which would affect the pricing of the new intervention.36 This highlights the importance of our microcosting data as a precedent for future therapeutic studies to include manufacturing, production, and clinical implementation costs for transparency purposes. Moreover, because the manufacturing process is similar across disease types, we expect that our costing data will provide a generalizable estimate against which to benchmark cost-effectiveness studies across other diseases amenable to similar gene therapy approaches, such as recently approved products for spinal muscular atrophy and RPE65 mutation–induced blindness.37-39
Regarding the cost-effectiveness of gene therapy, to date, 2 peer-reviewed studies and the report produced by ICER have compared gene therapy vs prophylaxis in patients with severe hemophilia A but none for hemophilia B.25,29,36 Our overarching finding, that gene therapy for severe hemophilia B was dominant over prophylaxis, is consistent with the results for hemophilia A. To compare the findings of the various models, it is important to deconstruct each model’s inputs and examine their relationship regarding the reported outcomes. When the prior 3 models and our model were examined together, we found that the main drivers of the final conclusions and the reported cost-effectiveness thresholds were: (1) the time horizon under consideration; (2) the assumed durability of gene therapy; (3) the assumed price of gene therapy; and (4) the unit cost of factor concentrate (which has ranged from $1.07/IU to 1.82/IU in prior studies). As a consequence, although all studies found gene therapy to be dominant, the reported costs, QALYs, and thresholds varied significantly.
Among the prior hemophilia A gene therapy simulation studies, Machin et al29 conducted a 10 years’ time horizon and found that gene therapy was dominant based on a price of $850 000 and that it would remain cost saving if priced below $1 600 000. Cook et al25 analyzed a 30-year-old until death time horizon. The study concluded that with an assumed gene therapy price of $2 000 000 and an average post–gene therapy durability period of 11 to 12 years, gene therapy would remain dominant if priced below $8 810 374. The ICER report36 analyzed a time horizon of 18 years old until death and concluded that with a gene therapy price of $2 500 000 and a FVIII level ≥1% for 12 years, gene therapy would remain cost-effective if priced up to a threshold of $7 490 000. Instead of providing a limited perspective, our flexible model design and analytic results expand the understanding of the health economics associated with hemophilia gene therapy by incorporating all relevant therapeutic strategies, real-world costs, and a wide range of plausible clinical outcomes using a singular analytic framework. This comprehensive approach allows different stakeholders to make informed decisions based on transparent inputs and unbiased evidence presented throughout the study.
To elaborate on the 4 mentioned drivers, with regard to time horizon, our analysis was similar to the ICER report and considered a perspective of age 18 years until death. By using a shorter time horizon, the other prior models side-step the duration question to a certain degree. However, this approach is also limiting as it ignores the potential major long-term cost-effectiveness benefits associated with a sustained efficacy of gene therapy. In addition, because our model also allowed us to adjust the starting age, we were able to establish age limits and identify when gene therapy is no longer the most effective strategy.
In terms of the second driver, gene therapy durability, our model considered a longer durability period for gene therapy’s effectiveness in the base case scenario. This is consistent with the early results from published clinical trials specific to hemophilia B40 and thus partially explains the differences in calculated cost-effectiveness thresholds observed. However, this model is the first to incorporate different long-term effectiveness possibilities and examine how this variable may affect cost-effectiveness outcomes. Using this approach, we remain confident that even if real-world results do not perfectly correlate with clinical trials, gene therapy is still likely to remain a cost-effective therapeutic strategy compared with the alternative treatment options.
For the third driver identified, the price of gene therapy, we conducted multiple 1-way sensitivity analysis scenarios to evaluate the impact of different pricing strategies. None of the prior studies has addressed this question. As a low-bound threshold analysis, we used the manufacturing and delivery cost of gene therapy vector based on actual pilot scale phase 1/2 cGMP manufacturing and clinical implementation costs rather than only costs reported by commercial entities. Notably, this cost may be lower when manufactured on a commercial scale. As expected, using at-cost pricing resulted in a dominant gene therapy strategy. We also evaluated the implications of multiple different price points within the proposed range of $1 000 000 to $3 000 000 and identified that gene therapy remained cost-effective compared with the 4 alternative approaches up to at least $5 500 000 in our base case analysis.
The last driver, the unit cost of factor concentrates, was particularly important and had an outsized impact on all models. The 2 prior peer-reviewed studies used only the WAC for SHL-FVIII products.25,29 These price points can be misleading as published factor unit costs from the United Kingdom10,32,33 indicate that real-world pooled purchasing agreements can yield prices as low as 20% of the published WAC. To better reflect real-world pricing and appreciate how pricing structures may shift if gene therapy emerges as a competitive alternative treatment strategy, the ICER report estimated a discounted price that was 64% and 82% of WAC for SHL-FVIII and EHL-FVIII, respectively.36 We expanded on this approach and conducted a subanalysis using factor prices 20% the WAC for SHL-FIX and EHL-FIX in the United States (aligned with pricing in the United Kingdom) and showed that gene therapy still remained cost-effective. These results should inform budget, purchasing, and international pricing decisions made by governments, even outside the United States, as well as insurance programs and pharmaceutical companies.
Beyond parameter choice, all 3 hemophilia A models also excluded on-demand therapy as a treatment option. Although prophylaxis is medically recommended for patients with severe hemophilia, a 2017 United States data set of 3320 patients with hemophilia B estimated that 25% of severe patients were still treated on-demand only.41 Thus, despite reducing quality of life, on-demand treatment remains the preference for some patients, making its inclusion in cost-effectiveness comparisons important.
Finally, our data are the first to compare SHL-FIX and EHL-FIX factor products as distinct treatment approaches. EHL-FIX is gradually becoming the standard of care, and the trade-off between cost and quality-of-life gains has not been reported. EHL-FIX was the dominant option in the on-demand strategy despite its high unit cost because patients needed fewer doses of EHL-FIX to control a minor bleed. However, in both prophylaxis and gene therapy strategies, EHL-FIX resulted in slightly higher QALYs due to fewer injections yet was interestingly not cost-effective because it was substantially more expensive.
Although our modeling approach synthesized data from multiple published and observed sources, there were several limitations. First, because hemophilia B is rare, select data were borrowed from the hemophilia population as a whole, assuming certain probabilities and utilities were independent of hemophilia type.42 To account for this uncertainty, all sources were evaluated to create parameter values that included maximum and minimum ranges when feasible.
Second, although we modeled a lifetime horizon, there were not enough data to inform the long-term durability of factor levels or safety parameters after gene therapy administration.43 We therefore made several conservative assumptions regarding the sustained effect of gene therapy in the base case and conducted several 1-way sensitivity analyses. Because an 8-year published cohort40 showed no evidence of waning FIX levels, our assumptions represent a pessimistic viewpoint that biases our results against gene therapy. Our extensive testing of multiple scenarios, with a best- and worst-case scenario for each parameter, provides clinical investigators and other key stakeholders with data on several plausible assumptions (supplemental Table 14). Regarding safety, no serious long-term toxicity data have been published to date. A single case of hepatocellular carcinoma after liver-directed AAV-mediated gene therapy was recently reported in a phase 3 trial participant of etranacogene dezaparvovec (AAV5-hFIXco Padua). However, the patient had gene therapy–independent risk factors of a 25-year history of hepatitis C and hepatitis B infections as well as non-alcoholic fatty liver disease and advanced age. Investigations into etiology and the potential role of AAV-mediated gene therapy are still ongoing, but no data have yet been published.44 Therefore, at this time, we incorporated the safety profile reported from the longest published cohort available and followed a similar modeling approach to serious adverse events as that taken by the 3 previously published models.
Third, there are currently at least 4 different gene therapy vectors under development for hemophilia B. Variability across various products and between individual patients is likely but cannot be defined at this early point. Nonetheless, we addressed this uncertainty by presenting numerous sensitivity analysis scenarios based on different possible assumptions, including accounting for upfront treatment failure.
Fourth, gene therapy cost within one of the 1-way sensitivity analyses was inputted by using actual direct manufacturing costs of a phase 1/2 production lot of 5 × 10¹⁶ viral genomes at SJCRH cGMP. Capital expenditure costs were not considered in the analysis because they largely represent sunken costs; existing facilities can be repurposed to manufacture gene therapy vectors, and the same facility can produce multiple vectors for different diseases. In addition, the research and development costs required before product marketing and patient and provider education costs were excluded. To address this gap, we conducted primary and secondary threshold analyses to reveal the potential surplus that companies can use to offset expenses.
Fifth, this analysis focused on current ongoing gene therapy intervention eligibility groups such as adult patients without inhibitors or AAV8 antibodies. Because the etranacogene dezaparvovec clinical trial did not exclude preexisting neutralizing antibodies, future research to address the societal implications of excluding patients based on serologic markers will be needed. Our model is designed to accommodate these scenarios in the future as more data become available.
Finally, our treatment strategies were limited to three: on-demand therapy, primary prophylaxis, and primary prophylaxis followed by gene therapy. Other options, including secondary prophylaxis, low-dose prophylaxis, and on-demand treatment followed by gene therapy, were not analyzed in our model because they are less frequently used in high-income settings. However, our model is flexible enough to accommodate different parameters should the standard of care evolve.
In summary, based on observed clinical data, real-world costs, and several model assumptions when evidence was lacking, gene therapy seemed more cost-effective than either prophylaxis or on-demand treatment of severe hemophilia B when analyzed from a United States third-party payer perspective. Pending further clinical trial data and final pricing decisions, gene therapy has the potential to yield significant budget savings for health care systems while improving patients’ outcomes and quality of life. Using an innovative simulation approach and real-world costing data, we also believe that this analysis provides a template for future studies of novel gene therapy approaches, agnostic of disease and treatment product.
Acknowledgments
St Jude Children's Research Hospital which is supported by the American Lebanese Syrian Associated Charities, funded this study.
The funding organization had no role in the study design, data collection, analysis, interpretation, or writing the report. The corresponding author had full access to all the data in the study and had final responsibility for the decision to submit for publication.
Authorship
Contribution : N.S.B., Y.C., and N.B. had full access to all data in the study and take responsibility for the integrity of the data and the accuracy of the data analysis; N.S.B., U.M.R., and N.B. were responsible for concept and design; N.S.B. and N.B. drafted the manuscript; N.S.B., Y.C., M.D., and N.B. were responsible for statistical analysis; N.S.B. provided administrative, technical, or material support; and M.D., U.M.R., and N.B. supervised the study; all authors were involved in the acquisition, analysis, or interpretation of data; and all authors critically revised the manuscript for important intellectual content.
Conflict-of-interest disclosure: E.J.N. has served on advisory boards for BioMarin, Genentech, Novo Nordisk, and Octapharma; was a consultant to Pfizer and Bayer; and has received honoraria from Octapharma and Novo Nordisk. A.M.D. and A.C.N. have contributed to the design of the shortened LP1 promoter of the scAAV2/8-FIX-Padua vector. They are entitled to receive a share of net license income if this vector is commercialized. The remaining authors declare no competing financial interests.
Correspondence : Nancy S. Bolous, Department of Global Pediatric Medicine, St Jude Children’s Research Hospital, 262 Danny Thomas Place, Mail Stop: 721, Memphis, TN 38105; e-mail: nancy.bolous@stjude.org.
Model input parameters were derived from public domain resources; gene therapy manufacturing costs are available in Table 2, and other microcosting data may be found in the supplemental material (Tables 5-9).
The online version of this article contains a data supplement.
There is a Blood Commentary on this article in this issue.
The publication costs of this article were defrayed in part by page charge payment. Therefore, and solely to indicate this fact, this article is hereby marked “advertisement” in accordance with 18 USC section 1734.

This feature is available to Subscribers Only
Sign In or Create an Account Close Modal