

Key Points
Deacetylation of histone and nonhistone proteins by HDAC5 is necessary for proliferation and enucleation of human erythroblasts.
HDAC5 deficiency-induced impairment in histone 4 deacetylation leads to decreased chromatin condensation of late-stage erythroblasts.

Abstract
Histone deacetylases (HDACs) are a group of enzymes that catalyze the removal of acetyl groups from histone and nonhistone proteins. HDACs have been shown to have diverse functions in a wide range of biological processes. However, their roles in mammalian erythropoiesis remain to be fully defined. This study showed that, of the 11 classic HDAC family members, 6 (HDAC1, -2, -3, and HDAC5, -6, -7) are expressed in human erythroid cells, with HDAC5 most significantly upregulated during terminal erythroid differentiation. Knockdown of HDAC5 by either short hairpin RNA or small interfering RNA in human CD34+ cells followed by erythroid cell culture led to increased apoptosis, decreased chromatin condensation, and impaired enucleation of erythroblasts. Biochemical analyses revealed that HDAC5 deficiency resulted in activation of p53 in association with increased acetylation of p53. Furthermore, although acetylation of histone 4 (H4) is decreased during normal terminal erythroid differentiation, HDAC5 deficiency led to increased acetylation of H4 (K12) in late-stage erythroblasts. This increased acetylation was accompanied by decreased chromatin condensation, implying a role for H4 (K12) deacetylation in chromatin condensation. ATAC-seq and RNA sequencing analyses revealed that HDAC5 knockdown leads to increased chromatin accessibility genome-wide and global changes in gene expression. Moreover, pharmacological inhibition of HDAC5 by the inhibitor LMK235 also led to increased H4 acetylation, impaired chromatin condensation, and enucleation. Taken together, our findings have uncovered previously unrecognized roles and molecular mechanisms of action for HDAC5 in human erythropoiesis. These results may provide insights into understanding the anemia associated with HDAC inhibitor treatment.
Introduction
Erythropoiesis is the process by which hematopoietic stem and progenitor cells (HSPCs) proliferate and differentiate to ultimately generate mature red blood cells. During erythroid development, HSPCs committed to erythroid lineage form burst-forming unit-erythroid cells that further develop to generate colony-forming unit-erythroid (CFU-E) cells. Both burst-forming erythroid and CFU-E cells are highly proliferative and possess limited self-renewal ability. During terminal erythroid differentiation, CFU-E cells sequentially differentiate into proerythroblasts and basophilic , polychromatic, and orthochromatic erythroblasts. Mammalian terminal erythroid differentiation is characterized by a decrease in cell size, increase in hemoglobin synthesis, chromatin condensation, nuclear polarization, and extrusion of the condensed nucleus. The ability to undergo cell division progressively diminishes during terminal erythroid differentiation. Proerythroblasts can divide 4 times, but orthochromatic erythroblasts do not divide at all.1 Thus, erythropoiesis is a complex process that is tightly regulated by multiple mechanisms .
Previous studies have firmly established an essential role for erythropoietin and its receptor in the survival of CFU-E and proerythroblasts.2-6 At the transcriptional level, many transcription factors play important roles in erythropoiesis,7 with GATA1 and KLF1 recognized as the master regulators of erythropoiesis.8,9 In contrast to the many studies of cytokines and transcription factors in regulating erythropoiesis, the contribution of other biologic processes is less well understood. Recent studies have begun to uncover the roles of long noncoding RNA,10,11 micro-RNA,12,13 splicing factors,14 DNA methylation,15,16 and histone methylation17,18 in regulating erythropoiesis.
Histone deacetylases (HDACs) are a family of enzymes that catalyze the removal of the acetyl moiety from lysine residues. To date, 18 human HDACs have been identified19 and classified into 5 subclasses: class 1 (HDAC1, 2, -3, and -8); class 2a (HDAC4, -5, -7, and -9), class 2b (HDAC6 and HDAC10), class 3, also known as sirtuins (SIRT1 to -7); and class 4 (HDAC11). Classes 1 and 2 are zinc-dependent enzymes and are the “classic” HDACs. Class 3 HDACs require NAD as a cofactor for their activities. Class 4, HDAC11, is classified as an atypical enzyme. HDACs play important roles in a multitude of cellular processes, including cell differentiation and apoptosis via deacetylating both histones and nonhistone proteins. In the nucleus, acetylation of histones affects chromatin condensation.20 In the cytoplasm, acetylation of α-tubulin has been shown to affect cytokinesis.21 HDACs have been hypothesized to play important roles in the regulation of erythropoiesis, as progressive chromatin condensation is a characteristic feature of terminal erythroid differentiation. Hdac2 and Hdac6 are necessary for chromatin condensation and enucleation of murine erythroblasts,22,23 with the role of Hdac5 in murine erythropoiesis remaining controversial.20,22 Although studies using HDAC inhibitors suggest that HDACs play pleotropic roles in human erythropoiesis,24,25 the precise roles of HDACs in human erythropoiesis are yet to be fully defined.
In the present study, we document that of the 6 HDACs expressed in erythroid cells, the expression of HDAC5 is most dramatically increased during late stages of human erythropoiesis. HDAC5 knockdown significantly affected human terminal erythroid differentiation, including increased apoptosis, decreased chromatin condensation, and impaired enucleation. Mechanistically, HDAC5 knockdown resulted in increased acetylation of p53 accompanied by activation of the p53 pathway. HDAC5 knockdown also led to increased acetylation of H4 at Lys12 associated with decreased chromatin condensation. Consistent with a more open chromatin state, assay for transposase-accessible chromatin–sequencing (ATAC-seq) analyses showed that chromatin accessibility was increased genome wide in HDAC5-knockdown cells. RNA sequencing (RNA-seq) analyses revealed that expression of genes involved in cell division and chromosome segregation were downregulated in HDAC5-knockdown orthochromatic erythroblasts, both of which are associated with impaired enucleation. Our findings have uncovered novel functional roles for HDAC5 in regulating human terminal erythroid differentiation. These findings provide insights into increased understanding of anemia associated with HDAC inhibitor treatment.
Materials and methods
Antibodies
The mouse monoclonal antibody against the extracellular region of human band 3 generated in our laboratory was used as previously described.1,26 Other antibodies and reagents used for flow cytometry, western blot, immunofluorescence, and ImageStream analyses are listed in supplemental Table 1 (available on the Blood Web site).
In vitro differentiation of CD34+ cells toward erythroid lineage, flow cytometry analysis, fluorescence-activated cell sorting, and western blot analysis
CD34+ cells were purified by using magnetic beads from peripheral blood of healthy donors at the New York Blood Center or Zhengzhou University. The CD34+ cells were differentiated toward the erythroid lineage by using a 3-phase culture system, and erythroid differentiation was monitored by analyzing the surface expression of glycophorin A (GPA), band 3, and α4-integrin, as previously described.1 Apoptosis was assessed by 7AAD and annexin V staining, and enucleation was analyzed with the cell-permeant nucleic acid dye SYTO 16 (ThermoFisher).15,27-30 Stained cells were analyzed on a BD LSRFortessa flow cytometer, and data analyses were performed with FCS Express 6 or Flow Jo software. Erythroid cells at distinct differentiation stage were sorted with a MoFlo high-speed cell sorter (Beckman-Coulter), as previously described.1 Western blot analysis was performed as described previously.31,32 Image J software was used to quantify the protein expression levels and to measure the nuclear diameter of the erythroblasts.
Preparation of lentivirus particles, shRNA-mediated knockdown, siRNA-mediated knockdown, and qRT-PCR
Lentivirus particle preparation, short hairpin RNA (shRNA)-mediated knockdown as well as small interfering RNA (siRNA)–mediated knockdown in CD34+ cells was performed as previously described.14-16,33 All plasmids were purchased from Sigma-Aldrich (St Louis, MO). siRNA oligos were purchased from Gene Pharma (Shanghai, China). The sequences of shRNA and siRNA oligos are listed in supplemental Table 2. Primer sequences for quantitative real-time polymerase chain reaction (qRT-PCR) were obtained from the Harvard primer bank and synthesized by Eurofins MWG Operon, LLC. The sequences of primers used in the present study are listed in supplemental Table 2. qRT-PCR was performed as previously described.14,15
Image flow cytometry
To examine chromatin condensation, we stained sorted erythroblasts with APC-conjugated mouse anti-human GPA and Hoechst 33342. To observe the relationship between acetylated histone 4 (AC-H4) and chromatin condensation, we fixed the sorted erythroblasts in 4% paraformaldehyde and then incubated them with mouse anti human AC-H4. The details of the staining process are described in supplemental Materials and methods. The stained cells were subjected to Amnis ImageStream analysis. Data were collected on an Amnis ImageStream Mark II instrument with a 60× objective. IDEAS software was used to analyze the data.
Coimmunoprecipitation
Total cell lysates were prepared from K562 cells with RIPA buffer (ThermoFisher Scientific). Immunoprecipitation was performed using anti-histone H4 or HDAC5 antibody. Detailed methodology is described in the supplemental Materials and methods.
Treatment of erythroblasts with HDAC5 inhibitor
The sorted polychromatic and orthochromatic erythroblasts were incubated in the presence of dimethyl sulfoxide (Sigma-Aldrich) or the HDAC5 inhibitor LMK235 (Selleck Chemicals, Houston, TX) for 24 or 48 hours. The treated cells were subjected to an enucleation assay, cytospin, and western blot analysis.
RNA-seq and ATAC-seq
Using fluorescence-activated cell sorting, we extracted RNA from polychromatic and orthochromatic erythroblasts after HDAC5 knockdown. Details of data generation and analyses are described in the supplemental Materials and methods.
Statistics
All experiments were replicated ≥3 times. Prism 7.0 (GraphPad Software) was used to perform the statistical analysis. Data are expressed as the mean ± standard deviation (SD). For all data, P < .05 indicated a statistically significant difference.
Results
HDAC5 expression is dramatically upregulated during human terminal erythroid differentiation
To begin to study potential roles of HDACs in human erythropoiesis, we examined the messenger RNA (mRNA) expression patterns of the HDACs in human erythroid cells at all developmental stages.34 Human erythroid cells expressed 6 of the 11 classic HDACs: HDAC1, -2, and -3 and HDAC5, -6, and -7 (Figure 1A). The expression levels of HDAC4 and HDAC8 to -11 was very low or undetectable, whereas the expression levels of HDAC1, -2, and -3 were relatively constant across all stages of erythroid development and differentiation. Although expression levels of HDAC7 decreased progressively during terminal erythroid differentiation, expression levels of HDAC5 and HDAC6 increased. Notably, HDAC5 was the most highly expressed HDAC, and its expression was dramatically upregulated at late stages of terminal erythroid differentiation. Compared with HDAC5, HDAC6 expression was slightly upregulated during erythroid differentiation, but to a much lower level. The progressive increase in expression of HDAC5 was confirmed by qRT-PCR (Figure 1B) and western blot analysis (Figure 1C). The dramatic upregulation of HDAC5 in late-stage erythroblasts suggests a potentially important role for HDAC5 at these stages of human terminal erythroid differentiation.
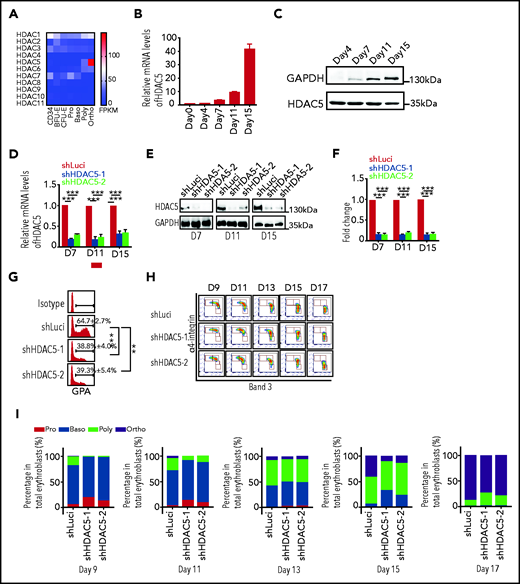
Effects of HDAC5 knockdown on terminal erythroid differentiation. (A) Heat map showing mRNA levels of HDACs, as assessed by RNA-seq in erythroblasts. (B) qRT-PCR results showing HDAC5 mRNA expression levels in erythroblasts cultured for 0, 4, 7, 11, and 15 days . β-Actin was used as the internal reference. Data are expressed as the mean ± SD of triplicate samples. (C) Representative western blots showing HDAC5 protein levels in erythroblasts cultured for 4, 7, 11, and 15 days. (D) qRT-PCR results showing HDAC5 mRNA expression levels in luciferase-shRNA (shLuci) or HDAC5-shRNAs (shHDAC5) transduced erythroblasts cultured for 7, 11, and 15 days. β-Actin was used as the internal reference. Data are expressed as the mean ± SD of triplicate samples. (E) Representative western blot showing HDAC5 protein levels in shLuci- or shHDAC5-transduced erythroblasts cultured for 7, 11, and 15 days. (F) Quantitative analysis of HDAC5 protein levels from 3 independent experiments. (G) Flow cytometry analysis showing the percentage of GPA+ cells on day 7. (H) Flow cytometry analysis showing the expression of α4-integrin and band 3 on erythroid cells cultured for the days indicated. (I) Quantitative analyses of erythroblasts at distinct stages. (D,F-G) **P < .01; ***P < .001. GADPH, glyceraldehyde-3-phosphate dehydrogenase; NS, nonsignificant.
Effects of HDAC5 knockdown on terminal erythroid differentiation. (A) Heat map showing mRNA levels of HDACs, as assessed by RNA-seq in erythroblasts. (B) qRT-PCR results showing HDAC5 mRNA expression levels in erythroblasts cultured for 0, 4, 7, 11, and 15 days . β-Actin was used as the internal reference. Data are expressed as the mean ± SD of triplicate samples. (C) Representative western blots showing HDAC5 protein levels in erythroblasts cultured for 4, 7, 11, and 15 days. (D) qRT-PCR results showing HDAC5 mRNA expression levels in luciferase-shRNA (shLuci) or HDAC5-shRNAs (shHDAC5) transduced erythroblasts cultured for 7, 11, and 15 days. β-Actin was used as the internal reference. Data are expressed as the mean ± SD of triplicate samples. (E) Representative western blot showing HDAC5 protein levels in shLuci- or shHDAC5-transduced erythroblasts cultured for 7, 11, and 15 days. (F) Quantitative analysis of HDAC5 protein levels from 3 independent experiments. (G) Flow cytometry analysis showing the percentage of GPA+ cells on day 7. (H) Flow cytometry analysis showing the expression of α4-integrin and band 3 on erythroid cells cultured for the days indicated. (I) Quantitative analyses of erythroblasts at distinct stages. (D,F-G) **P < .01; ***P < .001. GADPH, glyceraldehyde-3-phosphate dehydrogenase; NS, nonsignificant.
HDAC5 deficiency impairs terminal erythroid differentiation
To examine the effects of HDAC5 deficiency on human terminal erythroid differentiation, we first used an shRNA-mediated knockdown approach in primary human CD34+ cells, in conjunction with an in vitro erythroid cell culture system.14-16,35 HDAC5 was efficiently downregulated at both the mRNA and protein levels (Figure 1D-F). Notably, no significant differences were found in the expression of other HDACs in HDAC5 shRNA–transduced cells (supplemental Figure 1), which demonstrates the specificity of HDAC5 shRNA. The differentiation of CFU-E cells to proerythroblasts was assessed by monitoring the surface expression of GPA, a marker for the transition of CFU-E to proerythroblasts. Although >60% of luciferase shRNA–transduced cells were GPA+on day 7 of culture, less than 40% of HDAC5 shRNA–transduced cells were GPA+ (Figure 1G), implying impaired differentiation of CFU-E to proerythroblasts upon HDAC5 knockdown. Differentiation of proerythroblasts to late-stage erythroblasts was monitored by flow cytometry using α4-integrin and band 3 as surface markers (Figure 1H). Quantitative analyses of erythroblasts at different stages revealed that HDAC5 deficiency delayed terminal erythroid differentiation (Figure 1I).
HDAC5 deficiency leads to increased apoptosis of late-stage erythroblasts caused by increased acetylation of p53
Examination of the effect of HDAC5 deficiency on cell growth showed no significant decrease in the number of HDAC5-knockdown cells compared with control cells from days 7 to 9 (Figure 2A). However, a significant decrease in the number of HDAC5-knockdown cells vs control cells was noted, starting at day 9. To define the basis for the impaired cell growth, we measured apoptosis by flow cytometry, using 7AAD and annexin V. Representative profiles of 7AAD and annexin V staining on day 13 of culture are shown in Figure 2B. Quantitative analysis showed that, whereas there was no significant difference in annexin V+ cells on day 9, significant increases in the percentage of annexin V+ cells were noted on days 11, 13, and 15 for HDAC5-knockdown cells (Figure 2C). To define the mechanistic basis for the increased apoptosis, we examined the activation of the p53 pathway, the most common pathway associated with apoptosis. Western blot analysis showed increased expression levels of p53 protein and its downstream targets, Bax and p21, in HDAC5-knockdown cells compared with control cells (Figure 2D-E). Interestingly, there was no significant difference in p53 mRNA levels between control and HDAC5-knockdown cells (Figure 2F), suggesting that the increased level of p53 protein is posttranscriptionally regulated. It has been shown that HDAC5 directly interacts with p53 and deacetylates p53 at K120, thus stabilizing p53.36 We examined the acetylation of p53 (K120) and found that acetylation of p53 was significantly increased in HDAC5-knockdown cells (Figure 2D-E). No differences in expression of MDM2 and MRKN1, 2 ubiquitin ligases responsible for p53 degradation, were noted between control and HDAC5-knockdown cells (Figure 2D-E). These findings imply that HDAC5 knockdown led to increased apoptosis of erythroblasts at late stages of terminal erythroid differentiation as a consequence of the increased acetylation of p53.
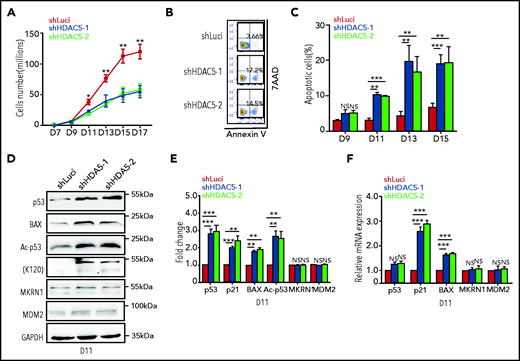
HDAC5 knockdown leads to increased apoptosis caused by activation of the p53 pathway. (A) Growth curves of cells transduced with lentivirus containing luciferase-shRNA or HDAC5-shRNAs. (B) Representative flow cytometry profiles of apoptosis as assessed by dual staining of annexin V and 7AAD at day 13 of culture. (C) Quantitative analysis of apoptosis from 3 independent experiments. (D) Representative western blot analyses of molecules, as indicated on day 11 cultured erythroblasts. (E) Quantitative analysis of the western blot results from 3 independent experiments. (F) qRT-PCR analyses of the molecules as indicated on day 11 cultured erythroblasts. (A,C,E-F) *P < .05; **P < .01; ***P < .001; NS, nonsignificant. GAPDH, glyceraldehyde-3-phosphate dehydrogenase.
HDAC5 knockdown leads to increased apoptosis caused by activation of the p53 pathway. (A) Growth curves of cells transduced with lentivirus containing luciferase-shRNA or HDAC5-shRNAs. (B) Representative flow cytometry profiles of apoptosis as assessed by dual staining of annexin V and 7AAD at day 13 of culture. (C) Quantitative analysis of apoptosis from 3 independent experiments. (D) Representative western blot analyses of molecules, as indicated on day 11 cultured erythroblasts. (E) Quantitative analysis of the western blot results from 3 independent experiments. (F) qRT-PCR analyses of the molecules as indicated on day 11 cultured erythroblasts. (A,C,E-F) *P < .05; **P < .01; ***P < .001; NS, nonsignificant. GAPDH, glyceraldehyde-3-phosphate dehydrogenase.
HDAC5 deficiency leads to impaired enucleation and generation of abnormally nucleated erythroblasts
The effect of HDAC5 deficiency on enucleation, the last step in terminal erythroid differentiation, was monitored by SYTO 16 staining.15,27-30 Representative enucleation profiles are shown in Figure 3A. Quantitative analysis showed that in our culture conditions, control cells started to enucleate on day 13, and the percentage of enucleated cells was ∼60% on day 17 of culture. In contrast, although HDAC5-knockdown cells also began to enucleate on day 13, the maximum enucleation rate was ∼20% (Figure 3B). Impaired enucleation was also demonstrated by study of cytospin images (Figure 3C). In examining the morphological images of erythroblasts, we noted an increased number of erythroblasts with abnormal nuclei in HDAC5-knockdown cultures. To determine at which stage of terminal differentiation binucleated/multinucleated erythroblasts are generated, we sorted erythroblasts at each distinct developmental stage using α4-integrin and band 3 as surface markers.1 Representative cytospin images revealed that both control and HDAC5-knockdown sorted erythroblast populations showed the expected morphological features resembling proerythroblasts and basophilic, polychromatic, and orthochromatic erythroblasts (Figure 3D), indicating that HDAC5 knockdown did not affect the expression of α4-integrin and band 3. Quantitative analysis revealed that, in our culture conditions, whereas only ∼5% of control polychromatic and orthochromatic erythroblasts exhibited abnormal nuclei, ∼20% of HDAC5-knockdown cells exhibited this feature (Figure 3E).
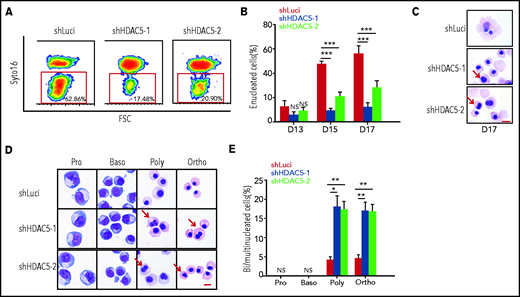
Impaired enucleation and generation of abnormal nuclei after HDAC5 knockdown. (A) Representative profiles of enucleation as assessed by SYTO 16 staining on day 17 of culture. The enucleation percentage was calculated as the SYTO 16–negative cells in the total population. (B) Quantitative analysis of enucleation on the indicated days from 3 independent experiments. (C-D) Representative cytospin images of day 17 erythroblasts (C). Representative cytospin images of sorted distinct stages of erythroblasts (D). Red arrows indicate binucleated and multinucleated erythroblasts. Scale br, 10 μm. (E) Quantification of binucleated and multinucleated erythroblasts in sorted erythroblasts at the different developmental stages. (B, E) *P < .05; **P < .01; ***P < .001. Baso, basophilic erythroblasts; Ortho, orthochromatic erythroblasts; Poly, poly chromatic erythroblasts; Pro, proerythroblasts.
Impaired enucleation and generation of abnormal nuclei after HDAC5 knockdown. (A) Representative profiles of enucleation as assessed by SYTO 16 staining on day 17 of culture. The enucleation percentage was calculated as the SYTO 16–negative cells in the total population. (B) Quantitative analysis of enucleation on the indicated days from 3 independent experiments. (C-D) Representative cytospin images of day 17 erythroblasts (C). Representative cytospin images of sorted distinct stages of erythroblasts (D). Red arrows indicate binucleated and multinucleated erythroblasts. Scale br, 10 μm. (E) Quantification of binucleated and multinucleated erythroblasts in sorted erythroblasts at the different developmental stages. (B, E) *P < .05; **P < .01; ***P < .001. Baso, basophilic erythroblasts; Ortho, orthochromatic erythroblasts; Poly, poly chromatic erythroblasts; Pro, proerythroblasts.
HDAC5 knockdown impairs chromatin condensation of polychromatic and orthochromatic erythroblasts
A unique characteristic of terminal erythroid differentiation is progressive chromatin condensation with decreased diameter of cell nuclei. We used 2 approaches to examine the status of chromatin condensation: measurement of the nuclei diameter from cytospin images and measurement of the nuclear area from ImageStream analysis. Representative cytospin images are shown in Figure 4A. Additional cytospin images used in the calculation of the nuclei diameter are shown in supplemental Figure 2. Quantitative analyses (Figure 4B) revealed that the diameters of nuclei progressively decreased as terminal erythroid differentiation progressed (∼15 μm for proerythroblasts and ∼12 μm for basophilic, ∼7.5 μm for polychromatic, and ∼5 μm for orthochromatic erythroblasts). Although HDAC5 knockdown had no effects on the nuclear diameters of proerythroblasts and basophilic erythroblasts, it led to increased nuclear diameters of polychromatic and orthochromatic erythroblasts. We also measured the nuclear area by ImageStream analysis after staining the erythroblasts with GPA and Hoechst 33342 (representative ImageStream images of orthochromatic erythroblasts, Figure 4C; representative nuclear area profiles of cells, Figure 4D). Quantitative analyses of the nuclear area (Figure 4E) show that, consistent with changes in nuclear diameter, whereas HDAC5 knockdown had no effects on the nuclear areas of proerythroblasts and basophilic erythroblasts, it led to increased nuclear areas of polychromatic and orthochromatic erythroblasts. Together, these results imply that HDAC5 deficiency leads to impaired chromatin condensation in late-stage erythroblasts.
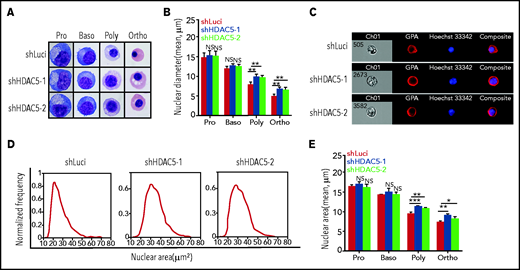
Impaired chromatin condensation in HDAC5-knockdown polychromatic and orthochromatic erythroblasts. (A) Representative cytospin images of sorted erythroblasts stained with May-Grunwald-Giemsa. Scale bar, 10 μm. (B) Quantitative analysis of nuclear diameter of the sorted erythroblasts at the indicated stages. Cells (n = 1000) of each stage of terminal erythroid differentiation from 3 independent experiments were used for quantification. (C) Representative ImageStream images of orthochromatic erythroblasts stained with GPA and Hoechst 33342. (D) Representative ImageStream nuclear area profiles of orthochromatic erythroblasts. (E) Quantitative analysis of nuclear area of sorted erythroblasts from 3 independent experiments. *P < .05; **P < .01; ***P < .001. NS, nonsignificant. Baso, basophilic erythroblasts; Ortho, orthochromatic erythroblasts; Poly, poly chromatic erythroblasts; Pro, proerythroblasts.
Impaired chromatin condensation in HDAC5-knockdown polychromatic and orthochromatic erythroblasts. (A) Representative cytospin images of sorted erythroblasts stained with May-Grunwald-Giemsa. Scale bar, 10 μm. (B) Quantitative analysis of nuclear diameter of the sorted erythroblasts at the indicated stages. Cells (n = 1000) of each stage of terminal erythroid differentiation from 3 independent experiments were used for quantification. (C) Representative ImageStream images of orthochromatic erythroblasts stained with GPA and Hoechst 33342. (D) Representative ImageStream nuclear area profiles of orthochromatic erythroblasts. (E) Quantitative analysis of nuclear area of sorted erythroblasts from 3 independent experiments. *P < .05; **P < .01; ***P < .001. NS, nonsignificant. Baso, basophilic erythroblasts; Ortho, orthochromatic erythroblasts; Poly, poly chromatic erythroblasts; Pro, proerythroblasts.
HDAC5 deficiency inhibits deacetylation of H4 K12, which contributes to impaired chromatin condensation
Chromatin condensation is associated with changes in histone modifications.22,37 In murine erythroblasts, it has been shown that while there is no change in acetylation of H3, the acetylation of histone 4 (H4) is decreased during murine terminal erythroid differentiation.20 We documented that acetylation of H4 at K5, K8, and K12, but not K16, was progressively decreased during human terminal erythroid differentiation (Figure 5A). HDAC5 knockdown selectively inhibited the deacetylation of H4K12 and resulted in increased acetylation of H4K12 in late-stage erythroblasts (Figure 5B-C). To examine whether this effect is through direct interaction between HDAC5 and histone 4, we performed coimmunoprecipitation assays. HDAC5 was coimmunoprecipitated with histone 4 by an anti-histone 4 antibody (supplemental Figure 3A), and, vice versa, histone 4 was coimmunoprecipitated with HDAC5 by an anti-HDAC5 antibody (supplemental Figure 3B). To further delineate the relationship between H4K12 acetylation and chromatin condensation, we used ImageStream to examine the correlation between H4K12 acetylation and nuclear area (representative images, Figure 5D). Quantitative analysis revealed that HDAC5 knockdown led to an increased percentage of AC-H4+ cells (∼20% for the control group vs ∼35% for the HDAC5-knockdown group, Figure 5E). Measurement of nuclear areas showed that whereas HDAC5 knockdown increased the nuclear area of AC-H4+ cells, it did not affect the nuclear area of AC-H4− cells (Figure 5F-G).
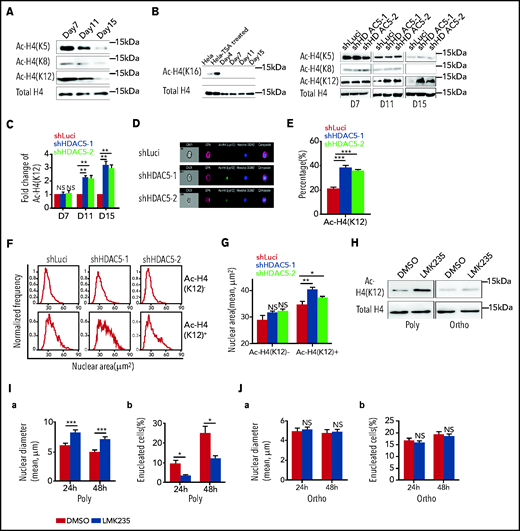
Histone 4 acetylation and chromatin condensation. (A) Representative western blots showing changes in histone H4 acetylation (AC-H4) during terminal erythroid differentiation. (B) Representative western blots showing effects of HDAC5 knockdown on H4 acetylation on K5, K8, K12, and K16. (C) Quantitative analysis of H4K12 acetylation levels from 3 independent experiments. (D) Representative ImageStream images of day 17 erythroblasts stained with anti-H4K12, GPA, and Hoechst 33342. (E) Quantitative analysis of H4K12+ erythroblasts. (F) Representative nuclear area profiles of H4K12+ and H4K12− erythroblasts from ImageStream analysis. (G) Quantitative analysis of nuclear area of H4K12+ and H4K12− erythroblasts from 3 different experiments. (H) Effect of LMK235 on H4K12 acetylation in polychromatic and orthochromatic erythroblasts. (I) Effect of LMK235 on chromatin condensation (a) and enucleation (b) of polychromatic erythroblasts. (J) Effect of LMK235 on chromatin condensation (a) and enucleation (b) of orthochromatic erythroblasts. *P < .05; **P < .01; ***P < .001. NS, nonsignificant. Ortho, orthochromatic erythroblasts; Poly, poly chromatic erythroblasts.
Histone 4 acetylation and chromatin condensation. (A) Representative western blots showing changes in histone H4 acetylation (AC-H4) during terminal erythroid differentiation. (B) Representative western blots showing effects of HDAC5 knockdown on H4 acetylation on K5, K8, K12, and K16. (C) Quantitative analysis of H4K12 acetylation levels from 3 independent experiments. (D) Representative ImageStream images of day 17 erythroblasts stained with anti-H4K12, GPA, and Hoechst 33342. (E) Quantitative analysis of H4K12+ erythroblasts. (F) Representative nuclear area profiles of H4K12+ and H4K12− erythroblasts from ImageStream analysis. (G) Quantitative analysis of nuclear area of H4K12+ and H4K12− erythroblasts from 3 different experiments. (H) Effect of LMK235 on H4K12 acetylation in polychromatic and orthochromatic erythroblasts. (I) Effect of LMK235 on chromatin condensation (a) and enucleation (b) of polychromatic erythroblasts. (J) Effect of LMK235 on chromatin condensation (a) and enucleation (b) of orthochromatic erythroblasts. *P < .05; **P < .01; ***P < .001. NS, nonsignificant. Ortho, orthochromatic erythroblasts; Poly, poly chromatic erythroblasts.
siRNA-mediated HDAC5 knockdown leads to cellular and molecular changes similar to those of shRNA-mediated HDAC5 knockdown
We used an siRNA-mediated knockdown approach as an additional strategy to study the role of HDAC5 in human erythropoiesis. For this, we chose 2 siRNAs targeting regions different from those targeted by the 2 shRNAs described in “HDAC5 deficiency impairs terminal erythroid differentiation” (supplemental Figure 4A). In addition, compared to shRNA-mediated knockdown, which is relatively long term, one of the advantages of the siRNA-mediated knockdown is that it takes only 24-72 hours to efficiently downregulate gene expression,38 thereby allowing a more rapid examination of cellular changes. To examine the effects of HDAC5 knockdown on cell growth, we transfected the siRNA oligos into erythroid cells on day 9 and assessed cell growth and apoptosis on day 11. Similar to HDAC5 shRNA, HDAC5 siRNA also efficiently downregulated HDAC5 expression at both the mRNA (supplemental Figure 4B) and the protein (supplemental Figure 4C-D) levels, inhibited cell growth (supplemental Figure 4E), and led to increased apoptosis (supplemental Figure 4F). Western blot analyses revealed increased p53 (K120) acetylation, along with increased expression of p53, Bax, and p21 (supplemental Figure 4G-H). Similar to HDAC5 shRNA, no significant differences were noted in the expression of other HDACs in HDAC5 siRNA-transduced cells (supplemental Figure 4I), demonstrating the specificity of HDAC5 siRNA.
To examine the effects of HDAC5 knockdown on enucleation and chromatin condensation, we transfected the siRNAs to erythroid cells on day 13 and assessed enucleation and chromatin condensation on day 15. Once again, similar to HDAC5 shRNAs, HDAC5 siRNAs efficiently downregulated HDAC5 expression at the mRNA (supplemental Figure 5A) and protein (supplemental Figure 5B-C) levels, inhibited enucleation (supplemental Figure 5D), and impaired chromatin condensation (supplemental Figure 5E). Western blot analyses revealed increased acetylation of H4K12 but not of H4K5 (supplemental Figure 5F-G). Notably, transfection was performed on day 15, when most cells were orthochromatic erythroblasts. HDAC5 siRNA also efficiently downregulated HDAC5 expression at the mRNA (supplemental Figure 5H) and protein (supplemental Figure 5I-J) levels, but no changes in enucleation (supplemental Figure 5K), chromatin condensation (supplemental Figure 5L), and H4 acetylation (supplemental Figure 5M-N) were observed. Once again, HDAC5 siRNA had no effects on the expression of other HDACs (supplemental Figure 5O).
Inhibition of HDAC5 by the compound LMK235 leads to increased H4K12 acetylation, decreased chromatin condensation, and impaired enucleation
To further demonstrate the roles of HDAC5 in H4 acetylation, chromatin condensation, and enucleation, we treated human polychromatic and orthochromatic erythroblasts with the HDAC inhibitor LMK235, which has the greatest effect on HDAC5, with a 50% inhibitory concentration IC50 of 4.22 nM.39 Although LMK235 also inhibits HDAC6, its effect on HDAC6 is 10 times less potent (IC50 of 55.7 nM) than on HDAC5. As the efficiency of LMK235 was assessed using an in vitro activity assay40 and the various cell types may differ in their ability to take up the compound, we first titrated the effects of LMK235 on enucleation. We found that LMK235 started to exhibit its effects on enucleation at the concentration of 50 nM (supplemental Figure 6), demonstrating that a 10 times higher HDAC5 IC50 is necessary for its inhibitory activity in erythroblasts. This finding further suggests that HDAC6 activity is unlikely to be affected at this concentration. Consistent with HDAC5 knockdown, LMK235 treatment led to increased acetylation of H4 K12 in polychromatic but not in orthochromatic erythroblasts (Figure 5H), but had no effect on H4 acetylation at K5 or K8 (supplemental Figure 7). In line with the increase in H4K12 acetylation, LMK235 treatment led to decreased chromatin condensation of polychromatic erythroblasts, which was accompanied by impaired enucleation (Figure 5I). In contrast, it had no effect on either chromatin condensation or enucleation of the orthochromatic erythroblasts, where the chromatin is already condensed (Figure 5J), indicating that HDAC5 plays a role in enucleation by affecting chromatin condensation at the polychromatic erythroblast stage. In addition, the HDAC6 inhibitor tubacin23 had no effect on H4 acetylation at K5, K8, or K12 (supplemental Figure 8), indicating that H4 is not the substrate of HDAC6 in erythroblasts. Taken together, these findings demonstrate that impaired chromatin condensation and the accompanied impaired enucleation of HDAC5-deficient cells is at least in part related to increased H4K12 acetylation in late-stage erythroblasts.
ATAC-seq analyses
Considering that HDAC5 knockdown led to decreased chromatin condensation, we performed ATAC-seq to assess changes in chromatin accessibility. Principle component analysis (PCA) of ATAC-seq data demonstrated a high degree of separation of samples treated with shLuci or shHDAC5 (Figure 6A). Control cells localized with the appropriate erythroid-specific stage (ie, polychromatic and orthochromatic erythroblasts) from a dataset of erythroid stage-specific samples derived from human umbilical cord blood.41 The number of genomic regions with different chromatin accessibility between shLuci- and shHDAC5-treated cells revealed an increase in chromatin accessibility in HDAC5-knockdown orthochromatic erythroblasts compared with luciferase control orthochromatic erythroblasts, whereas polychromatic erythroblast samples showed similar levels of increases and decreases of accessibility with shHDAC5 (Figure 6B). Comparison of differential regions between cell types showed that the many genomic regions that become more accessible in orthochromatic cells with HDAC5 shRNA (14 637) are mostly shared with the regions that lose accessibility in control cells in the transition from the polychromatic to the orthochromatic stage (9105 of 13 236). The regions are also largely shared with the regions that become more accessible in polychromatic cells HDAC5 shRNA (9328 of 10 393). Figure 6C shows these dynamic changes in chromatin accessibility in the heat map format. There was less chromatin accessibility in control orthochromatic cells than in control polychromatic cells. HDAC5-knockdown cells showed increases in chromatin accessibility in orthochromatic and polychromatic erythroblasts, with knockdown orthochromatic cells exhibiting a profile similar to control polychromatic cells, indicating that HDAC5 inhibition delays chromatin condensation during erythroid differentiation. This finding was also indicated by PCA, which showed that both HDAC5-knockdown samples localized closer to late-stage basophilic erythroblasts.
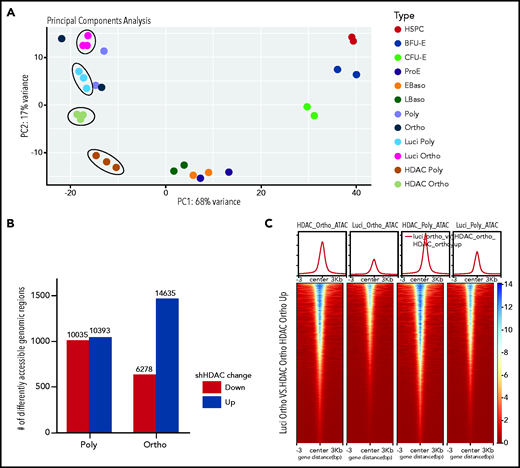
Effect of HDAC5 knockdown on chromatin accessibility. (A) PCA of ATAC-seq data demonstrates a high degree of separation of samples after treatment with shHDAC5 compared with the control (circled). HDAC5 shRNA-treated and control samples are compared with erythroid stage-specific samples derived from human umbilical cord blood. (B) The number of genomic regions with different chromatin accessibility between control and HDAC5 shRNA-treated cells. HDAC5 knockdown resulted in a large increase in chromatin accessibility in orthochromatic erythroblasts compared with the control. (C) Heat map display of chromatin accessibility levels in genomic regions that become accessible in orthochromatic erythroblasts after treatment with shHDAC5. The top section shows average profiles for all regions, and the bottom section shows levels for individual regions in the 6-kb area surrounding the summits of the ATAC peaks . EBaso, Early-stage basophilic erythroblasts; LBaso, Late-stage basophilic erythroblasts; Ortho, orthochromatic erythroblasts; Poly, poly chromatic erythroblasts; Pro, proerythroblasts.
Effect of HDAC5 knockdown on chromatin accessibility. (A) PCA of ATAC-seq data demonstrates a high degree of separation of samples after treatment with shHDAC5 compared with the control (circled). HDAC5 shRNA-treated and control samples are compared with erythroid stage-specific samples derived from human umbilical cord blood. (B) The number of genomic regions with different chromatin accessibility between control and HDAC5 shRNA-treated cells. HDAC5 knockdown resulted in a large increase in chromatin accessibility in orthochromatic erythroblasts compared with the control. (C) Heat map display of chromatin accessibility levels in genomic regions that become accessible in orthochromatic erythroblasts after treatment with shHDAC5. The top section shows average profiles for all regions, and the bottom section shows levels for individual regions in the 6-kb area surrounding the summits of the ATAC peaks . EBaso, Early-stage basophilic erythroblasts; LBaso, Late-stage basophilic erythroblasts; Ortho, orthochromatic erythroblasts; Poly, poly chromatic erythroblasts; Pro, proerythroblasts.
RNA-seq analyses
To define the transcriptional changes after HDAC5 knockdown, we performed RNA-seq analyses. PCA of RNA-seq data demonstrated a high degree of separation of samples treated with shLuci or shHDAC5 (Figure 7A). Control polychromatic and orthochromatic erythroblasts localized with the appropriate erythroid-specific stage from a dataset of erythroid stage-specific samples derived from human umbilical cord blood.41 A heat map of differentially expressed genes is shown in Figure 7B. Genes (n = 1110) are differentially expressed between control and HDAC5 knockdown polychromatic erythroblasts, with 650 upregulated and 460 downregulated (Figure 7C). Many more genes (n = 2836) were differentially expressed between control and HDAC5 knockdown orthochromatic erythroblasts, with 1341 upregulated and 1495 downregulated. Gene ontology (GO) analyses revealed that there were no significant GO terms for downregulated genes in polychromatic erythroblasts, with upregulated genes involved in posttranscriptional regulation (Figure 7D). In orthochromatic erythroblasts, genes that are downregulated after shHDAC5 are involved in chromosome segregation and cell division, and genes that are upregulated are involved in posttranscriptional regulation (Figure 7E). Most of the differentially expressed genes (73%) in polychromatic erythroblasts were also differentially expressed in orthochromatic erythroblasts. However, orthochromatic erythroblasts had many more differentially expressed genes (n = 2013) that are not differentially expressed in polychromatic erythroblasts. Finally, regions with increased promoter accessibility showed increases in gene expression levels compared with all promoter regions, whereas regions with decreased accessibility showed decreased gene expression (Figure 7F), demonstrating that changes in chromatin accessibility are associated with changes in gene expression. The list of differentially expressed genes is shown in supplemental Table 3. Notably, there were no significant differences in expression of a4-integrin and band 3, the 2 proteins used to define human terminal erythroid differentiation.
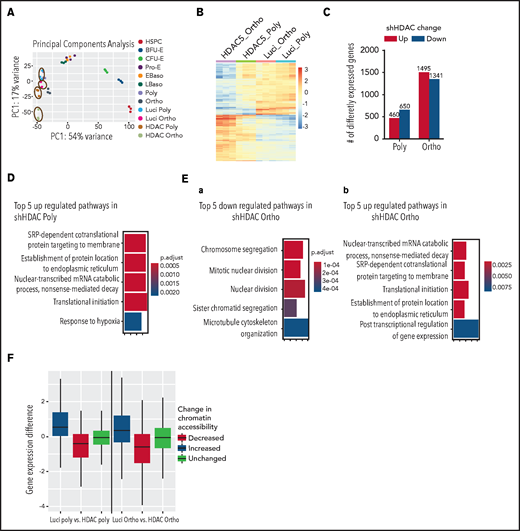
Effect of HDAC5 knockdown on gene expression. (A) PCA of RNA-seq data demonstrating a high degree of separation of samples after treatment with HDAC5 shRNA (circled). HDAC5 shRNA-treated and control samples are compared with erythroid stage-specific samples derived from human umbilical cord blood. (B) Heat map of genes that are differentially expressed between control and HDAC5 shRNA-treated samples. (C) Numbers of genes that are differentially expressed between control and HDAC5 shRNA-treated cells. (D) Gene ontology biological process terms overrepresented in genes that are upregulated in HDAC5-knockdown polychromatic erythroblasts. There were no significant GO terms for downregulated genes in polychromatic erythroblasts. The color represents adjusted P-values, and the width of the bar indicates the number of differential genes in the category. (E) GO biological process terms overrepresented in genes that are downregulate (a) or upregulate (b) in HDAC5-knockdown orthochromatic erythroblasts. The color represents adjusted P-values, and the width of the bar indicates the number of differential genes in the category. (F) Correlation between changes in chromatin accessibility at gene promoters and changes in gene expression. Polychromatic (left) and orthochromatic (right) erythroblasts. Differences in gene expression after HDAC5 shRNA treatment are plotted based on regions of changed accessibility. Baso, basophilic erythroblasts; Ortho, orthochromatic erythroblasts; Poly, poly chromatic erythroblasts; Pro, proerythroblasts.
Effect of HDAC5 knockdown on gene expression. (A) PCA of RNA-seq data demonstrating a high degree of separation of samples after treatment with HDAC5 shRNA (circled). HDAC5 shRNA-treated and control samples are compared with erythroid stage-specific samples derived from human umbilical cord blood. (B) Heat map of genes that are differentially expressed between control and HDAC5 shRNA-treated samples. (C) Numbers of genes that are differentially expressed between control and HDAC5 shRNA-treated cells. (D) Gene ontology biological process terms overrepresented in genes that are upregulated in HDAC5-knockdown polychromatic erythroblasts. There were no significant GO terms for downregulated genes in polychromatic erythroblasts. The color represents adjusted P-values, and the width of the bar indicates the number of differential genes in the category. (E) GO biological process terms overrepresented in genes that are downregulate (a) or upregulate (b) in HDAC5-knockdown orthochromatic erythroblasts. The color represents adjusted P-values, and the width of the bar indicates the number of differential genes in the category. (F) Correlation between changes in chromatin accessibility at gene promoters and changes in gene expression. Polychromatic (left) and orthochromatic (right) erythroblasts. Differences in gene expression after HDAC5 shRNA treatment are plotted based on regions of changed accessibility. Baso, basophilic erythroblasts; Ortho, orthochromatic erythroblasts; Poly, poly chromatic erythroblasts; Pro, proerythroblasts.
Discussion
HDACs are epigenetic modifiers that play important roles in a variety of biological processes.42-44 Previous studies using an in vitro mouse erythroid culture system documented roles for Hdac2 and Hdac6 in chromatin condensation and enucleation of murine erythroblasts.22,23 However, the expression of HDACs and their roles in human erythropoiesis has not been fully delineated. To date, identified roles for HDAC1/HDAC245,46 and HDAC347 is in suppressing human fetal hemoglobin expression. In the present study, 6 of the 11 classic HDAC family members were expressed in human erythroid cells. In addition, SIRTs, the nonclassic HDAC family members, were also expressed in human erythroid cells (data not shown). Our findings highlight potential roles of HDAC family/superfamily members in human erythropoiesis that warrant further investigation.
Interestingly, whereas expression levels of HDAC1, -2, and -3 were relatively constant across the erythroid developmental and differentiation stages, the expression levels of HDAC6 and HDAC7 were progressively increased or decreased, suggesting overlapping and/or stage-specific roles of different HDAC family members in human erythropoiesis. Notably, the expression of HDAC5 was dramatically upregulated in polychromatic and orthochromatic erythroblasts, suggesting a role for HDAC5 in late stages of erythropoiesis. Although the role of Hdac5 in murine erythropoiesis has been controversial,20,22 in our results, consistent with its expression pattern, HDAC5 knockdown had no obvious effects on early human erythropoiesis but significantly impaired terminal erythroid differentiation. HDAC5 knockdown led to increased acetylation of p53 (K120) and H4 (K12) in erythroid cells. These findings are consistent with previous reports that HDAC5 deacetylates p53 and H4 in other cell types.20,36
In exploring the mechanistic basis for the increased apoptosis of HDAC5-knockdown erythroid cells, we found that HDAC5 knockdown led to activation of the p53 pathway. Interestingly, this activation was not due to increased transcription of p53 but rather was associated with increased acetylation of p53 (K120), which is known to stabilize the p53 protein.36 We have recently documented that knockdown of splicing factor SF3B1 leads to altered splicing of p53 E3 ligase MKRN1 in erythroid cells, which in turn leads to stabilization of p53 protein and subsequent activation of the p53 pathway.14 Activation of p53 has been implicated in impaired erythropoiesis of DBA in zebrafish and mouse models and in humans.48-50 However, the mechanism by which activation of the p53 pathway is regulated in erythroid cells is less well understood. Our findings not only confirm the previous findings that p53 activation impairs erythropoiesis, but also identify an additional mechanism by which activation of p53 pathway is regulated in erythroid cells.
In contrast to the well-established role of posttranslational histone modifications in the reversible chromatin condensation/decondensation during cell cycle,51,52 little is known about the roles of various histone modifications in chromatin condensation of erythroblasts. Studies using HDAC inhibitors suggest the potential role of histone acetylation/deacetylation in this process.20 In our study, we documented that acetylation of H4 at K5, K8, and K12 is dramatically decreased during human terminal erythroid differentiation. We further showed that H4 is a substrate of HDAC5 and that impaired chromatin condensation related to HDAC5 knockdown is closely related to increased H4 acetylation at K12. Our findings imply that HDAC5-mediated H4 deacetylation at K12 is essential for human erythroblast chromatin condensation.
Chromatin becomes more condensed in the transition from polychromatic to orthochromatic erythroblasts, and this effect is reflected by a large decrease in the number of open chromatin regions genome wide in orthochromatic erythroblasts. This decrease requires HDAC5, and orthochromatic cells with reduced HDAC5 retain open chromatin at levels comparable to polychromatic erythroblasts. The amount of RNA expression of genes that lose chromatin accessibility in orthochromatic erythroblasts as a result of HDAC5 is largely decreased. Genes involved in chromosome segregation and cell division are a prominent category in this class of genes, and they may be responsible for the enucleation defect observed in erythroblasts with reduced levels of HDAC5.
In summary, we have identified previously unknown mechanistic roles for HDAC5 in human erythropoiesis. Based on our findings, we propose that HDAC5 regulates human erythropoiesis via deacetylating both nonhistone and histone proteins. We found that HDAC5-mediated deacetylation of p53 is important for the survival of late-stage erythroblasts and that HDAC5-mediated deacetylation of histone H4 is necessary for chromatin condensation. Our findings provide new insights into the role of specific HDACs in regulating human terminal erythroid differentiation and could help improve our understanding of the anemia associated with HDAC inhibitor treatment.53-55
Acknowledgments
This work was supported, in part, by National Institutes of Health (NIH), National Heart, Lung, and Blood Institute grants HL140625 (NYBC) and HL149626 (NYBC), and NIH, National Institute of Diabetes and Digestive and Kidney Diseases grant DK032094 (NYBC); funding from the Hugoton Foundation (NYBC); and grants U1804282 (ZZU), 81530005 (ZZU), 81570099 (ZZU), 81770112 (ZZU), 81700102 (ZZU), and 81900108 (ZZU) from the Natural Science Foundation of China.
Authorship
Contribution: Y.W. and W.L. designed and performed the experiments, analyzed the data, and drafted “Materials and methods”; V.P.S., H.Z., Q.Q., Y.C., and P.G.G. performed and interpreted the bioinformatics analyses; X.Q., X.G., S.Z., X.W., and D.L. performed the experiments; K.Y., C.D.H., N.M., L.C., and P.G.G. analyzed the data and edited the manuscript; and X.A. designed the experiments, analyzed the data, and wrote the manuscript.
Conflict-of-interest disclosure: The authors declare no competing financial interests.
Correspondence: Xiuli An, New York Blood Center, 310 East 67th St, New York, NY 10065; e-mail: xan@nybc.org.
RNA-seq and ATAC-seq data have been deposited in the Gene Expression Omnibus (accession number GSE151743).
Original data are available by e-mail request to the corresponding author.
The online version of this article contains a data supplement.
The publication costs of this article were defrayed in part by page charge payment. Therefore, and solely to indicate this fact, this article is hereby marked “advertisement” in accordance with 18 USC section 1734.

This feature is available to Subscribers Only
Sign In or Create an Account Close Modal