

Key Points
Chromatin accessibility patterns at key heptad regulatory elements can predict cell identity in healthy progenitors and leukemic cells.
A subcircuit comprising GATA2, TAL1, and ERG regulates the stem cell to erythroid transition in both healthy and leukemic cells.

Abstract
Changes in gene regulation and expression govern orderly transitions from hematopoietic stem cells to terminally differentiated blood cell types. These transitions are disrupted during leukemic transformation, but knowledge of the gene regulatory changes underpinning this process is elusive. We hypothesized that identifying core gene regulatory networks in healthy hematopoietic and leukemic cells could provide insights into network alterations that perturb cell state transitions. A heptad of transcription factors (LYL1, TAL1, LMO2, FLI1, ERG, GATA2, and RUNX1) bind key hematopoietic genes in human CD34+ hematopoietic stem and progenitor cells (HSPCs) and have prognostic significance in acute myeloid leukemia (AML). These factors also form a densely interconnected circuit by binding combinatorially at their own, and each other’s, regulatory elements. However, their mutual regulation during normal hematopoiesis and in AML cells, and how perturbation of their expression levels influences cell fate decisions remains unclear. In this study, we integrated bulk and single-cell data and found that the fully connected heptad circuit identified in healthy HSPCs persists, with only minor alterations in AML, and that chromatin accessibility at key heptad regulatory elements was predictive of cell identity in both healthy progenitors and leukemic cells. The heptad factors GATA2, TAL1, and ERG formed an integrated subcircuit that regulates stem cell-to-erythroid transition in both healthy and leukemic cells. Components of this triad could be manipulated to facilitate erythroid transition providing a proof of concept that such regulatory circuits can be harnessed to promote specific cell-type transitions and overcome dysregulated hematopoiesis.
Introduction
Hematopoietic stem cells (HSCs) reside in the bone marrow (BM) niche where they are mostly quiescent but retain the capacity to self-renew and replace terminal blood cell types throughout life.1 Hematopoiesis is a hierarchical process, with HSCs at the apex giving rise to a range of progenitor cells with increasing lineage restriction.1 Although single-cell transcriptomic data suggest a continuous differentiation process,2-7 relatively pure progenitor populations corresponding to intermediate differentiation stages can be prospectively isolated based on surface marker expression.3 Cell type transitions are controlled by intrinsic and extrinsic cellular factors, and loss of control can lead to inappropriate proliferation and leukemic transformation.8-13
Acute myeloid leukemia (AML) is characterized by an abundance of relatively undifferentiated cells (blasts) of myeloid lineage.14 AMLs most likely originate in the earliest HSC compartments or acquire stem cell–like transcriptional programs during leukemic transformation.15-19 Although blast cells can comprise the bulk of the AML population, self-renewal is restricted to a smaller population of leukemic stem cells (LSCs) that can recapitulate the disease after ablation of the blast population.20-22 LSCs drive relapse,23 possibly because they possess stem cell transcriptional programs.24,25 Thus, AML induces a parallel hierarchy of malignant cell types with LSCs at the top.26 Therapies that induce LSC differentiation by targeting mutant proteins that block differentiation are effective but limited to a minority of AMLs.27-31
AML is a heterogenous disease with numerous driver mutations,14,32-34 many of which converge on corruption of the transcriptional networks that control normal hematopoiesis.13,35-37 Transcriptional networks coordinate gene regulation and play a key role in establishing and maintaining cell identity throughout the life of an organism.12,38 Such networks are cell type specific and therefore have to be rewired during embryonic development and differentiation, whereas disruption can lead to oncogenic transformation.8-13 Indeed, transcriptional networks are altered across AMLs with a wide spectrum of mutational origins, such that AML cells assume a new epigenetic identity distinct from any type of normal blood cell.35 Furthermore, epigenetic rewiring is increasingly recognized as a nongenetic cause of treatment resistance.39-41 However, the specific molecular mechanisms underlying disruption of transcriptional networks in AML and whether these can be therapeutically targeted remain unknown.
We and others have previously described 7 transcriptional regulators (heptad; LYL1, TAL1, LMO2, FLI1, ERG, GATA2, and RUNX1) that bind to key hematopoietic genes in normal human CD34+ hematopoietic stem and progenitor cells (HSPCs) and in AML.42-44 Heptad factors also bind combinatorially at their own, and each other’s, regulatory elements, forming a densely interconnected circuit that plays a role in maintaining the stem cell state.42,44 The heptad circuit appears to be established at the hemogenic endothelium stage of blood development,45 and overexpression of all 7 factors in a mouse in vitro differentiation system leads to increased production of pre-HSPCs with capacity for multilineage differentiation.46 All 7 factors are key hematopoietic regulators, and mutation or dysregulation is commonly associated with hematological or other malignancies.32,47-50 Furthermore, the heptad circuit is maintained or reactivated in AML,43,51-53 and heptad expression is predictive of patient outcome.43 However, heptad circuitry and function have primarily been established using bulk chromatin immunoprecipitation-sequencing (ChIPseq) experiments in heterogenous cell populations (ie, HSPCs), which may obscure underlying subcircuits or relationships that exist only in specific cell types and cellular contexts. Thus, key questions remain about the precise roles of the heptad throughout normal and leukemic hematopoiesis, including whether all 7 factors act together in single cells and whether heptad TFs contribute to cell fate decisions and maintain stemness.
We integrated bulk and single-cell data in normal human HSPCs and leukemic cells and find that chromatin conformation at key heptad regulatory elements is predictive of cell identity in normal and leukemic progenitors. The interconnected heptad circuit identified in normal HSPCs persists in AML, but single-cell transcriptomics suggest that there are specific heptad subcircuits in individual cells that play a key role in determining differentiation trajectories as cells exit the stem cell state.
Methods
The supplemental Methods (available on the Blood Web site) detail the standard techniques.
NGS data generation and processing
ChIP was performed as described43 (antibodies in supplemental Table 1). Library construction/sequencing was performed by BGI Genomics (China) or Novogene (Hong Kong). Single-cell RNA sequencing (scRNAseq) used the 10X Genomics pipeline. Aligned sequencing data were displayed in BigWig format, and read counts covering enhancers (supplemental Table 2) were extracted using deepTools pyBigWig54 and plotted.
Replicate assay for transposase-accessible chromatin-sequencing (ATACseq) counts were added. Profiles were encoded as unit vectors by dividing by total counts across all heptad peaks. City block distances on the multidimensional unit sphere between each sample and each average profile were used to compute the heat map and predict cell types.
scRNAseq analysis
Analyses for Figures 1 and 4 are at https://github.com/iosonofabio/heptad_paper. Healthy hematopoietic cell data were downloaded as described https://github.com/dpeerlab/Palantir/blob/master/readme.md, Rep1. Embedding coordinates, colors, cluster metadata, and smoothed counts data were extracted from the h5ad file and plotted using singlet (https://github.com/iosonofabio/singlet).
Count and metadata tables from CellRanger (10X Genomics) were converted to loom format (http://loompy.org/) and normalized to “counts per 10 000 (uniquely mapped) reads.” The symmetric correlation matrix was ordered by hierarchical (average linkage) clustering on L2 distance with optimal leaf ordering. Conditional distributions of gene expression were computed via quantiles followed by kernel density estimate in logarithmic space.
Palantir data were subsampled to 40 cells per type. Northstar’s subsample method55 was used to infer cell states within ME-1 guided by Palantir data.6 For graph construction, 10 external (nonmutual) neighbors were allowed to compensate for the fact that ME-1 cells are distant from actual hematopoietic cells. RNA velocity56 was computed using scVelo57 and projected onto Northstar’s embedding. Gene expression was plotted in the same embedding after iterative nearest-neighbor smoothing. For predicting the ME-1 cell state, we trained a random forest classifier using scikit-learn and evaluated its performance via train/test splits.
Results
Heptad expression during hematopoiesis
To understand heptad expression patterns during hematopoiesis, we interrogated existing scRNAseq data (Palantir) from BM cells6 (Figure 1A). Diverging patterns of heptad transcription factor (TF) expression were observed across developmental time (Figure 1B). All 7 TFs were expressed in HSCs, with increasing divergence during differentiation. For example, GATA2, TAL1, LYL1, and LMO2 are upregulated along the erythroid lineage, whereas RUNX1 is upregulated along the granulocytic/monocytic lineage.

Heptad regulatory regions have dynamic accessibility profiles across normal and leukemic blood development, and accessibility patterns are sufficient to classify normal and leukemic cells. (A) tSNE plot of scRNAseq in normal BM, with cells labeled by inferred identity as determined by Setty et al.6 CLP, common lymphoid progenitor; DC, dendritic cell (B) Relative expression of CD34 and heptad genes projected on to the tSNE plot in panel A. (C) The branching hierarchy model of normal blood development showing relationships between the cell populations shown in panel D. (D) ATACseq peaks at heptad regulatory regions over developmental time. Plots show merged data from available replicates. (E) ATACseq peaks at heptad regulatory regions in 1 representative patient with AML, showing pHSCs, LCSs, and leukemic blasts (Blast). (F) Classification of normal cell types using only ATACseq signal at heptad regulatory regions. Heat map shows calculated distance between each sample and the training set. The red box indicates a single MEP replicate that was misclassified as a CMP. (G) Classification of AML nearest normal cell type using only ATACseq signal at heptad regulatory regions. Plots show distance from each normal cell type for preleukemic HSCs, LSCs, and leukemic blasts from 7 patients with AML. (H) Performance of the heptad regulatory region classifier compared with previous classification of these samples using genome wide enhancer (Enh.) cytometry. Panels D and H adapted from Corces et al4 with permission. tSNE, t-distributed stochastic neighbor embedding.
Heptad regulatory regions have dynamic accessibility profiles across normal and leukemic blood development, and accessibility patterns are sufficient to classify normal and leukemic cells. (A) tSNE plot of scRNAseq in normal BM, with cells labeled by inferred identity as determined by Setty et al.6 CLP, common lymphoid progenitor; DC, dendritic cell (B) Relative expression of CD34 and heptad genes projected on to the tSNE plot in panel A. (C) The branching hierarchy model of normal blood development showing relationships between the cell populations shown in panel D. (D) ATACseq peaks at heptad regulatory regions over developmental time. Plots show merged data from available replicates. (E) ATACseq peaks at heptad regulatory regions in 1 representative patient with AML, showing pHSCs, LCSs, and leukemic blasts (Blast). (F) Classification of normal cell types using only ATACseq signal at heptad regulatory regions. Heat map shows calculated distance between each sample and the training set. The red box indicates a single MEP replicate that was misclassified as a CMP. (G) Classification of AML nearest normal cell type using only ATACseq signal at heptad regulatory regions. Plots show distance from each normal cell type for preleukemic HSCs, LSCs, and leukemic blasts from 7 patients with AML. (H) Performance of the heptad regulatory region classifier compared with previous classification of these samples using genome wide enhancer (Enh.) cytometry. Panels D and H adapted from Corces et al4 with permission. tSNE, t-distributed stochastic neighbor embedding.
Heptad regulatory region accessibility during normal hematopoiesis
Heptad TFs form a densely interconnected circuit in bulk CD34+ HSPCs, with each corresponding gene having regulatory regions bound by most of the heptad.42 Because heptad expression patterns are heterogeneous in single cells, we asked whether there is evidence for changes in heptad regulation at any of the combinatorially bound regions over developmental time. Although hematopoiesis is a continuum (Figure 1A), functionally defined subpopulations representing various waypoints can be isolated based on cell surface marker expression (Figure 1C). We queried chromatin accessibility data from sorted BM subpopulations,4 focusing on known heptad gene regulatory regions (LYL1 promoter, TAL1+40, LMO2-25, FLI1-16, ERG+85, GATA2+3.5, and RUNX1+2342). We included 2 putative regulatory regions: RUNX1+141, an intragenic RUNX1 region that was heptad-bound in HSPCs,42 and GATA2-117, a distal regulatory element for GATA2 that is dysregulated by translocation in the inv(3) AML subtype.58,59 Strikingly, accessibility patterns differed throughout development, with some elements (FLI1-15, ERG+85, GATA2+3.5, and RUNX1+141) losing accessibility upon exiting the CD34+ progenitor stage, suggesting that heptad connectivity is lost once cells commit to terminal differentiation (Figure 1D). Individual heptad regulatory elements remain accessible in more differentiated cells (LYL1P, LMO2-25, and RUNX1+23 monocyte lineage, and LYL1P and TAL1+40; erythroid lineage) consistent with expression of the related TF in these cells, with some exceptions, such as the LMO2-25 enhancer, which is inaccessible in erythroid cells, even though LMO2 is highly expressed, presumably controlled by alternate regulatory regions. The TAL1+40 and GATA2-117 elements had the most restricted accessibility patterns with both biased toward the erythroid lineage in line with higher expression of TAL1 and GATA2 in these cells.
Heptad regulatory region accessibility in AML
The heptad circuit can be active in AML,43,51-53 and heptad expression can predict survival.43 Data from 2 cohorts of AML cells showed that heptad regulatory regions were accessible in AMLs with diverse molecular lesions35 (supplemental Figure 1A) and in preleukemic HSCs, LSCs, and leukemic blasts isolated from the same patient4 (Figures 1E; supplemental Figure 1B). Notably, the TAL1+40 enhancer was rarely accessible in AML, and the GATA2-117 enhancer varied between patient samples.
Heptad regulatory region accessibility can classify normal and leukemic cells
Genome-wide chromatin accessibility profiles reflect cell identity.4 Because heptad expression and regulatory region accessibility are heterogenous throughout development, we asked whether the pattern of chromatin accessibility at heptad regulatory regions is sufficient to predict cell type. Using a classifier based on 9 regulatory regions, we correctly identified normal cells across the hematopoietic spectrum (Figure 1F). Furthermore, this classifier could assign a “closest normal” type to AML samples sorted into preleukemic HSC (pHSC), LSC, and blast populations (Figure 1G). Consistent with known AML biology, pHSCs were predominantly classified as HSCs or multipotent progenitors (MPPs), LSCs as lymphoid-primed MPPs (LMPPs) or granulocyte-macrophage progenitors (GMPs), and blasts as more variable cell types. We compared our cell-type assignments to published classifications of these samples based on whole-genome accessibility patterns4 and found a high concordance in pHSC and LSC populations (Figure 1H; supplemental Figure 1C). Consistent with lost heptad connectivity in more differentiated cells, the heptad-based classifier had reduced concordance with genome-wide classification in blast populations. Overall, our analysis indicates that heptad expression and accessibility are associated with cell identity in healthy hematopoietic progenitors and leukemic cells.
The heptad network persists in AML, with altered connectivity
We extended our analysis and asked which heptad TFs were bound at each regulatory region in normal and AML contexts, looking first at heptad binding patterns at the 9 regulatory regions in CD34+ HSPCs42 (Figure 2A, left; supplemental Figure 2). Combinatorial binding was observed, with LYL1, FLI1, GATA2, and RUNX1 bound at all regions, and FLI1, ERG, GATA2, and RUNX1 each having at least 1 regulatory element bound by all 7 TFs. Binding patterns were then used to infer the connectivity map of heptad autoregulation in HSPCs (Figure 2A, right).

A densely interconnected heptad autoregulatory circuit persists in AML cells with altered connectivity compared with CD34+ HSPCs. (A) ChIPseq binding pattern at heptad regulatory regions in CD34+ HSPCs (left). Gray boxes indicate regulatory regions not computationally called as binding peaks for the indicated TF. Plots are scaled to 5 times the height of the smallest called peak for that TF to allow visualization of a wide range of peak heights. Corresponding inferred heptad autoregulatory circuit (right). Most regulatory elements have all 7 heptad TFs bound; asterisk and bold border indicate regions where binding of a particular TF is absent. (B) ChIPseq binding pattern at heptad regulatory regions in ME-1 AML cells (left). Gray boxes indicate regulatory regions not computationally called as binding peaks for the indicated TF. Plots are scaled to 5 times the height of the smallest called peak for that TF to allow visualization of a wide range of peak heights. Corresponding inferred heptad autoregulatory circuit (right). Most regulatory elements have all 7 heptad TFs bound; asterisk and bold border indicate regions where binding of a particular TF is absent. (C) ChIPseq binding pattern at heptad regulatory regions in KG-1 AML cells (left). Gray boxes indicate regulatory regions not computationally called as binding peaks for the indicated TF. Plots are scaled to 5 times the height of the smallest called peak for that TF to allow visualization of a wide range of peak heights. Corresponding inferred heptad autoregulatory circuit (right). Most regulatory elements have all 7 heptad TFs bound; asterisk and bold border indicate regions where binding of a particular TF is absent.
A densely interconnected heptad autoregulatory circuit persists in AML cells with altered connectivity compared with CD34+ HSPCs. (A) ChIPseq binding pattern at heptad regulatory regions in CD34+ HSPCs (left). Gray boxes indicate regulatory regions not computationally called as binding peaks for the indicated TF. Plots are scaled to 5 times the height of the smallest called peak for that TF to allow visualization of a wide range of peak heights. Corresponding inferred heptad autoregulatory circuit (right). Most regulatory elements have all 7 heptad TFs bound; asterisk and bold border indicate regions where binding of a particular TF is absent. (B) ChIPseq binding pattern at heptad regulatory regions in ME-1 AML cells (left). Gray boxes indicate regulatory regions not computationally called as binding peaks for the indicated TF. Plots are scaled to 5 times the height of the smallest called peak for that TF to allow visualization of a wide range of peak heights. Corresponding inferred heptad autoregulatory circuit (right). Most regulatory elements have all 7 heptad TFs bound; asterisk and bold border indicate regions where binding of a particular TF is absent. (C) ChIPseq binding pattern at heptad regulatory regions in KG-1 AML cells (left). Gray boxes indicate regulatory regions not computationally called as binding peaks for the indicated TF. Plots are scaled to 5 times the height of the smallest called peak for that TF to allow visualization of a wide range of peak heights. Corresponding inferred heptad autoregulatory circuit (right). Most regulatory elements have all 7 heptad TFs bound; asterisk and bold border indicate regions where binding of a particular TF is absent.
We next compared heptad connectivity in 2 AML cell lines: ME-1, and KG-1. AML cell lines recapitulate properties of primary AML cells60 and can be experimentally manipulated. ME-1 and KG-1 cells express all 7 heptad genes, although the pattern of individual TF expression varies both between cell lines and compared with HSPCs (supplemental Figure 3). Consistent with primary AML accessibility, heptad ChIPseq in ME-1 (Figures 2B; supplemental Figure 4) and KG-1 (Figure 2C; supplemental Figure 5) revealed that the densely interconnected circuit observed in HSPCs persists in AML cells, although the precise pattern of connectivity varies. For example, both ME-1 and KG-1 have prominent binding peaks at LYL1P, whereas at TAL1+40, ME-1 and KG-1 had fewer called peaks (4 of 7 and 2 of 7, respectively) than HSPCs (5 of 7), and these were generally small. Overall, heptad TFs remain highly connected in both AML cell lines, albeit with somewhat different circuit structures compared with HSPCs. Expression levels of individual TFs in HSPCs and AML cell lines were broadly in keeping with the number and binding intensities of TFs at the cognate regulatory element (Figure 2; supplemental Figure 3), except for LMO2, which had similar numbers and sizes of ChIPseq peaks across all cell types but was highly expressed in HSPCs.
Heptad regulatory elements must contain ETS and GATA motifs
Having shown that heptad binding at regulatory regions persists in AML, we wanted to understand the role of specific TF binding motifs within these regulatory regions. Cis-regulatory elements integrate signals from multiple TFs that bind to specific DNA sequences, with direct binding occurring at consensus binding motifs. The heptad TFs belong to 4 broad classes of TFs with different consensus binding motifs, E-box (CANNTG, bound directly by LYL1 and TAL1 and indirectly by LMO2), ETS (GGAW, bound by FLI1 and ERG), GATA (bound by GATA2), and RUNX (TGYGGT, bound by RUNX1). To identify consensus motifs that are likely to correspond to TF binding sites, we performed multiple sequence alignments using human, mouse, dog, and opossum genomes (Figure 3A). All regulatory elements contained conserved ETS and GATA motifs, whereas 7 of 9 contained a conserved E-Box motif and 6 of 9 a conserved RUNX motif. We mutated all conserved instances of each binding motif class (supplemental Table 4) and tested in luciferase reporter constructs in KG-1 and ME-1 cells.
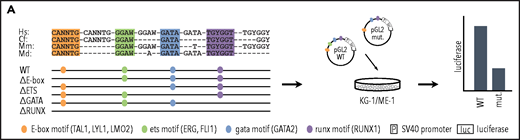
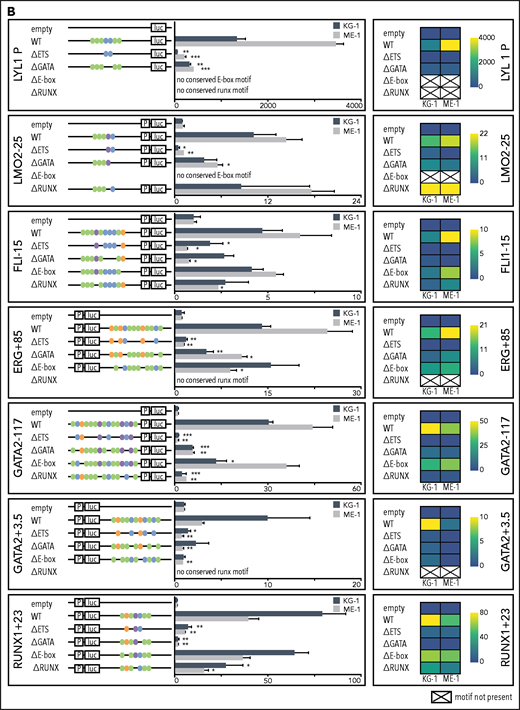
Specific TF consensus binding motifs, particularly ETS and eiGATA motifs, are critical for function of heptad regulatory elements. (A) Schematic showing process for selecting TF binding motifs for mutation and luciferase reporter workflow. (B) Conserved TF binding motifs in heptad regulatory elements that were highly bound by heptad TFs in AML cell lines, and activity of wild-type (WT) and mutated luciferase constructs in KG-1 and ME-1 cells (left). Activity is scaled relative to the empty vector, and graphs show representative data from a single transfection experiment. *P < .05; **P < .01; ***P < .001, t test. Heat maps showing aggregate data from all luciferase experiments (right). Data from biological replicates were normalized to WT activity for each experiment, then aggregate data scaled relative to empty vector. Heat maps are scaled from 0 to maximum luciferase activity for each regulatory element. (C) Schematics showing conserved TF binding motifs in heptad regulatory elements that were highly bound by heptad TFs in AML cell lines, and activity of WT luciferase constructs in KG-1 and ME-1 cells. Activity is scaled relative to the empty vector, and graphs show representative data from a single transfection experiment. *P < .05; **P < .01; ***P < .001 (Student t test).
Specific TF consensus binding motifs, particularly ETS and eiGATA motifs, are critical for function of heptad regulatory elements. (A) Schematic showing process for selecting TF binding motifs for mutation and luciferase reporter workflow. (B) Conserved TF binding motifs in heptad regulatory elements that were highly bound by heptad TFs in AML cell lines, and activity of wild-type (WT) and mutated luciferase constructs in KG-1 and ME-1 cells (left). Activity is scaled relative to the empty vector, and graphs show representative data from a single transfection experiment. *P < .05; **P < .01; ***P < .001, t test. Heat maps showing aggregate data from all luciferase experiments (right). Data from biological replicates were normalized to WT activity for each experiment, then aggregate data scaled relative to empty vector. Heat maps are scaled from 0 to maximum luciferase activity for each regulatory element. (C) Schematics showing conserved TF binding motifs in heptad regulatory elements that were highly bound by heptad TFs in AML cell lines, and activity of WT luciferase constructs in KG-1 and ME-1 cells. Activity is scaled relative to the empty vector, and graphs show representative data from a single transfection experiment. *P < .05; **P < .01; ***P < .001 (Student t test).
Deletion of ETS consensus motifs was universally deleterious, leading to significant loss of activity for all elements tested (Figure 3B). Deletion of GATA consensus motifs had a significant negative impact for all regions in at least 1 cell line. Deletion of E-box or RUNX motifs reduced luciferase reporter activity; however, the effect was generally small compared with deletion of ETS or GATA motifs, and in 1 case (LMO2-25) deletion of the RUNX motif led to slightly increased activity. Overall, regulatory region activity was impaired by loss of any class of TF binding motif, with loss of ETS or GATA motifs dominating. Two WT reporter constructs, TAL1+40 and RUNX1+141, showed minimal activity in 1 or both cell lines (Figure 3C) and were excluded from the mutation analysis. Consistent with its activity, TAL1+40 had few heptad TF binding inputs in either cell line, and RUNX1+141, which was active in ME-1 but not KG-1, had fewer inputs in KG-1 than in ME-1.
Single-cell transcriptomics reveal key regulators of the HSC–erythroid transition
Altered enhancer activity is read out as gene expression changes. Encouraged by our results indicating that removing specific consensus motifs altered activity of heptad regulatory regions, we proceeded to scRNAseq analysis of heptad expression in ME-1 cells that are amenable to downstream perturbation. We quantified heptad heterogeneity and observed that, for both high (eg, LYL1)- and low (eg, ERG)-expression genes, heterogeneity across the ME-1 population spanned an order of magnitude (Figure 4A). Furthermore, the highest gene expression (LYL1) corresponded to the highest heptad binding at an associated regulatory region, whereas lower gene expression (TAL1 and GATA2) corresponded to lower heptad binding at their associated regulatory regions (Figure 2B).
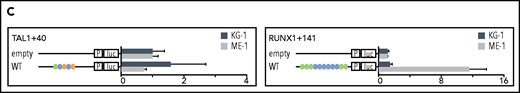
Single-cell transcriptomics in ME-1 cells reveals branching heterogeneity consistent with GATA2 regulation. (A) Cumulative expression distributions for heptad genes in single ME-1 cells. cppt: counts per 10 000 reads. (B) Pairwise Spearman correlations between heptad genes in single cells. (C) Censored distributions of gene expression for the gene pairs highlighted in panel B. The 2 bottom panels show the expression of the second gene in the lowest 10% and highest 5% of expressing cells for the first gene. P values refer to a Kolmogorov-Smirnov 2-sample test between the purple and green distributions. (D) Uniform manifold approximation and projection (UMAP) embedding of ME-1 cells and cell state assignment based on Northstar55 and the Palantir data, used as an atlas (Figure 1). Streamlines show RNA velocity as computed by scVelo,57 projected onto the same embedding. Inset: the branching phenotype within ME-1 cells, indicating that the cell flux into the ery-precursor–like state is a rare event. (E) Expression of the 4 heptad genes highlighted in panel B on the embedded cells. (F) Fold increase in heptad gene expression across the HSC to ery-precursor–like state in ME-1 cells (left). Fold increase in heptad gene expression across the HSC-to-ery-precursor state in normal CD34+ HSPCs cells (right). (G) Performance of random forest classifiers between HSC-like and ery-precursor–like states in ME-1 cells, trained solely on Palantir data with a spectrum of selected features. The presence of GATA2 expression in the model is essential for its accuracy. Error bars indicate standard deviation over 10 runs of the predictor with data resampling in each run.
Single-cell transcriptomics in ME-1 cells reveals branching heterogeneity consistent with GATA2 regulation. (A) Cumulative expression distributions for heptad genes in single ME-1 cells. cppt: counts per 10 000 reads. (B) Pairwise Spearman correlations between heptad genes in single cells. (C) Censored distributions of gene expression for the gene pairs highlighted in panel B. The 2 bottom panels show the expression of the second gene in the lowest 10% and highest 5% of expressing cells for the first gene. P values refer to a Kolmogorov-Smirnov 2-sample test between the purple and green distributions. (D) Uniform manifold approximation and projection (UMAP) embedding of ME-1 cells and cell state assignment based on Northstar55 and the Palantir data, used as an atlas (Figure 1). Streamlines show RNA velocity as computed by scVelo,57 projected onto the same embedding. Inset: the branching phenotype within ME-1 cells, indicating that the cell flux into the ery-precursor–like state is a rare event. (E) Expression of the 4 heptad genes highlighted in panel B on the embedded cells. (F) Fold increase in heptad gene expression across the HSC to ery-precursor–like state in ME-1 cells (left). Fold increase in heptad gene expression across the HSC-to-ery-precursor state in normal CD34+ HSPCs cells (right). (G) Performance of random forest classifiers between HSC-like and ery-precursor–like states in ME-1 cells, trained solely on Palantir data with a spectrum of selected features. The presence of GATA2 expression in the model is essential for its accuracy. Error bars indicate standard deviation over 10 runs of the predictor with data resampling in each run.
We next looked for pairwise expression correlations between TFs and found that GATA2 correlated positively with TAL1 and negatively with ERG and LMO2 (Figure 4B). Because correlation measures are insensitive to extreme phenotypes, we performed complementary analysis to evaluate whether this effect is also seen at the extreme of the distribution and plotted conditional gene expression distribution in the bottom and top quantiles of expressors of GATA2 (Figure 4C). Given the observed heterogeneity in heptad expression in ME-1 cells and the strong association between heptad regulation and cell type, we asked whether we could identify subpopulations within the ME-1 scRNAseq data. A canonical, unsupervised, clustering approach based on overdispersed features did not result in distinct biological patterns beyond the cell cycle, as expected from a cell line. We reasoned that a more sophisticated feature selection, together with soft guidance from healthy marrow data would reveal additional hidden heterogeneity. We therefore switched from unsupervised clustering to Northstar, a semisupervised clustering algorithm that leverages information from training data to channel the axes of heterogeneity during feature selection, graph construction, and cell community detection.55 Using healthy marrow transcriptomes6 (Figure 1A) as training data, this analysis revealed 2 major subpopulations, HSC-like (pink) and mono-precursor–like (purple, 1136 and 277 of 1489 cells, respectively) plus a minor population that was more similar to ery-precursor cells (lime, 47 of 1489 cells) and 2 small groups of cells resembling megakaryocytes (18 cells) and monocytes (Figure 4D; 11 cells). RNA velocity analysis56 (Figure 4D, arrows) revealed a major trajectory along the HSC-mono-precursor axis, and an alternate trajectory connecting the HSCs to the ery-precursor population. This flow diagram (independent of Northstar clustering) confirmed population structure reminiscent of healthy hematopoiesis (Figure 4D, inset). Primary AML cells also have population structures resembling normal hematopoiesis61 and have differential heptad expression between subpopulations (supplemental Figure 6A). We projected expression levels of the 4 previously identified genes on embedded cell plots (Figure 4E) and, consistent with our correlation data and known biological functions, GATA2 and TAL1 expression were enriched in the ery-precursor population. Conversely, ERG and LMO2 expression were enriched in the HSC-like and mono-precursor–like populations. We then computed the fold expression change in heptad genes between HSC and ery-precursor cells in both ME-1 and normal BM cells (Figure 4F; supplemental Figure 6B-C; supplemental Tables 5 and 6). In ME-1 cells, ERG expression was reduced (0.6 times) and GATA2 and TAL1 expression increased (11 and 3.5 times, respectively) in ery-precursor cells (Figure 4F, left). We observed a similar pattern in healthy cells, although FLI1, RUNX1, and LMO2 also showed expression changes in this context (Figure 4F, right).
To better understand how heptad TFs influence cell-specific gene expression we interrogated TF binding in bulk HSPCs. As these cells are a mixture of progenitor types, we focused on ATACseq peaks uniquely accessible in HSCs or megakaryocyte erythrocyte progenitor (MEPs; supplemental Figure 7; supplemental Table 7). ERG, FLI1, and RUNX1 had higher expression in HSCs than in ery-precursors and showed higher average binding at HSC-unique peaks, whereas GATA2, TAL1, and LYL1 were more highly expressed in ery-precursors but had similar average binding at both MEP- and HSC-unique peaks (supplemental Figure 7). LMO2 had higher expression in ery-precursors, but higher binding at HSC-unique peaks. TFs bind DNA directly via their cognate binding motifs, or indirectly via protein-protein interactions. HSC-unique peaks were highly enriched for ETS motifs (supplemental Table 8, significance value [sv] 5.50E-171), and enriched for RUNX motifs (supplemental Table 8, sv 5.70E-08), consistent with higher ERG, FLI1, and RUNX1 binding at these peaks. MEP-unique peaks were bound by GATA2 and highly enriched for GATA motifs (supplemental Table 8, sv 3.20E-111). GATA2 was also bound at HSC-unique peaks, whereas GATA motifs were enriched in only a minor fraction of HSC-nique peaks (supplemental Table 8; 33 of 7396, sv 3.10E-02), suggesting that GATA2 binding at these sites may be mediated by interactions with other TFs, rather than direct DNA binding.
Finally, we asked whether heptad expression was sufficient to classify ME-1 cells as HSC-like or ery-precursor–like (Figure 4G). Using a random forest classifier based on Palantir data, we found that heptad expression correctly classified cells with high accuracy (area under the receiver operating characteristic curve = 0.80), and that GATA2 expression was the best performing gene in terms of model accuracy (area under the receiver operating characteristic curve = 0.84).
Direct manipulation of GATA2 and ERG promotes erythroid trajectory
We then evaluated the effects of perturbing heptad factors on (1) expression of other heptad factors, (2) global transcriptome of perturbed cells, and (3) cell function. Specifically, we predicted that high levels of GATA2 or TAL1 and low levels of ERG would promote transition along the HSC-ery-precursor axis (Figure 5A). We first knocked down key heptad genes in ME-1 cells (supplemental Figure 8A) and measured the response of other heptad genes. GATA2 knockdown led to a decrease in TAL1 and most other heptad genes, except for ERG, which was unaffected by GATA2 knockdown (Figure 5B, left). Similarly, TAL1 knockdown led to decreased GATA2 and most other heptad genes, except for ERG (Figure 5B center). Conversely, ERG knockdown led to decreased LMO2 expression, but increased expression of GATA2, FLI1, and TAL1 (Figure 5B, right). RUNX1 expression showed inconsistent changes, possibly because of dysregulation via translocation of its essential binding partner CBFb in ME-1 cells.62 Similar results were observed using additional short hairpin RNAs (shRNAs) targeting GATA2 or ERG (supplemental Figure 8B). Heptad gene expression also changed after knockdown of GATA2, TAL1, or ERG in 2 additional AML cell lines (supplemental Figure 8C-D), although response patterns varied between cell lines, most likely reflecting the unique cell subpopulations in each.
![Manipulating GATA2 and ERG in bulk ME-1 cells and normal CD34+ HSPCs leads to altered heptad expression and can push cells toward the ery-like state. (A) The branching phenotype within ME-1 cells indicating relative expression of key heptad genes highlighted in Figure 4. (B) Effect of knocking down GATA2, TAL1, or ERG on heptad genes in ME-1 cells (error bars show 95% confidence interval [CI]). (C) Effect of overexpressing GATA2 on heptad genes in ME-1 cells (RNAseq) (left). GSEA plots showing enrichment of genes associated with the ery-precursor/ery-precursor–like state in response to overexpressing GATA2 in ME-1 cells (right). (D) Effect of knocking down ERG on heptad genes in CD34+ HSPCs (RNAseq) (left). GSEA plots showing enrichment of genes associated with the ery-precursor/ery-precursor–like state in response to knocking down ERG in CD34+ HSPCs (right). False discovery rate q value for GSEA plots = 0, except where indicated by *q value = 0.02. (E) Effect of knocking down ERG on heptad genes in CD34+ HSPCs using 2 different shRNAs (error bars, 95% CI). (F) Colony forming capacity of CD34+ cells transduced with control (shCON) or ERG (shERG, shERG-2) shRNAs (left). CD34+ cells produce colonies derived from granulocyte and/or macrophage progenitor cells (CFU-GM; gray), multipotential progenitor cells (CFU-GEMM; dark blue), and erythroid progenitor cells (blast forming unit-erythroid [BFU-E]; red). Proportion of total colonies that are erythroid (BFU-E) (right). NES, normalized enrichment score.](https://ash.silverchair-cdn.com/ash/content_public/journal/blood/138/16/10.1182_blood.2020009707/2/m_bloodbld2020009707f5.png?Expires=1769356638&Signature=r44w9Rt7stUXMaU9gjE9RbPY54HVAEaYC3bXjvXur~SRxd~sBhOrtCwkTPZICfmoLy6QpyILtmyUPgNaMRgMAQwbbo662wgWvNcd-lMZzPSwycDkLEUtPvQdxTIsqMEqTxC-PrR-~oMYfLoyFp2MDC0-WY-9lH3z5ZS9oY3qyYtZhpOdH21qpg6QSR0pDHI6omvs8TMZAxAtUTXkT683wJ0wln1oXWu~qD87CV4avjlQtd1EfinjmQ4sk6Cr8VThzTXFYvvmpOKnDVtA5cFPchJnkRoNF9CK4q5OPMmdku0-fju3-nuruSNc9ZNfyD3PRZwye6dveyyOtWLC3W7Ljg__&Key-Pair-Id=APKAIE5G5CRDK6RD3PGA)
Manipulating GATA2 and ERG in bulk ME-1 cells and normal CD34+ HSPCs leads to altered heptad expression and can push cells toward the ery-like state. (A) The branching phenotype within ME-1 cells indicating relative expression of key heptad genes highlighted in Figure 4. (B) Effect of knocking down GATA2, TAL1, or ERG on heptad genes in ME-1 cells (error bars show 95% confidence interval [CI]). (C) Effect of overexpressing GATA2 on heptad genes in ME-1 cells (RNAseq) (left). GSEA plots showing enrichment of genes associated with the ery-precursor/ery-precursor–like state in response to overexpressing GATA2 in ME-1 cells (right). (D) Effect of knocking down ERG on heptad genes in CD34+ HSPCs (RNAseq) (left). GSEA plots showing enrichment of genes associated with the ery-precursor/ery-precursor–like state in response to knocking down ERG in CD34+ HSPCs (right). False discovery rate q value for GSEA plots = 0, except where indicated by *q value = 0.02. (E) Effect of knocking down ERG on heptad genes in CD34+ HSPCs using 2 different shRNAs (error bars, 95% CI). (F) Colony forming capacity of CD34+ cells transduced with control (shCON) or ERG (shERG, shERG-2) shRNAs (left). CD34+ cells produce colonies derived from granulocyte and/or macrophage progenitor cells (CFU-GM; gray), multipotential progenitor cells (CFU-GEMM; dark blue), and erythroid progenitor cells (blast forming unit-erythroid [BFU-E]; red). Proportion of total colonies that are erythroid (BFU-E) (right). NES, normalized enrichment score.
Manipulating GATA2 and ERG in bulk ME-1 cells and normal CD34+ HSPCs leads to altered heptad expression and can push cells toward the ery-like state. (A) The branching phenotype within ME-1 cells indicating relative expression of key heptad genes highlighted in Figure 4. (B) Effect of knocking down GATA2, TAL1, or ERG on heptad genes in ME-1 cells (error bars show 95% confidence interval [CI]). (C) Effect of overexpressing GATA2 on heptad genes in ME-1 cells (RNAseq) (left). GSEA plots showing enrichment of genes associated with the ery-precursor/ery-precursor–like state in response to overexpressing GATA2 in ME-1 cells (right). (D) Effect of knocking down ERG on heptad genes in CD34+ HSPCs (RNAseq) (left). GSEA plots showing enrichment of genes associated with the ery-precursor/ery-precursor–like state in response to knocking down ERG in CD34+ HSPCs (right). False discovery rate q value for GSEA plots = 0, except where indicated by *q value = 0.02. (E) Effect of knocking down ERG on heptad genes in CD34+ HSPCs using 2 different shRNAs (error bars, 95% CI). (F) Colony forming capacity of CD34+ cells transduced with control (shCON) or ERG (shERG, shERG-2) shRNAs (left). CD34+ cells produce colonies derived from granulocyte and/or macrophage progenitor cells (CFU-GM; gray), multipotential progenitor cells (CFU-GEMM; dark blue), and erythroid progenitor cells (blast forming unit-erythroid [BFU-E]; red). Proportion of total colonies that are erythroid (BFU-E) (right). NES, normalized enrichment score.
Because the bulk of ME-1 cells were assigned as HSC-like, we reasoned that ERG knockdown or GATA2 overexpression, would alter their trajectory away from the HSC-like and toward the ery-precursor–like state. ERG knockdown reduced ME-1 colony formation in methylcellulose (supplemental Figure 8E), consistent with a shift away from the HSC-like state. We also analyzed RNAseq data from GATA2 overexpression in ME-1 cells63 and found that increased GATA2 led to increased TAL1 and RUNX1 and reduced ERG and LMO2, similar to expression changes between ery-precursor–like and HSC-like ME-1 cells (Figure 5C, left; compare with Figure 4F, left). Gene Set Enrichment Analysis (GSEA) was used to compare GATA2-driven changes in global gene expression to expression differences between ery-precursors and HSCs. Globally, genes that were high in ery-precursors tended to increase after GATA2 overexpression, whereas genes that were low in ery-precursors tended to decrease (Figure 5C right). ERG overexpression in HSPCs promotes progenitor expansion,64 and we have now shown that ERG expression is reduced across the HSC to ery-precursor boundary in normal BM and ME-1 cells (Figure 4F). Furthermore, an independent method using scRNAseq landscapes as references predicts that perturbing ERG in mouse or human LMPPs would push cells toward an erythroid fate.65 We therefore asked whether ERG knockdown in HSPCs promoted an ery-progenitor phenotype. ERG knockdown led to downregulation of FLI1, LYL1, and LMO2, and upregulation of GATA2 and TAL1 (Figure 5D, left), similar to expression changes across the HSC-ery-progenitor transition in Palantir data (Figure 4F, right). GSEA was used to compare ERG knockdown–driven changes in global gene expression to expression differences between ery-precursors and HSCs. Globally, genes that were high in ery-precursors tended to increase after ERG knockdown, whereas genes that were low in ery-precursors tended to decrease (Figure 5D, right). To evaluate functional consequences of ERG knockdown in HSPCs (Figure 5E) we measured colony forming capacity and found that cells with reduced ERG expression were skewed toward erythroid colony formation (Figure 5F). Together, the perturbation data supports the notion that heptad genes, and in particular the triplet GATA2, TAL1, and ERG, form a functionally relevant interconnected network and play a key role in regulating cell state transitions in healthy blood cells and in leukemic cells.
Discussion
Gene regulatory networks control cell fate decisions in development and disease. We focused on heptad TFs and identified parallel phenotypes between healthy hematopoiesis and leukemic cells spanning single-cell gene expression, chromatin state, and enhancer use (Figure 6A). Our data suggest that GATA2, TAL1, and ERG constitute a heptad subcircuit that regulates stem cell-to-erythroid transition in healthy blood cells and leukemia cells (Figure 6B).
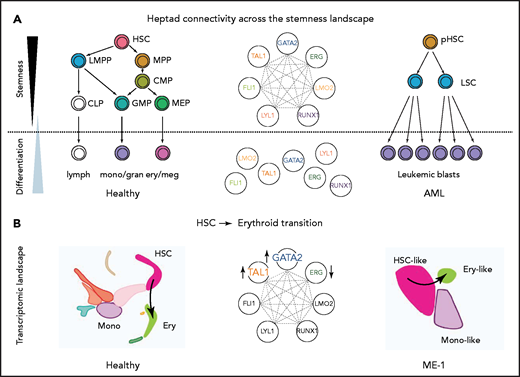
Proposed model of heptad activity across hematopoietic differentiation. (A) Heptad TFs form a densely interconnected network, with key regulatory elements accessible and heptad-bound in normal and leukemic stem cells. Accessibility of regulatory elements and, consequently, heptad connectivity are reduced as cells become more differentiated. (B) scRNAseq populations in normal and ME-1 cell populations. GATA2, TAL1, and ERG promote cell state changes along the HSC-ery-precursor axis in both normal CD34+ HSPCs and ME-1 cells.
Proposed model of heptad activity across hematopoietic differentiation. (A) Heptad TFs form a densely interconnected network, with key regulatory elements accessible and heptad-bound in normal and leukemic stem cells. Accessibility of regulatory elements and, consequently, heptad connectivity are reduced as cells become more differentiated. (B) scRNAseq populations in normal and ME-1 cell populations. GATA2, TAL1, and ERG promote cell state changes along the HSC-ery-precursor axis in both normal CD34+ HSPCs and ME-1 cells.
Insights into enhancer biology
The genome-wide chromatin state can be used to classify cell types.4 We showed that chromatin accessibility at only 9 heptad enhancers could be used to classify all early stages of hematopoiesis and subpopulations of AML cells. Although the transcriptional network determining hematopoietic cell fate undoubtedly contains additional enhancers, the heptad enhancers in this study give significant insight into the transcriptional control of blood cell identity. Most heptad enhancers were accessible in HSPCs and became selectively inaccessible at terminal differentiation, though exceptions were observed. We found the GATA2-117 (mice: Gata2-77) enhancer was open only in common myeloid progenitors (CMPs) and MEPs, suggesting a central role for this enhancer in erythroid transition and confirming previous murine models, where its deletion blocked erythroid and megakaryocytic differentiation.66
This enhancer has been studied in inv(3) AML, where it is translocated close to oncogene MECOM/EVI1, leading to increased EVI1 and decreased GATA2 expression.58,59 We found that the enhancer was accessible in a subset of leukemic cells and was strongly heptad-bound in both AML cell lines compared with HSPCs. In our reporter assays GATA2-117 also drove more luciferase activity than GATA2+3.5, the other GATA2 regulatory element. Thus, even in its normal genomic context GATA2-117 may play a role in driving GATA2 expression in AML. Unlike GATA2-117, the ERG+85 enhancer was open in all HSPC subsets and across AML subtypes (supplemental Figure 1A). This enhancer has been linked to AML prognosis43 and used to identify LSCs within bulk AML populations.67,68 Enhancers are replete with sequence motifs enabling binding of distinct TF families, either directly to DNA or indirectly via protein scaffolding, as observed for LMO269,70 and RUNX1.42,44 In this study, evolutionarily conserved heptad enhancers relied heavily on ETS and GATA motifs, in agreement with previous reports that ETS-ETS-GATA motifs were enriched at blood enhancers.71
Regulation of cell fate transitions by GATA2, TAL1, and ERG
Combinatorial binding of TFs is a key component of cell fate transitions.38 We identify a triad of TFs-GATA2, TAL1, and ERG, whereby high GATA2 and TAL1, and low ERG expression biased fate decisions toward the erythroid lineage in both HSPCs and ME-1 leukemic cells. A similar circuit, comprising GATA2, TAL1, and FLI1 (an ETS TF closely related to ERG) has been reported during embryonic HSC specification,72 whereas GATA1, TAL1 and KLF1 form a subcircuit in erythroid cells.73 Indeed, recycling of regulatory modules is a key feature of developmental networks,38 emphasizing the utility of cell classification strategies such as Northstar.55
Each member of this triad is known to play complex roles in healthy blood and leukemia development. GATA2 controls blood cell emergence in the embryonic aorta74 and is necessary for HSC maintenance.75 Germline loss-of-function mutations in GATA2 predisposes to myelodysplastic syndrome and AML,76 and high GATA2 expression is associated with poor prognosis in patients with AML.77TAL1 is also necessary for embryonic blood formation48,78 and drives erythroid and megakaryocytic differentiation programs79 but is dispensable for HSC maintenance.48,80,81 However, dysregulation of TAL-1 is associated with T-ALL.48ERG is not necessary for HSC specification or differentiation, but it promotes HSC maintenance by restricting differentiation.82,83 High ERG expression is a poor prognostic marker for AML49,84-86 and is leukemogenic in mouse models,87-90 although its role in human leukemia is more subtle.64
Clinical implications
Therapeutic approaches to AML that force LSCs to differentiate have been sought.91 Although TFs are relatively difficult drug targets, small molecules upregulating CEBPA92,93 or downregulating PU.194 and RUNX195 have been developed. Regulatory circuits, such as the GATA2-TAL1-ERG triad described herein may provide a conceptual framework within which to develop such therapies. A first approach would be to alter TF expression directly, as upregulating GATA2 or downregulating ERG promotes erythroid differentiation. However, population structure of malignant cells within primary AML varies between patients and different leukemias may be primed toward specific differentiation pathways.61 As such, ERG perturbation is especially promising, as this TF appears to preserve the progenitor state rather than bias the cell toward a particular fate, and knockdown may favor exit from the stem cell state across a range of primary AMLs. A second approach would be to focus on transcriptional regulators of these TFs. USP9X, a deubiquitinase that regulates ERG stability96 and is positively regulated by ERG in a feed-forward loop is one such candidate.67 A third approach would be to focus on specific enhancers such as GATA2-117, which is inaccessible in normal HSCs but open in the transitional progenitor states characteristic of AML, enabling preferential cytotoxicity in leukemic cells. Overall, a deeper understanding of heptad regulatory circuits and their roles in maintaining and exiting normal and leukemic stem cell states can help shape novel, data-based approaches to innovative cancer therapies.
Acknowledgments
The authors thank the staff and donors of the Sydney Cord Blood Bank for providing cord bloods for research.
Some of the data presented in this work were acquired by personnel and/or instruments at the Mark Wainwright Analytical Centre (MWAC) of UNSW Sydney, which is funded in part by the Research Infrastructure Programme of UNSW. This work was supported by the Anthony Rothe Memorial Trust (J.T.); a University International Postgraduate Award from UNSW Sydney and Translational Cancer Research Network-a Translational Cancer Research Centre funded by the Cancer Institute NSW (P.T.); an International Postgraduate Student scholarship from UNSW Sydney and the Prince of Wales Clinical School and Translational Cancer Research Network-a Translational Cancer Research Centre funded by the Cancer Institute NSW (S.S.); a Peter Doherty Fellowship from the National Health and Medical Research Council of Australia (APP1073768), a Cancer Institute NSW Early Career Fellowship, the Anthony Rothe Memorial Trust, and Gilead Sciences (D.B.); a Wellcome Investigator award (206328/Z/17/Z) (B.G.); project grants from the National Health and Medical Research Council of Australia (APP1042934, APP1102589, and APP1008515), a translational program grant from the Leukemia Lymphoma Society (LLS)-Snowdome Foundation-Leukaemia Foundation, project funds from the Translational Cancer Research Network-a Translational Cancer Research Centre funded by the Cancer Institute NSW, the Anthony Rothe Memorial Trust, and philanthropic funding from Christina’s Light (J.E.P.). This research was funded in whole, or in part, by the Wellcome Trust [203151/Z/16/Z] and the UKRI Medical Research Council [MC_PC_17230].
Authorship
Contribution: J.A.I.T., P.T., S.S., K.K., G.H., Y.H., J.A.S., D.R.C., S.J., and J.S. performed the research and analyzed the data; D.C., A.S., D.B., and J.W.H.W. analyzed the data; I.d.J. and J.L. provided key reagents; B.G. and J.W.H.W. discussed and interpreted the data; and J.A.I.T., F.Z., and J.E.P. conceived the study and wrote the paper.
Conflict-of-interest disclosure: The authors declare no competing financial interests.
Correspondence: Julie I. Thoms, Level 2, Lowy Cancer Research Centre, UNSW Sydney, NSW, Australia; e-mail; j.thoms@unsw.edu.au; Fabio Zanini, Level 2, Lowy Cancer Research Centre, UNSW Sydney, NSW, Australia; e-mail: fabio.zanini@unsw.edu.au; and John E. Pimanda, Level 2, Lowy Cancer Research Centre, UNSW Sydney, NSW, Australia; e-mail: jpimanda@unsw.edu.au.
Supplemental Table 3 shows the public data sets. New data are deposited under accession GSE158797. Code is available from https://github.com/iosonofabio/heptad_paper.
Original data are available by e-mail request to any corresponding author.
The online version of this article contains a data supplement.
There is a Blood Commentary on this article in this issue.
The publication costs of this article were defrayed in part by page charge payment. Therefore, and solely to indicate this fact, this article is hereby marked “advertisement” in accordance with 18 USC section 1734.

This feature is available to Subscribers Only
Sign In or Create an Account Close Modal