

Key Points
scRNA-seq unveils universal MAPK activation in circulating cells and potential therapeutic mechanisms of BRAF inhibitor in pediatric LCH.
Decreased frequency of circulating pDCs is significantly associated with disease severity in pediatric LCH.

Abstract
Langerhans cell histiocytosis (LCH) is an inflammatory myeloid neoplasm caused by aberrant activation of the mitogen-activated protein kinase (MAPK) pathway. Circulating myeloid cells from patients often carry disease-associated mutations and can be differentiated into langerinhigh LCH-like cells in vitro, but their detailed immune-phenotypic and molecular profiles are lacking and could shed key insights into disease biology. Here we recruited 217 pediatric LCH patients and took blood and tissue samples for BRAFV600E analysis. Immune-phenotyping of the circulating Lin−HLA-DR+ immune population in 49 of these patients revealed that decreased frequency of plasmacytoid dendritic cells was significantly linked to disease severity. By single-cell RNA sequencing of samples from 14 patients, we identified key changes in expression of RAS-MAPK-extracellular signal-regulated kinase (ERK) signaling-related genes and transcription factors in distinct members of the mononuclear phagocyte system in the presence of BRAFV600E. Moreover, treatment of patients with the BRAF inhibitor dabrafenib resulted in MAPK cascade inhibition, inflammation prevention, and regulation of cellular metabolism within mononuclear phagocytes. Finally, we also observed elevated expression of RAS-MAPK-ERK signaling-related genes in a CD207+CD1a+ cell subcluster in skin. Taken together, our data extend the molecular understanding of LCH biology at single-cell resolution, which might contribute to improvement of clinical diagnostics and therapeutics, and aid in the development of personalized medicine approaches.
Introduction
Langerhans cell histiocytosis (LCH) is a clinically heterogeneous myeloid neoplasm that is most common in children but can occur at any age and may be life-threatening in its most severe forms.1 This pathology is underpinned by alterations in the MAPK pathway, with 50% to 60% of patients exhibiting the BRAFV600E mutation in lesions.2,3 Notably, LCH lesions are highly inflammatory, containing a variety of different cytokines such as tumor necrosis factor and SPP1,4-6 with high levels of proinflammatory cytokines often also detected in the blood of LCH patients.7-9 To date, front-line therapy for LCH patients with multisystem or multifocal disease has been standard oncologic chemotherapy (vinblastine and prednisone)10; however, the identification of BRAFV600E has paved the way for targeted therapies, with preliminary evidence showing promising responses to BRAF inhibitors in adults and children with LCH.11-16
Importantly, recent studies show that BRAFV600E also serves as a biological marker to trace the origin of pathologic LCH cells and is most commonly detected in circulating CD14+ monocytes, CD16+ monocytes, and CD1c+ conventional dendritic cell (cDC2), as well as bone marrow CD34+ progenitor cells.3 These findings indicated the possibility that circulating myeloid cells might be directly involved in disease pathogenesis. In line, in vitro studies have now shown that both CD1c+ cDC2 and CD14+ classical monocytes can be driven to acquire high expression of langerin (CD207) and CD1a after culture with granulocyte-macrophage colony-stimulating factor, transforming growth factor, and additional notch ligation, suggesting their potential to be candidate precursors in the circulation and to contribute to LCH lesions.3,17,18 What is currently unclear is how the broader phenotypic and molecular landscape of the blood myeloid compartment in LCH is different in patients and what the developmental and functional consequences of BRAF-mediated MAPK pathway deregulation are on the mononuclear phagocyte compartment.
In this study, we focused on mononuclear myeloid cells in LCH and adopted a multilayered approach combining immune-phenotyping and clinical observations with single-cell transcriptomics, unveiling how they may be affected in newly diagnosed patients and in response to BRAF inhibition.
Methods
Patient cohorts, sample collection, and ethics statement
We initially recruited 233 consecutive pediatric patients with newly diagnosed LCH (age <18 years) admitted to Beijing Children’s Hospital from May 2018 to December 2019. Of these, 217 patients who had available plasma samples and were tested for cell-free BRAFV600E (cfBRAFV600E) mutations were analyzed in this study (Table 1; and supplemental Table 1 available on the Blood Web site). Forty-nine patient blood samples were selected at random for flow cytometric analysis (supplemental Table 2). We also analyzed samples from 22 children with relapsed or refractory LCH bearing the BRAFV600E mutation, who were treated with the BRAF inhibitor dabrafenib (http://www.chictr.org.cn, identifier: ChiCTR2000032844; supplemental Table 3). For the detailed sample information please refer to supplemental Methods. This study was approved by the Beijing Children’s Hospital Institutional Review Board (IEC-C-008-A08-2018-75 and IEC-C-028-A10-2016-K-31) and was conducted in accordance with The Declaration of Helsinki. Informed consents were obtained from guardians of the patients.
Cell preparation and labeling for flow cytometry
Healthy control and LCH skin samples were digested with 1.2 U/mL dispase II (Roche, Indianapolis, IN) and 0.25% trypsin-EDTA (Gibco) containing 0.25 mg/mL DNase I (DN25; Sigma), to obtain single-cell suspensions, as previously published.19 Blood samples were treated with lysis buffer (Becton Dickinson) to remove erythrocytes and were then labeled with antibodies. For the detailed information of antibody labeling for flow cytometry, please refer to supplemental Methods.
Single-cell RNA-seq library preparation and sequencing
Single-cell capture and downstream library construction following a modified single-cell tagged reverse transcription protocol were achieved as previously reported.19-22 Sequencing was performed on the Illumina Hiseq X Ten platform (Novogene). scRNA-seq data analysis is described in the supplemental Methods.
Clinical and demographic characteristics of pediatric Langerhans cell Histiocytosis samples
| Characteristics | n (%) |
|---|---|
| Total | 217 (100) |
| Sex | |
| Male | 128 (59.0) |
| Female | 89 (41.0) |
| Age at diagnosis, years; median [range] | 3.1 [0.07-13.6] |
| Mutation status | |
| Plasma cell-free | |
| BRAFV600E(+) | 63 (29.0) |
| BRAFV600E (−) | 154 (71.0) |
| Lesion sequence | |
| BRAFV600E (+) | 95 (43.8) |
| BRAFV600E (−) | 79 (36.4) |
| NA | 43 (19.8) |
| Clinical classification | |
| MS-high risk | 33 (15.2) |
| MS-low risk | 65 (30.0) |
| SS-low risk | 119 (54.8) |
| Treatment | |
| First-line therapy | 153 (70.5) |
| Second-line therapy | 11 (5.1) |
| Targeted therapy | 7 (3.2) |
| First-line + Second-line therapy | 22 (10.1) |
| Second-line + Targeted therapy | 3 (1.4) |
| First-line + Targeted therapy | 10 (4.6) |
| First-line + Second-line + Targeted therapy | 4 (1.9) |
| Without treatment | 7 (3.2) |
NA: Not available; SS: single-system; MS: multiple system.
Statistical analysis
Survival rates were analyzed by the Kaplan-Meier method, and subgroups were compared with the log-rank test. Tests were performed using SPSS 25.0 software (SPSS Inc, Chicago, IL). Wilcoxon-rank-sum test in R version 3.6.2 was used for comparisons of cell proportions based on flow cytometry analysis, cfBRAFV600E levels between any 2 groups, and gene expression levels between 2 cell clusters. Kruskal-Wallis test was used for significance verification. We considered P < .05 statistically significant.
See supplemental Methods for additional description of methods.
Results
Clinical characteristics of the pediatric LCH cohort
We enrolled 217 newly diagnosed pediatric LCH patients during the period of May 2018 to December 2019 (Table 1; supplemental Table 1). The median age at disease diagnosis was 3.1 years (range, 0.07-13.60), and the ratio of males to females was 1.44:1. Clinical classification placed 119 patients (54.8%) in the single system (SS) low-risk group, 65 (30%) in the multisystem (MS) low-risk group, and 33 (15.2%) in the MS high-risk group. Forty-nine blood samples were randomly selected, and after confirming that they were broadly representative of the entire newly diagnosed cohort, they were subjected to detailed flow cytometric analysis (supplemental Table 2). In addition, 14 blood and 4 skin samples were used for scRNAseq (Figure 1A). The BRAFV600E status was determined in lesions of 174 LCH patients, and 95 were found to harbor the BRAFV600E mutation, among which 52 patients also had cfBRAFV600E detectable in their plasma at diagnosis (supplemental Figure 1A-B). Of the 79 patients who tested negative for BRAFV600E in tissue biopsy, 77 also did not present with cfBRAFV600E in plasma (supplemental Figure 1A-B). Here, the plasma cfBRAFV600E was detected in just 87.5% of high-risk patients with tissue mutation, similar to our recent result,23 whereas the frequency was 100% in previous studies.24,25 This difference may result from the varying cohort size and ethnic diversity.
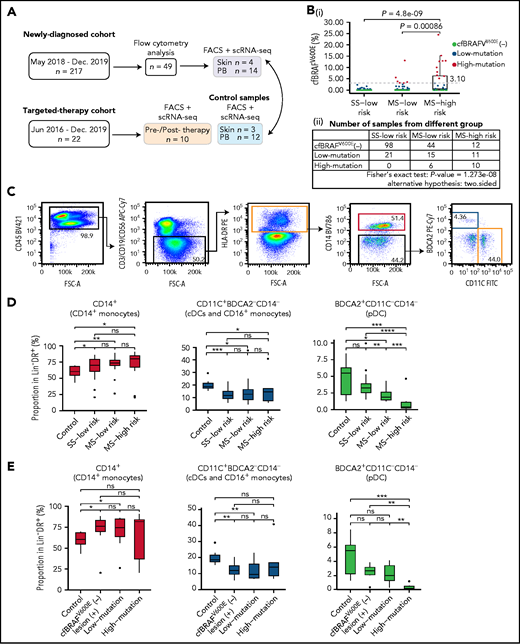
Flow cytometry analysis of circulating mononuclear phagocytes in LCH patients. (A) Overview of pediatric LCH cohorts and experimental design. (B) Box plots (i) showing the distribution of plasma cfBRAFV600E load between SS low-risk, MS low-risk, and MS high-risk patients. Wilcoxon rank sum test was used to test the significance of difference, and P values are indicated for the comparison. P < .05 is considered statistically significant. Dashed line represents the boundary of the first quarter (≥3.1%) of 63 positive samples defined as high mutation group. The median cfBRAFV600E level was 0 for both SS low-risk and MS low-risk patients and 0.45% for MS high-risk patients, whereas the mean cfBRAFV600E level was 0.11%, 0.71%, and 3.81% for SS low-risk, MS low-risk, and MS high-risk groups, respectively. Table (ii) showing the number of samples in different groups. Fisher's exact text was conducted and P < .05, suggesting the correlation between 2 groupings. (C) Gating strategy for distinguishing 3 cell subsets within the Lin−HLA−DR+ quadrant: CD14+ monocyte (pink box), CD14−CD11C+BDCA2− subset containing cDC and CD16++ monocyte (yellow box), and CD14−BDCA2+CD11c− pDC (blue box). (D-E) Box plots showing the proportions of CD14+ monocytes, CD11c+BDCA2–CD14– cells, and BDCA2+CD11c–CD14– plasmacytoid dendritic cells (pDCs) in the Lin–HLA-DR+ population from different groups. (D) Normal control (Control, n = 9), SS low-risk (n = 24), MS low-risk (n = 14) and MS high-risk patients (n = 11). (E) Normal control (Control, n = 9), cfBRAFV600E-negative, lesion BRAFV600E-positive LCH patients (cfBRAFV600E−, n = 7), low-mutation (n = 10), and high-mutation (n = 6). Kruskal-Wallis test was used for significance verification. Nonparametric Wilcoxon test P values are shown on the top of box plots. ns, P = 1; *P < .05; **P < .01; ***P < .001; ****P = .0001.
Flow cytometry analysis of circulating mononuclear phagocytes in LCH patients. (A) Overview of pediatric LCH cohorts and experimental design. (B) Box plots (i) showing the distribution of plasma cfBRAFV600E load between SS low-risk, MS low-risk, and MS high-risk patients. Wilcoxon rank sum test was used to test the significance of difference, and P values are indicated for the comparison. P < .05 is considered statistically significant. Dashed line represents the boundary of the first quarter (≥3.1%) of 63 positive samples defined as high mutation group. The median cfBRAFV600E level was 0 for both SS low-risk and MS low-risk patients and 0.45% for MS high-risk patients, whereas the mean cfBRAFV600E level was 0.11%, 0.71%, and 3.81% for SS low-risk, MS low-risk, and MS high-risk groups, respectively. Table (ii) showing the number of samples in different groups. Fisher's exact text was conducted and P < .05, suggesting the correlation between 2 groupings. (C) Gating strategy for distinguishing 3 cell subsets within the Lin−HLA−DR+ quadrant: CD14+ monocyte (pink box), CD14−CD11C+BDCA2− subset containing cDC and CD16++ monocyte (yellow box), and CD14−BDCA2+CD11c− pDC (blue box). (D-E) Box plots showing the proportions of CD14+ monocytes, CD11c+BDCA2–CD14– cells, and BDCA2+CD11c–CD14– plasmacytoid dendritic cells (pDCs) in the Lin–HLA-DR+ population from different groups. (D) Normal control (Control, n = 9), SS low-risk (n = 24), MS low-risk (n = 14) and MS high-risk patients (n = 11). (E) Normal control (Control, n = 9), cfBRAFV600E-negative, lesion BRAFV600E-positive LCH patients (cfBRAFV600E−, n = 7), low-mutation (n = 10), and high-mutation (n = 6). Kruskal-Wallis test was used for significance verification. Nonparametric Wilcoxon test P values are shown on the top of box plots. ns, P = 1; *P < .05; **P < .01; ***P < .001; ****P = .0001.
The presence of cfBRAFV600E in LCH patient plasma is an adverse prognostic indicator and has been associated with more severe clinical manifestations of the disease,23,24,26 but it is unclear how this might be linked to changes in the circulating mononuclear cell compartment. We allocated each patient within the clinical groupings to different cfBRAFV600E groups: cfBRAFV600E negative (cfBRAFV600E [−]; cfBRAFV600E ddPCR levels <0.1%, n = 154), cfBRAFV600E low mutation (0.1% to 3.1%, n = 47), and cfBRAFV600E high mutation (≥3.1%, n = 16; supplemental Figure 1C-D). When we compared the mutation load and clinical risk groups, a significant association between the level of cfBRAFV600E and clinical classification of LCH in newly diagnosed children was detected (Figure 1B).
Lower pDC frequencies associate with disease severity and high mutational load in newly diagnosed LCH patients
BRAFV600E mutation in LCH is commonly detected in circulating monocytes and dendritic cells (DCs),3 and aberrant activation of the MAPK pathway can affect myeloid cell differentiation in mice27,28; however, the influence of BRAFV600E mutation dysregulated MAPK activation on the proportion of circulating mononuclear phagocytes in LCH patients remains unknown. First, the proportions of CD14+ monocytes, CD11c+BDCA2−CD14− cells (containing conventional DCs [cDCs] and CD16+ monocytes) and BDCA2+CD11c–CD14− pDCs in peripheral blood (PB) of newly diagnosed LCH patients (n = 49) were analyzed in the different clinical groups and healthy controls by flow cytometry (Figure 1C). This revealed higher frequencies of CD14+ monocytes in all clinical groups of LCH patients compared with controls but no significant difference in frequency among the subgroups of LCH (Figure 1D). On the contrary, the proportions of CD11c+BDCA2−CD14− cells (containing cDCs and CD16+ monocytes) were significantly lower in LCH patients than controls, again with no significant difference between LCH subgroups. Intriguingly, although pDC frequencies were lower in MS patients than controls, a further significant decrease in MS high-risk patients compared with any of the other groups was detected (Figure 1D). The same patterns were present when patients were categorized according to cfBRAFV600E level (Figure 1E). Overall, pediatric LCH is in general related to significantly higher relative frequencies of CD14+ monocytes, whereas lower pDC frequencies are in addition significantly associated with disease severity and high mutational load.
Single-cell transcriptomic analysis identifies major subsets of mononuclear phagocytes within the blood of newly diagnosed pediatric LCH patients
Immune-phenotyping analysis provided preliminary evidence that monocyte and DC subsets in blood are affected in proportions in LCH. Therefore, we next investigated the molecular alterations occurring in these cells by using fluorescence-activated cell sorting for their enrichment and further subjecting them to a modified version of single-cell tagged reverse transcription-seq.19-22 To this end, 14 patients were selected from the newly diagnosed cohort that together represented all clinical subgroups, MS high risk (n = 6), MS low risk (n = 4), and SS low risk (n = 4), and exhibited a range of cfBRAFV600E levels (Figure 2A). A total of 1988 CD45+Lin− (CD3, CD19, and CD56) HLA-DR+ cells were isolated from the LCH peripheral blood samples (Figure 2B; supplemental Figure 2A-B), as well as 739 CD45+Lin−HLA-DR+ cells from the blood of 12 healthy age-matched children as controls. Finally, unsupervised clustering analysis was applied to these data, and 11 cell clusters were identified and annotated according to their expression of a curated list of known feature genes (Figure 2C; supplemental Figure 2C-H).
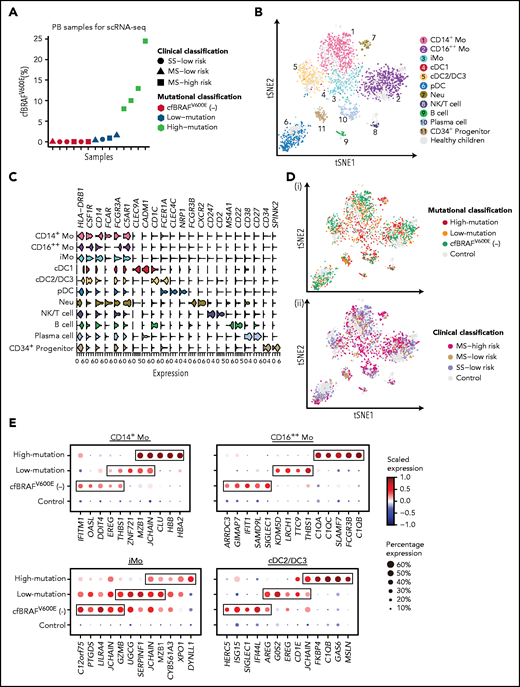
Transcriptomic profiling of circulating immune cells from LCH patients using scRNA-seq. (A) Dot plot showing the cfBRAFV600E load distribution of PB samples used for scRNA-seq (n = 14). Shapes represent the clinical classification, and colors represent the mutational classification. (B) tSNE plot visualization of 11 cell clusters identified from a total of 2727 single-cell transcriptome profiles, pooled from LCH patients and healthy controls. The Lin−HLA-DR+ population (green box) and the subsets within it including CD14+ monocyte (pink box), CD14−CD11C+BDCA2− subset containing cDC and CD16++ monocyte (yellow box), and CD14−BDCA2+CD11c– pDCs (blue box) are sorted for single-cell RNA sequencing (Figure 1C). (C) Violin plot overview of the expression of curated feature genes in each immune cell cluster. (D) tSNE plots of circulating hematopoietic cell clusters overlaid with mutational (i) and clinical classification (ii). (E) Dot plots showing the average expression level and percentage of cells expressing top 5 differential expression genes (DEGs) for CD14+ Mo, CD16++ Mo, iMo, and cDC2/DC3 of each mutational group compared with normal control. DEGs are detected using function FindMarkers in Seurat (Wilcoxon-rank-sum test, with P value adjusted for multiple testing using Benjamini-Hochberg correction). Top 5 DEGs with log fold change >1, adjusted P < .01, and expressed by more than 50% cells in each group are selected for visualization.
Transcriptomic profiling of circulating immune cells from LCH patients using scRNA-seq. (A) Dot plot showing the cfBRAFV600E load distribution of PB samples used for scRNA-seq (n = 14). Shapes represent the clinical classification, and colors represent the mutational classification. (B) tSNE plot visualization of 11 cell clusters identified from a total of 2727 single-cell transcriptome profiles, pooled from LCH patients and healthy controls. The Lin−HLA-DR+ population (green box) and the subsets within it including CD14+ monocyte (pink box), CD14−CD11C+BDCA2− subset containing cDC and CD16++ monocyte (yellow box), and CD14−BDCA2+CD11c– pDCs (blue box) are sorted for single-cell RNA sequencing (Figure 1C). (C) Violin plot overview of the expression of curated feature genes in each immune cell cluster. (D) tSNE plots of circulating hematopoietic cell clusters overlaid with mutational (i) and clinical classification (ii). (E) Dot plots showing the average expression level and percentage of cells expressing top 5 differential expression genes (DEGs) for CD14+ Mo, CD16++ Mo, iMo, and cDC2/DC3 of each mutational group compared with normal control. DEGs are detected using function FindMarkers in Seurat (Wilcoxon-rank-sum test, with P value adjusted for multiple testing using Benjamini-Hochberg correction). Top 5 DEGs with log fold change >1, adjusted P < .01, and expressed by more than 50% cells in each group are selected for visualization.
We identified CD14+ classical monocytes (CD14+ Mo), CD16++ nonclassical monocytes (CD16++ Mo), and CD14+CD16+ intermediate monocytes (iMo) based on the expression of CD14 and FCGR3A (CD16). We also identified a minor cDC1 cluster expressing CLEC9A, XCR1, and CADM1 and a major cDC2 cluster expressing CD1c and FCER1A (Figure 2C; supplemental Figure 2E). Furthermore, the recently described proinflammatory DC3 subset (exhibiting higher levels of LMNA, CD14, CD163, and CDKN1A) was also detected within cDC2 cluster,29,30 yet being not fully discriminated from cDC2, whose proportion was significantly higher in cDCs from LCH patients than that from healthy controls at the transcriptomic level (supplemental Figure 2G). On the other hand, pDCs highly expressed CLEC4C and NRP1 (Figure 2C). According to the expression of canonical marker genes, we also identified B cells, plasma cells, and immature progenitors (Figure 2B-C).
Having identified the link between plasma level of cfBRAFV600E and clinical severity in our cohort, we went on to investigate the transcriptomes of the CD1c+ cDCs (cDC2/DC3) and 3 monocyte subpopulation clusters (CD14+, CD16++, and iMo) in each cell subset individually by comparing each mutational load group (n = 4 for high- and low-cfBRAFV600E, and n = 6 for cfBRAFV600E negative) with the cells from healthy control blood samples serving as reference. Each of the predominant monocyte and DC clusters were present in blood from every patient and control tested, although at variable proportions (supplemental Figure 2I). Examining the top 5 most highly DEGs of these 4 clusters in each mutational group, we found that CD16+ Mo and cDC2/DC3 of high-mutation patients highly expressed C1QA, C1QC, or C1QB, which encode the polypeptide of serum complement subcomponent C1q (Figure 2D-E). In CD14+ Mo of high-mutation patients, we observed high expression of CLU, which is involved in neurodegenerative diseases and cancerous processes.31 Recently, the examination of brain biopsy specimens from LCH neurodegenerative disease patients reported the perivascular infiltration by cells with monocytic phenotype (CD14+CD33+CD163+P2RY12−) carrying the BRAFV600E mutation.32 Future studies will be needed to assess whether brain-infiltrating monocytes in LCH correspond to the CLU-expressing monocytes detected here in the high-mutation group.
Mononuclear phagocyte subsets in LCH patients exhibit upregulated pattern of genes in the RAS-MAPK-ERK pathway
Subsequently, we focused on identifying those DEGs from the different cfBRAFV600E mutational groups that were involved in the RAS-MAPK-ERK pathway. Overall, all cell populations from each of the mutational groups expressed significantly higher levels of genes related to the RAS-MAPK-ERK pathway than the corresponding cell populations from healthy controls (Figure 3A; supplemental Figure 3A). Using single-sample gene set enrichment analysis (ssGSEA), we observed higher RAS-MAPK-ERK related signaling activities in CD14+ Mo, CD16++ Mo, iMo, and cDC2/DC3 from the high-mutation group than those from the other 2 mutation groups (Figure 3B). Thus, in our cohort of newly diagnosed LCH patients, almost all individuals tested exhibited diverse aberrations in expression levels of RAS-MAPK-ERK pathway-related genes across the circulating myeloid compartment with the DEGs varying by cfBRAFV600E mutational group and cell subset. Interestingly, the expression of genes involved in RAS and MAPK-related pathways was enriched in natural killer/T cells of LCH patients compared with healthy counterpart but not in B cells or plasma cells of LCH patients (supplemental Figure 3B-C).
![Transcriptomic characteristics of circulating myeloid cells in patients with high cfBRAFV600E. (A) Dot plot showing the average expression level and percentage of cells expressing DEGs involved in the RAS-MAPK-ERK pathway in cell subsets from each mutational group compared with healthy control. Genes with percentage expression >50% in each group are selected for visualization. Genes of RAS-MAPK-ERK pathway originate from GO:0000165, GO:0070372, and GO:0007265. (B) Boxplot showing the scores of the 2 RAS-MAPK-ERK related pathways for each cell using ssGSEA. Differences between groups are compared with Wilcoxon ran sum test with P value adjusted for multiple testing using Benjamini-Hochberg correction. Adjusted P < .05 is considered to be statistically significant. ns, P = 1; *P < .05; **P < .01; ***P < .001; ****P = 0. Cell number of 3 mutational groups of each cell cluster is shown in right column. (C) Correlation network analysis of DEGs (including transcription factors [TFs] and genes involved in RAS-MAPK-ERK related pathways) of CD14+ Mo, CD16++ Mo, and iMo from high-mutation patients. Pink and brown represent the upregulated genes involved in RAS-MAPK-ERK related pathways and TFs, respectively. Spearman correlation coefficient is calculated using genes with average expression >0.3, and genes with correlation score >0.2 are selected for visualization using cytoscape.](https://ash.silverchair-cdn.com/ash/content_public/journal/blood/138/14/10.1182_blood.2020009064/4/m_bloodbld2020009064f3.png?Expires=1767704821&Signature=07gWs5vemHLi9KLi7g5Q2OC8vy3V~hOzUbeMiTKAgsqrc3Eop1M8vkZlKI2hKCQ82ruCo4Bd-rvlv9PDZLc3OFJKf~Kbl3KjGoGEX2eXhcoAszArWk2SfAgaTuIu6ge7ZPb~DS1c3gtFN0l1AMfyAGiqWh4vbt0q5waSs-jrwP8K7IGC~gL2IafqVMSPpXkZYGUO5j8uq7W8xMKZcfraT-YeIKBTRcyCLZzrX71sRcFAtn7he90FbmCdG~WJ7t68SOAxqI-W1FHDvTETVhR5N6M-E1rH34hxMO8He-W3CHSwF8gkJSOxsB6FIIiyjUUdEG~uHO-ioEzpZzI83kkKfg__&Key-Pair-Id=APKAIE5G5CRDK6RD3PGA)
Transcriptomic characteristics of circulating myeloid cells in patients with high cfBRAFV600E. (A) Dot plot showing the average expression level and percentage of cells expressing DEGs involved in the RAS-MAPK-ERK pathway in cell subsets from each mutational group compared with healthy control. Genes with percentage expression >50% in each group are selected for visualization. Genes of RAS-MAPK-ERK pathway originate from GO:0000165, GO:0070372, and GO:0007265. (B) Boxplot showing the scores of the 2 RAS-MAPK-ERK related pathways for each cell using ssGSEA. Differences between groups are compared with Wilcoxon ran sum test with P value adjusted for multiple testing using Benjamini-Hochberg correction. Adjusted P < .05 is considered to be statistically significant. ns, P = 1; *P < .05; **P < .01; ***P < .001; ****P = 0. Cell number of 3 mutational groups of each cell cluster is shown in right column. (C) Correlation network analysis of DEGs (including transcription factors [TFs] and genes involved in RAS-MAPK-ERK related pathways) of CD14+ Mo, CD16++ Mo, and iMo from high-mutation patients. Pink and brown represent the upregulated genes involved in RAS-MAPK-ERK related pathways and TFs, respectively. Spearman correlation coefficient is calculated using genes with average expression >0.3, and genes with correlation score >0.2 are selected for visualization using cytoscape.
Transcriptomic characteristics of circulating myeloid cells in patients with high cfBRAFV600E. (A) Dot plot showing the average expression level and percentage of cells expressing DEGs involved in the RAS-MAPK-ERK pathway in cell subsets from each mutational group compared with healthy control. Genes with percentage expression >50% in each group are selected for visualization. Genes of RAS-MAPK-ERK pathway originate from GO:0000165, GO:0070372, and GO:0007265. (B) Boxplot showing the scores of the 2 RAS-MAPK-ERK related pathways for each cell using ssGSEA. Differences between groups are compared with Wilcoxon ran sum test with P value adjusted for multiple testing using Benjamini-Hochberg correction. Adjusted P < .05 is considered to be statistically significant. ns, P = 1; *P < .05; **P < .01; ***P < .001; ****P = 0. Cell number of 3 mutational groups of each cell cluster is shown in right column. (C) Correlation network analysis of DEGs (including transcription factors [TFs] and genes involved in RAS-MAPK-ERK related pathways) of CD14+ Mo, CD16++ Mo, and iMo from high-mutation patients. Pink and brown represent the upregulated genes involved in RAS-MAPK-ERK related pathways and TFs, respectively. Spearman correlation coefficient is calculated using genes with average expression >0.3, and genes with correlation score >0.2 are selected for visualization using cytoscape.
We then focused on the high-mutation patients and used cytoscape33 to visualize the molecular interaction network between the RAS-MAPK-ERK related genes and transcription factors in the identified DEGs in each cell population. We found evidence that the different cell types exhibited differential regulation of the networks around RAS-MAPK-ERK: for example, in CD14+ Mo, SOS1, a gene involved in controlling the activation of the RAS/MAPK signaling pathway, was related to CEBPD, but the later one was linked with JAK3 in CD16++ Mo (Figure 3C). Together these observations provide evidence for widespread and differential MAPK-associated pathway activation and inflammation in circulating mononuclear phagocytes before their migration to the tissues.
BRAF inhibitor therapy inhibits MAPK cascade, prevents inflammation, and regulates cell metabolism
Next, effects of targeted treatment of the RAS-MAPK-ERK pathway using a specific BRAF enzyme inhibitor dabrafenib were assessed at the clinical and transcriptional level. A cohort of 22 children with LCH who were positive for the BRAFV600E mutation had refractory disease or progressive organ dysfunction and received dabrafenib treatment was investigated. After 1 month of treatment with dabrafenib, 19 patients showed disease regression, with 3 other patients in a stable condition, accompanied by improvement of laboratory tests and imaging examinations (Figure 4A; supplemental Figure 4A-B). After 3 months of targeted therapy, just 1 patient showed evidence of disease progression (Figure 4A). One- and two-year progression-free survival rates were 63.9 ± 12.2% and 47.9 ± 16.6%, respectively (supplemental Figure 4C). Plasma analyses of cfBRAFV600E revealed a significant decrease of cfBRAFV600E load after 1 month of treatment, consistent with clinical responses (Figure 4B).
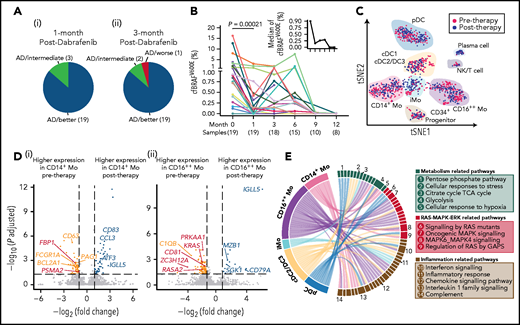
Therapeutic efficacy and underlying transcriptional mechanisms of the BRAF inhibitor. (A) Pie charts showing the response of 22 LCH patients after 1 (i) and 3 months (ii) of treatment with dabrafenib. Briefly, treatment response was categorized as complete resolution (nonactive disease/NAD), regression (active disease/AD-better), lesion stable or regression with new involvement (AD-intermediate), and progression (AD-worse). (B) Line graph showing plasma cfBRAFV600E load kinetics across time during dabrafenib treatment, with the median load of cfBRAFV600E at each time point shown (upper right). The number of samples are shown below the corresponding time points. Wilcoxon rank sum test is used to test the significance of difference, and P value is indicated for the comparison. The plasma cfBRAFV600E load significantly decreased after 1 month of treatment (therapy onset vs 1 month), whereas there is no significant difference in cfBRAFV600E load between any subsequent time points across individuals. (C) tSNE visualization of pre- and posttherapy samples with clusters projected (n = 1261 cells total). Red and blue dots represent cells of pre- and posttherapy samples, respectively. (D) Volcano diagrams showing the DEGs in CD14+ Mo (i) and CD16++ Mo (ii) of pre- and posttherapy samples. Orange and blue dots represent upregulated DEGs in pre- and posttherapy samples, respectively. Red dots represent DEGs involved in the RAS-MAPK-ERK pathway. Having investigated the expression of interested genes across individual patient, only the ones with significantly differentially expressed in at least 2 patients before and after 1-month treatment are selected to visualization. (E) GSEA for DCs and monocytes of pretherapy samples compared with posttherapy samples. Pathways enriched in pretherapy samples with nominal (NOM) P < .05 and false discovery rates (FDR) q < 0.20 are selected for visualization. Links represent different enrichment pathways and the numbers correspond to the pathways listed in the boxes on the right.
Therapeutic efficacy and underlying transcriptional mechanisms of the BRAF inhibitor. (A) Pie charts showing the response of 22 LCH patients after 1 (i) and 3 months (ii) of treatment with dabrafenib. Briefly, treatment response was categorized as complete resolution (nonactive disease/NAD), regression (active disease/AD-better), lesion stable or regression with new involvement (AD-intermediate), and progression (AD-worse). (B) Line graph showing plasma cfBRAFV600E load kinetics across time during dabrafenib treatment, with the median load of cfBRAFV600E at each time point shown (upper right). The number of samples are shown below the corresponding time points. Wilcoxon rank sum test is used to test the significance of difference, and P value is indicated for the comparison. The plasma cfBRAFV600E load significantly decreased after 1 month of treatment (therapy onset vs 1 month), whereas there is no significant difference in cfBRAFV600E load between any subsequent time points across individuals. (C) tSNE visualization of pre- and posttherapy samples with clusters projected (n = 1261 cells total). Red and blue dots represent cells of pre- and posttherapy samples, respectively. (D) Volcano diagrams showing the DEGs in CD14+ Mo (i) and CD16++ Mo (ii) of pre- and posttherapy samples. Orange and blue dots represent upregulated DEGs in pre- and posttherapy samples, respectively. Red dots represent DEGs involved in the RAS-MAPK-ERK pathway. Having investigated the expression of interested genes across individual patient, only the ones with significantly differentially expressed in at least 2 patients before and after 1-month treatment are selected to visualization. (E) GSEA for DCs and monocytes of pretherapy samples compared with posttherapy samples. Pathways enriched in pretherapy samples with nominal (NOM) P < .05 and false discovery rates (FDR) q < 0.20 are selected for visualization. Links represent different enrichment pathways and the numbers correspond to the pathways listed in the boxes on the right.
To investigate the effects of dabrafenib treatment on the circulating myeloid compartment, we performed scRNA-seq on PB CD45+Lin−HLA-DR+ cells from 5 children within the targeted therapy cohort before treatment and after 1 month of therapy (Figure 1A; supplemental Figure 4D). A total of 1261 cells passed quality control and were used in downstream analysis (supplemental Figure 4E). Using the same curated list of feature genes as above (Figure 2C; supplemental Figure 2E,G), we similarly annotated the 10 clusters (Figure 4C; supplemental Figure 4F). Focusing on these subsets, significant downregulation of a series of genes related to the RAS-MAPK-ERK pathway following treatment was uncovered, including FBP1 and PSMA2 specifically in CD14+ Mo, and KRAS, RASA2, and CD81 in CD16++ Mo (Figure 4D). CD14+ Mo showed posttreatment downregulation of CD63, involved in tumor progression,34 along with the antiapoptosis gene BCL2A1,35 whereas expression of the cancer suppression gene EGR136 was elevated (Figure 4D). In CD16++ Mo, the expression level of C1QB, a characteristic gene previously identified in patients with high levels of BRAFV600E mutation, decreased significantly (Figure 4D). Conducting the same analysis across the other cell subsets revealed several interesting phenomena: in cDC2/DC3, the expression of AREG, which is related to activation of the MAPK pathway,37 and IFITM1, which is implicated in metastasis in colorectal cancer,38 were significantly downregulated after 1 month of treatment (supplemental Figure 4G). Although certain changes appeared to be cell type specific, the expression of IGLL5, encoding one of the immunoglobulin λ-like polypeptides and considered a prognostic marker in several cancers,39,40 was generally upregulated across mononuclear phagocytes clusters after treatment (Figure 4D; supplemental Figure 4G).
Using GSEA,41 we found that expression of genes involved in multiple signaling pathways was specifically enriched in pretherapy CD14+ Mo compared with posttherapy, including pathways related to inflammation (interferon response, interleukin-1 family and complement), cellular metabolism (cellular response to hypoxia and glycolysis), and RAS-MAPK signaling (MAPK6/MAPK4 and regulation of RAS by GTPase-activating proteins (GAPs); Figure 4E; supplemental Figure 4H-I; supplemental Table 13). Similarly, expression of genes involved in inflammation and MAPK-related pathways was enriched in the cDC2/DC3, CD16++ Mo, and pDCs in pretherapy samples compared with posttherapy samples; for instance, oncogenic-MAPK signaling, reported to be intricately linked to tumorigenesis, was enriched in pretherapy CD16++ Mo, whereas the genes related to cellular of responses to stress including activation of cell cycle stagnation, apoptosis or senescence were enriched in cDC2/DC3 in pretherapy sample (Figure 4E).42
Taken together, this analysis points toward inhibition of the MAPK pathway, prevention of inflammation, and regulation of cell metabolism as key mechanisms underlying the efficacy of targeted therapy with BRAF inhibitor.
Heterogeneity of CD207+CD1a+ cells in skin
Skin is one of the most frequently affected organs in LCH,43 with a variety of cutaneous manifestations, including widespread multiple rashes. As expected, immunohistochemistry analysis revealed numerous CD207+CD1a+ cells distributed in the epidermis and dermis (supplemental Figure 5A). To understand the heterogeneity among different clusters expressing CD207 and CD1a, we sorted CD45+ cells from LCH skin lesions and CD207+CD1a+ LCs or CD45+ cells from healthy epidermis as controls using flow cytometry (supplemental Figure 5B-C) and then performed scRNA-seq on these populations. After quality control and removing nonhematopoietic cells (supplemental Figure 5D-F), our analysis revealed 7 clusters in LCH skin and 3 clusters in normal skin, respectively, which were then annotated based on expression of known feature genes (Figure 5A-C; supplemental Figure 5G).
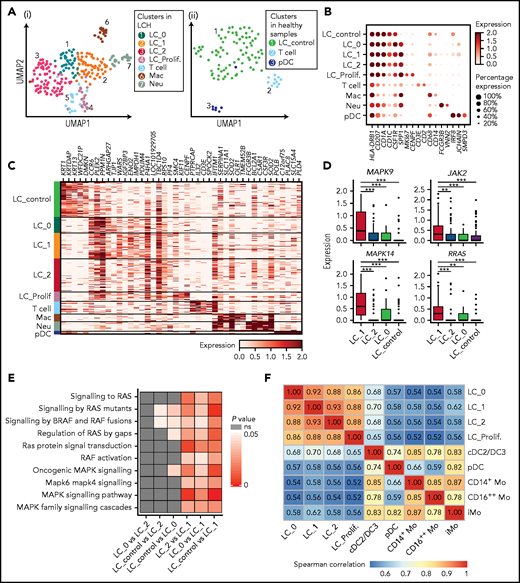
Identification of heterogenous CD207+CD1A+ subclusters in LCH skin. (A) UMAP visualization of cell clusters identified in CD45+ cells sorted from epidermal samples from 4 LCH patients (i) and CD45+and CD45+CD207+CD1a+ cells from epidermis of 3 healthy donors (ii). (B) Dot plot showing the average expression level and percentage of cells expressing the curated genes in each cluster. (C) Heatmap showing the expression of top 5 DEGs between different clusters identified in epidermis. DEGs are detected using functions tl.rank_gene_groups and tl.filter_rank_gene_groups in Scanpy (Wilcoxon-rank-sum test, with P value adjusted for multiple testing using Benjamini-Hochberg correction); genes with log-fold changes >1 and adjusted P < .05 were selected. (D) Boxplots showing expression of DEGs related to RAS-MAPK-ERK cascade among 4 LC clusters. (E) Heatmap showing the comparison of P values of RAS-MAPK-ERK related pathways among 4 LC subclusters. Each cell is scored for the RAS-MAPK-ERK related pathways using ssGSEA. Differences between groups are compared with Wilcoxon-rank-sum test, and P < .05 is considered to be statistically significant. (F) Correlation matrix showing the correlation coefficient between each cluster identified in skin and blood of LCH patients using complete method. Spearman correlation coefficient is calculated using genes with average expression >0.5.
Identification of heterogenous CD207+CD1A+ subclusters in LCH skin. (A) UMAP visualization of cell clusters identified in CD45+ cells sorted from epidermal samples from 4 LCH patients (i) and CD45+and CD45+CD207+CD1a+ cells from epidermis of 3 healthy donors (ii). (B) Dot plot showing the average expression level and percentage of cells expressing the curated genes in each cluster. (C) Heatmap showing the expression of top 5 DEGs between different clusters identified in epidermis. DEGs are detected using functions tl.rank_gene_groups and tl.filter_rank_gene_groups in Scanpy (Wilcoxon-rank-sum test, with P value adjusted for multiple testing using Benjamini-Hochberg correction); genes with log-fold changes >1 and adjusted P < .05 were selected. (D) Boxplots showing expression of DEGs related to RAS-MAPK-ERK cascade among 4 LC clusters. (E) Heatmap showing the comparison of P values of RAS-MAPK-ERK related pathways among 4 LC subclusters. Each cell is scored for the RAS-MAPK-ERK related pathways using ssGSEA. Differences between groups are compared with Wilcoxon-rank-sum test, and P < .05 is considered to be statistically significant. (F) Correlation matrix showing the correlation coefficient between each cluster identified in skin and blood of LCH patients using complete method. Spearman correlation coefficient is calculated using genes with average expression >0.5.
We found that the major population of CD207+CD1a+ cells in LCH skin contained 4 heterogeneous clusters, which were also readily discriminated when the dataset was integrated with that from normal skin (supplemental Figure 5H). The LC_proliferating cluster (LC_Prolif.) uniquely expressed proliferation-related genes, including MKI67 and CENPF (Figure 5A-C). Notably, SPP1, which is associated with T-cell activation and recruitment and reported specifically upregulated in LCH cells,5 and CCR6,44 expressed by pathologic dendritic cells and may contribute to their accumulation in nonlymphoid organs such as skin and bone, had the lowest expression in LC_control (Figure 5B-C). Four heterogeneous LC clusters in lesional skin had partially overlapping patterns of gene expression; for example, they highly expressed CD58, whereas T cells expressed CD2, both genes involved in T cell activation (supplemental Figure 5I).45 We also identified other cell populations, including macrophages (CD14 and CD68), neutrophils (FCGR3B and VNN2), pDCs (CLEC4C and NRP1), and T cells (CD3E and CD2; Figure 5B-C; supplemental Figure 5G).
When focusing on the expression of RAS-MAPK-ERK cascade related genes, we found that MAPK14, MAPK9, RRAS, and JAK2 were significantly upregulated in LC_1 compared with LC_control, LC_0, and LC_2 (Figure 5D). Consistently, expression of gene sets associated with the RAS-MAPK-ERK related pathway was significantly enriched in LC_1 in comparison with LC_control, LC_0 or LC_2 (Figure 5E), assuming that different cues may contribute to heterogeneities across LC subclusters, such as differentiation hierarchy,46 mutation status,47 and lesion microenvironment. In addition, LC_1 showed enriched expression of genes involved in various inflammation-related and collagen degradation–related pathways compared with LC_control (supplemental Figure 5I). These results, especially in LC_1 cluster, indicate the inflammatory myeloid neoplastic nature of LCH cells.
Having performed correlative analysis, we found that the correlation coefficient between LC_1 from LCH skin and cDC2/DC3 from LCH PB was higher than that of other circulating cell clusters at single-cell resolution, supported by integrated analysis with published LCH lesion 10× dataset (Figure 5F; supplemental Figure 5J).
Discussion
Blood mononuclear phagocytes in healthy humans have been extensively described by RNA sequencing and mass spectrometry,29,48 but in rare diseases, such as pediatric LCH, relatively little is known of their altered biology. In this study, we adopted a multilayered approach combining not only traditional immune-phenotyping and clinical observations, but also single-cell transcriptomics to propose that the oncogenic BRAFV600E mutation may lead to widespread MAPK activation in circulating mononuclear phagocytes. Importantly, this set of experiments also revealed the possible mechanisms underlying the therapeutic effects of BRAF inhibitor.
We uncovered widespread alterations to expression of genes related to RAS-MAPK-ERK across all patient groups and myeloid mononuclear phagocyte subsets, with the highest RAS-MAPK-ERK pathway activity observed in patients with high mutational load. This provides an additional important perspective to LCH immunopathogenesis, suggesting that the oncogenic BRAFV600E mutation may lead to activation of RAS-MAPK-ERK pathway not only in LCH lesions, but also in circulating mononuclear phagocytes, the presumed precursors of tissue LCH cells. In addition, activation of MAPK pathway was also detected in cells from lineages that do not commonly harbor the MAPK activating mutation,3,25 such as T cells and natural killer cells, highlighting the possible contribution of cell-extrinsic MAPK activation. Future studies aiming to assess simultaneously both the transcriptomic profiles and the BRAFV600E mutation status in individual cells will be needed to understand the extent to which the MAPK activation is mediated by the cell-intrinsic or -extrinsic effects, such as hypercytokinemia.
We next asked how mononuclear phagocytes would respond to the BRAF inhibitor dabrafenib. Previous reports on the mechanism underlying BRAF inhibitors are mainly in the studies of melanoma. In addition to its molecularly targeted inhibition, BRAF inhibitor has immunomodulatory effects.49 On one hand, some of the immunosuppressive effect signals related to the BRAF-mutant tumor microenvironment, such as interleukin-1 and interleukin-6, decreased in posttherapy mononuclear phagocytes.50,51 On the other hand, the activities of multiple proinflammatory pathways including interferon and chemokine signaling significantly decreased to levels of healthy individuals in posttherapy mononuclear phagocytes.49 Our study suggests that dabrafenib may adopt a similar inflammatory regulatory mechanism in LCH. Of note, metabolic rewiring in posttherapy compared with pretherapy samples was evident in all mononuclear phagocytes subsets investigated here. Specifically, the signaling of glycolysis and pentose phosphate pathway, which are essential to the proliferation and survival of cells bearing BRAFV600E,52,53 are significantly downregulated by dabrafenib, suggesting a previously unknown mechanism of this targeted therapy. Moreover, the hypoxia status of circulating cells seems to be improved in the meanwhile. These findings imply that dabrafenib has the potential to modulate metabolic status in addition to its expected role in immunomodulation. Whether and to what extent metabolic intervention mediates the effect of BRAF inhibitor and its role in the treatment of LCH remains to be further investigated.
In line with previous reports in adults and children,3,54 higher frequencies of CD14+ Mo compared with healthy controls were also observed in LCH patients. In contrast, pDCs were markedly and significantly less frequent in all LCH subgroups, with the lowest frequencies detected in MS high-risk and high-mutation patients, highlighting pDC frequency as a promising cellular biomarker to be further developed for assessing disease severity and for the evaluation of treatment efficacy by the current standard of care or novel treatment options. Constitutively active MAPK pathway induced by BRAFV600E may lead to a myeloid differentiation bias, mirrored by the higher proportions of CD14+ monocytes and lower proportions of pDC in the HLA-DR+ population.54-56 Another explanation could be their influx to the inflamed tissue, because Halbritter et al46 and we identified this cell cluster in LCH lesions.
One caveat of this study is that the relatively low number of sequenced cells may complicate some comparisons, although most comparisons are of biological significance because flow cytometry enrichment of concerned cell populations was carried out, and most clusters in analysis contained sufficient cells. Integration of multisourced single-cell omics derived from LCH patients in the future would undoubtedly further improve the understanding of the pathogenic and therapeutic mechanisms of the disease.
Acknowledgments
The authors thank all patients and their families who gave them permission to include samples and clinical data in this study.
This study was supported by grants from the National Key Research and Development Program of China, Stem Cell and Translational Research (2017YFA0103401, 2016YFA0100601, and 2020YFA0112402), the National Natural Science Foundation of China (31425012, 81890991, 31871173, 81800102, 82070202, and 81600077), the Program for Guangdong Introducing Innovative and Entrepreneurial Teams (2017ZT07S347), the Key Research and Development Program of Guangdong Province (2019B020234002), and the China Postdoctoral Science Foundation (2018M643373). F.G. is supported by Singapore Immunology Network (SIgN) core funding. F.G. is a European Molecular Biology Organization (EMBO) YIP awardee and is supported by the Singapore National Research Foundation Senior Investigatorship (NRFI) NRF2016NRF-NRFI001-02. C.Z.W.L. is supported by the A*STAR Graduate Scholarship.
Authorship
Contribution: B.L., R.Z., F.G., and Y.L. designed the study; H.S. and Z. Bian performed the sample preparation and the fluorescence-activated cell sorting with help from Y.Z., Y.N., and Z. Bai; T.H. and H.S. performed the single-cell RNA sequencing with help from J.Z., C.L., and X.L.; L.C., Z.L., N.L., H.M., and D.W. collected and prepared the samples; H.H. and T.H. performed the bioinformatics analysis with help from J.H., Y.G., Z.L., E.K., H.S., Z. Bian, and C.Z.W.L.; and H.S., H.H, L.C., E.K., Z. Bian, T.H., C.Z.W.L., Y.L., R.Z., F.G., and B.L. wrote the manuscript.
Conflict-of-interest disclosure: The authors declare no competing financial interest.
Correspondence: Yu Lan, Key Laboratory for Regenerative Medicine of Ministry of Education, Institute of Hematology, School of Medicine, Jinan University, Guangzhou, Guangdong, 510632, China; e-mail: rainyblue_1999@126.com; Florent Ginhoux, Singapore Immunology Network (SIgN), A(∗)STAR, 8A Biomedical Grove, Immunos Building, Singapore 138648, Singapore; e-mail: florent_ginhoux@immunol.a-star.edu.sg; Rui Zhang, Laboratory of Hematologic Diseases, Beijing Pediatric Research Institute, Beijing Children's Hospital, Capital Medical University, National Center for Children’s Health, Beijing, 10045, China; e-mail: ruizh1973@126.com; and Bing Liu, State Key Laboratory of Experimental Hematology, Institute of Hematology, Fifth Medical Center of Chinese PLA General Hospital, Beijing, 100071, China; e-mail: bingliu17@yahoo.com.
The accession number for the data reported in this paper is GEO: GSE151713. Code is available on our laboratory website at https://github.com/Liu-Lan-lab.
The online version of this article contains a data supplement.
There is a Blood Commentary on this article in this issue.
The publication costs of this article were defrayed in part by page charge payment. Therefore, and solely to indicate this fact, this article is hereby marked “advertisement” in accordance with 18 USC section 1734.

This feature is available to Subscribers Only
Sign In or Create an Account Close Modal