

Key Points
Whole-genome sequencing of CTCLs identifies novel putative driver genes and stage-specific genetic alterations.
PD1 deletions lead to reversal of T-cell exhaustion signatures in humans and mice and are associated with a worse prognosis.

Abstract
Cutaneous T-cell lymphomas (CTCLs) are a clinically heterogeneous collection of lymphomas of the skin-homing T cell. To identify molecular drivers of disease phenotypes, we assembled representative samples of CTCLs from patients with diverse disease subtypes and stages. Via DNA/RNA-sequencing, immunophenotyping, and ex vivo functional assays, we identified the landscape of putative driver genes, elucidated genetic relationships between CTCLs across disease stages, and inferred molecular subtypes in patients with stage-matched leukemic disease. Collectively, our analysis identified 86 putative driver genes, including 19 genes not previously implicated in this disease. Two mutations have never been described in any cancer. Functionally, multiple mutations augment T-cell receptor–dependent proliferation, highlighting the importance of this pathway in lymphomagenesis. To identify putative genetic causes of disease heterogeneity, we examined the distribution of driver genes across clinical cohorts. There are broad similarities across disease stages. Many driver genes are shared by mycosis fungoides (MF) and Sezary syndrome (SS). However, there are significantly more structural variants in leukemic disease, leading to highly recurrent deletions of putative tumor suppressors that are uncommon in early-stage skin-centered MF. For example, TP53 is deleted in 7% and 87% of MF and SS, respectively. In both human and mouse samples, PD1 mutations drive aggressive behavior. PD1 wild-type lymphomas show features of T-cell exhaustion. PD1 deletions are sufficient to reverse the exhaustion phenotype, promote a FOXM1-driven transcriptional signature, and predict significantly worse survival. Collectively, our findings clarify CTCL genetics and provide novel insights into pathways that drive diverse disease phenotypes.
Introduction
Cutaneous T-cell lymphomas (CTCLs) are a heterogeneous collection of largely incurable, extranodal lymphomas of mature skin-homing or skin-resident T cells.1-3 Patients have diverse clinical presentations and disease outcomes. In early-stage disease, mycosis fungoides (MF), the disease is restricted to specific areas of the skin and the draining lymph nodes without blood involvement. In late-stage disease, patients with Sezary syndrome (SS) develop widespread erythroderma and leukemic disease. The clinical course of MF/SS can vary widely across disease stages and even among stage-matched patients. In patients with stage IV disease, survival varies from <6 months to >20 years.4
The molecular explanations for patient-to-patient heterogeneity remain unclear. In theory, genomics can determine the relationship between these disease phenotypes. Published studies by us and others have important limitations that preclude their usefulness for this purpose. First, they mostly involve whole-exome sequencing (WES). WES has limited ability to resolve somatic copy number variants (SCNVs), which comprise 92% of all cancer-promoting mutations in CTCL.3 Second, nonleukemic, skin-limited CTCLs (such as stage I-III MF) are underrepresented. MF comprises 95% of all MF/SS cases,5 yet it comprises less than half of the published genomic studies.6 Last, there is little insight into genotype-phenotype interactions. In other T-cell lymphomas, integration of genomics, immunophenotype, and clinical outcome has demonstrated distinct molecular subtypes.7 Identification of molecular subtypes has been limited in CTCL, in part because of the absence to date of functional assays performed on genomically characterized samples.
In this study, we combined multimodal analyses (whole-genome sequencing [WGS]/WES, RNA sequencing), immunophenotyping, and functional analyses. These data provide a landscape view of disease drivers and the molecular bases of clinically relevant disease subtypes, providing novel insights into the molecular relationship between CTCLs across disease stages and across divergent disease outcomes.
Methods
Leukemia sample collection and malignant cell sorting
Peripheral blood mononuclear cells were isolated from blood of patients and healthy controls by Ficoll-Hypaque gradient centrifugation, followed by fluorescence-activated cell sorting (FACS) sorting on a FACSAria 5 (BD Biosciences). The malignant cells were isolated by the FACSAria 5 (BD Biosciences) with the following gating: (1) live cells by side scatter-area (SSC-A) and forward scatter-A (FSC-A); (2) single cells by light scatter height (H) and width (W) (FSC-H/SSC-W and SSC-H/FSC-W); and (3) cells that have known T-cell receptor-Vβ (TCR-Vβ) markers were identified by their clonal expression of the Vβ chain. In samples where the Vβ was not known or the antibodies were not available, CD3+CD8−CD26− was used. Loss of CD26 is a marker of leukemic CTCLs that is in routine clinical use.8 The exceptions were second samplings of NU78 and NU115. These malignant cells showed CD26 expression (CD3+CD8−CD26+).
The antibodies used and further details are described in the supplemental Methods (available on the Blood Web site). Clinical data for all patients with CTCL were retrospectively reviewed from the electronic medical records. This study was approved by the Northwestern University Institutional Review Board.
Generation of mass cytometry and analysis
For mass cytometry analysis, 20 samples were analyzed in a single batch, as previously described.9 1 × 10⁶ cells were used from each sample, and the samples were acquired on a Helios CyTOF Mass Cytometer (Fluidigm). The data were analyzed by PhenoGraph,10 using a fixed number of 2 × 10⁴ cells per sample.
DNA and RNA isolation and sequencing from malignant sorted cells or tissue
DNA and RNA were isolated from sorted leukemic malignant cells, fresh-frozen tumors from skin, and formalin-fixed, paraffin-embedded needle cores from skin, as described previously.11 For stimulation, cells were cultured with 1:1 anti-CD3/CD28 beads (Life Technologies) for 6 hours. Details of the samples analyzed, DNA/RNA extraction kits, and library preparation are provided in supplemental Methods.
DNA and RNA-seq analysis
Somatic single-nucleotide variants (SSNVs), mutational signatures, and SCNVs were called and identified as significant, as previously described11 (supplemental Methods). For RNA sequencing (RNA-seq), reads were aligned by using STAR, gene-specific transcripts were quantified using high-throughput sequencing, and differentially expressed transcripts were identified using DESeq2.12 For gene set variation analysis,13 published gene sets from MSigDB were used.
Protein 3-dimensional structure analysis
For each protein or its homologue, mutated residues were localized on crystal structures. Pymol (https://www.pymol.org) was used to analyze the structures.
Ex vivo functional assays
Cells were stained with carboxyfluorescein succinimidyl ester (BioLegend) and cultured for 7 days before analysis by using proliferation modeling by FlowJo. For intracellular cytokine staining, the cells were stimulated for 6 hours with a Golgi plug before they were washed, fixed, and permeabilized. Details of stimulation conditions and analysis are included in the supplemental Methods. Samples were stained with the appropriate antibodies (supplemental Methods) and analyzed on an LSR II (BD Bioscience).
Statistical analysis
Statistical analyses for cytometry by time-of-flight (CyTOF), functional data, and survival were performed with Prism v8.1.0 software (GraphPad).
Mouse RNA- sequencing and microarray experiments
Results
High-dimensional analysis of CTCLs
To identify the genetic drivers of disease pathogenesis and heterogeneity, we assembled a cohort of CTCL samples subject to DNA-seq, RNA-seq, and functional studies. This includes DNA-seq data for 94 patients (WGS of 75 patients, WES of 19 patients; supplemental Table 1) and previously published DNA-seq data from 203 patients.6 We used this cohort to identify putative driver genes and examined their distribution across known disease subtypes and stages.
To identify genetic predictors of clinically relevant disease phenotypes, we focused on 61 patients from Northwestern who had detailed clinical information available (supplemental Table 2). Based on our previous work implicating mutations in TCR signaling in CTCL,3,6 we hypothesized that integrating WGS with additional TCR-dependent assays enables identification of the functions of CTCL mutations. Therefore, we chose to study genomically annotated primary patient samples in TCR-dependent assays. To that end, we coupled WGS with orthogonal TCR-dependent immunophenotypic and transcriptional analyses for 33 samples. We performed RNA-seq on sorted malignant cells from 22 patients with leukemic SS, as well as from fresh-frozen skin tumors from 11 patients with MF (supplemental Table 3). For 17 of these RNA-seq samples from SS patients, we assessed the transcriptome, with and without TCR stimulation. To gain insights into the CTCL immunophenotype, we also performed CyTOF for 12 patients (and 6 healthy controls). We then performed ex vivo TCR-dependent functional analyses of proliferation and cytokine production for 14 patients. Each of these cohorts is one of the largest, if not the largest, of its kind for this disease. Last, we examined clinical significance by determining the effects of these phenotypes and genetic drivers on disease stage and outcomes.
Identification of novel CTCL driver genes
We identified the landscape of putative oncogenes and tumor suppressors in CTCL. Despite previous research in the genomics of CTCLs, we predicted that our cohort would power the discovery of novel putative driver genes. First, the literature predicts that an increase in sample size enhances the power to discover novel driver genes.3,15 This cohort is 135% the size of the largest previous cohort for point mutation data and 263% the size of the largest previous cohort for copy number mutation data.6 Second, our cohort was significantly enriched for WGS data, which had previously constituted a minority of samples. Most structural variant breakpoints occur in noncoding regions, which are not covered by exome sequencing.16 Therefore, WGS but not WES enables base-pair resolution of structural variants. This resolution is critical to identifying balanced translocations, whose breakpoints occur predominantly in noncoding regions. Moreover, it also improves resolution of statistical algorithms that identify putative target genes of recurrent SCNVs.17 Published algorithms3,6 confirmed the quality of the data (supplemental Figure 1-3; supplemental Methods). As predicted, WGS was superior to WES in identifying structural variants and SCNVs (supplemental Table 4).
We identified novel driver genes through 3 mechanisms. First, we used a multitiered algorithm that we had described previously to identify putative drivers residing on recurrent SCNVs.17 This approach first identifies statistically significant SCNVs with GISTIC2.0 (Genomic Identification of Significant Targets in Cancer) and then incorporates gene-localizing mutations to identify putative target genes: tumor suppressors on recurrent deletions and oncogenes on recurrent amplifications. This analysis identified 35 tumor suppressors subject to recurrent copy number deletions (Figure 1A; supplemental Table 5). Twelve of these tumor suppressors were novel (Figure 1B). Four of them (GRAP, AGAP6, ZBTB7A, and SBNO2) reside on highly recurrent deletions (occurring in >25% of samples). However, the limited resolution of WES and the smaller cohort size precluded confident identification of these tumor suppressors.
![Genomic analysis identifies novel putative tumor suppressors and oncogenes in CTCL. (A) Histogram of SCNVs in CTCL. G-scores calculated by GISTIC2.0 reflect frequency and amplitude of the SCNVs identified. Red represents statistically significant amplifications and blue indicates statistically significant deletions. Residual q < 0.25, by GISTIC2.0. (B) Histogram of percentage of CTCL samples harboring novel putative CTCL tumor suppressors. These tumor suppressors were newly identified by the current SCNV analysis. (C) Diagram of BACH2 structural variants. P-value indicates Bonferroni correction of the binomial distribution probability of the observed number of translocations occurring by chance (see “Methods”). (D) Novel hotspot point mutations in CTCL. Lollipop plots depict observed SSNVs in T-cell lymphoma samples and structural models of NFKB1 (in complex with DNA PDB [protein database]: 1VKX), JUNB (mapped onto the cocrystal structure of c-Jun homodimer complexed with DNA, PDB: 5T01) and TBL1XR1 (complexed with MeCP2, PDB: 5NAF). (E) Lollipop plots depicting novel tumor suppressors with a significant burden of damaging mutations identified in CTCL. CTX, chromosomal translocation. GISTIC, Genomic Identification of Significant Targets in Cancer.](https://ash.silverchair-cdn.com/ash/content_public/journal/blood/138/14/10.1182_blood.2020009655/4/m_bloodbld2020009655f1.png?Expires=1767716022&Signature=J5pWcK8tcOew5mPap~RZsfUlDjDMDgylbTMQNTpV-KZlhEDp1GtLZXb6HFwEsv6SOU0uFpABK9i4Zwn63yxoGzrxWys2xm7feiucD9ItTR7CPW1LDQb9QW-r8F-cLhdsZdTKFQBwdLFIPtkIOvhg81pSa7-9aM~gPsSxgYze~JL-WOr9Qd9g9yyQELUx4NobH-NTljUpWrTz8mEft3g8OhLB~1bm4wxXI4fidOwgtvcaEEk7OTpOjmyYfpdLVaCtTmqF2USYi08m1wxf6iKcqTCiLw9oi7upxpVXCPYbB5a2mz80ftk7-bupHPP6phaeXU6VabcveEGakD0Y94~hnw__&Key-Pair-Id=APKAIE5G5CRDK6RD3PGA)
Genomic analysis identifies novel putative tumor suppressors and oncogenes in CTCL. (A) Histogram of SCNVs in CTCL. G-scores calculated by GISTIC2.0 reflect frequency and amplitude of the SCNVs identified. Red represents statistically significant amplifications and blue indicates statistically significant deletions. Residual q < 0.25, by GISTIC2.0. (B) Histogram of percentage of CTCL samples harboring novel putative CTCL tumor suppressors. These tumor suppressors were newly identified by the current SCNV analysis. (C) Diagram of BACH2 structural variants. P-value indicates Bonferroni correction of the binomial distribution probability of the observed number of translocations occurring by chance (see “Methods”). (D) Novel hotspot point mutations in CTCL. Lollipop plots depict observed SSNVs in T-cell lymphoma samples and structural models of NFKB1 (in complex with DNA PDB [protein database]: 1VKX), JUNB (mapped onto the cocrystal structure of c-Jun homodimer complexed with DNA, PDB: 5T01) and TBL1XR1 (complexed with MeCP2, PDB: 5NAF). (E) Lollipop plots depicting novel tumor suppressors with a significant burden of damaging mutations identified in CTCL. CTX, chromosomal translocation. GISTIC, Genomic Identification of Significant Targets in Cancer.
Genomic analysis identifies novel putative tumor suppressors and oncogenes in CTCL. (A) Histogram of SCNVs in CTCL. G-scores calculated by GISTIC2.0 reflect frequency and amplitude of the SCNVs identified. Red represents statistically significant amplifications and blue indicates statistically significant deletions. Residual q < 0.25, by GISTIC2.0. (B) Histogram of percentage of CTCL samples harboring novel putative CTCL tumor suppressors. These tumor suppressors were newly identified by the current SCNV analysis. (C) Diagram of BACH2 structural variants. P-value indicates Bonferroni correction of the binomial distribution probability of the observed number of translocations occurring by chance (see “Methods”). (D) Novel hotspot point mutations in CTCL. Lollipop plots depict observed SSNVs in T-cell lymphoma samples and structural models of NFKB1 (in complex with DNA PDB [protein database]: 1VKX), JUNB (mapped onto the cocrystal structure of c-Jun homodimer complexed with DNA, PDB: 5T01) and TBL1XR1 (complexed with MeCP2, PDB: 5NAF). (E) Lollipop plots depicting novel tumor suppressors with a significant burden of damaging mutations identified in CTCL. CTX, chromosomal translocation. GISTIC, Genomic Identification of Significant Targets in Cancer.
Second, we performed the first statistical analysis of translocations in CTCL (Figure 1C; supplemental Table 6A). This analysis identified 3 genes that had more translocations than expected by chance (BACH2, NFKB2, and CTCF). BACH2 is a novel tumor suppressor never previously described in any T-cell cancer. BACH2 encodes a transcription factor that restrains TCR signaling.18 In CTCL, it is most frequently mutated by intragenic translocations that uncouple the BACH2 protein-coding sequences from its promoter (8 samples; Padj= 1E-07; Figure 1C). There were an additional 5 gene-spanning deletions of this putative tumor suppressor causing gene mutation in a total of 14% of the samples.
Third, the large sample size enabled the identification of novel point mutations that occurred more often than expected by chance. This analysis identified recurrent but uncommon hotspot and damaging loss-of-function mutations (prevalence, 1% to 2% of CTCLs). We report, for the first time in any cancer, novel hotspot mutations in the DNA-binding regions of 2 transcription factors downstream of the TCR signaling pathway: NFKB1 (p.H67Y) and KLF2 (p.H346Q/N/Y) (Figure 1D; supplemental Table 6B). We also found hotspot mutations previously reported in other T-cell cancers but not previously observed in CTCL: JUNB (p.A282V)19 and TBL1XR1 (p.H307R/Y)20 (Figure 1D; supplemental Table 6C). Moreover, the damaging mutation analysis implicated FUBP1 and ANO6 as novel tumor suppressors (Figure 1E; supplemental Table 6D).
Collectively, these analyses identified 56 putative tumor suppressors (including 16 genes not previously implicated in CTCL) and 30 putative oncogenes (including 3 genes not previously reported in CTCL). Several of these novel mutations function in T-cell–specific pathways. These include inhibitors of TCR signaling (GRAP, MAP4K1, and ANO6) and regulators of T-cell apoptosis (NR3C1), cytokine signaling (SOCS2, SBNO2), and T-cell differentiation (BACH2, JUNB, KLF2, AHR, ZBTB7A, NFKB1, and ZFMP1; Figure 2; supplemental Figure 4; supplemental Table 7).
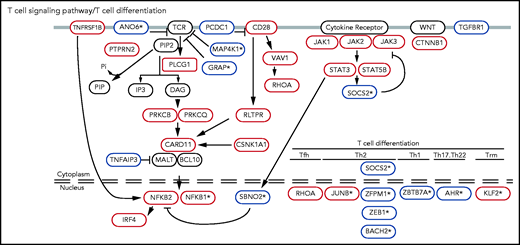
Known and novel putative CTCL driver genes function in T-cell–specific pathways. Mutations in TCR signaling and differentiation pathways identified in CTCL. Putative oncogenes and tumor suppressors are indicated by red and blue boxes, respectively. *Genes not previously reported in CTCL.
Known and novel putative CTCL driver genes function in T-cell–specific pathways. Mutations in TCR signaling and differentiation pathways identified in CTCL. Putative oncogenes and tumor suppressors are indicated by red and blue boxes, respectively. *Genes not previously reported in CTCL.
Stage-specific subtypes harbor reproducible genomic differences
We hypothesized that genetics underlie differences across CTCL disease subtypes. Most of our clinically annotated cohort were classified in 3 broad disease categories: early-stage MF, late-stage SS, and a third group, previously observed by others,21 in which the patients started with early-stage MF but later developed erythroderma, lymphadenopathy, and leukemia during disease progression. Although this third group developed the signs and symptoms of SS, they initially presented with MF; thus, we call them leukemic MF (L-MF; Figure 3A).
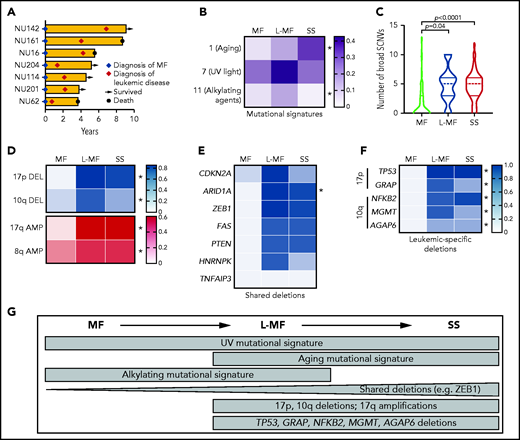
Analysis of CTCL subtypes identifies genetic hallmarks of leukemia. (A) Swimmer plot of patients with MF who developed leukemia. (B) Heat map depicting the relative contribution of point mutation signatures in CTCL subgroups. Color bar indicates proportion of SSNVs in each group harboring each signature. *q < 0.05 2-sided Student t test comparing SS and MF followed by the Benjamini, Krieger, and Yekutieli correction. (C) Violin plot displaying number of broad SCNVs per sample in each CTCL subtype. P values indicate 2-sided Student t test MF vs SS or MF vs L-MF. (D-F) Heat map depicting prevalence of chromosome arm-level SCNVs (D) and deletions in putative tumor suppressors (E-F) in each CTCL subgroup. (D-F) Color bars indicate proportion of cases in each group with the indicated alteration. Panels E and F share the same scale. *Padj. < .05, by Fisher’s exact test comparing leukemic CTCL and MF followed by Bonferroni correction. Shared deletions indicates genes >12.5% deleted in each subgroup; leukemia-specific deletions show significant genes deleted in >30% of leukemic CTCLs and <10% of MFs. (G) Genetic similarities and differences across CTCL subgroups.
Analysis of CTCL subtypes identifies genetic hallmarks of leukemia. (A) Swimmer plot of patients with MF who developed leukemia. (B) Heat map depicting the relative contribution of point mutation signatures in CTCL subgroups. Color bar indicates proportion of SSNVs in each group harboring each signature. *q < 0.05 2-sided Student t test comparing SS and MF followed by the Benjamini, Krieger, and Yekutieli correction. (C) Violin plot displaying number of broad SCNVs per sample in each CTCL subtype. P values indicate 2-sided Student t test MF vs SS or MF vs L-MF. (D-F) Heat map depicting prevalence of chromosome arm-level SCNVs (D) and deletions in putative tumor suppressors (E-F) in each CTCL subgroup. (D-F) Color bars indicate proportion of cases in each group with the indicated alteration. Panels E and F share the same scale. *Padj. < .05, by Fisher’s exact test comparing leukemic CTCL and MF followed by Bonferroni correction. Shared deletions indicates genes >12.5% deleted in each subgroup; leukemia-specific deletions show significant genes deleted in >30% of leukemic CTCLs and <10% of MFs. (G) Genetic similarities and differences across CTCL subgroups.
Analysis of SSNV data suggest subtle differences across disease subgroups (Figure 3B; supplemental Table 8). With rare exceptions, the differences in point mutations in putative driver genes are not statistically significant (supplemental Figure 5A). Consistent with a recent report,22 we observed enrichment of UV signatures (signature 7) in patients with SS or MF, suggesting a common origin in the skin. Signature 1 (related to aging) was specifically enriched in patients with SS. We also observed enrichment of a signature related to alkylating agents (signature 11) in MF. The relevance of signature 11 is unclear, as it did not correlate significantly with exposure to chemotherapeutic agents or other putative environmental mutagens (supplemental Figure 5B).
In contrast, there are dramatic differences in the prevalence of structural variants. Leukemic disease (SS and L-MF) had significantly more structural variants per sample (Figure 3C-F). These structural variants are nonrandomly distributed across the genome. Leukemic CTCLs harbor highly recurrent deletions in 17p (SS/L-MF: 79%/86%) and 10q (47%/57%) and amplifications in 17q (60%/57%). These SCNVs were rare in the MF group (0%, 3%, and 0% for chromosome 17p deletion, 10q deletion, and 17q amplification, respectively; Figure 3D). The differences are not due to sampling bias. The characteristic SCNVs of leukemic disease were found in both the skin biopsy specimens and the blood samples of patients with SS (supplemental Figure 5C-D).
At the gene level, we found that many drivers were shared between disease states (Figure 3E). The most recurrently mutated genes in MF (eg, ARID1A, CDKN2A, and ZEB1) were also highly mutated in SS. However, the prevalence of mutations in these tumor suppressors were significantly higher in leukemic than in skin-limited CTCLs. Furthermore, we found 6 genes (TP53, NFKB2, ARID1A, and MGMT and the newly discovered GRAP and AGAP6) to be significantly more often deleted in leukemic CTCL than in MF (P < .05; Figure 3E-F), largely because of their residence in broad deletions that are highly recurrent in leukemic but absent in skin-limited disease.
The L-MF cases suggest these diseases (MF and SS) occur across a continuum. Consistent with their hybrid clinical course, they have the point mutation signatures of their disease state of origin, MF (UV and alkylating). However, they have also acquired both the point mutation signature (aging) and copy number mutations (highly prevalent deletions in 17p or 10q) characteristic of SS.
Collectively, these data suggest that there are genetic commonalities between MF and SS. However, recurrent structural variants are significantly enriched in de novo or acquired leukemic disease, suggesting their potential positive selection during leukemogenesis (Figure 3G).
PD1 mutational status drives CTCL phenotypic heterogeneity
Previously, we and others have identified mutations in the TCR signaling pathway in CTCL.3,6,23-26 We have further functionally shown that multiple CTCL mutations (CD28, CSNK1A1, and RLTPR) augment TCR-dependent signaling.3,6 Therefore, we hypothesized that previously undescribed putative CTCL driver genes would modulate TCR signaling. If correct, our list of tumor suppressors would consist of genes that negatively regulate TCR signaling. Moreover, CTCL oncogenes would include positive regulators of TCR signaling. To examine this genome wide, we integrated our list of putative CTCL drivers with a published genome-wide CRISPR screen for TCR-dependent but not TCR-independent proliferation in primary human T cells27 (Figure 4A). Consistent with our hypothesis, CRISPR knockout of putative CTCL tumor suppressors increased TCR-dependent proliferation, whereas CRISPR knockout of putative CTCL oncogenes did the opposite (P = .0001; Figure 4B-C; supplemental Table 9).
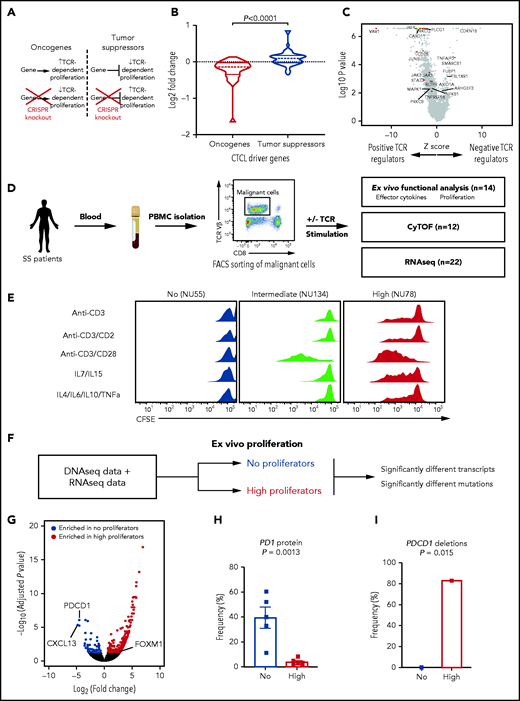
Functional assays identify PD1 as a monogenic driver of TCR-dependent phenotypes. (A) Hypothesized effects of knockout of CTCL tumor suppressors and oncogenes in nontransformed T cells. (B) Log2-fold change of single-guide RNAs (sgRNAs) targeting putative CTCL driver genes in primary TCR-stimulated T cells.27P < .0001, by 2-sided, unpaired Student t test. (C) Volcano plot of z-score and log2-fold change of sgRNAs in primary T cells.27 Putative oncogenes (red) and tumor suppressors (blue) with log10P > 2 are highlighted. (D) Functional assays performed using ex vivo culture of CTCL cells. Malignant cells were isolated via FACS sorting from peripheral blood mononuclear cells and the indicated assays performed. (E) Representative proliferation assays of CTCL cells ex vivo under 5 stimuli. CD4+ T-cell subsets were isolated from patients with CTCL or healthy controls. The cells were labeled with carboxyfluorescein diacetate succinimidyl ester (CFSE) and treated with the indicated stimuli for 7 days. Dilution of the dyes represent cell division. (F) The approach to identifying regulation of heterogenous ex vivo proliferation. (G) Volcano plot of transcripts upregulated (red) or downregulated (blue) in high proliferative compared with nonproliferative CTCL cells. Padj<.05. (H) PD1 protein expression on high (n = 6) and nonproliferative cells (n = 5) measured by flow cytometry. Flow cytometry data represent frequency of PD1 positivity ± standard error of the mean. P value determined by 2-tailed, unpaired Student t test. (I) Frequency of deletions in PDCD1 in high and nonproliferative CTCLs. P value calculated by Fisher’s exact test.
Functional assays identify PD1 as a monogenic driver of TCR-dependent phenotypes. (A) Hypothesized effects of knockout of CTCL tumor suppressors and oncogenes in nontransformed T cells. (B) Log2-fold change of single-guide RNAs (sgRNAs) targeting putative CTCL driver genes in primary TCR-stimulated T cells.27P < .0001, by 2-sided, unpaired Student t test. (C) Volcano plot of z-score and log2-fold change of sgRNAs in primary T cells.27 Putative oncogenes (red) and tumor suppressors (blue) with log10P > 2 are highlighted. (D) Functional assays performed using ex vivo culture of CTCL cells. Malignant cells were isolated via FACS sorting from peripheral blood mononuclear cells and the indicated assays performed. (E) Representative proliferation assays of CTCL cells ex vivo under 5 stimuli. CD4+ T-cell subsets were isolated from patients with CTCL or healthy controls. The cells were labeled with carboxyfluorescein diacetate succinimidyl ester (CFSE) and treated with the indicated stimuli for 7 days. Dilution of the dyes represent cell division. (F) The approach to identifying regulation of heterogenous ex vivo proliferation. (G) Volcano plot of transcripts upregulated (red) or downregulated (blue) in high proliferative compared with nonproliferative CTCL cells. Padj<.05. (H) PD1 protein expression on high (n = 6) and nonproliferative cells (n = 5) measured by flow cytometry. Flow cytometry data represent frequency of PD1 positivity ± standard error of the mean. P value determined by 2-tailed, unpaired Student t test. (I) Frequency of deletions in PDCD1 in high and nonproliferative CTCLs. P value calculated by Fisher’s exact test.
For clinical relevance, we then sought to examine the effects of genotype on CTCL phenotypes. Since individual mutations increased TCR-dependent proliferation, we hypothesized that CTCLs, which harbor these mutations, would broadly demonstrate a hyperactive proliferative response to TCR. To test this, we cultured the cells with fully agonistic TCR stimuli (ie, anti-CD3/CD28 beads). For controls, we used TCR-independent stimuli (eg, cytokines IL7/IL15 and IL4/IL6/IL10/TNFα),28 and TCR stimuli that are normally not sufficient for CD4+ T-cell proliferation (anti-CD3 only and anti-CD3/CD2). Because TCR engagement induces multiple phenotypes, such as proliferation, cytokine production, and upregulation of activation markers, we performed multiple functional assays, including RNA-seq (pre-and post-TCR stimulation), proliferation, cytokine production, and mass CyTOF (Figure 4D; supplemental Table 10). We focused on patients with sufficient tumor cells for these multiple orthogonal assays, all of which were leukemic CTCLs in our cohort.
The results were surprising. We found significant heterogeneity in proliferative capacity across samples. Instead of having a hyperproliferative response, some samples did not proliferate at all. Others proliferated similarly to nontransformed controls. Last, a third cohort had a gain-of-function phenotype, proliferating to more stimuli than controls (Figure 4E; supplemental Figure 6).
Our genomic, immunological, and functional assays suggest that PD1-mediated T cell exhaustion is the primary driver of this phenotypic heterogeneity (Figure 4F). According to RNA-seq, PD1 was the most significantly upregulated gene in nonproliferative samples (Figure 4G; supplemental Table 11). Flow cytometry confirmed that PD1 was highly expressed in nonproliferating samples but was not expressed in highly proliferative samples (P = .0013; Figure 4H). DNA-seq analysis suggested a genetic cause. PD1 was mutated significantly more often in highly proliferating samples than in samples that showed no proliferation (P = .015; 83% in highly proliferating vs 0% in nonproliferating samples; Figure 4I). In fact, PDCD1, the gene that encodes PD1, was the only gene which had significantly more mutations in one group (supplemental Table 12).
We thus grouped our samples as fully exhausted, moderately exhausted, or PD1-low based on functional and molecular differences between these groups. Fully exhausted CTCL cells did not proliferate in response to either TCR stimuli or homeostatic cytokines (Figure 5A). Moreover, similar to exhausted T cells in other diseases,29,30 these cells failed to make effector cytokines, including IL2 and Th2 cytokines (Figure 5B-C; supplemental Figure 7A-B). At the protein level, this cohort expressed higher levels of cell-surface markers (PDCD1, TIGIT) of exhausted T cells compared with normal CD4+ T cells (Figure 5D). At the transcript level, fully exhausted CTCLs expressed markers of exhausted T cells31 including coinhibitory receptors and the chemokine CXCL13 (Figure 5E). In other models, terminally exhausted cells have limited, if any, ability to proliferate to TCR stimuli. Like terminally exhausted T cells, fully exhausted CTCLs have limited proliferative capacity and express ENTPD1.32,33 Because PD1 can also be expressed by TFH, TFH-like,9 or Treg cells, we looked for but did not find expression of genes defining these other lineages (eg, BCL6 for TFH or FOXP3 for Treg), suggesting that in CTCL, PD1 is a marker of exhaustion (supplemental Figure 7C).

PD1-dependent molecular subgroups in CTCL differ in the extent of T-cell exhaustion phenotypes. (A) Proliferative activity of control naive (n = 3) control memory (n = 3) and fully exhausted (n = 4), moderately exhausted (n = 6), and PD1-low (n = 5) CTCL samples. Data represent mean ± standard error of the mean; 1-way analysis of variance (ANOVA), Tukey’s multiple-comparisons test. (B-C) Effector cytokine production assessed by RNA-seq after 6 hours of stimulation with anti-CD3/CD28 beads. P values determined via 1-way ANOVA, Tukey’s multiple-comparisons test. (D) Marker expression of indicated T-cell exhaustion proteins analyzed by CyTOF. P-values calculated by comparing 2-way ANOVA followed by Dunnett’s multiple-comparisons test comparing the control CD4+ group with the indicated CTCL subgroup. (E) Heat map depicting expression determined by RNA-seq of T-cell exhaustion (Tex)–related genes. Color bar (right) indicates z score for each gene. (F) Heat map of FOXM1 gene signatures in CTCL cohorts determined by RNAseq. The ChEA34P value indicates enrichment of these genes for FOXM1-binding sites. (G) Phenotypic features in each indicated subgroup. sig., signature. For all applicable panels, *P < .05, **P < .01, ***P < .001, ****P < .0001, respectively. ChEA, chromatin immunoprecipitation enrichment analysis.
PD1-dependent molecular subgroups in CTCL differ in the extent of T-cell exhaustion phenotypes. (A) Proliferative activity of control naive (n = 3) control memory (n = 3) and fully exhausted (n = 4), moderately exhausted (n = 6), and PD1-low (n = 5) CTCL samples. Data represent mean ± standard error of the mean; 1-way analysis of variance (ANOVA), Tukey’s multiple-comparisons test. (B-C) Effector cytokine production assessed by RNA-seq after 6 hours of stimulation with anti-CD3/CD28 beads. P values determined via 1-way ANOVA, Tukey’s multiple-comparisons test. (D) Marker expression of indicated T-cell exhaustion proteins analyzed by CyTOF. P-values calculated by comparing 2-way ANOVA followed by Dunnett’s multiple-comparisons test comparing the control CD4+ group with the indicated CTCL subgroup. (E) Heat map depicting expression determined by RNA-seq of T-cell exhaustion (Tex)–related genes. Color bar (right) indicates z score for each gene. (F) Heat map of FOXM1 gene signatures in CTCL cohorts determined by RNAseq. The ChEA34P value indicates enrichment of these genes for FOXM1-binding sites. (G) Phenotypic features in each indicated subgroup. sig., signature. For all applicable panels, *P < .05, **P < .01, ***P < .001, ****P < .0001, respectively. ChEA, chromatin immunoprecipitation enrichment analysis.
Moderately exhausted CTCLs expressed exhaustion markers (eg, PD1, TIGIT, CTLA4, and LAG3; Figure 5D-E), made CXCL13 (Figure 5E), and showed diminished responses to homeostatic cytokines (Figure 5A). Unlike cohort 1, they retained the ability to proliferate to TCR stimuli ex vivo (Figure 5A) and make Th2 cytokines and IL2 (Figure 5B-C) and did not express markers of terminal exhaustion (eg, ENTPD1; Figure 5E).
In contrast, nonexhausted PD1-low CTCLs had a gain-of-function phenotype. These samples harbored deletions of the PDCD1 gene. Compared with fully exhausted CTCLs, they proliferated significantly better, both to anti-CD3/CD28 and to homeostatic cytokines (Figure 5A). Moreover, they proliferated to stimuli that are normally insufficient to induce proliferation in nontransformed memory cells from healthy controls (Figure 5A). Functionally, they generally made more effector cytokines and less CXCL13 than fully exhausted CTCLs (Figure 5B-C,E). Moreover, they had decreased expression of markers of T-cell exhaustion (eg, PD1, TIGIT) at the protein (Figure 5D) and transcript level (Figure 5E).
Consistent with their gain-of-function proliferative phenotype, PD1-low CTCLs also had an upregulated cell cycle transcriptional signature. Specifically, we observed that genes that were enriched the most in PD1-low CTCLs showed significant enrichment of FOXM1 binding sites34 (Figure 5F; supplemental Table 13). FOXM1 encodes a forkhead box family transcription factor that promotes expression of the cell cycle components necessary for cell division.35 Together, these data suggest PD1-dependent differences in exhaustion phenotypes across CTCL samples (Figure 5G).
Loss of PD1 is sufficient to reverse exhaustion signatures in murine ITK-SYK fusion–expressing cells
To demonstrate that PD1 deletions are sufficient to reverse exhaustion signatures, we used our recently described mouse model of T-cell non-Hodgkin lymphoma.14,36 This model depends on conditional expression of the human T-cell oncogene ITK-SYK, a genetic mimic of constitutive TCR signaling. In the absence of additional mutations, ITK-SYK+CD4+ murine T cells, similar to PD1-wild-type CTCL cells, acquire a transcriptional signature of T-cell exhaustion. Compared with wild-type controls, ITK-SYK expressing murine CD4+ T cells have upregulated expression of exhaustion markers found in human PD1 wild-type CTCLs, such as Pdcd1, Tigit, and Lag3 (Figure 6A).
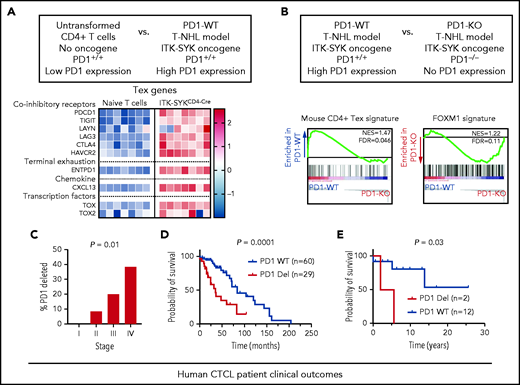
PD1 deletion reverses exhaustion in mice in vivo and predicts worse prognosis in patients. (A) Microarray based expression analysis of exhaustion-associated genes in ITK-SYK–driven murine CD4+ T cells compared with nontransformed naive T cells. Each column represents 1 biological replicate. Color bar (right) indicates expression z score. T-NHL, T-cell non-Hodgkin lymphoma. (B) Gene set enrichment analysis (GSEA) of transcripts derived from cells of PD1 competent ITK-SYKCD4CreERT2 animals (PD1+/+) in comparison with cells derived from PD1-deficient ITK-SYKCD4CreERT2;PD1−/− mice (PD1−/−). ITK-SYK–expressing cells were FACS-sorted from both genotypes at 5 days after tamoxifen treatment. (C) Percentage of PD1-deleted samples by stage across all patients with MF or SS (n = 49). χ2 test for trend. (D-E) Kaplan-Meier survival curves of SS stage IV (D) and MF stages II and III (E) according to PD1 genotypes. For stage IV SS, survival information for patients with PD1 genetic status from published studies are included.3,23 The starting date is the date of diagnosis, and the ending date is the date of death or transplantation; n indicates number of samples in each group. The P value was calculated by log-rank (Mantel-Cox) test.
PD1 deletion reverses exhaustion in mice in vivo and predicts worse prognosis in patients. (A) Microarray based expression analysis of exhaustion-associated genes in ITK-SYK–driven murine CD4+ T cells compared with nontransformed naive T cells. Each column represents 1 biological replicate. Color bar (right) indicates expression z score. T-NHL, T-cell non-Hodgkin lymphoma. (B) Gene set enrichment analysis (GSEA) of transcripts derived from cells of PD1 competent ITK-SYKCD4CreERT2 animals (PD1+/+) in comparison with cells derived from PD1-deficient ITK-SYKCD4CreERT2;PD1−/− mice (PD1−/−). ITK-SYK–expressing cells were FACS-sorted from both genotypes at 5 days after tamoxifen treatment. (C) Percentage of PD1-deleted samples by stage across all patients with MF or SS (n = 49). χ2 test for trend. (D-E) Kaplan-Meier survival curves of SS stage IV (D) and MF stages II and III (E) according to PD1 genotypes. For stage IV SS, survival information for patients with PD1 genetic status from published studies are included.3,23 The starting date is the date of diagnosis, and the ending date is the date of death or transplantation; n indicates number of samples in each group. The P value was calculated by log-rank (Mantel-Cox) test.
To determine the functional effects of PD1 deletions, we then generated isogenic pairs of ITK-SYK–expressing cells, with or without deletions of the PD1 locus14,37 (Figure 6B). This model incorporates an inducible Cre recombinase. Five days after inducing ITK-SYK in both PD1-WT and PD1-mutant CD4+ T cells, we performed RNA-seq on both cohorts. Similar to human PD1-deleted CTCL cells, PD1−/− ITK-SYK cells lost the exhaustion signature and acquired the FOXM1 proliferative signature compared with their PD1-wild-type counterparts (Figure 6B).
PD1 deletion predicts worse clinical outcomes in patients with CTCL
Our human and mouse data suggest PD1 mutations are hallmarks of aggressive disease phenotypes. To test the clinical relevance, we examined our clinical cohort. First, consistent with a role in disease aggressiveness, the frequency of PD1 deletions significantly increased with increasing stage (0%, 8.3%, 20%, and 38% in stages I, II, III, and IV, respectively; (P = .01; Figure 6C).
Next, we compared survival outcomes in stage-matched patients. To increase the power of this analysis, we integrated our Northwestern data with patient samples from 2 previously published data sets.3,23 In stage IV SS, PD1-deleted CTCLs (n = 29) experienced significantly shorter survival than PD1-WT (n = 60; median survival; 2.9 vs 7.0 years; P = .0002, Figure 6D). Consistent with the worse prognosis, patients with PD1-mutant SS in our Northwestern cohort had higher expression of adverse prognostic factors, including peak tumor cell burden (P = .04; supplemental Figure 8A), lactate dehydrogenase (P = .01; supplemental Figure 8B), and a trend toward increased involvement of visceral non-skin draining lymph nodes (supplemental Figure 8C). In an independent cohort of stage II and III MF samples, PD1 genotype was also a significant prognostic factor (median survival = 3.8 years for PD1-mutant (n = 2) vs median survival not reached for stage-matched PD1-WT (n = 12; P = .03; Figure 6E). Correspondingly, lactate dehydrogenase was elevated in PD1-mutant MFs (supplemental Figure 8D). Collectively, these results indicate that in CTCL, PD1 deletions predict worse clinical features and worse overall survival.
Discussion
By integrating SSNVs, SCNVs, and structural variant data, we have identified a list of 86 putative driver genes, many identified for the first time in CTCL. With this high-resolution genomic map, we studied the relationship of genotype and phenotype with clinical outcomes. This analysis enabled us to explore the molecular mechanisms underlying disease heterogeneity. We found MF, L-MF, and SS all harbor a UV signature, potentially suggesting that these diverse disease subtypes could all originate from a skin-resident T cell. In addition, they share several putative driver genes, including but not limited to CDKN2A, ARID1A, and ZEB1.
However, leukemic CTCLs (including L-MF and SS) harbor a high number of structural variants and are disproportionately driven by highly recurrent SCNVs (eg, 17p deletions). These data raise the possibility that the inactivation of multiple tumor suppressors, the targets of recurrent SCNVs on 17p and 10q, is necessary for leukemogenesis. This model is consistent with emerging data for other cancer types such as melanoma.38 In those cancers, point mutations drive disease initiation. However, disease progression requires the accumulation of SCNVs, particularly in the tumor suppressors necessary for the invasive, metastatic phenotype characteristic of late-stage disease.
Previous work based on immune cell markers has suggested that SS and MF arise from T cells with distinct immunophenotypes.39 However, this finding, although provocative and paradigm shifting, may not be sufficient to suggest that MF and SS are distinct disease entities. Emerging data from T-cell biology suggest that CD4+ T-cell clones in healthy controls can exist simultaneously as skin-resident and circulating memory cells.40 These data suggest that there could be conversion between immunophenotypes similar to that observed in the hybrid clinical presentation of L-MF.
Functionally, many CTCL gene mutations individually promote TCR-dependent proliferation. Thus, we were surprised to find that most CTCLs had 1 or more features of T-cell exhaustion. Depending on the extent of the exhaustion phenotype, some effector functions were suppressed (such as proliferation and Th2 cytokine expression). Others were upregulated (such as CXCL13). Broadly, our findings provide a framework to harmonize conflicting reports in the literature regarding the cytokine expression and differentiation status in CTCL.41-44 T-cell exhaustion can variably modulate phenotypes in patients and in ex vivo assays.
Surprisingly, these phenotypes are modulated by mutations in a single gene, PDCD1. PD1 loss is sufficient to reverse the exhaustion phenotype and increase lymphoma cell proliferation. Underscoring its clinical relevance, PD1 deletions correlate with increasing clinical stage and predict significantly shorter survival across patients. We hypothesize that a large, prospective, multi-institutional trial will validate the clinical utility of PD1 mutations as a clinically actionable biomarker that predicts disease progression and disease aggressiveness.
Our work has several limitations. Our stage-dependent findings suggest that the acquisition of recurrent SCNVs drives leukemic progression. Nonetheless, analysis of patient samples over time would be instructive in showing definitive causation. Our analysis identified PD1 as the only gene that was significantly associated with a tumor phenotype in our cohort. This finding does not rule out the likely possibility that mutations in other genes modulate other clinically relevant CTCL phenotypes. Last, widespread clinical adoption of PD1 or other biomarkers requires prospective validation.
Acknowledgments
The authors thank the patients, the Northwestern Skin Disease Research Center, the Flow Cytometry Core, the Northwestern University Research Computing Services, and Admera Health for invaluable contributions.
J.C. was supported, in part, by National Institutes of Health (NIH), National Cancer Institute (NCI), grants K08-CA191019-01A1 and National Institute of Allergy and Infectious Diseases Extramural Activities 1DP2AI136599-01), the Skin Cancer Foundation, the Leukemia Research Foundation, the Doris Duke Charitable Foundation, and the Damon Runyon Foundation (DRCRF# CI-84-16, DDCF# 2016095, DDCF CRM Award). J.D. was supported in part by NIH, NCI training grant T32 CA009560. J.R. was supported by research grants from the Deutsche Forschungsgemeinschaft (DFG; German Research Foundation; Project-ID 210592381-SFB 1054; Project-ID 360372040-SFB 1335; Project-ID 395357507-SFB 1371; Project-ID 369799452-TRR 237; and RU 695/9-1) and the European Research Council under the European Union’s Horizon 2020 research and innovation program (grant agreement 834154). D.R. was supported, in part, by NIH, National Institute of Arthritis and Musculoskeletal and Skin Diseases grants K080AR072791 and P30AR070253 and the Doris Duke Charitable Foundation.
Authorship
Contribution: J.P., J.D., T.W., J.R., and J.C. designed the project and wrote the manuscript; J.P., J.D., C.L., Y.L., and J.J.T. performed the functional assays; J.P., J.D., K.G.R, J.Y, Y.Z., C.S., K.L., K.T., S.H.M., and P.-Y.K. performed sequencing and bioinformatics analysis; M.E.M.-E., S.C., P.G.D., C.C., D.R.P., B.J., F.R.A., B.P., A.L., J.S., and J.G. provided samples, collected, and analyzed the clinical data; T.W. and J.R. designed and performed mouse experiments; T.J.B. performed the protein structure analyses; and D.R. performed mass cytometry experiments and provided immunological support.
Conflict-of-interest disclosure: J.D., C.L., and J.C. have a pending provisional patent application based on the work in this paper . The remaining authors declare no competing financial interests.
Correspondence: Jaehyuk Choi, Robert H. Lurie Comprehensive Cancer Center, Northwestern University, 303 E. Superior St, Room 5-115, Chicago, IL 60611; e-mail: jaehyuk.choi@northwestern.edu; and Jürgen Ruland, Institut für Klinische Chemie und Pathobiochemie, Ismaningerstr. 22 (Bau 557), Munich 81675, Germany; e-mail: j.ruland@tum.de.
All raw sequencing data for consenting patients are available in dbGaP (accession number phs002456.v1.p1).
Original data are available in response to an e-mail request to one of the corresponding authors.
The online version of this article contains a data supplement.
There is a Blood Commentary on this article in this issue.
The publication costs of this article were defrayed in part by page charge payment. Therefore, and solely to indicate this fact, this article is hereby marked “advertisement” in accordance with 18 USC section 1734.

This feature is available to Subscribers Only
Sign In or Create an Account Close Modal