

Key Points
Primary BM MKs have cellular heterogeneity with 3 functionally distinct subpopulations.
A unique CD53+ MK subpopulation possesses a monocytic-like transcriptional program with immunologic capabilities.

Abstract
Megakaryocytes (MKs), the platelet progenitor cells, play important roles in hematopoietic stem cell (HSC) maintenance and immunity. However, it is not known whether these diverse programs are executed by a single population or by distinct subsets of cells. Here, we manually isolated primary CD41+ MKs from the bone marrow (BM) of mice and human donors based on ploidy (2N-32N) and performed single-cell RNA sequencing analysis. We found that cellular heterogeneity existed within 3 distinct subpopulations that possess gene signatures related to platelet generation, HSC niche interaction, and inflammatory responses. In situ immunostaining of mouse BM demonstrated that platelet generation and the HSC niche–related MKs were in close physical proximity to blood vessels and HSCs, respectively. Proplatelets, which could give rise to platelets under blood shear forces, were predominantly formed on a platelet generation subset. Remarkably, the inflammatory responses subpopulation, consisting generally of low-ploidy LSP1+ and CD53+ MKs (≤8N), represented ∼5% of total MKs in the BM. These MKs could specifically respond to pathogenic infections in mice. Rapid expansion of this population was accompanied by strong upregulation of a preexisting PU.1- and IRF-8–associated monocytic-like transcriptional program involved in pathogen recognition and clearance as well as antigen presentation. Consistently, isolated primary CD53+ cells were capable of engulfing and digesting bacteria and stimulating T cells in vitro. Together, our findings uncover new molecular, spatial, and functional heterogeneity within MKs in vivo and demonstrate the existence of a specialized MK subpopulation that may act as a new type of immune cell.
Introduction
Megakaryocytes (MKs) are one of the largest (50-100 µm) and rarest (0.05% to 0.1%) blood cells in the bone marrow (BM). Derived from hematopoietic stem cells (HSCs), developing MK progenitors undergo multiple rounds of endomitosis to become polyploid cells that can be up to 64N in mice.1 Polyploid MKs will further undergo terminal maturation and generate platelets, which are essential for normal hemostasis and blood coagulation. Although the most prominent function of MKs is the production and release of platelets,2,3 accumulating evidence suggests that the role of MKs extends beyond platelet production. MKs can serve as HSC niche cells and regulate HSC function by secreting cytokines such as CXCL4 (PF4), TGF-β, FGF1, and IGF1.4-7 In addition, MKs may participate in pathogen surveillance and antigen presentation because they express multiple inflammatory and immunologic surface markers, including members of the TLR family (TLR1-6), FcγR, major histocompatibility complex (MHC) class I, and CD40L.8-16 MKs also possess antiviral functions such as upregulating interferon (IFN)-induced transmembrane protein 3 (IFITM3) to limit viral infection.17 These findings raise the question of whether these distinct functions are executed by a single cell population or distinct subsets of cells.
Exploring heterogeneity within the MK population is challenging. MKs are rare, fragile cells that are difficult to isolate from BM. High-ploidy MKs (eg, 32N and 64N) were generally thought to be proplatelet-bearing MKs, but these are rarely acquired when flushing BM cells. In addition, the majority of previous studies of MKs were performed on either ex vivo isolated MK progenitors or in vitro differentiated cells. Traditionally, MKs are classified by their morphology, degree of ploidy, and surface markers such as glycoprotein IIb of the IIb/IIIa complex (CD41), glycoprotein IX (CD42), and glycoprotein IIIa (CD61).18,19 However, these surface markers, which are widely expressed on MK progenitors, mature MKs, and platelets, are not stage specific, and by themselves, they do not seem to explain the heterogenous nature of MKs. Thus, whether the diverse functions of MKs correspond to traditionally defined MK populations or to novel subsets of MKs remains unclear.
Here, we developed an efficient isolation strategy to obtain highly purified, BM-derived murine MKs spanning each ploidy stage (2N-32N). To preserve oversized polyploid MKs, individual live MKs were further manually picked and processed for single-cell RNA sequencing (scRNA-seq) with a modified Smart-seq2 protocol. We integrated single-cell analysis of ploidy and the transcriptome to uncover unprecedented transcriptional diversity of MKs and point to distinct functional subpopulations which vary with ploidy. Different MK subsets were localized to distinct locations within the BM environment. Although the platelet generation MK subset was the dominant population in proplatelet formation, the inflammatory response–-associated MKs could undergo rapid expansion upon pathogenic challenge in mice. Remarkably, this CD53+ inflammatory subpopulation exhibited PU.1- and IRF-8–associated monocytic-like transcriptional programs and was capable of phagocytosis and stimulation of T cells in vitro. Furthermore, similar transcriptional heterogeneity and a specific CD41+CD53+ MK population with immunologic and inflammatory expression signatures was confirmed in freshly isolated, primary human BM MKs. Our study provides the first in vivo transcriptomic profile of megakaryopoiesis and a map of megakaryocyte heterogeneity. On the basis of these findings, we proposed a new classification system for MKs.
Methods
Samples from mice and human participants
Animals used in this study were 8- to 10-week-old C57BL/6N healthy male and female mice purchased from Charles River and housed under specific pathogen-free conditions at the animal facility of the Institute of Genetics and Developmental Biology, Chinese Academy of Sciences. All animal care and experiments followed the guidelines of the Institutional Animal Care and Use Committee of the Beijing Institute of Genomics, Chinese Academy of Sciences, Beijing, China.
The human BM samples used in the study were collected from 4 healthy male volunteers at the Institute of Hematology, Peking University People’s Hospital, Beijing, China. Approval for taking BM samples from healthy volunteers was granted by the Ethics Committee of Peking University People’s Hospital (2011-75), and written informed consent was obtained from all participants according to the Declaration of Helsinki.
Collection of MKs with different ploidy
Mouse BM cells were isolated by flushing the femur, tibia, and ilium. The cells were stained with anti-mouse CD41 antibody (eBioscience). Cells were washed and stained with prewarmed Hoechst 33342 (Thermo Fisher Scientific) and incubated at 37°C for 60 minutes, and reserpine was added to prevent the efflux of Hoechst 33342. After centrifugation, cells were resuspended in phosphate-buffered saline with 2% fetal bovine serum and 2 mM EDTA and then filtered through a 100-μm cell strainer. Cells were sorted in MoFlo XDP (Beckman). Highly viable and pure MKs were isolated by fluorescence-activated cell sorting (FACS) as CD41bright cells and were subfractionated based on ploidy by using Hoechst 33342. To minimize shear stress during FACS, we used a larger nozzle (100 μm) and a lower flow rate (3000-4000 events per second) at 20 psi. Then, ∼700 MKs (CD41+) of each ploidy were collected, and the cell pellets were resuspended in 1 mg/mL human serum albumin with a low density (∼30 cells per 100 μL). We used a mouth pipette to pick living single cells for modified Smart-seq2 library preparation. In parallel, 2000 to 4000 MKs of each ploidy were collected for DNA fluorescence in situ hybridization. For the human BM samples, a bovine serum albumin density gradient separation was performed to enrich the MKs, and then the same method as that used for isolating mouse MKs was used to collect human MKs in each ploidy.
Preparation of the scRNA-seq library
The scRNA-seq library was generated by following a previously reported modified Smart-seq2 protocol.20 Briefly, the single MKs were immediately transferred to lysis buffer and incubated at 72°C for 3 minutes to release the RNAs. Then, the first-strand complementary DNA (cDNA) was reverse transcribed using 25 nt oligo (dT) primer and template-switching oligonucleotides followed by 18 cycles of amplification. The amplified cDNAs were pooled and purified. Next, pooled samples were further indexed using ISPCR primer and biotin-modified index primer through 4 cycles of polymerase chain reaction. Amplified cDNA was then sheared to 300 bp by using Covaris S2 (Covaris) and enriched by Dynabeads MyOne Streptavidin C1 beads (Invitrogen), which were further used to generate an RNA-seq library with the KAPA Hyper Prep Kits (Kapa Biosystems). The libraries were sequenced on an Illumina HiSeq 4000 platform.
Processing of scRNA-seq data
Raw sequencing reads were separated into each cell by the specific cell barcode in read 2; read 1 was aligned to the mouse reference genome (mm10) (University of California Santa Cruz) using TopHat2. Uniquely mapped reads were counted with HTSeq. The transcript count of each gene was defined as the number of unique molecular identifiers counted in each cell. Cells were filtered out if they had fewer than 2000 genes, fewer than 22 000 transcripts, or a mapping ratio of <20%. In total, we obtained 795 cells for downstream analysis. The expression levels were normalized by log2(transcript per million/10 + 1), as described previously.20
Dimensional reduction and identification of differentially expressed genes
The Seurat package was used to perform nonlinear dimensional reduction. In all, 2500 highly variable genes were selected for principal component analysis. The RunUMAP and FindClusters functions were used to select principal components 1 to 9. The FindAllMarkers function was used to identify differential expression genes (DEGs). The DEGs were filtered with power >0.4 and "avg _diff" >0.7. Details regarding methods are provided in the supplemental Methods (available on the Blood Web site).
Results
Single-cell transcriptomes of native murine MKs spanning each ploidy stage
To overcome the difficulty in obtaining rare, oversized, highly polyploid and fragile MKs, we developed an efficient isolation strategy to collect viable MK cells from murine BM (Figure 1A; supplemental Figure 1A-D; supplemental Methods). CD41+ MKs with different ploidy (from 2N-32N) were isolated by FACS (Figure 1B). Individual living MKs were further manually picked under the stereoscope and processed for scRNA-seq. Fluorescence in situ hybridization was simultaneously applied for direct visualization of DNA content of sorted MKs. This approach validated that the purity of MKs at each ploidy stage was more than 95% (Figure 1C). MKs can be up to 65 μm in diameter and can be widely used in scRNA-seq systems, but 10x Genomics technology and Drop-seq may not work well for these large cells. So we performed scRNA-seq using the modified Smart-seq2 protocol.20 We successfully selected 920 highly purified MKs (184 cells in each ploidy from 2N to 32N) for single-cell sequencing. After stringent cell filtration, the high-quality transcriptomes of 795 single cells collected from 12 mice were retained for subsequent analysis (supplemental Figure 2A). We conducted a downsampling analysis to verify that the sequencing depth was sufficient for rigorous analyses (supplemental Figure 2B). On average, each single MK expressed 7520 genes and 317 687 messenger RNA (mRNA) molecules (supplemental Figure 2C-D). Cells spanning 2N to 32N all highly expressed established markers of MKs such as Itga2b (CD41), Pf4, Itgb3 (CD61), and Gp9 (CD42) (Figure 1D; supplemental Figure 2E). These results showed that we successfully obtained single-cell transcriptomes of native murine MKs spanning each ploidy stage.
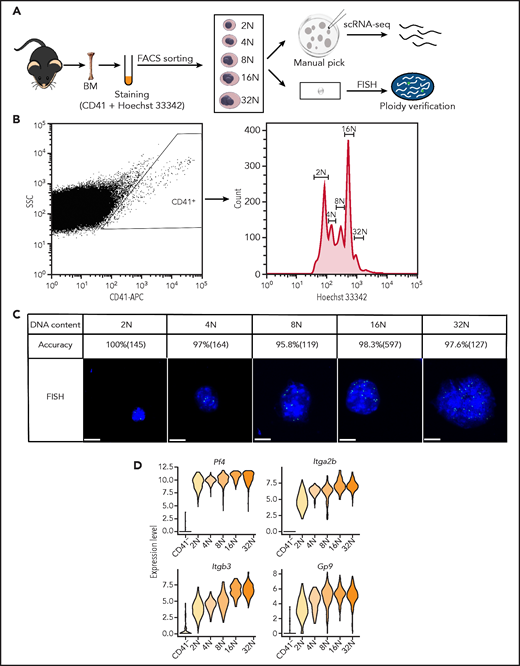
Single-cell transcriptomes of primary murine MKs spanning each ploidy stage. (A) Schematic illustration of the experimental workflow. Individual MKs at different DNA content levels from 2N to 32N were collected from mouse BM by FACS and manual picking and were processed for scRNA-seq. Fluorescence in situ hybridization (FISH) was used to verify the DNA contents of the sorted MKs. (B) FACS results for mouse MKs that span each ploidy stage (2N-32N) stained with CD41 and Hoechst 33342 antibodies. (C) Representative images of MKs analyzed by DNA-FISH to detect the degree of ploidy and to quantify the accuracy of ploidy degree and cell numbers of MKs in each ploidy. Scale bars, 10 μm. (D) Violin plots showing relative expression levels of traditional markers of MKs in different ploidy MKs and CD41– cells. APC, antigen-presenting cell; SSC, side scatter.
Single-cell transcriptomes of primary murine MKs spanning each ploidy stage. (A) Schematic illustration of the experimental workflow. Individual MKs at different DNA content levels from 2N to 32N were collected from mouse BM by FACS and manual picking and were processed for scRNA-seq. Fluorescence in situ hybridization (FISH) was used to verify the DNA contents of the sorted MKs. (B) FACS results for mouse MKs that span each ploidy stage (2N-32N) stained with CD41 and Hoechst 33342 antibodies. (C) Representative images of MKs analyzed by DNA-FISH to detect the degree of ploidy and to quantify the accuracy of ploidy degree and cell numbers of MKs in each ploidy. Scale bars, 10 μm. (D) Violin plots showing relative expression levels of traditional markers of MKs in different ploidy MKs and CD41– cells. APC, antigen-presenting cell; SSC, side scatter.
Transcriptional heterogeneity exists within 4 MK subpopulations in mouse and human BM
To investigate the heterogeneity of MKs, unsupervised clustering by uniform manifold approximation and projection (UMAP) analysis was performed,21 and 4 cell clusters were identified (Figure 2A). MKs in each ploidy stage also contained multiple cell clusters (Figure 2A-B). MKs in cluster 1 consisted of cells in all ploidy stages, and the numbers of detected mRNA molecules approximately doubled as the degree of ploidy doubled (Figure 2F; supplemental Figure 3A). Cells in cluster 1 were classified as active cycling MKs or polyploidization MKs, because these cells had high expression of genes related to DNA replication and cell cycle progression (Figure 2C; supplemental Table 1). These highly expressed genes in cluster 1 included enzymes involved in DNA replication, DNA clamp-associated genes, and genes essential for MK polyploidization22,23 (Figure 2D; supplemental Figure 3B-D). After cell cycle genes were removed from the analysis, the cluster 1 active cycling MK subset remained as an independent cell cluster with strong expression of genes involved in chromosome maintenance, ribonucleoprotein complex biogenesis, and mitochondrial organization (supplemental Figure 3E-F).

Transcriptional heterogeneity of mouse and human BM MKs. (A) UMAP plot of all MKs that passed quality control tests (795 cells). (B) Bar graph showing the number of cells at each ploidy stage in 4 clusters. (C) Heatmap displaying the cluster-specific DEGs in mouse MKs. The enriched biological processes for each gene group are shown on the right. (D) Dot plot representing relative expression for selected genes involved in indicated biological processes in mouse MKs. Dot size indicates the proportion of cells in a cluster that express a gene; shading (low, light; high, dark) indicates the relative level of expression. (E) Heatmap showing cluster-specific DEGs that are similar between human and mouse MKs. The enriched biological processes for each gene group are shown on the right. (F) Bar plot showing the distribution of ploidy degree of each cluster in mouse and human MKs. H, human; M, mouse.
Transcriptional heterogeneity of mouse and human BM MKs. (A) UMAP plot of all MKs that passed quality control tests (795 cells). (B) Bar graph showing the number of cells at each ploidy stage in 4 clusters. (C) Heatmap displaying the cluster-specific DEGs in mouse MKs. The enriched biological processes for each gene group are shown on the right. (D) Dot plot representing relative expression for selected genes involved in indicated biological processes in mouse MKs. Dot size indicates the proportion of cells in a cluster that express a gene; shading (low, light; high, dark) indicates the relative level of expression. (E) Heatmap showing cluster-specific DEGs that are similar between human and mouse MKs. The enriched biological processes for each gene group are shown on the right. (F) Bar plot showing the distribution of ploidy degree of each cluster in mouse and human MKs. H, human; M, mouse.
Cells in cluster 2, most of which were high-ploidy cells (≥8N) (Figure 2F), highly expressed Igf1 and Pf4, cytokines expressed by MKs that regulate HSCs6,7 (Figure 2D). Thus, we refer to cluster 2 cells as HSC-niche MKs. Moreover, cells in cluster 2 were enriched in cell-cell signaling and cytokine genes, cell-cell adhesion genes, and stem cell maintenance genes (Figure 2C; supplemental Figure 3G). Interestingly, genes involved in exocytosis, including Exoc8, Cplx2, and Rab3c, were highly expressed in cluster 2 (supplemental Figure 3G), consistent with the notion that exocytosis is an essential membrane trafficking event that mediates cytokine secretion.24 WNT signaling genes, including Wnt3a, Wnt4, Dkk1, and Dkk2 were highly and specifically expressed in cluster 2 (supplemental Figure 3G), which may provide new signals to regulate HSC homeostasis by MKs.25,26
Cells in cluster 3, consisting generally of low-ploidy cells (≤8N) (Figure 2F) that possessed expression signatures enriched for inflammatory response and myeloid leukocyte activation genes (Figure 2C-D; supplemental Figure 3H). We refer to cluster 3 cells as inflammatory response-associated MKs. Transcription factors that play an important role in granulocyte and monocyte development,27 such as Spi1, Cebpd, Cebpe, Irf5, and Irf8, were highly expressed in cluster 3 (supplemental Figure 3D).
Cells in cluster 4 express key genes involved in platelet production and hemostasis (Figure 2C), including proplatelet formation (Tubb1, Myh9), platelet adhesion (Vwf, Gp1ba, Gp5, and Gp6), and platelet activation (P2ry1, P2ry12)28-32 (Figure 2D). We refer to cluster 4 cells as platelet-generating MKs. Transcription factors identified in cluster 4, including GATA2, NF-E2, and FLI-1, are known to regulate MK development and platelet production33-35 (supplemental Figure 3D). Some known targets of NF-E2 were also highly expressed in cluster 4 (supplemental Figure 3I). Consistent with this, cluster 4 had higher numbers of high ploidy cells (≥8N), consistent with platelet formation preferentially occurring in MKs with high ploidy (Figure 2F).36
To investigate the potential intrinsic relationships of these 4 clusters, we used Monocle analysis to reconstruct the developmental time course (supplemental Figure 4A). The active cycling MKs (cluster 1), consisting of mostly lower ploidy cells (<8N), preferentially expressed high levels of Kit and Cd34 (supplemental Figure 4B), the hallmarks of MK progenitors. We used the cluster 2, 3, and 4 marker genes as gene signatures to score cluster 1. Interestingly, cluster 1 MKs could be subclustered into 4 subgroups, including 3 subgroups that expressed a high score of cluster 2, 3, and 4 signatures, and the fourth subgroup that expressed low levels of cluster 2, 3, and 4 genes was defined as consisting of uncommitted MKs (supplemental Figure 4C). Moreover, the subgroup that preferentially differentiating into cluster 3 (inflammatory response–associated MKs) consisted of low ploidy MKs, whereas the subgroups prone to differentiating into cluster 4 (platelet-generating MKs) were high ploidy MKs (supplemental Figure 4D). These data, together with the trajectory analysis, suggest that polyploidization MKs (cluster 1) may be the starting point of a developmental trajectory, and cluster 1 may include MKs with the potential to develop into functional MK subpopulations (cluster 2, 3, or 4).
To extend our studies of MK heterogeneity from mice to humans, we isolated and sequenced 768 CD41+ purified, BM-derived human MKs spanning each ploidy stage (2N-32N) from 4 healthy human donors. High-quality, single-cell sequenced transcriptomes of 700 MKs were analyzed. As we observed with murine MKs, human MKs were also heterogeneous. In UMAP analysis, there were 4 subpopulations identified with remarkable similarity to what we observed in murine MKs (supplemental Figure 5A). These included clusters of DEGs related to cell cycle and DNA replication, cell-cell communication and cytokine production, leukocyte activation and inflammatory response, and platelet activation and function (Figure 2E; supplemental Figure 5B; supplemental Table 2). Integrated analysis of mouse and human MKs showed that cluster 1, 3, and 4 MKs from humans and mice were evenly distributed, whereas human and mouse cluster 2 MKs were separately distributed (supplemental Figure 5C). Interestingly, although expression signatures of cluster 2 cells were enriched for cell–cell signaling and cytoskeleton organization in both humans and mice (Figure 2E), specific genes involved were different between the 2 species (Figure 2D; supplemental Figures 3G and 5B). For example, cell-cell signaling associated genes such as Wnt3a, Wnt4, Dkk1, and Dkk2, cytokine genes such as Pf4, Igf1, Fgf9, and Fgf10, and cytoskeleton organization–associated genes such as Map1b, Mapt, Tpm2, and Myoz3 were differentially expressed in mice (Figure 2D; supplemental Figure 3G), whereas cell signaling–associated genes such as FGFR3, TSPAN32, ZYX, and GJA4, cytokine genes such as HDGF, CTGF, CMTM2, and CMTM5, and cytoskeleton organization–associated genes such as TPM1, TPM4, MYL9, and MYO5C were highly expressed in humans (supplemental Figure 5B). These results suggested a possible species-specific regulation of HSCs by MKs between humans and mice. Furthermore, the ploidy distribution of human MK subpopulations was similar to the corresponding mouse MK subpopulations (Figure 2F). Overall, these findings reveal that there is similar transcriptional heterogeneity of MKs between mice and humans.
In situ immunostaining of MK subpopulations in murine BM
To facilitate the tracking of these newly identified MK subpopulations, we decided to focus on clusters 2, 3, and 4, which have potential biological functions. Cluster 2 (HSC-niche MKs) was best defined by expression of Mylk4, which encodes myosin light chain kinase 4 (Figure 3A). Cluster 3 (inflammatory response–associated MKs) could be specifically identified by expression of Lsp1, a regulator of immune cell migration in inflammation and phagocytosis, and CD53, a leukocyte-specific surface molecule involved in cell adhesion and immune cell activation37 (Figure 3A). Cluster 4 (platelet-generating MKs) was best defined by expression of Arntl, which forms a core component of the circadian clock (Figure 3A).

In situ immunostaining of MK subpopulations in murine BM. (A) Relative expression levels of marker genes, including Mylk4, Lsp1, Cd53, and Arntl, in mouse MK subpopulations. (B) Immunofluorescence of MYLK4 (green) co-stained with CD41 (red) in mouse BM. Arrows indicate MYLK4+CD41+ cells. (C) Immunofluorescence of LSP1 (green) co-stained with CD41 (red) in mouse BM. Arrows indicate LSP1+ CD41+ cells. (D) Immunofluorescence of ARNTL (green) co-stained with CD41 (red) in mouse BM. Arrows indicate ARNTL+CD41+ cells. The images in panels B-D represent 3 independent experiments . (E) Bar plot showing the frequency of MYLK4+CD41+ (668 MKs), LSP1+CD41+ (1221 MKs), and ARNTL+CD41+ (748 MKs) in total MKs (CD41+) in murine BM. (F) Box plot showing the distribution of cell diameters of MYLK4+CD41+ (87 cells), LSP1+CD41+ (49 cells), and ARNTL+CD41+ (185 cells). Data are from one-way analysis of variance (ANOVA). Scale bars, represent 20 μm. Error bars indicate SEM. *P ≤ .05; ****P ≤ .0001. DAPI, 4′,6-diamidino-2-phenylindole.
In situ immunostaining of MK subpopulations in murine BM. (A) Relative expression levels of marker genes, including Mylk4, Lsp1, Cd53, and Arntl, in mouse MK subpopulations. (B) Immunofluorescence of MYLK4 (green) co-stained with CD41 (red) in mouse BM. Arrows indicate MYLK4+CD41+ cells. (C) Immunofluorescence of LSP1 (green) co-stained with CD41 (red) in mouse BM. Arrows indicate LSP1+ CD41+ cells. (D) Immunofluorescence of ARNTL (green) co-stained with CD41 (red) in mouse BM. Arrows indicate ARNTL+CD41+ cells. The images in panels B-D represent 3 independent experiments . (E) Bar plot showing the frequency of MYLK4+CD41+ (668 MKs), LSP1+CD41+ (1221 MKs), and ARNTL+CD41+ (748 MKs) in total MKs (CD41+) in murine BM. (F) Box plot showing the distribution of cell diameters of MYLK4+CD41+ (87 cells), LSP1+CD41+ (49 cells), and ARNTL+CD41+ (185 cells). Data are from one-way analysis of variance (ANOVA). Scale bars, represent 20 μm. Error bars indicate SEM. *P ≤ .05; ****P ≤ .0001. DAPI, 4′,6-diamidino-2-phenylindole.
By using antibodies to co-stain CD41 and each of these unique protein markers, we carried out in situ immunostaining of these MK subpopulations in the mouse BM (Figure 3B-D). ARNTL+ MKs (cluster 4) accounted for the highest proportion of MKs (24.5% ± 1.1%) among the 3 clusters, consistent with the understanding that platelet generation is the major function of MKs (Figure 3E). MYLK4+ MKs (cluster 2) represented 17.2% ± 0.38% of total MKs in the murine BM, whereas only 4.1% ± 0.94% of total MKs were LSP1+ (cluster 3) (Figure 3E). These findings indicate that MK subpopulations can be characterized by specific markers at both mRNA and protein levels.
Because higher ploidy is associated with an increase in MK size,38 we further measured the size of MKs from these 3 clusters. The largest cell diameter, on average, was found in ARNTL+ MKs (cluster 4, 20-45 μm; average, 31.5 μm). MYLK4+ MKs (cluster 2) were slightly smaller than ARNTL+ MKs (29.7 μm vs 31.5 μm), and LSP1+ MKs (cluster 3) had the smallest cell size, with an average diameter of 7.4 μm (Figure 3F). These results were consistent with the data derived from ploidy and transcriptome analysis, which showed that cluster 4 (platelet-generating MKs) and cluster 2 (HSC-niche MKs) consisted of high-ploidy cells whereas cluster 3 (inflammatory response–associated MKs) consisted of low-ploidy cells (Figure 2F).
MKs subpopulations display distinct BM localization and show the propensity of cluster 4 cells to generate platelets
The distinct functions of MKs are known to be executed at unique locations within the BM niche. For example, contact with blood vessels is required for MKs to generate platelets. In addition, to maintain HSC quiescence, MKs need to be physically associated with HSCs.4,7,39,40 Based on these previous observations, we hypothesized that MKs with distinct expression signatures would exhibit unique spatial organization within the BM.
To determine the identity of MK cells associated with endogenous HSCs in the BM, we applied a previously reported 3D immunofluorescence imaging technique to identify HSCs and to calculate the distance between HSCs and MKs.41 By using this approach, we observed that ∼20% of HSCs, defined as (Lin)−CD41−CD48−CD150+ cells,4,7,42 were in direct contact with CD41+ MKs, consistent with previous reports.4,7 Remarkably, nearly all MKs in contact with HSCs were MYLK4+ (cluster 2, HSC-niche MKs) (Figure 4A-B); supplemental Figure 6A). We used an established image analysis40 to calculate the distance between blood vessels (CD105+) and the MK subpopulations. ARNTL+ MKs (cluster 4, platelet-generating MKs) were in direct contact with the vessels (0.34 μm), whereas the average distance between blood vessels and MYLK4+ MKs (cluster 2) or LSP1+ MKs (cluster 3, inflammatory response–associated MKs) was significantly greater (6.5 μm and 11.3 μm respectively; Figure 4C-D; supplemental Figure 6B-D). Overall, the unique spatial distributions of cluster 2 and 4 populations were consistent with the distinct function inferred from their respective transcriptomic signatures and support that platelet generation and HSC maintenance are carried out by 2 distinct MK subpopulations.
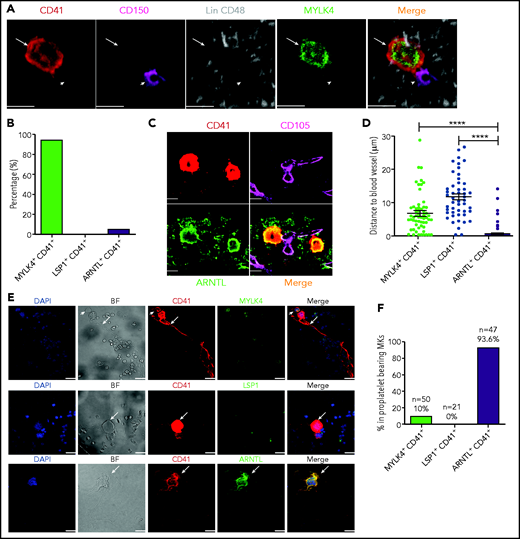
MKs with distinct expression signatures are spatially organized in the BM niche, and CD41+ARNTL+ MKs are the dominant population in proplatelet formation. (A) Representative image of an Lin−CD48−CD41−CD150+ HSC (violet; indicated by arrowheads) and an MYLK4+ MK stained with MYLK4 (green) and CD41 (red; indicated by arrows). The images represent 3 independent experiments. (B) Quantification of the frequency of MKs (CD41+) in contact with HSCs: MYLK4+CD41+(21 cells), LSP1+CD41+ (18 cells), and ARNTL+CD41+ (20 cells). (C) Representative images of CD105+ blood vessel (violet) and ARNTL+ MK stained with ARNTL (green) and CD41 (red). The images represent 3 independent experiments . (D) Quantification of the distance between cells and blood vessels: MYLK4+CD41+ (58 cells), LSP1+CD41+ (49 cells), and ARNTL+CD41+ (185 cells). (E) Representative images of proplatelet-bearing MKs in the whole BM section using CD41+ staining. Proplatelet-bearing MKs were costained with ARNTL+, but these proplatelet-bearing MKs could not be clearly co-stained with MYLK4 or LSP1. The images represent at least 3 independent experiments. Arrows indicate proplatelet-bearing MKs; arrowheads indicate non–proplatelet-bearing MKs costained by MYLK4 and CD41. (F) Quantification of the frequency of MYLK4+CD41+ (50 cells), LSP1+CD41+ (21 cells), or ARNTL+CD41+ (47 cells) in proplatelet-bearing MKs. Scale bars, 20 μm. Error bars indicate SEM. Data are from one-way ANOVA. ****P ≤ .0001.
MKs with distinct expression signatures are spatially organized in the BM niche, and CD41+ARNTL+ MKs are the dominant population in proplatelet formation. (A) Representative image of an Lin−CD48−CD41−CD150+ HSC (violet; indicated by arrowheads) and an MYLK4+ MK stained with MYLK4 (green) and CD41 (red; indicated by arrows). The images represent 3 independent experiments. (B) Quantification of the frequency of MKs (CD41+) in contact with HSCs: MYLK4+CD41+(21 cells), LSP1+CD41+ (18 cells), and ARNTL+CD41+ (20 cells). (C) Representative images of CD105+ blood vessel (violet) and ARNTL+ MK stained with ARNTL (green) and CD41 (red). The images represent 3 independent experiments . (D) Quantification of the distance between cells and blood vessels: MYLK4+CD41+ (58 cells), LSP1+CD41+ (49 cells), and ARNTL+CD41+ (185 cells). (E) Representative images of proplatelet-bearing MKs in the whole BM section using CD41+ staining. Proplatelet-bearing MKs were costained with ARNTL+, but these proplatelet-bearing MKs could not be clearly co-stained with MYLK4 or LSP1. The images represent at least 3 independent experiments. Arrows indicate proplatelet-bearing MKs; arrowheads indicate non–proplatelet-bearing MKs costained by MYLK4 and CD41. (F) Quantification of the frequency of MYLK4+CD41+ (50 cells), LSP1+CD41+ (21 cells), or ARNTL+CD41+ (47 cells) in proplatelet-bearing MKs. Scale bars, 20 μm. Error bars indicate SEM. Data are from one-way ANOVA. ****P ≤ .0001.
To validate whether platelet production was a specialized function of cluster 4 platelet-generating MKs, we used BM explant to examine the formation of proplatelets, which would directly give rise to platelets under the blood shear forces. We found that 93.6% of the proplatelet-bearing MKs express ARNTL (co-staining of CD41+ and ARNTL+) (Figure 4E-F). Only 10% of proplatelet-bearing MKs expressed MYLK4 (Figure 4E-F; supplemental Figure 6E). No immune MKs (LSP1+) were observed to have the ability to generate platelets (Figure 4E-F). These results confirmed the propensity of ARNTL+ MKs (platelet–generating MKs) to produce platelets.
Cluster 3 cells possess a monocytic-like transcriptional program and respond to pathogen invasion
Considering that genes in cluster 3 were enriched for their immunologic potential (Figure 2C), we next sought to validate the potential role of this MK subpopulation in immunity. We first compared the transcriptome of cluster 3 cells with myeloid and lymphoid cells by using single-cell or bulk RNA-seq data from public databases. Interestingly, correlation analyses using the whole transcriptome from our analyzed MKs revealed that cells in cluster 3, but not clusters 2 or 4, were closely related to monocytes (supplemental Figure 7A). By using ingenuity pathway upstream regulator analyses, we further identified MK transcription factors RUNX1 and GATA2 and known regulators of myeloid development and monocytic function (PU.1, IRF-8, CEBPD, and CEBPE) as potential transcription activators in cluster 3 (supplemental Figure 7B). Notably, PU.1 and IRF-8, and their known targets involved in phagocytosis, pathogen killing, and antigen presentation were uniquely expressed in cluster 3, but not in cluster 2 (HSC-niche MKs) or cluster 4 (platelet-generating MKs) (Figure 5A; supplemental Figure 7C). Most of these genes were also highly expressed in human cluster 3 MKs (inflammatory response–associated MKs) (supplemental Figure 7D). Furthermore, a high-throughput scRNA-seq platform (10x Genomics) was used to acquire 4130 CD41+ mouse BM cells which contained mostly lower-ploidy MKs. Unsupervised clustering and integrated analysis verified the existence and gene signatures of this inflammatory response–associated MK subpopulation (supplemental Figure 8A-D; supplemental Tables 3 and 4). Importantly, specific markers of cluster 3 in mice, including LSP1, CD53, CD52, and CD48 were also differentially highly expressed in human cluster 3 MKs (inflammatory response–associated MKs) (supplemental Figure 8E). Together, these results strongly suggest that cluster 3 MKs possess canonical myeloid transcription factors that may contribute to the observed monocytic-like expression program in pathogen recognition and clearance.

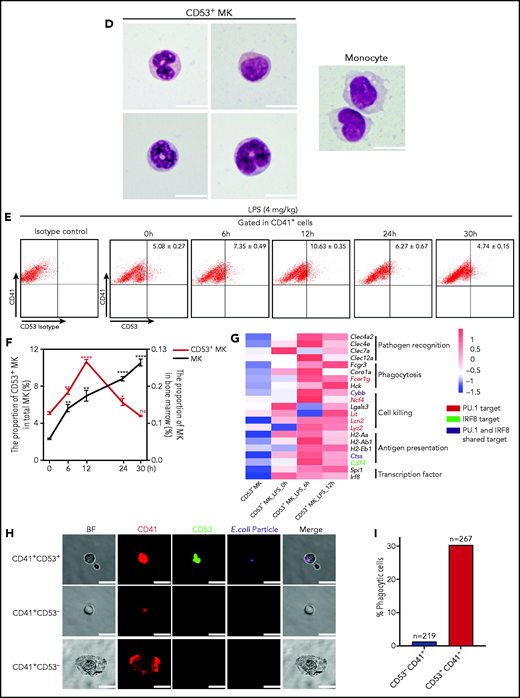
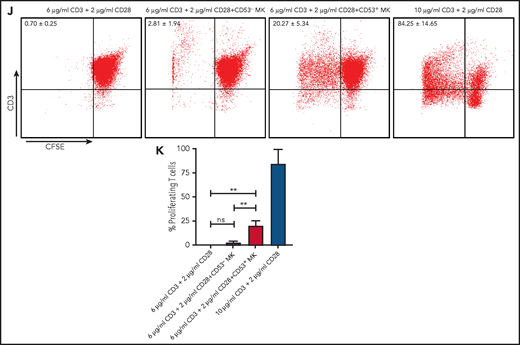
Cluster 3 cells possess a monocytic-like transcriptional signature and respond to pathogen infection. (A) Heatmap of correlation matrix of transcriptomes between mouse MK subpopulations and immune cells from published data set, including MKs, monocytes, dendritic cells (DCs), granulocytes, macrophages, CD4+ T cells, and CD8+ T cells. (B) UMAP plot of MKs from different organs and species by integrated analysis. (C) Violin plots showing the expression levels of genes involved in phagocytosis and antigen presentation in immune MKs derived from fetal mouse lung43 and BM. (D) Representative images of CD53+ MKs and monocytes stained with Wright-Giemsa stained. Scale bars, 10 μm. (E) Representative FACS plot of CD53+ MKs (CD53+CD41+) among BM samples from mice at 0, 6, 12, 24, and 30 hours after injection of LPS 4 mg/kg. Numbers in boxes represent the percentage of CD53+ MKs (CD53+CD41+) in total MKs; mean ± standard error of the mean (SEM). (F) Quantification of the frequency of MKs (CD41+) in total BM cells and CD53+ MKs (CD53+ CD41+) in total MKs from mice at 0, 6, 12, 24, and 30 hours after injection of LPS 4 mg/kg (n = 3; mean ± SEM; unpaired Student t test). (G) Heatmap displaying relative expression for selected genes involved in indicated biological processes in CD53– and CD53+ MKs isolated from mice at 0, 6, and 12 hours after injection of LPS 4 mg/kg . (H) Representative images of fluorescent Escherichia coli particles (purple) incubated with CD53+ or CD53– MKs stained with CD53 (green) and CD41 (red). Scale bars, 20 μm. BF, bright field. Images represent 3 independent experiments. (I) Quantification of the percentage of cells phagocytizing E coli particles in CD53+ and CD53– MKs: CD53+CD41+, 219 cells; CD53–CD41+, 267 cells. (J) Representative FACS plot of T-cell proliferation. T cells labeled with carboxyfluorescein succinimidyl ester (CSFE) were cultured with or without 3000 to 5000 CD53+/CD53– MKs for 3 days in the presence of anti-CD3 and anti-CD28 antibody. The upper left quadrant represents the proliferating T cells; numbers in the boxes indicate the percentage of proliferating T cells. Results are representative of 3 independent experiments. (K) Bar graph depicting the percentage of proliferating T cells in total T cells cultured with or without 3000 to 5000 CD53+/CD53– MKs for 3 days in the presence of anti-CD3 or anti-CD28 antibody (n = 3; mean ± SEM; 1-way ANOVA; *P ≤ .05; **P ≤ .01. ****P ≤.0001. n.s., not significant.
Cluster 3 cells possess a monocytic-like transcriptional signature and respond to pathogen infection. (A) Heatmap of correlation matrix of transcriptomes between mouse MK subpopulations and immune cells from published data set, including MKs, monocytes, dendritic cells (DCs), granulocytes, macrophages, CD4+ T cells, and CD8+ T cells. (B) UMAP plot of MKs from different organs and species by integrated analysis. (C) Violin plots showing the expression levels of genes involved in phagocytosis and antigen presentation in immune MKs derived from fetal mouse lung43 and BM. (D) Representative images of CD53+ MKs and monocytes stained with Wright-Giemsa stained. Scale bars, 10 μm. (E) Representative FACS plot of CD53+ MKs (CD53+CD41+) among BM samples from mice at 0, 6, 12, 24, and 30 hours after injection of LPS 4 mg/kg. Numbers in boxes represent the percentage of CD53+ MKs (CD53+CD41+) in total MKs; mean ± standard error of the mean (SEM). (F) Quantification of the frequency of MKs (CD41+) in total BM cells and CD53+ MKs (CD53+ CD41+) in total MKs from mice at 0, 6, 12, 24, and 30 hours after injection of LPS 4 mg/kg (n = 3; mean ± SEM; unpaired Student t test). (G) Heatmap displaying relative expression for selected genes involved in indicated biological processes in CD53– and CD53+ MKs isolated from mice at 0, 6, and 12 hours after injection of LPS 4 mg/kg . (H) Representative images of fluorescent Escherichia coli particles (purple) incubated with CD53+ or CD53– MKs stained with CD53 (green) and CD41 (red). Scale bars, 20 μm. BF, bright field. Images represent 3 independent experiments. (I) Quantification of the percentage of cells phagocytizing E coli particles in CD53+ and CD53– MKs: CD53+CD41+, 219 cells; CD53–CD41+, 267 cells. (J) Representative FACS plot of T-cell proliferation. T cells labeled with carboxyfluorescein succinimidyl ester (CSFE) were cultured with or without 3000 to 5000 CD53+/CD53– MKs for 3 days in the presence of anti-CD3 and anti-CD28 antibody. The upper left quadrant represents the proliferating T cells; numbers in the boxes indicate the percentage of proliferating T cells. Results are representative of 3 independent experiments. (K) Bar graph depicting the percentage of proliferating T cells in total T cells cultured with or without 3000 to 5000 CD53+/CD53– MKs for 3 days in the presence of anti-CD3 or anti-CD28 antibody (n = 3; mean ± SEM; 1-way ANOVA; *P ≤ .05; **P ≤ .01. ****P ≤.0001. n.s., not significant.
Because lung MKs were reported to express greater levels of immune molecules compared with BM MKs as a whole,12,43 we compared the identified BM MK subpopulations with lung MKs. Using the same Smart-seq2 protocol (see “Methods”), lung MKs (CD41+) were obtained by using manual picking and were subjected to scRNA-seq analysis. We analyzed our data after integrating it with recently published scRNA-seq data derived from fetal MK development and adult lung MKs.43,44 By using unsupervised clustering, 4 clusters similar to our adult BM subpopulations were identified, including polyploidization MKs, HSC-niche MKs, platelet-generation MKs, and immune MKs (Figure 5B; supplemental Figure 9A). Although platelet-generation MKs and HSC-niche MKs derived from BM and embryo (human and mouse) were almost evenly distributed in the same cluster (Figure 5B), embryonic and adult HSC-niche MKs may release different cytokines to regulate HSC behavior (supplemental Figure 9B). Interestingly, adult lung MKs were spread out in the immune MK cluster, but fetal lung and adult BM immune MKs (cluster 3) occupied different locations in this cluster (Figure 5B). Specifically, BM immune MKs were preferentially enriched for expression in antigen presentation whereas fetal lung immune MKs exhibited stronger expression in phagocytosis (Figure 5C). These data suggested that cluster 3 inflammation-associated MKs shared significant similarities with lung MKs at the transcriptional level.
In our efforts to examine the cellular characteristics and potential function of this newly identified MK subpopulation (cluster 3), we found that CD41+CD53+ MKs represented ∼5% of total MKs in the BM (supplemental Table 3). Morphologically, cluster 3 MKs had a high nuclear:cytoplasmic ratio and the nuclei were pleomorphic. The cells were either round-oval nuclei or irregular nuclei and polynuclear (Figure 5D). The morphologic feature of cluster 3 cells is distinct from that of monocytes (Figure 5D) and dendritic cells. Cluster 3 cells showed expression of typical MK markers (Itga2b, Pf4, and Vwf) (supplemental Figure 10A), but cluster 3 cells did not express CD319 and CD11b, the typical surface markers of SLAMF7highMPLhigh monocyte and monocyte-derived dendritic cells45 (supplemental Figure 10B). Moreover, cluster 3 cells could proliferate, depending on thrombopoietin cytokines, but lack the ability to form proplatelets (supplemental Figure 11A-D). We further set out to explore the potential function of this MK subpopulation. After mice were stimulated with lipopolysaccharide (LPS) (supplemental Methods), the total MK population was gradually increased in the BM, whereas the platelet number in the peripheral blood was decreased (early) at 30 hours (Figure 5F; supplemental Figure 12A). Interestingly, the proportion of the CD53+ subpopulation in total MKs rapidly increased by twofold within 12 hours and returned to the baseline 30 hours after LPS stimulation (Figure 5E-F). This rapid response was largely in concordance with the significant increases in the number of neutrophils and monocytes (supplemental Figure 12A). We also analyzed gene expression profiles of this CD53+ MK by RNA-seq at different time points (0, 6, and 12 hours) after LPS stimulation. The preexisting PU.1- and IRF-8–associated inflammatory transcriptional program was further enhanced, leading to massive upregulation of gene expression in pathogen recognition, phagocytosis, cell killing, and antigen presentation (Figure 5G; supplemental Figure 12B). In addition, cells in cluster 3 actively express IFNγR1 and IFNγR2 (supplemental Figure 12C), and we observed significant increases in the proportion of CD53+ MKs in the BM, but the total MK population remained constant after IFN-γ stimulation in vivo (supplemental Figure 12D-E).
We tested the capabilities of this cell population in phagocytosis and stimulation of T cells. By using freshly isolated murine primary cells, we found that CD53+ MKs were capable of engulfing and ingesting bacteria particles, whereas CD53– MKs lacked this phagocytic capability (30% vs 1.4%) (Figure 5H-I). Moreover, when cocultured with T cells, CD53+ MKs, but not CD53– MKs, could significantly stimulate T-cell expansion (20% vs 2.81%) (Figure 5J-K). Together, these observations indicate that cluster 3 CD53+ MKs can respond to pathogen-derived agonists and inflammatory stimulation and that in this MK subset, they have a functional role in innate and adaptive immunity.
Discussion
Cellular heterogeneity within MKs remains poorly characterized and understood, mainly because of the technical difficulties of with isolating single MKs. In this study, we developed a strategy to obtain and study native murine and human MKs that spanned a wide range of ploidy and are resident in the BM niche. By combining scRNA-seq analysis, in situ 3D immunofluorescence imaging techniques, and functional assays, we uncovered unprecedented cellular and spatial diversity in MKs. The MK subpopulations we identified were associated with unique functions, including platelet generation, maintenance of the HSC niche, and inflammatory responses. We based our naming of the MK subpopulations identified by scRNA-seq analysis on their transcriptional signature, which was supported by additional evidence, including unique spatial locations and functions in platelet generation and immune regulation. This nomenclature serves as a starting point for more rigorous functional characterization in the future. Remarkably, these transcriptionally distinct groups of MKs were similarly identified in primary human BM MKs.
Our study suggests that megakaryopoiesis may not occur in a stepwise manner, but may instead dynamically adapt to locations in the BM and to biological needs. MKs are known to play critical roles in supporting HSCs in the BM niche.4,6,7 We identified a transcriptionally unique MK subpopulation that expressed high levels of Mylk4 (cluster 2). These MKs also expressed high levels of Cxcl4 and Igf1 (cytokines secreted by MKs) that regulate HSCs and also expressed high levels of cell adhesion and WNT signaling molecules in regulatory pathways integral to MK function within the BM niche.4,6 Analysis of the ligand-receptor interaction revealed a preferential crosstalk between cluster 2 MKs and HSCs that included, for example, IGF1-IGF1R, LRP6-CKLF, whereas other clusters showed no significant interactions with HSCs (supplemental Figure 13A-B). Interestingly, HSC-niche MKs (cluster 2) that expressed a strong signature in cytokine and cell-cell signaling also exhibited low levels of expression of platelet-associated genes (Figure 2C). Together with the observation that a small fraction of HSC-niche MKs were proplatelet-bearing MKs in an ex vivo organelle culture assay (Figure 4F), we postulate that HSC-niche MKs (cluster 2) may have the potential to become platelet-generating MKs (cluster 4), presumably under stress conditions such as emergency bleeding. In BM, cluster 2 MKs were located in closer proximity to HSCs than to other MK subpopulations. The distinct BM distribution is unlikely to be the result of the differences in MK size. Cxcr4 and Lcp1, 2 key genes that mediate the process of MK migration,40,46,47 were expressed at low levels in clusters 1, 2, and 4, but were highly expressed in cluster 3 (supplemental Figure 13C). Because both clusters 2 and 4 consisted of high ploidy MKs, these results were consistent with the finding that large MKs (CD42+) show slow migration velocity,40 whereas cluster 3 cells may have greater ability to migrate in light of their potential involvement in immune response. Taken together, these data provide the foundation for future studies to discover novel aspects of MK and HSC biology.
Emerging evidence demonstrates that MKs sense and respond to inflammatory stress and participate in host immune responses. For example, in vitro–derived human MKs and megakaryocytic cell line Meg-01s expresses toll-like receptors (eg, TLR1, -2, -3, -4, and -6), enabling them to sense invading pathogens, pathogen-derived agonists such as LPS, and damaged cells.8,9,11-13,15,16Tlr2 was specifically detected at low levels in the inflammatory response–associated MKs (cluster 3), whereas lung MKs expressed a significantly higher level (>11-fold) of Tlr2 compared with the basal level of that in BM cluster 3 MKs (supplemental Figure 14A), consistent with the notion that lungs face constant challenges from pathogens. These data suggest that expression of TLRs on immune-related MKs are dynamic and may be adaptive to the tissue microenvironment and pathogen challenges. Under stress conditions, murine MKs express MHC class II genes, canonically thought to be largely present on professional antigen-presenting cells such as dendritic cells, macrophages, and B cells, and CD40L, the ligand for the co-stimulatory molecule CD40 on T cells and B cells. However, whether the expression of these immune-related genes is ubiquitous in the MK lineage or restricted to a subset of MK populations in vivo is unknown. We determined that CD53+ MKs were present in both human and mouse BM, and they expressed high levels of pathogen recognition receptor genes and antimicrobial protein genes. Published studies have shown that MKs provide a reserve for platelet-mediated immunoregulation48 and undergo active megakaryopoiesis to replenish the pool of circulating platelets for emergency thrombopoiesis.49 Our findings extend this published work by showing subpopulations of MKs enriched with genes involved in detecting and clearing invading pathogens.
Our data also support a potential role of MKs in adaptive immunity. Specifically, the CD53+ subpopulation of MKs expressed MHC class II genes (H2-Aa, H2-Ab1, and H2-Eb1), as well as genes involved in key steps of antigen presentation, including phagocytosis and lysosomal degradation. Interestingly, by using a lupus mouse model, a recent study showed that Lin–c-Kit+CD41+ MK progenitors expressed MHC class II molecules and could promote Th17 cell development in vitro in a manner that is at least partially MHC class II dependent.48 These findings, together with our findings, suggest that MKs may serve as antigen-presenting cells through MHC class II molecules, although the exact role of MKs in adaptive immunity warrants additional investigation. Remarkably, cluster 3 inflammation MKs and lung MKs were enriched for immune-related expression signatures and exhibited comparable levels of immune MK markers (Lsp1 and Cd53) and tissue factors (Spi1 and Irf8) (supplemental Figure 14B-C). They were able to respond to pathogen-derived agonists and inflammatory stimulation despite differences in phagocytosis and antigen presentation.43,50 Those immune-related MKs, including BM MKs and lung MKs, may represent a new branch of hematopoiesis.
Recently, several published studies have performed scRNA-seq analyses regarding fetal and adult megakaryocytic development. Although different cell clusters were identified in MKs isolated from adult BM, cellular heterogeneity and functional relevance of those cells were not pursued.43 A recent article explored the cellular heterogeneity of human embryonic MKs from the yolk sac and fetal liver.44 Transcriptionally, they showed similar subpopulations, including thrombopoiesis-biased MKs, immune MKs, and niche-supporting MKs, similar to what we found in the adult BM. However, there were also clearly different transcriptional signatures between embryo and adult MKs. For example, enriched terms in embryonic niche–supporting MKs were mainly related to extracellular structure organization (eg, COL1A1, COL3A1, and COL6A2), whereas our adult HSC-niche MKs were enriched in cell-cell signaling and cytokine genes (eg, Fgf9, Fgf10, Pf4, Igf1, and Cer1), consistent with the more complex adult BM HSC- niche cells.51 The immune MKs in embryos were enriched for phagocytosis as well as antigen processing and presentation, and they expressed the characteristic C1QC macrophage gene. In adult immune MKs, the immune programs seemed more mature and diverse, and they involved innate and adaptive immunity such as pathogen recognition, phagocytosis, cell killing, and antigen presentation. Thus, the heterogeneity of MKs existed in early embryonic hematopoiesis, whereas the distinct location and function of the diverse subpopulations remain to be explored.
In summary, our study provides the first in vivo transcriptomic map demonstrating the rich diversity of murine and human BM MKs. The transcriptional diversity in our studies was associated with unique functions and spatial locations, ploidy, and protein surface markers, thereby allowing for the ex vivo study and in vivo tracing of these cellular subpopulations under both physiological and disease conditions.
Acknowledgments
The authors thank H. Leighton Grimes (University of Cincinnati College of Medicine) for helpful discussions and critical proofreading of the manuscript; Yutian Deng (Beijing Institute of Genomics, Chinese Academy of Sciences [CAS]), Ting Li (Institute of Genetics and Developmental Biology, CAS) and Junying Jia (Institute of Biophysics, CAS) for flow cytometry sorting and analysis, Xiaolan Zhang (Institute of Microbiology, CAS) and Yanli Zhang (Tsinghua University Branch of the China National Center for Protein Sciences Beijing) for assistance with confocal microscopy; Yun Feng (Institute of Biophysics, CAS) for assistance with image analysis; and Hua Qin (Institute of Zoology, CAS) for complete blood count tests.
This work was supported by grants from the National Natural Science Foundation of China (81890992) (Q.-f.W.), the Youth Innovation Promotion Association, CAS (2017142) (Y.L.), the National Natural Science Foundation of China (81770109 and 81970108) (Y.L.), the National Institutes of Health (NIH) National Heart, Lung, and Blood Institute (HL092746 and HL126547) (M.T.R.), the NIH National Institute on Aging (AG048022) (M.T.R), and the K. C. Wong Education Foundation (Q.-f.W.).
Authorship
Contribution: S.S. and C.J. designed and performed the experiments, analyzed the data, and wrote the manuscript; J.S. helped perform the scRNA-seq data analysis; Y. Lei generated the scRNA-seq libraries of human MKs; K.C. helped perform the functional validation experiments; Y.C. helped generate scRNA-seq libraries; Z.L. generated the bulk RNA-seq libraries; J.L., M.Z., and X.Z. provided support for the experiments; F.T. provided support for the experiments and conceptual advice; M.T.R. provided conceptual advice and revised the manuscript; and Y. Li and Q.-f.W. conceived and designed the research, analyzed and interpreted the data, and wrote the manuscript.
Conflict-of-interest disclosure: The authors declare no competing financial interests.
Correspondence: Qian-fei Wang, Beijing Institute of Genomics, Chinese Academy of Sciences, China National Center for Bioinformation, No.1 Beichen West Rd, Chaoyang District, Beijing 100101, China; e-mail: wangqf@big.ac.cn; and Yueying Li, Beijing Institute of Genomics, Chinese Academy of Sciences, China National Center for Bioinformation, No.1 Beichen West Rd, Chaoyang District, Beijing 100101, China; e-mail: liyy@big.ac.cn.
Original data are shared under GSA accession numbers CRA001755 and HRA000114.
The online version of this article contains a data supplement.
There is a Blood Commentary on this article in this issue.
The publication costs of this article were defrayed in part by page charge payment. Therefore, and solely to indicate this fact, this article is hereby marked “advertisement” in accordance with 18 USC section 1734.

This feature is available to Subscribers Only
Sign In or Create an Account Close Modal