

Key Points
Voxelotor therapy reduces sickling and increases hemoglobin, but oxygen delivery to tissues is offset by increased hemoglobin O2 affinity.
Drugs that reduce sickling by increasing HbF or decreasing MCHC should be more effective than drugs that increase O2 affinity.

Abstract
The issue of treating sickle cell disease with drugs that increase hemoglobin oxygen affinity has come to the fore with the US Food and Drug Administration approval in 2019 of voxelotor, the only antisickling drug approved since hydroxyurea in 1998. Voxelotor reduces sickling by increasing the concentration of the nonpolymerizing, high oxygen affinity R (oxy) conformation of hemoglobin S (HbS). Treatment of sickle cell patients with voxelotor increases Hb levels and decreases indicators of hemolysis, but with no indication as yet that it reduces the frequency of pain episodes. In this study, we used the allosteric model of Monod, Wyman, and Changeux to simulate whole-blood oxygen dissociation curves and red cell sickling in the absence and presence of voxelotor under the in vivo conditions of rapid oxygen pressure decreases. Our modeling agrees with results of experiments using a new robust assay, which shows the large, expected decrease in sickling from the drug. The modeling indicates, however, that the increase in oxygen delivery from reduced sickling is largely offset by the increase in oxygen affinity. The net result is that the drug increases overall oxygen delivery only at the very lowest oxygen pressures. However, reduction of sickling mitigates red cell damage and explains the observed decrease in hemolysis. More importantly, our modeling of in vivo oxygen dissociation, sickling, and oxygen delivery suggests that drugs that increase fetal Hb or decrease mean corpuscular hemoglobin concentration (MCHC) should be more therapeutically effective than drugs that increase oxygen affinity.
Introduction
The notion of treating sickle cell disease (SCD) by stabilizing the R (oxy) conformation was introduced by Beutler.1,2 He proposed that converting a fraction of sickle hemoglobin (HbS) to the oxidized form (metHbS) or to the carbon monoxide complex of HbS would reduce sickling by maintaining a fraction of HbS molecules in the nonpolymerizing R conformation of oxyhemoglobin, while understanding that such a treatment would compromise oxygen delivery to the tissues.1,2 (Interestingly, Beutler also introduced the idea of inducing fetal hemoglobin [HbF] synthesis as a therapeutic strategy.1) According to the 2-state allosteric model of Monod, Wyman, and Changeux (MWC) the cooperative oxygen dissociation curve (ODC) for Hb arises from the shift in the equilibrium from the high-affinity oxy (R) conformation to the low-affinity deoxy (T) conformation as the oxygen pressure decreases, thereby facilitating oxygen unloading in the tissues.3,4 Biophysical studies applying the MWC model for analyzing the effect of oxygen on HbS polymerization have shown clearly that only the T conformation can polymerize.5-7 These studies prompted development of small-molecule drugs that preferentially bind to R to shift the T-R conformational equilibrium toward nonpolymerizing R.8-13
In 2019, the US Food and Drug Administration approved the oxygen-affinity–modifying drug voxelotor (previously called GBT440), the only antisickling drug approved since hydroxyurea 23 years ago. Patients treated with voxelotor show small increases in Hb levels (∼1 g/dL) and decreased indicators of hemolysis.14 There is no evidence yet, however, that the drug reduces the incidence of pain episodes or decreases organ damage, outcomes that would be expected if oxygen delivery were improved from decreased sickling. A therapy based on increasing oxygen affinity remains controversial because the resulting left shift in the ODC decreases oxygen delivery in a disease characterized by tissues being deprived of oxygen.15-17 In a recent Perspective in Blood, it was suggested that it would be difficult to determine the net result of 2 opposing effects: decreased oxygen delivery from the left shift in the ODC and increased oxygen delivery as a result of decreased sickling.16 The current report is an attempt to answer this question from calculations of ODCs and sickling in vivo.
Methods
Sickling assay
Blood samples were collected in EDTA from deidentified patients with SCD-HbSS in steady state, in accordance with protocol 18H0146 (registered on www.clinicaltrials.gov, as #NCT03685721) approved by the National Heart, Lung, and Blood Institute Institutional Review Board. Other blood samples were collected under Protocol 03H015 (www.clinicaltrials.gov, #NCT00047996). All blood samples were collected in accordance with the Declaration of Helsinki. The sickling assay measures the time it takes for red blood cells from patients with SCD to distort (“sickle”) after slow deoxygenation at 37°C with nitrogen to 5% oxygen in a humidified chamber of a BioTek Lionheart FX Automated Microscope.18 The cells distort because of HbS polymerization, which produces stiff elongated fibers. Each well of a Greiner polystyrene 384-well plate (part no. 3770) contains a 10-μL cell suspension of cells diluted 1000-fold from whole blood into phosphate-buffered saline solution at pH 7.4 (300 mOsM; 32 mM sodium phosphate [dibasic], 8 mM potassium phosphate [monobasic], 114 mM sodium chloride, 1 mg/mL dextrose, and 1 mg/mL bovine serum albumin). Images of each of the 384 wells were collected every 15 minutes for 12 hours. Deoxygenation to 5% oxygen took ∼3 hours, which was calculated from the time it took for the oxygen, initially at ∼20%, to diffuse away from the cells at the bottom of the wells.18 A previously described machine learning method with several metrics to describe a “sickled” cell, such as lack of a circular shape and loss of a more transparent center, was used to determine the time at which a cell sickled.19 The output of the assay is the fraction of cells sickled vs time. The intracellular Hb concentration for individual red cells was measured with a Siemens Advia2120 Hematology Analyzer, using a program provided by Siemens that converts the measured light-scattering signals to volume and Hb concentration for each red cell.
Fraction of sickled cells vs time curves
The delay time before the formation of sickle fibers is extraordinarily sensitive to intracellular Hb concentration, intracellular Hb composition (%HbS, %HbF, and %HbA2), and the fractional saturation with oxygen. These 3 parameters determine the solubility, which enables the delay time to be calculated from the recently discovered universal relation between delay time and the activity supersaturation (γ0c0/γscs), where c0 is the total Hb concentration in the cell and cs is the solubility that depends on the Hb composition, total Hb concentration, and activity coefficient (γ). The activity coefficients vary between ∼5 and ∼5000 at Hb concentrations between 20 and 50 g/dL.20 The solubility measures the thermodynamic stability of the sickle fibers; it is the total Hb concentration measured in the supernatant after sedimenting the fibers in an ultracentrifuge.21,22 The activity coefficient accounts for the fact that the thermodynamically effective concentration of Hb in red cells is much larger than the measured concentration. These coefficients result from the large excluded volume effects in the crowded solution of a high concentration of the Hb macromolecule.23,24 The delay time is therefore very different for cells of different Hb concentration and is constantly changing as the oxygen pressure decreases. Consequently, the delay time for sickling depends on the rate of decrease in oxygen pressure and is determined from an integral equation given in the supplemental Material (available on the Blood Web site). The physiologically relevant ODC for SCD blood in vivo over a time of seconds is therefore very different from the ODC measured in minutes in the laboratory.
Solubilities can be accurately calculated for cells containing HbF and HbA2 in addition to HbS.6 The inhibitory effects of HbF and HbA2 are the same.25,26 HbA2 is usually 3% to 4% in sickle cell blood, whereas HbF varies considerably from 1% to 25%. In the following, when the %HbA2 is not given, %HbF will represent the sum of %HbF and %HbA2. In calculations of solubility, it is assumed that the α2γ2 HbF homotetramer does not enter the fiber and that the α2γβS HbS/HbF hybrid tetramer does copolymerize weakly (relative probability of 0.1)27,28 instead of not at all, as assumed in Eaton and Hofrichter.6
ODCs
Oxygen dissociation curves for red cell suspensions at 37°C were measured with a Hemox Analyzer (TCS Scientific Corp). Red cells were diluted 50-fold into the phosphate-buffered saline solution described earlier, in “Sickling assay.” The instrument reports fractional saturation with oxygen, assuming that the saturation is 100% in air (∼150 torr oxygen) and 0% at the lowest measured pressure (∼2 torr oxygen), which must be slightly lower and higher, respectively, than the true values. We have previously described in detail how corrections were made to the reported saturation values to bring them closer to the true values.29,30 The time needed to complete an ODC was ∼15 minutes.
The interior of a sickled red cell is a viscous solution, historically referred to as a gel. A gel is a mixture of 2 kinds of Hb molecules (Figure 1A): molecules free in solution with the same ODC as HbA31 and polymerized molecules that have an affinity for oxygen even lower than the solution T conformation.5 Consequently, there are 3 ODCs to be considered for each red blood cell in which the Hb can polymerize (Figure 1B): the ODC for polymerized Hb, the ODC for free Hb molecules in solution, and the ODC for the gel, which is the fraction-polymerized weighted sum of the free, and polymerized, Hb dissociation curves65, where xp is obtained from mass conservation ,32 and cp (69 g/dL) is the concentration of Hb in the polymer phase. ODCs in the presence and absence of voxelotor were calculated at both the slow rate of oxygen pressure decrease of our experimental measurements (time scale of minutes in vitro) and the fast rate of decrease in oxygen that occurs in tissues (time scale in seconds in vivo). Polymerized Hb has a very low oxygen affinity (red curve in Figure 1B), so the in vitro ODC is right shifted compared with the in vivo ODC, because there is much more polymerization at the slow rate of oxygen pressure decrease of the in vitro experiment. See the supplemental Material for the detailed calculation of gel ODCs at both in vitro and in vivo rates of decrease in oxygen pressure, which depend on polymerization kinetics. The whole-blood ODC is the fraction-polymerized weighted average of the curves for the individual cells of different total Hb concentration.
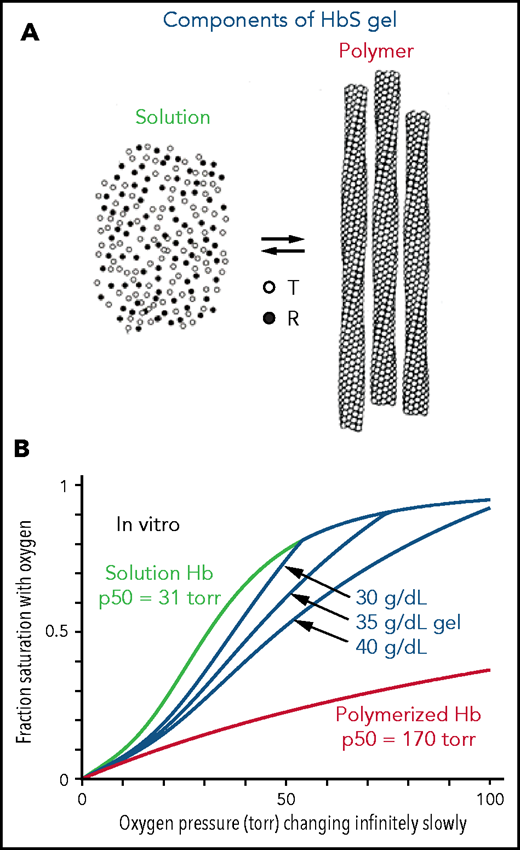
Oxygen dissociation curves in vitro. (A) A gel consists of an equilibrium between Hb molecules free in solution and polymerized Hb. Only the T conformation of hemoglobin can polymerize, whereas the R conformation is excluded at all oxygen pressures.5,6 (B) True equilibrium ODCs are what would be observed if the oxygen pressure were changed infinitely slowly. The equilibrium gel ODC is shown at 3 different total Hb concentrations in a red cell with a Hb composition of 92% HbS, 4%HbF, and 4% HbA2, which is the average composition for 23 sickle cell patients with Hb(F+A2) levels less than 12%. Although the oxygen affinity of HbA and nonpolymerized HbS are identical,31,54 the p50 for sickle red cells is ∼4 torr higher than normal red cells because of the elevated 2,3-DPG in sickle cell disease. The right shift of the gel ODCs relative to the solution curve (green) is related to the presence of low-affinity polymerized Hb (red curve). The T conformation of free Hb in solution has a higher affinity for oxygen (p50 = 130 torr) than polymerized Hb.55
Oxygen dissociation curves in vitro. (A) A gel consists of an equilibrium between Hb molecules free in solution and polymerized Hb. Only the T conformation of hemoglobin can polymerize, whereas the R conformation is excluded at all oxygen pressures.5,6 (B) True equilibrium ODCs are what would be observed if the oxygen pressure were changed infinitely slowly. The equilibrium gel ODC is shown at 3 different total Hb concentrations in a red cell with a Hb composition of 92% HbS, 4%HbF, and 4% HbA2, which is the average composition for 23 sickle cell patients with Hb(F+A2) levels less than 12%. Although the oxygen affinity of HbA and nonpolymerized HbS are identical,31,54 the p50 for sickle red cells is ∼4 torr higher than normal red cells because of the elevated 2,3-DPG in sickle cell disease. The right shift of the gel ODCs relative to the solution curve (green) is related to the presence of low-affinity polymerized Hb (red curve). The T conformation of free Hb in solution has a higher affinity for oxygen (p50 = 130 torr) than polymerized Hb.55
The ODCs shown in Figure 1B are for red cells at single Hb concentrations when polymerization is at equilibrium. True equilibrium ODCs are those that would be obtained if one waited at each oxygen pressure for a sufficient time for the saturation to remain unchanged with time: the definition of equilibrium. The ODC for the gel depends on the total Hb concentration, because more low-affinity polymerized Hb forms as the concentration supersaturation (c0/cs) increases. Oxygen and 2,3-diphosphoglycerate (2,3-DPG) bind and dissociate very rapidly,33-36 so the solution and polymer binding curves measured in the laboratory on the minute time scale are true equilibrium curves. However, because of the delay before fibers form,6,37-40 the gel ODC for each cell depends on the speed of the oxygen pressure decrease. (At 75% saturation with oxygen, for example, where most of the cells are sickled at equilibrium,7 the activity supersaturation is so low [∼1.5] for cells with a total Hb concentration of 32 g/dL that the delay time is ∼1 year.20)
Results
Experiments on inhibition of sickling by voxelotor and structural modeling
Before assessing the impact of voxelotor on in vivo oxygen transport, it is important to consider whether its antisickling effect is due not only to its stabilization of the R quaternary structure and increase in oxygen affinity, but also to possible destabilization of the HbS polymer. Using a carbon monoxide photolysis assay, we previously reported that, at a concentration of voxelotor that produces 40% modification of Hb, the p50 was reduced to less than 20 torr, but there was no inhibition of sickle trait sickling for completely deoxygenated Hb.19 A very important caveat to this experiment is that the sodium dithionite used in the assay to eliminate any residual oxygen could have reduced a fraction of voxelotor from an aldehyde to an alcohol, which would bind much more weakly because of no covalent connection to the protein via a Schiff base linkage. Accordingly, the photolysis experiment does not rule out the possibility that voxelotor inhibits sickling by an additional mechanism, such as interfering with the formation of intermolecular contacts in the fiber. We considered this possibility by inspection of the fiber structure with bound voxelotor (Figure 2). Attaching voxelotor to the α-chain termini of the T conformation at the same position found by X-ray crystallography in the R conformation showed that it is not close enough to interfere with any of the many intermolecular contacts within the sickle fiber, which consists of 100% T conformation (see Figure 4). A caveat to this analysis is the possibility that drug binding to the T conformation induces conformational changes at an intermolecular contact site to weaken it.
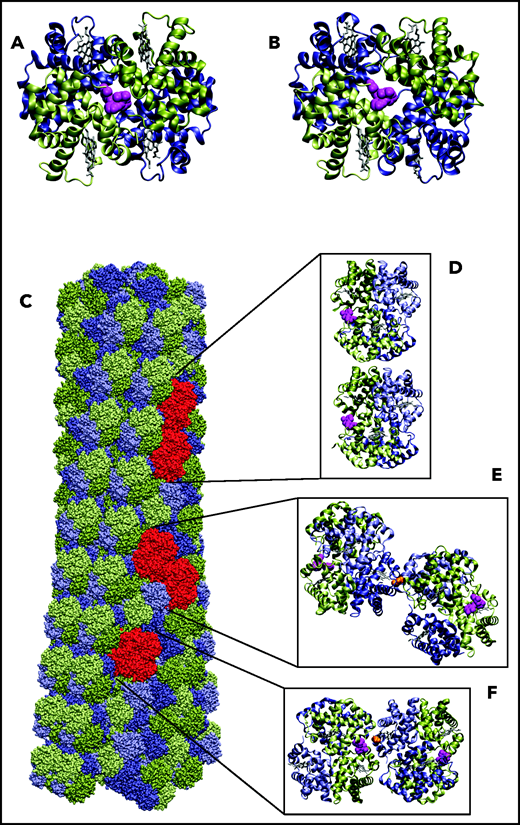
Location of voxelotor in sickle fiber. (A) The X-ray structure of voxelotor bound to the R conformation of Hb shows that the drug is located in a complementary pocket between α chains (green) of the structure (Protein Database; PDB 5E83),56,57 and (B) when modeled using the same conformation as in R, it can easily fit into the pocket of the deoxyHbS structure (T conformation) (PDB 2HBS).58 Hb is shown in a ribbon representation and drug in a magenta, space-filling representation. (C) The HbS fiber structure model is shown in a space-filling representation. It consists of 14 strands, which can be grouped into 7 twinned (doubled) strands59 bridged by axial (D) and lateral (E) contacts, similar to those in the T crystal structure illustrated. The drug is located far from both the canonical axial and equatorial interfaces between Hb tetramers in the twinned strands. It is, however, closer to other possible contacts present in the fiber. Beta6 valine is the orange molecule in panels E and F. (F) The closest approach of the drug to a neighboring tetramer, in which the nearest heavy atom distance between drug and neighbor is still 7.6 Å. Thus, there appear to be no interfaces in the fiber where voxelotor would directly interfere with polymerization.
Location of voxelotor in sickle fiber. (A) The X-ray structure of voxelotor bound to the R conformation of Hb shows that the drug is located in a complementary pocket between α chains (green) of the structure (Protein Database; PDB 5E83),56,57 and (B) when modeled using the same conformation as in R, it can easily fit into the pocket of the deoxyHbS structure (T conformation) (PDB 2HBS).58 Hb is shown in a ribbon representation and drug in a magenta, space-filling representation. (C) The HbS fiber structure model is shown in a space-filling representation. It consists of 14 strands, which can be grouped into 7 twinned (doubled) strands59 bridged by axial (D) and lateral (E) contacts, similar to those in the T crystal structure illustrated. The drug is located far from both the canonical axial and equatorial interfaces between Hb tetramers in the twinned strands. It is, however, closer to other possible contacts present in the fiber. Beta6 valine is the orange molecule in panels E and F. (F) The closest approach of the drug to a neighboring tetramer, in which the nearest heavy atom distance between drug and neighbor is still 7.6 Å. Thus, there appear to be no interfaces in the fiber where voxelotor would directly interfere with polymerization.
To investigate the inhibitory effect of voxelotor on sickling from individuals with SCD, we used our recently developed sickling assay in which nitrogen slowly deoxygenates cells at the bottom of wells of a 384-well plate.18 From the equilibrium constant of 170 mM−1 determined recently for binding voxelotor to Hb in red cells suspended in the same phosphate-buffered saline solution,30 the modification at 3 μM voxelotor of the Hb in the blood of both patients was 30%, close to the average modification of 26% in the clinical trials.14 At these modifications, sickling was highly reduced in patient 1 and eliminated in patient 2 (Figure 3). The large reductions in sickling with this assay are caused by both the increase in the R conformation from drug binding and by the much longer time to reach the final concentration of 5% oxygen caused by the much slower desaturation of the higher affinity Hb with the bound drug, which holds onto oxygen at the bottom of the well, compared with cells in a drug-free buffer.
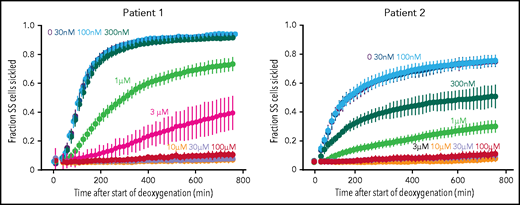
Effect of voxelotor on sickling of SS red cells. Fraction sickled vs time after start of deoxygenation to a final oxygen concentration of 5% in the absence of voxelotor and at various concentrations of voxelotor from 30 nM to 100 μM. The vertical bars represent the standard deviation from the average of 44 images. The Hb composition for patient 1 was (89% HbS, 7% HbF, 3.9% HbA2; Hb = 7.5 g/dL, hematocrit = 22.6%, MCHC = 33.3) and for patient 2 is (76% HbS, 21% HbF, 2.6% HbA2; Hb = 8.4 g/dL, hematocrit = 22.5%, MCHC = 37.2).
Effect of voxelotor on sickling of SS red cells. Fraction sickled vs time after start of deoxygenation to a final oxygen concentration of 5% in the absence of voxelotor and at various concentrations of voxelotor from 30 nM to 100 μM. The vertical bars represent the standard deviation from the average of 44 images. The Hb composition for patient 1 was (89% HbS, 7% HbF, 3.9% HbA2; Hb = 7.5 g/dL, hematocrit = 22.6%, MCHC = 33.3) and for patient 2 is (76% HbS, 21% HbF, 2.6% HbA2; Hb = 8.4 g/dL, hematocrit = 22.5%, MCHC = 37.2).
Modeling of oxygen dissociation, sickling, and oxygen delivery in vivo
Figure 4 shows the calculated ODCs of single SS red cells of different intracellular hemoglobin concentrations in which the oxygen pressure decreases at a rate of 40 torr/s, similar to what occurs in vivo. All 3 ODCs begin at the saturation found for the free Hb molecules, because there is little or no polymer at 100 torr. Because polymerization is complete within a fraction of the delay time,6 it is assumed in the calculation that polymerization is complete immediately after it starts, which causes the sharp break in the curves for 35 and 40 g/dL.41 There is no break at 30 g/dL in Figure 4, which is identical to the solution ODC, given that the activity supersaturation never reached a high enough value for polymerization to occur until after the pressure decrease was complete at 2.5 s. Because cells containing polymerized Hb have a right-shifted ODC and therefore deliver more oxygen, it is interesting to speculate that, were it not for the fact that sickled cells occlude the microcirculation, homozygotes with the sickle cell mutation would have only anemia caused by the hemolytic component resulting from damage to red cells from multiple sickling/unsickling cycles, but no vaso-occlusion.
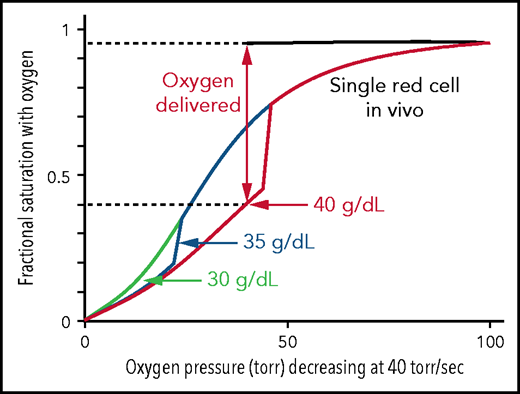
Impact of intracellular Hb concentration on oxygen dissociation curve and delivery of single SS red cells in vivo. Calculated ODCs for single red cells exposed to a linear decrease in oxygen pressure from 100 torr to 0 torr at 40 torr/s, similar to the rate in vivo.43,60,61 For a 40-g/dL cell, after polymerization has occurred there is a large decrease in saturation because of the low affinity of polymerized hemoglobin (p50 = 170 torr) and a concomitant large increase in oxygen delivery. The fraction of oxygen delivered is indicated by the double-headed vertical arrow and the dotted horizontal lines.
Impact of intracellular Hb concentration on oxygen dissociation curve and delivery of single SS red cells in vivo. Calculated ODCs for single red cells exposed to a linear decrease in oxygen pressure from 100 torr to 0 torr at 40 torr/s, similar to the rate in vivo.43,60,61 For a 40-g/dL cell, after polymerization has occurred there is a large decrease in saturation because of the low affinity of polymerized hemoglobin (p50 = 170 torr) and a concomitant large increase in oxygen delivery. The fraction of oxygen delivered is indicated by the double-headed vertical arrow and the dotted horizontal lines.
The major question that we want to address is how much the left shift in the ODC for cells modified with the drug decreases oxygen delivery and how much this decrease offsets the increase in oxygen delivery from decreased sickling. As shown in Figure 4, the in vivo ODC for a single red cell, where oxygen pressure decreased rapidly as it transited the tissues, was significantly different from the in vitro equilibrium ODC (Figure 1B). The in vivo oxygen pressure decrease of 40 torr/s is much too rapid for any current laboratory method to measure the fractional saturation at each oxygen pressure to obtain an ODC. However, both the in vivo ODC and the fraction of SS cells sickled at each oxygen pressure can be simulated with acceptable accuracy. In Figure 5, we show that both measured ODCs and sickling vs time curves for SS cells can be reproduced from our theoretical calculations, albeit at the much slower rates of oxygen pressure decrease of only 10 torr/min. There are 2 differences between the measured and calculated sickling curves. One is the higher fraction sickled at the beginning of deoxygenation, which corresponds to irreversibly sickled cells. Because these cells are distorted when deoxygenation first starts, the machine learning analysis algorithm assigns these cells as sickled, whether or not they contain polymerized Hb. The second is the larger measured standard deviation from patient-to-patient variability compared with the theoretical simulation, which suggests that there are other patient-to-patient differences that we have not considered in addition to Hb composition and intracellular Hb concentration distribution. Nevertheless, these calculations give us confidence that we can calculate at least semiquantitative ODC and sickling curves reliably at the more rapid rate of oxygen pressure decrease in vivo (Figures 6 and 7).
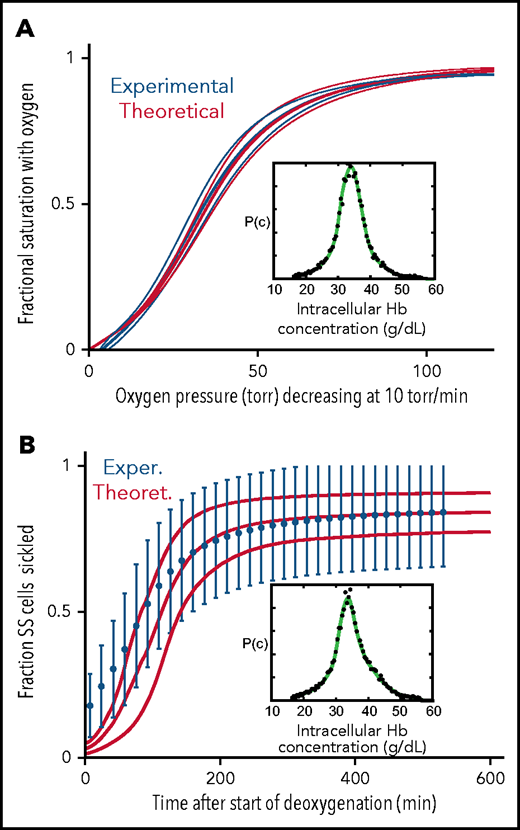
Comparison of experimentally measured and theoretically calculated ODCs and sickling vs pressure curves. (A) ODC. The ODC (thick continuous blue curve) measured with a Hemox Analyzer is the average curve determined for blood from 7 patients with SCD, with a mean Hb composition of 83% HbS, 14% HbF, and 3%HbA2. The insets show the average intracellular Hb concentration distribution (black points) measured for the 7 samples. The thin blue curves show the standard deviation from the mean resulting from patient-to-patient variation. The thick continuous red curve ODC is the theoretically calculated average curve for blood from the 7 patients with the standard deviation from the average indicated by the thin red curves. The inset shows the average intracellular Hb concentration (black points) measured in the 7 samples. (B) Sickling. The blue points are the average measured fraction sickled vs time in 23 patients with SCD, with the sum of the HbF and HbA2 percentages less than 12%; the mean hemoglobin composition is 92% HbS, 4% HbF, and 4% HbA2, with error bars representing the standard deviation from the average resulting from patient-to-patient variation.
Comparison of experimentally measured and theoretically calculated ODCs and sickling vs pressure curves. (A) ODC. The ODC (thick continuous blue curve) measured with a Hemox Analyzer is the average curve determined for blood from 7 patients with SCD, with a mean Hb composition of 83% HbS, 14% HbF, and 3%HbA2. The insets show the average intracellular Hb concentration distribution (black points) measured for the 7 samples. The thin blue curves show the standard deviation from the mean resulting from patient-to-patient variation. The thick continuous red curve ODC is the theoretically calculated average curve for blood from the 7 patients with the standard deviation from the average indicated by the thin red curves. The inset shows the average intracellular Hb concentration (black points) measured in the 7 samples. (B) Sickling. The blue points are the average measured fraction sickled vs time in 23 patients with SCD, with the sum of the HbF and HbA2 percentages less than 12%; the mean hemoglobin composition is 92% HbS, 4% HbF, and 4% HbA2, with error bars representing the standard deviation from the average resulting from patient-to-patient variation.
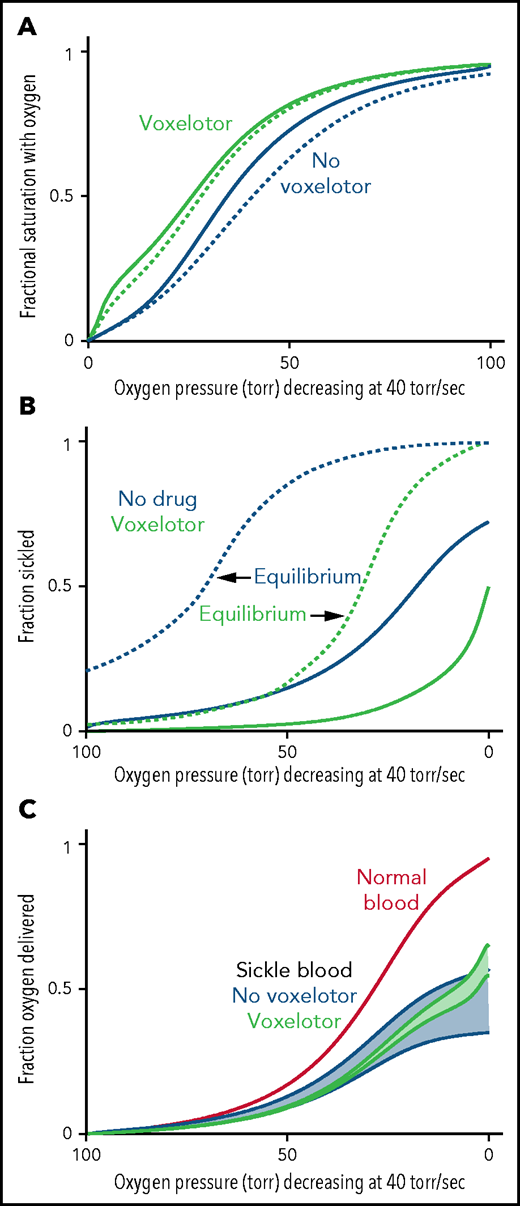
Oxygen delivery with and without voxelotor. (A) ODC. The in vivo whole-blood ODCs at a rate of oxygen pressure decrease of 40 torr/s were calculated in blood samples from 23 patients with SCD, using the solution ODC and the average composition in the legend to Figure 1 and the intracellular concentration distribution given in the inset to Figure 5B. The continuous blue curve is for blood with no drug; the continuous green curve is for blood with 26% of the Hb modified as found for the average modification in the clinical trials14 with reduced sickling (B). The dotted curves would be observed if polymerization were at equilibrium at every oxygen pressure. (B) Sickling. The fraction sickled vs time is calculated for whole blood without (blue) and with (green) voxelotor at a 26% modification of Hb. (C) Oxygen delivery. The fraction of oxygen delivered is calculated in 2 scenarios. The upper continuous blue and green curves correspond to the scenario where all cells contribute to oxygen delivery, whether or not the cells are sickled. The lower blue and green curves correspond to the scenario in which cells deliver oxygen until they sickle. At the sickling pressure and below, they stop delivering. For cells with bound drug, the Hb level is increased from 8.5 to 9.5 g/dL, to account for the increase observed in patients treated with the drug.14 The red curve is the oxygen delivery curve for normal blood (14 g/dL) at the top.
Oxygen delivery with and without voxelotor. (A) ODC. The in vivo whole-blood ODCs at a rate of oxygen pressure decrease of 40 torr/s were calculated in blood samples from 23 patients with SCD, using the solution ODC and the average composition in the legend to Figure 1 and the intracellular concentration distribution given in the inset to Figure 5B. The continuous blue curve is for blood with no drug; the continuous green curve is for blood with 26% of the Hb modified as found for the average modification in the clinical trials14 with reduced sickling (B). The dotted curves would be observed if polymerization were at equilibrium at every oxygen pressure. (B) Sickling. The fraction sickled vs time is calculated for whole blood without (blue) and with (green) voxelotor at a 26% modification of Hb. (C) Oxygen delivery. The fraction of oxygen delivered is calculated in 2 scenarios. The upper continuous blue and green curves correspond to the scenario where all cells contribute to oxygen delivery, whether or not the cells are sickled. The lower blue and green curves correspond to the scenario in which cells deliver oxygen until they sickle. At the sickling pressure and below, they stop delivering. For cells with bound drug, the Hb level is increased from 8.5 to 9.5 g/dL, to account for the increase observed in patients treated with the drug.14 The red curve is the oxygen delivery curve for normal blood (14 g/dL) at the top.
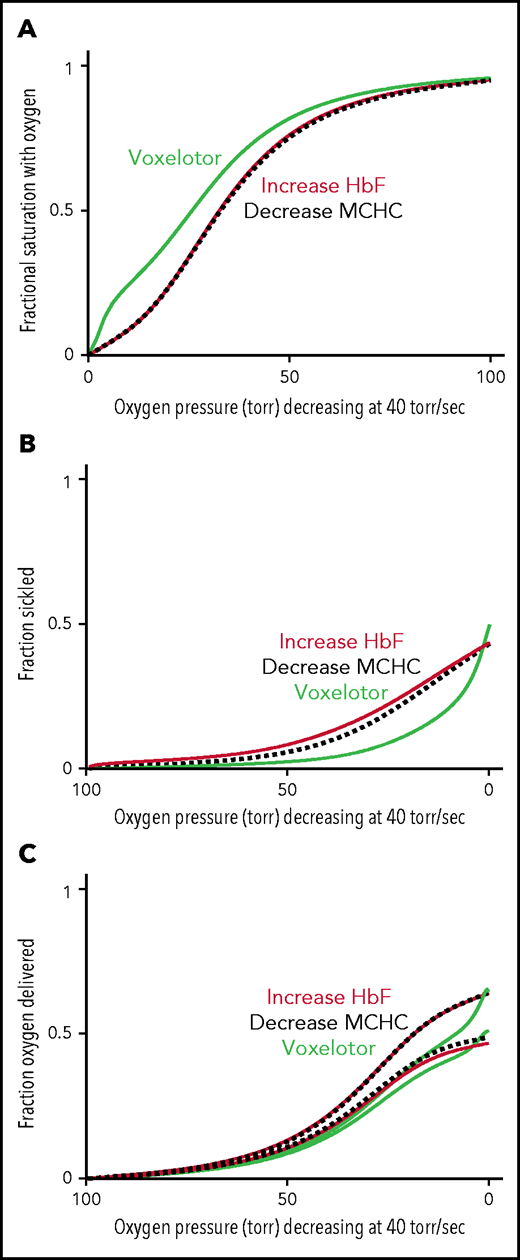
Comparison of oxygen delivery by 3 therapeutic approaches. (A) ODC. The in vivo whole-blood ODCs at a rate of oxygen pressure decrease of 40 torr/s were calculated for blood samples from patients with SCD, by using the solution ODC, the average composition, and the average concentration distribution of the inset in Figure 5B. The continuous green curve is for blood with 26% of the Hb modified, as found for the average modification in the clinical trials.14 The continuous orange curves depict blood where a hypothetical drug has increased HbF from 8% to 35%, a percentage thought to be effectively curative.62 The dashed black curve depicts blood with a decrease in the MCHC by ∼ 10% from 35 to 31 g/dL. (B) Sickling. The fraction of cells sickled vs rapidly decreasing pressure for the 3 therapeutic approaches: (1) voxelotor at a 26% modification (green curve), (2) an increase in Hb F from 8% to 35% (orange curve), and (3) a decrease in MCHC from 35 to 31 g/dL (black dotted curve). (C) Oxygen delivery for all 3 approaches at the same Hb level of 9.5 g/dL. The upper and lower curves for each of the the 3 approaches correspond to the 2 scenarios described previously and in the legend to Figure 6C.
Comparison of oxygen delivery by 3 therapeutic approaches. (A) ODC. The in vivo whole-blood ODCs at a rate of oxygen pressure decrease of 40 torr/s were calculated for blood samples from patients with SCD, by using the solution ODC, the average composition, and the average concentration distribution of the inset in Figure 5B. The continuous green curve is for blood with 26% of the Hb modified, as found for the average modification in the clinical trials.14 The continuous orange curves depict blood where a hypothetical drug has increased HbF from 8% to 35%, a percentage thought to be effectively curative.62 The dashed black curve depicts blood with a decrease in the MCHC by ∼ 10% from 35 to 31 g/dL. (B) Sickling. The fraction of cells sickled vs rapidly decreasing pressure for the 3 therapeutic approaches: (1) voxelotor at a 26% modification (green curve), (2) an increase in Hb F from 8% to 35% (orange curve), and (3) a decrease in MCHC from 35 to 31 g/dL (black dotted curve). (C) Oxygen delivery for all 3 approaches at the same Hb level of 9.5 g/dL. The upper and lower curves for each of the the 3 approaches correspond to the 2 scenarios described previously and in the legend to Figure 6C.
Figure 6 summarizes the effect of voxelotor on oxygen delivery. Figure 6A shows the calculated, physiologically relevant, whole-blood ODCs, with and without voxelotor with rapidly decreasing oxygen pressure, as occurs in vivo. The calculation uses the same average Hb composition as that of the 23 patients with SCD and the intracellular Hb concentration distribution in the inset in Figure 5B. Because there is a continuous range of intracellular Hb concentrations between 25 and 50 g/dL in sickle cell blood, there is no sharp break in the ODCs when sickling occurs, as observed at a single Hb concentration in Figure 4. The ODC in the presence of voxelotor was calculated for 26% of the Hb modified, as in the phase 3 clinical trials at 1500-mg doses.14 Because of the large increase in the percentage of molecules in the high-affinity R conformation, there is a large left shift of the ODC in the presence of the drug. In both the presence and absence of the drug, the ODC is left shifted relative to the equilibrium curve, because there is less polymerized Hb at each oxygen pressure related to the delay in fiber formation. The difference between the in vivo and equilibrium ODC is less in the presence of the drug, because of the reduced fraction of the polymerized T conformation at each oxygen pressure.
Oxygen delivery in a tissue is measured by the difference between the oxygen saturation at arterial blood oxygen pressure and the saturation at the tissue oxygen pressure.15 Consequently, one would conclude that oxygen delivery is far less for drug-treated red cells than for untreated red cells. However, sickling in drug-treated red cells is markedly reduced at every oxygen pressure (Figure 6B), which can improve oxygen delivery by reducing vaso-occlusion. Note that if polymerization were at equilibrium, a much greater fraction of cells would be sickled at each oxygen pressure. (This result is the basis for the conclusion that the delay time before fiber formation allows for most cells to escape the microcirculation [no-drug curve in Figure 6B], and enables patients to survive the disease.37,42) There is no straightforward way to quantitatively evaluate the overall effect of the drug on oxygen delivery with these 2 opposing effects, so we present 2 extreme scenarios, taking into account the increase in Hb levels of ∼1 g/dL (8.5-9.5 g/dL) in drug-treated patients. In the first scenario, all cells deliver oxygen, and oxygen delivery is determined by comparing the fractional saturation with oxygen at lung and tissue pressures for the calculated in vivo ODC, whether cells are sickled or not. In the second scenario, cells stop delivering oxygen at the pressure at which sickling occurs, effectively reducing the Hb levels at these and lower pressures. We expect that a realistic description lies somewhere in the shaded regions in Figure 6C, intermediate between these 2 extreme scenarios. Hebbel and Hedlund have already pointed out from a simpler model without considering kinetics that voxelotor may result in decreased oxygen delivery from the increase in the non–oxygen-delivering R conformation, and they cautioned about compromising cerebral oxygen delivery.17
The comparison in Figure 6 immediately raises the question of comparing oxygen delivery with voxelotor treatment with 2 approaches that reduce sickling without changing oxygen affinity. Figure 7 compares our predictions for the impact of a very rapid (in vivo) decrease in oxygen pressure on ODCs, sickling, and fraction of oxygen delivered for the 3 antisickling approaches at the same Hb levels. Even though sickling is reduced much more by voxelotor than by increasing HbF to 35% or decreasing the mean corpuscular hemoglobin concentration (MCHC) by 10% (Figure 7B), both approaches deliver more oxygen than voxelotor treatment at tissue oxygen pressures >20 torr (Figure 7C).
Discussion
In this work, we took advantage of our understanding of polymerization kinetics and how oxygen pressure controls HbS polymerization.6,7,37 We predict when cells sickle in the tissues and how much oxygen is delivered during the in vivo oxygen pressure decrease that occurs in a few seconds as red cells pass through the tissues, except for the sinusoidal circulation of the spleen, liver, and bone marrow, where red cell transit is slower.43 The calculations enabled us to evaluate the clinically relevant positive and negative effects on oxygen delivery of decreased sickling and a left-shifted ODC, respectively, on patients taking the drug.12,16,44 Our prediction of a lack of increased oxygen delivery with voxelotor therapy was previously addressed by Hebbel and Hedlund, though they did not include the important influence of polymerization kinetics and the rapid oxygen pressure decrease that occurs in vivo.17 Throughout the past century, ODCs of normal red cells, measured in the laboratory on a time scale of minutes, have been used to draw sound physiological conclusions.15,33,34,45 However, this is not possible with sickle blood because of the influence of HbS polymerization kinetics.6,37-39
Four new experimental and theoretical results on oxygen dissociation and sickling reported are reported herein. (1) Oxygen transport in SCD depends importantly on the kinetics of HbS polymerization, as red cells rapidly pass through the tissues; the in vivo ODC is very different from that measured in the laboratory (Figures 1B and 4). (2) Using a recently developed robust assay the expected marked reduction in sickling of SS cells by voxelotor at the Hb modifications found in clinical trials is confirmed (Figure 3). (3) Voxelotor binds at a site on the Hb molecule that does not interfere with intermolecular contact formation in the sickle fiber (Figure 2). (4) ODCs and sickling curves for patients with homozygous SCD are reasonably well simulated from theoretical calculations (Figure 5), but the patient-to-patient variation is not well reproduced by the calculations, suggesting that factors in addition to Hb composition and intracellular concentration play a role in sickling. Our most important results, however, focus on the question of the effect of voxelotor on in vivo oxygen delivery (Figure 6). We also compared oxygen delivery by voxelotor with oxygen delivery by 2 other antipolymerization mechanisms: increasing HbF and decreasing MCHC (Figure 7).
The theoretical simulations in Figure 6 show that, despite the markedly reduced sickling produced by voxelotor (Figure 6B), which should increase oxygen delivery to the tissues, apart from the very lowest oxygen pressures, this increase is largely offset by the left shift in the ODC, even taking into account increased Hb levels in drug-treated patients. Although there are no comprehensive data on tissue oxygen pressures in humans, from what is known, oxygen pressures in the tissues at rest are more than 20 torr and are more than 30 torr in most tissues.43,46,47 Consequently, if improved oxygen delivery is a major factor in reducing the frequency of pain episodes by an antisickling drug, our prediction is that voxelotor can be only marginally effective. Decreased sickling frequency will reduce cell damage from multiple sickling/unsickling cycles, which accounts for the observed decrease in hemolysis and anemia and may result in less chronic organ damage. A potential caveat with our analysis is that, apart from the intracellular Hb concentration, we did not consider other sources of red cell heterogeneity that affect oxygen affinity and polymerization, such as differences among cells in the concentration of 2,3-DPG48 and fractional distribution of HbF.49 However, heterogeneity in these parameters is not nearly as important as heterogeneity in intracellular Hb concentration for determining polymerization, which we considered, so ignoring them is unlikely to affect our conclusions.
In Figure 7, we compared oxygen delivery of voxelotor with drugs that reduce polymerization and sickling by 2 other known mechanisms: increasing HbF to 35% and decreasing intracellular Hb concentration by 10% by increasing red cell volume.16,19 In both cases, the inhibitory effect results from the enormous sensitivity of the delay time before sickle fiber formation on HbS concentration.16 The negative effect on oxygen delivery from the left shift in the ODC by voxelotor is so great that drugs, which decrease MCHC or increase HbF (supplemental Figure 1), are likely to increase oxygen delivery relatively more than voxelotor, irrespective of whether sickled cells deliver oxygen (Figure 7C).
We acknowledge that red cell heterogeneity plays a critical role in the pathophysiology of SCD and that our experimental results and modeling encompass only the primary determinants of intracellular HbS polymerization. Nevertheless, the result of the experiments and calculations presented herein cast doubt on a strategy of drug binding to the R conformation as a way of treating sickle cell disease, especially if the drug dissociates slowly.50 Efforts aimed at developing a drug that targets polymerization should focus on the 4 other approaches: increasing HbF, decreasing MCHC, decreasing 2,3-DPG, and blocking intermolecular contacts within the sickle fiber.16 Even though decreasing 2,3-DPG increases oxygen affinity, the left shift in the ODC is considerably less because, unlike voxelotor, it binds and dissociates rapidly51 (supplemental Figure 2).
After all of our calculations were completed and the original manuscript submitted, we became aware of the results of the extension of the phase 3 clinical trial from 24 to 72 weeks reported by Howard et al,52 a trial supported by Global Therapeutics, the producer of voxelotor. Although the drug increased hemoglobin levels via amelioration of hemolysis, there was no reduction in painful episodes except in a small fraction of patients with SCD with hemoglobin levels >12 g/dL. Moreover, in a commentary in Lancet Haemotology, Inusa et al paint a less positive picture and raise doubts about the usefulness of this drug, an assessment that is consistent with the predictions of our calculations.53
We conclude that the improvement in hemoglobin levels of patients treated with voxelotor is misleading, owing to the presence of nonfunctional hemoglobin comparable to that encountered in individuals with erythrocytosis due to to inheritance of mutant hemoglobins of similarly high oxygen affinity.15 Our experimental and modeling data suggest that under in vivo conditions that include rates of blood flow in the microcirculation, the reduced sickling by this drug is predicted not to reduce the frequency of pain episodes, because it reduces oxygen delivery by increasing oxygen affinity. However, the long-term effects of reduced hemolysis from less sickling should be beneficial.
Acknowledgments
The authors thank John M. Higgins for helpful comments on the manuscript.
This work was supported by the Intramural Research Program of the National Institutes of Health (NIH), National Institute of Diabetes and Digestive and Kidney Diseases, and the NIH, National Heart, Lung, and Blood Institute.
Authorship
Contribution: W.A.E. directed the research; E.R.H. developed the image analysis algorithm for determining sickling times, developed theoretical models, and performed all calculations and simulations; R.B.B. built structural models of the HbS fiber in complex with voxelotor; J.H. and K.E.G. measured the oxygen dissociation curves; B.M., Q.L., T.C., and E.B.D. measured sickling curves; S.L.T. and A.C. recruited the patients with sickle cell disease; and W.A.E., E.R.H., H.F.B., and S.L.T wrote the manuscript.
Conflict-of-interest disclosure: The authors declare no competing financial interests.
Correspondence: William A. Eaton, Laboratory of Chemical Physics, National Institute of Diabetes and Digestive and Kidney Diseases, National Institutes of Health, Building 5, Room 104, 9000 Rockville Pike, Bethesda, MD 20892-0520; e-mail: eaton@nih.gov; Eric R. Henry, Laboratory of Chemical Physics, National Institute of Diabetes and Digestive and Kidney Diseases, National Institutes of Health, Building 5, Room 104, 9000 Rockville Pike, Bethesda, MD 20892-0520; erich@niddk.nih.gov; H. Franklin Bunn, Medicine/Hematology, Brigham and Women’s Hospital, 75 Francis St, Boston MA 02115; e-mail: hfrankbunn@gmail.com; and Swee Lay Thein, Sickle Cell Branch, National Heart Lung and Blood Institute, National Institutes of Health, Building 31, 31 Center Dr, Bethesda, MD 20892; e-mail: sweelay.thein@nih.gov.
Original data are available by e-mail request to the corresponding authors.
The online version of this article contains a data supplement.
There is a Blood Commentary on this article in this issue.
The publication costs of this article were defrayed in part by page charge payment. Therefore, and solely to indicate this fact, this article is hereby marked “advertisement” in accordance with 18 USC section 1734.

Comments
Response to Henry et. al.
The recent publication by Henry et al.(1) aims to better quantify the impact of the clinically approved R-state stabilizer voxelotor on oxygen tissue delivery. The authors conclude voxelotor decreases oxygen delivery to most tissues and interpret this finding to cast doubt on the therapeutic potential of R-state stabilizers. While we agree with the basic premise that R-state stabilizers reduce the fraction of hemoglobin delivering oxygen to tissue by virtue of effectively increasing hemoglobin oxygen affinity and left-shifting the ODC, we have concerns with certain aspects of the approach and whether the results truly support the suggestion that R-state stabilizers should be avoided in future drug development.
It is uncertain whether the model provides sufficient evidence to cast doubt on the therapeutic potential of R-state stabilizers in light of current clinical data. Data from the voxelotor clinical trials indicates a sufficient therapeutic window between efficacious coverage and levels of coverage that induce a problematic decrease in oxygen delivery. In the phase 3 trial of voxelotor, a 1500 mg once daily dose resulted in a mean increase in hemoglobin of 1.1 g/dL at week 24 relative to baseline, with a mean hemoglobin occupancy of 26.5%. Markers of hemolysis, including reticulocytes and bilirubin, had larger decreases in the 1500 mg group than placebo, relative to baseline(2). While p20/p50 was not reported in the phase 3 trial, in the phase 1/2 study, after 28 days of dosing, the p50 of the placebo group was 34.3 mmHg, consistent with elevated p50 expected of SCD patients, while the p50 of patients dosed with 1000 mg daily of voxelotor was 28 mmHg, which falls in the normal adult range3. In the voxelotor phase 3 trial, patients receiving 1500 mg daily experienced a decrease in absolute reticulocyte count that was maintained for the duration of dosing(2). In addition, in the phase 3 study, treatment with voxelotor did not result in a significant increase in erythropoetin, even at hemoglobin occupancies approaching 50%2. Neither the decreased reticulocyte count nor unchanged erythropoietin are consistent with treatment-mediated tissue hypoxia. Although at a lower dose, in the phase 1/2 trial, patients dosed with 700 or 900 mg of voxelotor had no significant differences in peak exercise oxygen uptake, ventilitory threshold oxygen uptake, heart rate, or erythropoetin, relative to placebo(3). Importantly, there were also no reports of hypoxia-related adverse events in any groups treated with voxelotor(2). These data would suggest that the hemoglobin occupancies reached by voxelotor, including the relatively high occupancies reached in a subset of patients, do not have a deleterious impact on tissue oxygenation or cardiac output. However, as no patients to date have reached hemoglobin occupancies greater than 50%, there is still potential for the effects described by Henry et al. to appear when extremely high occupancies are achieved.
As stated by Henry et. al, there was an observed decrease in occurrence of VOC in patients who achieved the highest hemoglobin levels (≥ 12 g/dL)(2). The association of higher hemoglobin with decreased occurrence of VOC is consistent with previous reports of the effects of hemoglobin carbamylation, which functions by a similar mechanism, where a 2 g/dL increase in hemoglobin resulted in an 80% decrease in VOC events(4). Patients dosed with voxelotor who achieved at least a 1 g/dL increase in hemoglobin also showed improvement in healing of leg ulcers, with patients who achieved larger hemoglobin increases showing total or near-total resolution of ulcerations(5). A similar observation was made with hemoglobin carbamylation, in which patients with robust hemoglobin increases experienced total healing of leg ulcers(4). The available clinical data do not support the suggestion that the modulation of oxygen affinity has limited clinical benefit outside of resolution of hemolytic anemia, but in fact suggest that reducing hemolysis has significant downstream impacts on SCD pathology including decreasing VOCs, one of the most important therapeutic endpoints in terms of improving patient quality of life.
In the comparison of the three different mechanisms of sickling protection, voxelotor R-state stabilization, HbF induction, and decreased MCHC, there were inconsistencies between the model results and clinical data and the mechanisms were erroneously compared at equivalent hemoglobin levels. According to the modeling, 35% HbF provided far less sickling protection than 26% voxelotor treatment, which is in disagreement with clinical data where voxelotor treated patients continue to experience VOCs with only a 1 g/dL increase in hemoglobin while patients with 35% HbF are essentially asymptomatic with a 4.2 g/dL increase in hemoglobin levels compared to the average of SCD patients(6). This would seem to suggest the model does not accurately capture the protective effect of HbF, possibly driven by assumptions of the polymerization potential of HbF hetero- and homo-tetramers. Other groups have suggested HbF/HbS heterotetramers contribute negligibly to polymerization based on experimental measures of HbF incorporation in polymers(7). If a single HbF subunit is sufficient to protect hemoglobin from polymerizing, only 14% HbF, which results in 26% tetramers with at least one HbF subunit, would be expected to give equivalent protection as 26% voxelotor coverage, a level of HbF that is not associated with decreased VOCs(8). Understanding the relative anti-sickling protection of voxelotor and HbF is critical to decipher whether and to what degree the lack of complete efficacy observed in 1500 mg voxelotor treated patients can be explained by insufficient hemoglobin modification. Additionally, clinical data suggests an association between sickling protection and increased RBC density and therefore hemoglobin level. The mechanisms were compared at different levels of sickling protection while using the same hemoglobin level for each mechanism, leading to underestimation of oxygen delivery for more protective mechanisms. A more informative approach would be to compare the mechanisms at equivalent levels of sickling protection to enable direct comparison, an approach that is accomplished by modulating either voxelotor coverage or HbF expression.
While the type of model described by Henry et al. has the potential to provide mechanistic insights and better quantification of the efficacy and therapeutic window for multiple mechanisms to treat sickle cell disease, in its current version key model findings do not seem to align with clinical data. It is therefore premature to draw broad conclusions about which mechanisms may or may not provide sufficient therapeutic potential or are most deserving of pharmaceutical investment.
References:
1. Henry, E., Metaferia, B., Li, Q., Harper, J., et al. Treatment of sickle cell disease by increasing oxygen affinity of hemoglobin. Blood. 2021; 138 (13):1172-1181
2. Vichinsky E, Hoppe CC, Ataga KI, et al. A phase 3 randomized trial of voxelotor in sickle cell disease. N Engl J Med. 2019; 381:509-519
3. Howard J, Hemmaway CJ, Telfer P, et al. A phase 1/2 ascending dose study and open-label extension study of voxelotor in patients with sickle cell disease. Blood. 2019; 133(17):1865-1875
4. Deiderich DA, Trueworthy RC, Gill P, Cader AM, Larsen WE. Hematologic and clinical responses in patients with sickle cell anemia after chronic extracorporeal red cell carbamylation. J Clin Investig. 1976; 58(3):642-653
5. Minniti, CP, Knight-Madden, J, Tonda, M, Lehrer-Graiwer, J, Biemond, BJ. The impact of Voxelotor treatment on leg ulcers in patients with SCD: Analysis of the phase 3 HOPE study. Presented at Annual Sickle Cell Disease and Thalassemia Conference (ASCAT), October 21-23, 2019, London UK.
6. Ngo DA, Aygun B, Akinsheye I, et al. Fetal haemoglobin levels and haematological characteristics of compound heterozygotes for haemoglobin S and deletional hereditary persistence of fetal haemoglobin. Br J Haematol. 2012; 156(2):259-64.
7. Sunshine HR, Hofrichter J, Eaton WA. Gelation of sickle cell hemoglobin in mixtures with normal adult and fetal hemoglobins. J Mol Biol. 1979;133(4):435-67
8. Powars DR, Weiss JN, Chan LS, Schroeder WA. Is there a threshold level of fetal hemoglobin that ameliorates morbidity in sickle cell anemia? Blood. 1984;63(4):921-6
9. Dunn JOC, Mythen MG, Grocott MP. Physiology of oxygen transport. BJA Educ. 2016; 16(10):341-348