

Key Points
Hemolysis induces IFN-I in liver monocyte/macrophages primarily through TBK1/IKKε, increasing plasma IFN-α levels in SCD.
Heme-driven IFN-I promotes CMo recruitment and differentiation in SCD liver, enhancing antibody-mediated erythrophagocytosis.

Abstract
Patients with sickle cell disease (SCD) suffer from intravascular hemolysis-associated vascular injury and tissue damage. Classical monocytes (CMo), which are the most abundant of circulating monocytes, are activated in SCD, but the cause and consequences of activation remain incompletely understood. We found a positive correlation between total plasma heme levels and circulating interferon-α (IFN-α) in patients with SCD along with upregulation of the type I IFN (IFN-I) inducible genes in sort-purified SCD patients’ CMo by transcriptome analysis. We demonstrated that hemolysis led to IFN-I expression, predominantly by mouse liver monocyte and macrophages (Mⲫ), primarily through Tank kinase binding 1 (TBK1)/IκB kinase-ε (IKKε) but not TLR4. In response to hemolysis-induced IFN-I, mouse CMo migrated to the liver and differentiated into monocyte-derived Mⲫ, increasing their numbers by sixfold with acute hemin treatment. Hemolysis-driven IFN-I activity also led to the induction of Fc receptor CD64 expression on monocyte and Mⲫ populations, enhancing alloantibody-mediated erythrophagocytosis in SCD both in vivo in mice and in in vitro human cultures. Altogether, these data demonstrate IFN-I response to hemolysis as a novel activation pathway in monocytes and Mⲫ in SCD, opening the possibility for development of IFN-I-based diagnostics and therapeutics against alloantibody-mediated erythrophagocytosis.
Introduction
Patients with sickle cell disease (SCD) suffer from intravascular hemolysis in which released hemoglobin and its byproduct heme can cause oxidative damage and an inflammatory cascade.1-4 Classical monocytes (CMo), which comprise the majority of circulating monocytes, are activated and increased in numbers in SCD.5,6 Similarly, levels of chemokine (C-C motif) ligand 2 (CCL2), which induce mobilization of CMo from the bone marrow (BM) into the bloodstream and recruitment to organs are elevated in SCD.7-10 However, the exact mechanisms driving increases in CMo and CCL2 are not fully known. Interestingly, elevated levels of plasma type I interferon (IFN-I)11 along with increased levels of IFN-I inducible gene transcripts in peripheral blood mononuclear cells,12,13 neutrophils,11 and, more recently, CD14+ monocytes,14 have been reported in SCD patients. IFN-Is can induce CMo tissue migration through upregulation of CCL2 and modulate monocyte activation.15,16 We hypothesized that IFN-I induction in SCD is responsible for increased monocyte tissue recruitment and activation, in particular erythrophagocytosis. Given that CMo numbers positively correlate with levels of hemolysis in SCD,7 we further tested the potential role of hemolysis in IFN-I induction as a novel mechanism of inflammation response in SCD.
Methods
Detailed experimental procedures are outlined in supplemental data on the Blood Web site. Briefly, sort-purified DAPI−CD45+HLA-DR+CD14+CD16− CMo from healthy donors (HD) or SCD patients were analyzed by RNA sequencing (RNA-Seq). Plasma IFN-α levels were measured using ELISA.
For IFN-I induction in vivo, mice were injected IV with freshly prepared hemin (35 μmol/kg body weight) or phosphate-buffered saline (PBS) as a control. In some experiments, mice were pretreated intraperitonially with amlexanox (Tank kinase binding 1/IκB kinase-ε [TBK1/IKKε] inhibitor, 50 mg/kg body weight) 3 hours before hemin injection. For in vitro erythrophagocytosis studies, purified RhD+ human red blood cells (RBCs) were labeled with carboxyfluorescein diacetate succinimidyl ester (CFSE), coated with anti-D antibody, and cocultured with purified HD or SCD CD14+ monocytes with or without recombinant human IFN-α. Phagocytosis of CFSE+ RBCs by monocytes was measured using flow cytometry. For in vivo studies, mice were transfused with CFSE-labeled freshly drawn leukoreduced RBCs from transgenic mice expressing human GPA (hGPA) along with anti-hGPA (NaM10-6G4) or isotype control antibody. CFSE+ RBC frequencies were measured at day 1 and compared with day 0 (2 minutes) posttransfusion by flow cytometry.
Results
Hemolysis induces IFN-I activation in SCD
In agreement with previously reported upregulation of transcripts of IFN-I signaling pathway in bead-purified CD14+ monocyte from SCD patients,14 our RNA-Seq analysis identified a cluster of genes (IFI44l, SIGLEC1, GBP1, BATF2, IFIT2, IFIT1) belonging to IFN-I activation pathway among the top 50 differentially expressed genes (supplemental Figure 1A) between sort-purified DAPI−CD45+HLA-DR+CD14hiCD16− CMo from chronically transfused SCD patients at steady-state (n = 13; supplemental Table 1 for patient clinical characteristics) and race-matched HD (n = 6). Furthermore, we found 14 critical IFN-I inducible genes (IFI44, IFI44L, Mx1, Mx2, LY6E, EPSTI1, RSAD2, IFI6, OAS3, IFIT1, IFIT3, HERC5, ISG15, and SIGLEC1)17-20 including 5 genes (IFI44, IFI44L, LY6E, EPSTI1, and SIGLEC1) that had not been described as upregulated in SCD CD14+ monocytes,14 also increased in SCD CMo relative to HD CMo (Figure 1A; P < .05). Most of these differentially expressed genes remained significant (10 of 14) after inclusion of 26 additional publicly available HD CMo RNA-Seq data extracted from a Gene Expression Omnibus database (GSE149050) (supplemental Figure 1B). No transcripts encoding IFN-α/β were detected in CMo, consistent with previous analysis of other SCD peripheral blood cells.12,14 Higher levels of circulating IFN-α were detected in SCD patients compared with HD (Figure 1B; 3.7-fold, P = .0007; supplemental Table 1), in agreement with previous reports,11 and in Townes mouse model of SCD (sickle mice) compared with control (Figure 1C; twofold difference, P = .02). We did not detect any difference in circulating IFN-α levels between nontransfused and transfused SCD patients or between alloimmunized and nonalloimmunized SCD patients (supplemental Figure 1C-D).

IFN-I can be induced by hemolysis. (A) Fold change in 14 IFN-I inducible genes as determined by RNA-Seq (IFI44, IFI44L, Mx1, Mx2, LY6E, EPSTI1, RSAD2, IFI6, OAS3, IFIT1, IFIT3, HERC5, ISG15, and SIGLEC1) in SCD CMo (n = 13) relative to HD CMo (n = 6). (B) Plasma IFN-α levels in HD (n = 19) and SCD patients at steady state on a chronic transfusion protocol (n = 36). (C) Plasma IFN-α levels in control and sickle mice (n = 5-6). (D) Scatter plot analysis showing correlation relationship between plasma IFN-α levels and plasma total heme levels in patients with SCD (n = 36 as in panel B). (E) Plasma IFN-α levels in WT mice at 20 hours after IV injection with PBS as control (200 µL/20 g body weight), water (300 µL/20 g body weight), RBC lysate (17.5 µmol hemoglobin/kg body weight in 200 µL), hemoglobin (17.5 µmol/kg body weight in 200 µL), or hemin (17.5 µmol/kg body weight in 200 µL) (n = 4-8). (F) Plasma IFN-β levels in WT mice at 20 hours after IV injection with PBS as control (200 µL/20 g body weight), or hemin (35 µmol/kg body weight in 200 µL) (n = 3-5). (G) Plasma IFN-α levels in WT mice at 20 hours after IV injection with hemin at doses of 0, 4.4, 8.8, 17.5, or 35 µmol/kg body weight all in 200 µL (n = 3-10). (H) Plasma IFN-α levels in WT mice at time point of 0, 2, 6, 20, and 72 hours after IV injection with hemin (35 µmol/kg body weight in 200 µL) (n = 3-7). Data represent mean ± SEM; means were compared using 2-tailed Student t test. *P < .05.
IFN-I can be induced by hemolysis. (A) Fold change in 14 IFN-I inducible genes as determined by RNA-Seq (IFI44, IFI44L, Mx1, Mx2, LY6E, EPSTI1, RSAD2, IFI6, OAS3, IFIT1, IFIT3, HERC5, ISG15, and SIGLEC1) in SCD CMo (n = 13) relative to HD CMo (n = 6). (B) Plasma IFN-α levels in HD (n = 19) and SCD patients at steady state on a chronic transfusion protocol (n = 36). (C) Plasma IFN-α levels in control and sickle mice (n = 5-6). (D) Scatter plot analysis showing correlation relationship between plasma IFN-α levels and plasma total heme levels in patients with SCD (n = 36 as in panel B). (E) Plasma IFN-α levels in WT mice at 20 hours after IV injection with PBS as control (200 µL/20 g body weight), water (300 µL/20 g body weight), RBC lysate (17.5 µmol hemoglobin/kg body weight in 200 µL), hemoglobin (17.5 µmol/kg body weight in 200 µL), or hemin (17.5 µmol/kg body weight in 200 µL) (n = 4-8). (F) Plasma IFN-β levels in WT mice at 20 hours after IV injection with PBS as control (200 µL/20 g body weight), or hemin (35 µmol/kg body weight in 200 µL) (n = 3-5). (G) Plasma IFN-α levels in WT mice at 20 hours after IV injection with hemin at doses of 0, 4.4, 8.8, 17.5, or 35 µmol/kg body weight all in 200 µL (n = 3-10). (H) Plasma IFN-α levels in WT mice at time point of 0, 2, 6, 20, and 72 hours after IV injection with hemin (35 µmol/kg body weight in 200 µL) (n = 3-7). Data represent mean ± SEM; means were compared using 2-tailed Student t test. *P < .05.
We next examined the mechanism for IFN-I upregulation in SCD. Because hemolysis is a hallmark of SCD,4 we first performed correlation studies between total plasma heme and circulating IFN-α levels. Circulating heme and IFN-α levels were positively correlated in both transfused (Figure 1D; R = 0.69, P < .001) and nontransfused SCD patients (R = 0.7, P < .05). Plasma IFN-α levels also correlated with total bilirubin levels (supplemental Figure 1E; R = 0.5, P = .02), but not with levels of direct bilirubin, lactate dehydrogenase, and hemoglobin, or with reticulocyte, leukocyte, neutrophil, lymphocyte, and platelet counts (data not shown), in transfused SCD patients. To establish whether hemolysis can result in IFN-I production, we induced acute hemolysis in wild-type (WT) mice using water or various RBC breakdown products. Elevated levels of plasma IFN-α were detected following injection of water (70%), RBC lysate (60%), or hemoglobin (1.7-fold) compared with control and found hemin induced the most increase in IFN-α levels (10.6-fold) (Figure 1E,). IFN-β, the less abundant form of IFN-I, was also detected but only in mice treated with hemin (Figure 1F; 1.3 ± 0.6 pg/mL). With increasing doses of hemin, we found a dose response in IFN-α induction by hemin (Figure 1G). Furthermore, plasma IFN-α was first detectable at 6 hours after hemin injection with a peak at 20 hours followed by a return to baseline levels at 72 hours (Figure 1H). Hemin treatment also increased (70%) plasma IFN-α levels in sickle mice but not to the same level (10-fold) as in WT mice (supplemental Figure 1F), possibly because of induction of IFN-I tolerance21,22 from chronic hemolysis in SCD. We confirmed this concept experimentally by giving WT mice a second hemin dose 2 days after the first injection, which caused a much-attenuated induction (90%) of IFN-α (supplemental Figure 1F). As expected, treatment with human hemopexin inhibited plasma IFN-α induction in hemin-treated WT mice (1.6 ± 0.6 pg/mL vs 11.4 ± 1 pg, P < .05). Together, these results indicate that intravascular hemolysis as seen in SCD can induce IFN-I production.
IFN-I is mainly produced by liver macrophage/monocyte via TBK1/IKKε
To determine the cellular source of hemolysis-induced IFN-I production, IFN-β/YFP reporter mice were injected with hemin and the YFP+ signal in leukocyte subsets were analyzed using flow cytometry (see gating strategies in supplemental Figure 2A-B). We found IFN-β/YFP+ signal in liver macrophages (Mⲫ) (Figure 2A-B; 3.3% ± 0.4%) and to a lesser extent in spleen and BM Mⲫ (Figure 2A-B; 0.1%-0.2%). Similar to the IFN-β/YFP+ signal, levels of activated (phospho-) IRF3, a key transcription factor in IFN-I production, were highest in liver Mⲫ/monocyte of sickle mice and hemin-treated WT mice (supplemental Figure 3C-F). Low levels of YFP+ signal was also detected in neutrophils, conventional dendritic cells, monocytes, and plasmacytoid dendritic cells of the liver, spleen, and BM (Figure 2B; 0.1%-1%) but not in lymphocytes of any of these organs (Figure 2B, <0.1%). In addition, the YFP+ signal was virtually undetectable in all circulating leukocyte subsets in blood (Figure 2B; <0.1%), consistent with the undetectable IFN-α/β transcripts in SCD peripheral blood cells (Figure 1A; supplemental Figure 1A).11,13,14 The absolute numbers of IFN-β/YFP+ cells were higher in liver Mⲫ (8.2 ± 0.9 × 10⁴/organ) and monocytes (3.9 ± 1.2 × 10⁴/organ) compared with all other leukocytes in liver, spleen, BM, or blood (Figure 2C; <1 × 10⁴/organ). Among liver IFN-β/YFP+ monocytes, CMo frequency was double that of patrolling monocyte (PMo) and 10-fold more in numbers than PMo, in line with the inflammatory role of CMo relative to PMo (supplemental Figure 3A-B).23 Consistent with the role of monocyte/Mⲫ as the main source of heme-induced IFN-α, pretreatment of WT mice with clodronate liposome (clo-lipo), which mostly caused the depletion of Mⲫ/monocytes (supplemental Figure 3G-H), lowered (sixfold) hemin-induced plasma IFN-α levels compared with control PBS liposome-treated group (Figure 2D).

Hemolysis-induced IFN-I is primarily produced by liver macrophages and monocytes through ROS and TBK1/IKKε. (A) Representative dot plots showing frequencies of IFN-β/YFP+ macrophages (Mⲫ) in liver and spleen from IFN-β/YFP reporter mice at 20 hours after IV injection with PBS as control (200 µL/20 g body weight) or hemin (35 µmol/kg body weight). (B) Frequencies of IFN-β/YFP+ cells in leukocyte subsets in liver, spleen, bone marrow (BM), and blood from hemin-treated mice shown as in panel A (n = 3). (C) The absolute number of IFN-β/YFP+ cells in leukocyte subsets from mice as shown in panel B (n = 3). (D) Plasma IFN-α levels in WT mice at 20 hours after IV injection with PBS as control (200 µL/20 g body weight) or hemin (35 µmol/kg body weight), after pretreatment with Clo-lipo or PBS liposome (300 µL/20 g body weight, 1 day before hemin treatment) (n = 3-7). (E) Plasma IFN-α levels in WT mice and TLR4−/− mice at 20 hours after IV injection with PBS as control (200 µL/20 g body weight), or hemin (35 µmol/kg body weight) (n = 3-7). (F) Plasma IFN-α levels in WT mice at 20 hours after IV injection with PBS as control (200 µL/20 g body weight) or hemin (35 µmol/kg body weight), after pretreatment with TAK-242 (2 mg/kg body weight), amlexanox (50 mg/kg body weight) or NAC (250 mg/kg body weight), or SnPPIX (35 µmol/kg body weight) (n = 3-10). (G) Plasma IFN-α levels in WT mice at 20 hours after IV injection with hemin (35 µmol/kg body weight) and pretreated serially diluted amlexanox (from 50 to 3 and 0 mg/kg body weight) (n = 5-7). (H) Plasma IFN-α levels in sickle mice treated with amlexanox (50 mg/kg body weight/d for 3 consecutive days) or vehicle as control (n = 4). Data represent mean ± SEM; means were compared using 2-tailed Student t test. *P < .05.
Hemolysis-induced IFN-I is primarily produced by liver macrophages and monocytes through ROS and TBK1/IKKε. (A) Representative dot plots showing frequencies of IFN-β/YFP+ macrophages (Mⲫ) in liver and spleen from IFN-β/YFP reporter mice at 20 hours after IV injection with PBS as control (200 µL/20 g body weight) or hemin (35 µmol/kg body weight). (B) Frequencies of IFN-β/YFP+ cells in leukocyte subsets in liver, spleen, bone marrow (BM), and blood from hemin-treated mice shown as in panel A (n = 3). (C) The absolute number of IFN-β/YFP+ cells in leukocyte subsets from mice as shown in panel B (n = 3). (D) Plasma IFN-α levels in WT mice at 20 hours after IV injection with PBS as control (200 µL/20 g body weight) or hemin (35 µmol/kg body weight), after pretreatment with Clo-lipo or PBS liposome (300 µL/20 g body weight, 1 day before hemin treatment) (n = 3-7). (E) Plasma IFN-α levels in WT mice and TLR4−/− mice at 20 hours after IV injection with PBS as control (200 µL/20 g body weight), or hemin (35 µmol/kg body weight) (n = 3-7). (F) Plasma IFN-α levels in WT mice at 20 hours after IV injection with PBS as control (200 µL/20 g body weight) or hemin (35 µmol/kg body weight), after pretreatment with TAK-242 (2 mg/kg body weight), amlexanox (50 mg/kg body weight) or NAC (250 mg/kg body weight), or SnPPIX (35 µmol/kg body weight) (n = 3-10). (G) Plasma IFN-α levels in WT mice at 20 hours after IV injection with hemin (35 µmol/kg body weight) and pretreated serially diluted amlexanox (from 50 to 3 and 0 mg/kg body weight) (n = 5-7). (H) Plasma IFN-α levels in sickle mice treated with amlexanox (50 mg/kg body weight/d for 3 consecutive days) or vehicle as control (n = 4). Data represent mean ± SEM; means were compared using 2-tailed Student t test. *P < .05.
We next examined the role of key signaling pathways responsible for IFN-I induction. Because heme binds to TLR4,24,25 we initially tested the effect of hemin on plasma IFN-α induction in TLR4−/− mice, but unexpectedly found comparably similar IFN-α levels as in hemin-injected control mice (Figure 2E). In contrast, but as expected,26 no plasma IFN-α levels were detected in lipopolysaccharide (LPS)-treated TLR4−/− mice (supplemental Figure 3I). These results were confirmed using TLR4 inhibitor (TAK-242) wherein pretreatment with TAK-242 did not cause a decrease in hemin-induced IFN-α levels (Figure 2F). We also tested the drug amlexanox,27 which inhibits TBK1 and IKKε, critical kinases in the TLR4 downstream pathway for IFN-I expression.28 Interestingly, pretreatment with amlexanox decreased (15-fold) hemin-induced plasma IFN-α level in WT mice with a dose-response effect (Figure 2F-G) and reduced the frequency of hemin-induced IFN-β/YFP+ liver Mⲫ from 3.6% to 0.6% (supplemental Figure 3J; P < .05). In addition, treatment of sickle mice with amlexanox for 3 consecutive days decreased by half plasma IFN-α levels (Figure 2H), further supporting the role of TBK1/IKKε kinases in the regulation of IFN-α expression in SCD.
We next tested the relative roles of hemolysis-induced reactive oxygen species (ROS), which is involved in the proinflammatory response to hemin,29,30 and HO-1, the heme detoxifying enzyme with anti-inflammatory properties,31 in heme-driven IFN-I expression. Pretreatment with N-acetyl-l-cysteine (NAC, inhibitor of ROS) had a less robust effect than TBK1/IKKε inhibitor, decreasing by 2.5-fold plasma IFN-α levels (Figure 2F,) and reducing the IFN-β/YFP+ signal in hemin-treated liver Mⲫ from 3.6% to 2% (supplemental Figure 3J). In contrast, pretreatment with protoporphyrin IX tin (SnPPIX, inhibitor of HO-1) increased (twofold) circulating IFN-α levels in hemin-injected WT mice (Figure 2F). Altogether, these data indicate that IFN-I induced by hemolysis is mainly produced by liver Mⲫ/monocytes primarily through TBK1/IKKε and to a lesser extent ROS and is inhibited by HO-1.
Hemolysis induces recruitment of monocytes and their differentiation in liver through IFN-I
We next examined the functional consequences of heme-induced IFN-I production on monocytes and Mⲫ. Using a well-established “waterfall” model of gut monocyte/Mⲫ differentiation based on Ly-6C and MHC-II expression,32-35 higher frequencies of CMo and Ly-6C+MHC-II+ monocyte subset (based on gating strategy; supplemental Figure 4A) were detected in liver, spleen, and blood of sickle than control mice (Figure 3A-B). To test whether hemolysis was responsible for the altered monocyte frequencies in SCD and mediated by IFN-I, WT mice and ifnar1−/− mice36 were injected with hemin. Whereas frequencies of CMo and Ly-6C+MHC-II+ monocyte subset were increased in liver and blood at 1 day after hemin injection in WT mice, these increases were not apparent in hemin-injected ifnar1−/− mice (Figure 3C-D), suggesting that IFN-I response to hemolysis leads to CMo migration and recruitment to the liver. Consistent with this, levels of plasma CCL2 were significantly higher (twofold) in sickle mice (Figure 3E) and were induced in WT mice treated with hemin (Figure 3F; eightfold), but to a lesser degree in heme-injected ifnar1−/− mice (Figure 3F; twofold). Once in the liver or spleen, monocytes can differentiate into a Mⲫ population characterized by expression of low levels of Tim-4 (Tim-4− MoMⲫ), which distinguishes them from tissue resident Tim-4+ Mⲫ (Figure 3G).37 We found 13-fold higher frequencies of liver Tim-4− MoMⲫ in sickle mice than control mice (Figure 3G-H) but their frequency was only twofold higher in sickle spleen relative to control mouse spleens (Figure 3H), indicating a more robust monocyte-Mⲫ differentiation in sickle liver than spleen. In hemin-injected WT mice, a robust (sixfold) increase in liver Tim-4− MoMⲫ and to a lesser extent spleen Tim-4− MoMⲫ (2.3-fold) were detected 3 days posttreatment (Figure 3I-J), but these increases were significantly less in hemin-treated ifnar1−/− mice and ccr2 (receptor for CCL2)−/− mice (Figure 3I-J; supplemental Figure 4B). In sickle mice, Tim-4− MoMⲫ increased by an additional 25% following hemin treatment. Taken together, these results indicate that hemolysis induced IFN-I in SCD results in the recruitment and differentiation of CMo mostly in the liver.

Hemolysis leads to IFN-I-dependent recruitment of monocytes to the liver. Frequencies of (A) CMo (gating strategy in supplemental Figure 2A-B) and (B) Ly-6C+MHC-II+ monocyte in total CD45+ leukocytes in blood, spleen, and liver of control mice and sickle mice (n = 3-4). Frequencies of (C) CMo and (D) Ly-6C+MHC-II+ monocyte in total CD45+ leukocytes in blood and liver of WT mice and ifnar1−/− mice at 20 hours after IV injection with PBS as control (200 µL/20 g body weight) or hemin (35 µmol/kg body weight) (n = 4-5). (E) Plasma CCL2 levels in control mice and sickle mice (n = 4-5). (F) Plasma CCL2 levels in mice shown in panel C (n = 4-5). (G) Representative dot plot and histogram showing the gating strategy for analysis of total Mⲫ (F4/80+CD11blow Mⲫ), monocyte derived Mⲫ (Tim-4− MoMⲫ), and resident Mⲫ (Tim-4+ Mⲫ) in mouse liver and spleen. (H) Frequencies of MoMⲫ in total Mⲫ of spleen and liver in control and sickle mice (n = 3-6). (I) Representative histograms showing the gating strategy for liver Tim-4− MoMⲫ, and Tim-4+ Mⲫ in WT mice, ifnar1−/− mice, and ccr2−/− mice at 72 hours after IV injection with PBS as control (200 µL/20 g body weight) or hemin (35 µmol/kg body weight). (J) Frequencies of MoMⲫ in total Mⲫ in livers of mice as shown in I (n = 3-6). Means were compared using 2-tailed Student t test. *P < .05.
Hemolysis leads to IFN-I-dependent recruitment of monocytes to the liver. Frequencies of (A) CMo (gating strategy in supplemental Figure 2A-B) and (B) Ly-6C+MHC-II+ monocyte in total CD45+ leukocytes in blood, spleen, and liver of control mice and sickle mice (n = 3-4). Frequencies of (C) CMo and (D) Ly-6C+MHC-II+ monocyte in total CD45+ leukocytes in blood and liver of WT mice and ifnar1−/− mice at 20 hours after IV injection with PBS as control (200 µL/20 g body weight) or hemin (35 µmol/kg body weight) (n = 4-5). (E) Plasma CCL2 levels in control mice and sickle mice (n = 4-5). (F) Plasma CCL2 levels in mice shown in panel C (n = 4-5). (G) Representative dot plot and histogram showing the gating strategy for analysis of total Mⲫ (F4/80+CD11blow Mⲫ), monocyte derived Mⲫ (Tim-4− MoMⲫ), and resident Mⲫ (Tim-4+ Mⲫ) in mouse liver and spleen. (H) Frequencies of MoMⲫ in total Mⲫ of spleen and liver in control and sickle mice (n = 3-6). (I) Representative histograms showing the gating strategy for liver Tim-4− MoMⲫ, and Tim-4+ Mⲫ in WT mice, ifnar1−/− mice, and ccr2−/− mice at 72 hours after IV injection with PBS as control (200 µL/20 g body weight) or hemin (35 µmol/kg body weight). (J) Frequencies of MoMⲫ in total Mⲫ in livers of mice as shown in I (n = 3-6). Means were compared using 2-tailed Student t test. *P < .05.
IFN-I increases phagocytosis of allosensitized RBCs
SCD patients are at risk of experiencing a delayed hemolytic transfusion reaction (DHTR) associated with antibody-mediated erythrophagocytosis of transfused cells, although in about 30% of severe cases no antibodies can be detected.38 IFN-I has been shown to increase monocyte/Mⲫ levels of Fc receptor CD64 in lupus patients and in IFN-I injected WT mouse Mⲫ.39,40 We found higher levels of CD64 on CMo in SCD than in HD, with CD64 levels correlating with plasma IFN-α levels in SCD patients (supplemental Figure 5A-D). To test whether IFN-I can directly alter monocyte CD64 markers in SCD, purified CD14+ monocytes from SCD patients and HD were treated with IFN-α. Higher basal levels of CD64 were detected on cultured SCD than HD CMo (by two- to threefold), which increased significantly following treatment with IFN-α both on HD and SCD CMo (Figure 4A). The increase in CD64 expression was blocked by an IFN-I receptor competitive antagonist (B18R) (supplemental Figure 5E), consistent with IFN-α-driven CD64 upregulation. To test whether increased expression of CD64 would lead to increased uptake of antibody-coated RBCs by monocyte/Mⲫ in SCD,41 CFSE-labeled RhD+ human RBCs were coated with a polyclonal anti-D antibody and then cultured overnight with purified CD14+ monocytes. The CFSE+ signal in both HD and SCD CMo increased markedly with increasing doses of anti-D from 1% to 2% (without anti-D antibody) to 80% at the highest dose of anti-D antibody tested (4 µL) (Figure 4B; gating strategy in supplemental Figure 5F). Interestingly, SCD CMo displayed two- to threefold higher CFSE+ signal than HD CMo at lower doses of anti-D alloantibody (Figure 4B), likely because of higher basal CD64 levels in SCD (Figure 4A). Treatment with IFN-α further increased the uptake of RBCs coated with lower doses of alloantibody by SCD CMo by an additional 50% (Figure 4C; supplemental Figure 5G), and even more by HD CMo (threefold), reaching levels almost comparable to those of untreated SCD monocytes (Figure 4B). As expected, B18R inhibited IFN-α-induced phagocytosis of anti-d-coated RBCs, and anti-CD64 blocking antibodies inhibited this with or without IFN-α (supplemental Figure 5H). We did not detect any differences in erythrophagocytosis of antibody-sensitized RBCs by CMo from alloimmunized and nonalloimmunized SCD patients (supplemental Figure 5I) and, unlike a previous report,42 found comparable levels of CMo CD64 in these 2 groups (supplemental Figure 5J). Altogether, these data not only demonstrate a more potent erythrophagocytic activity by SCD CMo against antibody-coated RBCs, but also suggest a role for hemolysis-induced IFN-I in potentiating the increased activity.
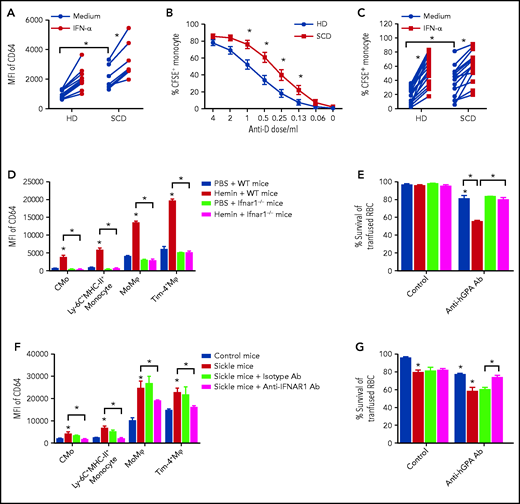
IFN-I increases erythrophagocytosis of low-level alloantibody sensitized RBCs in SCD. (A) Mean fluorescence intensity (MFI) of CD64 on purified CD14+ monocytes from HD (n = 14) and SCD (n = 7) after overnight culture with media or IFN-α (1000 IU/mL). (B) Percentage of CFSE+ monocytes in cultures of purified monocytes from HD (n = 10) and SCD (n = 9) following overnight co-incubation with CFSE-stained RhD+ RBCs coated using serially diluted anti-D antibody (from 4 to 0.06 and 0 µL in 100 µL staining buffer). (C) Percentage of CFSE+ monocytes in cultures of purified monocytes from HD (n = 10) and SCD (n = 9) as in panel B using low-dose anti-D antibody (0.25 µL in 100 µL staining buffer) in the absence (media alone) or presence of IFN-α (1000 IU/mL). (D) MFI of CD64 in liver CMo, Ly-6C+MHC-II+ monocyte, Tim-4− MoMⲫ, and Tim-4+ Mⲫ of WT mice and ifnar1−/− mice at 20 hours after IV injection with PBS as control (200 µL/20 g body weight) or hemin (35 µmol/kg body weight) (n = 4-5). (E) Survival of transfused CFSE-labeled RBCs from hGPA-Tg mice at 1 day in recipient WT and ifnar1−/− mice treated with anti-hGPA antibody (0.75 µg/20 g body weight, 1 hour after RBC transfusion) or isotype IgG as control, after pretreatment with hemin (35 µmol/kg body weight, 1 day before RBC transfusion) or PBS as control. (F) MFI of CD64 in liver CMo, Ly-6C+MHC-II+ monocyte, Tim-4− MoMⲫ, and Tim-4+ Mⲫ of control and sickle treated with anti-IFNAR1 antibody (2 mg/20 g body weight for 3 consecutive days) or isotype IgG as control (n = 3). (G) Survival of transfused CFSE-labeled hGPA RBCs in mice as shown in panel F at 1 day after receiving transfused RBC and anti-hGPA antibody (0.75 µg/20 g body weight), or isotype IgG as control (n = 5-6). Data represent mean ± SEM; means were compared using 2-tailed Student t test. *P < .05.
IFN-I increases erythrophagocytosis of low-level alloantibody sensitized RBCs in SCD. (A) Mean fluorescence intensity (MFI) of CD64 on purified CD14+ monocytes from HD (n = 14) and SCD (n = 7) after overnight culture with media or IFN-α (1000 IU/mL). (B) Percentage of CFSE+ monocytes in cultures of purified monocytes from HD (n = 10) and SCD (n = 9) following overnight co-incubation with CFSE-stained RhD+ RBCs coated using serially diluted anti-D antibody (from 4 to 0.06 and 0 µL in 100 µL staining buffer). (C) Percentage of CFSE+ monocytes in cultures of purified monocytes from HD (n = 10) and SCD (n = 9) as in panel B using low-dose anti-D antibody (0.25 µL in 100 µL staining buffer) in the absence (media alone) or presence of IFN-α (1000 IU/mL). (D) MFI of CD64 in liver CMo, Ly-6C+MHC-II+ monocyte, Tim-4− MoMⲫ, and Tim-4+ Mⲫ of WT mice and ifnar1−/− mice at 20 hours after IV injection with PBS as control (200 µL/20 g body weight) or hemin (35 µmol/kg body weight) (n = 4-5). (E) Survival of transfused CFSE-labeled RBCs from hGPA-Tg mice at 1 day in recipient WT and ifnar1−/− mice treated with anti-hGPA antibody (0.75 µg/20 g body weight, 1 hour after RBC transfusion) or isotype IgG as control, after pretreatment with hemin (35 µmol/kg body weight, 1 day before RBC transfusion) or PBS as control. (F) MFI of CD64 in liver CMo, Ly-6C+MHC-II+ monocyte, Tim-4− MoMⲫ, and Tim-4+ Mⲫ of control and sickle treated with anti-IFNAR1 antibody (2 mg/20 g body weight for 3 consecutive days) or isotype IgG as control (n = 3). (G) Survival of transfused CFSE-labeled hGPA RBCs in mice as shown in panel F at 1 day after receiving transfused RBC and anti-hGPA antibody (0.75 µg/20 g body weight), or isotype IgG as control (n = 5-6). Data represent mean ± SEM; means were compared using 2-tailed Student t test. *P < .05.
To confirm the effect of hemolysis-induced IFN-I in erythrophagocytosis, we first compared CD64 levels on monocyte/Mⲫ following hemin injection in WT and ifnar−/− mice. Hemin-injected WT but not ifnar1−/− mice displayed increased levels of CD64 on liver monocyte and Mⲫ populations and spleen Mⲫ (Figure 4D; supplemental Figure 6A). We next examined survival of transfused RBCs using CFSE-labeled leukoreduced RBCs from human glycophorin A transgenic (hGPA-Tg) mice along with high or low doses of alloanti-hGPA antibodies in recipient WT and ifnar−/− mice pretreated with hemin. Allogenic RBC survival at day 1 posttransfusion was reduced to 10% in both WT mice and ifnar1−/− mice when injected with high dose of alloantibody, regardless of hemin treatment (supplemental Figure 6B). However, at lower doses of alloantibody, we found a decrease (30%) in transfused RBC survival only in hemin-injected WT mice, but not in hemin-treated ifnar1−/− mice (Figure 4E). These data further support a role for hemolysis-mediated IFN-I in lowering the concentration threshold of alloantibody-mediated RBC destruction. We excluded a role for complement because transfused RBC survival was comparable in hemin-treated WT or C3 knockout mice treated with anti-hGPA IgG2a antibody (58% ± 2% vs 60% ± 5%) and C3 levels were similar in WT transfused mice plus anti-hGPA IgG2a antibody or isotype control (47 ± 2 vs 39 ± 1, P > .05).
We also examined whether phagocytosis of antibody-coated RBCs is altered in the SCD mouse model. We found higher basal levels of CD64 on liver monocyte and Mⲫ populations and spleen Mⲫ from sickle mice compared with control mice (Figure 4F; supplemental Figure 6C). To assess whether IFN-I signaling contributed to increased CD64 levels, sickle mice were treated (daily injection for 3 consecutive days) with a neutralizing anti-IFNaR1 antibody.43 Treatment with anti-IFNaR1 antibody but not isotype control led to a significant downregulation of CD64 expression on liver monocytes (1.5-fold) and Mⲫ (0.5-fold) in sickle mice (Figure 4F). Furthermore, we found shorter survival of transfused hGPA-Tg RBCs at day 1 posttransfusion in sickle mice compared with control mice in the absence of anti-hGPA antibody (Figure 4G). However, the difference in transfused RBC survival between sickle and control mice became greater in the presence of anti-hGPA alloantibody (Figure 4G) with hemolysis-activated liver Tim-4− MoMⲫ as effective as liver and spleen mature Mⲫ in the phagocytosis of antibody-coated CFSE-labeled RBCs (supplemental Figure 6D-E). Importantly, we found significant improvement in hGPA-Tg RBC survival in anti-hGPA antibody-treated sickle mice that had received anti-IFNaR1 antibody but not isotype control (Figure 4G). Altogether, these results indicate that phagocytosis of allosensitized RBCs is increased in SCD through IFN-I.
Discussion
In the present study, we have, for the first time, shown that IFN-I can be induced in mice by hemolysis, a hallmark of SCD. We found that mouse liver monocytes/Mⲫ activated primarily through TBK1/IKKɛ in response to hemolysis, are the main cellular source of circulating IFN-I. Levels of plasma IFN-I correlated with total plasma heme levels in SCD patients and although IFN-Is were not detected in circulating SCD CMo, we did find upregulation of IFN-I inducible genes, suggesting that hemolysis through increased plasma IFN-I levels was responsible for IFN-I activation in circulating SCD CMo. Hemolysis-induced IFN-I led to an increase in CCL2 levels and concomitant monocyte recruitment to the liver, leading to an expansion of MoMⲫ in mice. In addition to increasing the numbers of liver phagocytes, hemolysis resulted in IFN-I-mediated upregulation of CD64 Fc receptor on SCD monocytes/Mⲫ, which lowered the threshold for RBC allosensitization by IgG required for erythrophagocytosis in human in vitro and in vivo in mice. Altogether, our findings demonstrate that hemolysis-induced IFN-Is promote monocyte recruitment to the liver, leading to enhanced alloantibody-mediated erythrophagocytosis, thus representing a novel regulator of antibody-mediated RBC destruction in SCD and a potential therapeutic target for prevention of hemolytic transfusion reactions.
Using IFN-β/YFP reporter mice, we were able to trace the main cellular source producing IFN-I in response to hemolysis to liver monocyte/Mⲫ. This is in line with studies showing injected hemin is preferentially targeted to the liver.44-46 Despite the known TLR4 signaling pathway in induction of IFN-I, and that TLR4 can bind to hemin,25 we did not find any significant decrease in hemin-induced IFN-I in TLR4−/− mice or TAK-242-treated WT mice (Figure 2). Interestingly, however, inhibition of TBK1/IKKε, downstream of TLR4 pathway, by amlexanox resulted in significant decrease in IFN-I levels in sickle mice and hemin-treated mice (Figure 2; supplemental Figure 3), suggestive of involvement of another upstream receptor activation in hemolysis-induced IFN-I production.47 A potential role for heme-derived iron in the induction of IFN-I remains a possibility and is under investigation, given that iron levels, which are higher in SCD, can induce cell death and inflammation.48-50 Nucleic acids released from damaged cells are the main drivers of TBK1/IKKε activation in several disease including lupus.51 We posit that hemolysis-induced cell damage leading to the release of DNA/RNA material of nuclear and/or mitochondrial origin and/or neutrophil extracellular traps52-55 may be involved in IFN-I expression in SCD. We found that hemin-induced IFN-I production was partially blocked by ROS inhibitor NAC, but levels increased following inhibition of HO-1 activity by SnPPIX (Figure 2). These data are consistent with a model whereby HO-1 plays a cytoprotective role in hemolysis-induced cell damage but is overwhelmed by the accumulation of ROS31 in SCD.
A key novel finding of our study is that heme-driven IFN-I production led to the recruitment of monocytes to the liver through upregulation of CCL2. Although a direct role of IFN-I in monocyte-Mⲫ differentiation remains to be established, we found higher frequency of CMo/MoMⲫ in the liver than in spleen in sickle mice (Figure 3). This is consistent with the liver as the major site of intravascular heme detoxification rather than the spleen.44 In response to hemolysis, monocytes can differentiate into spleen Mⲫ through activation of the key transcription factor Spic. Although Spic was expressed in a small fraction of liver Mⲫ in naïve mice,56 its expression in sickle liver monocyte/Mⲫ has not been examined. It remains to be determined whether Spic is activated by heme-induced IFN-I and promotes liver monocyte-Mⲫ differentiation in SCD. Interestingly, a recent study found that uptake of stressed RBCs by CMo led to their differentiation in liver more than in spleen.37 The same report also noted increased frequency of hepatic MoMⲫ in sickle mice, similar to our findings, and suggested a protective role for hepatic recruitment of monocytes and their differentiation against hemolysis-induced liver damage. In our study, ifnar1−/− mice displayed increased hepatic apoptosis but with no increase in liver monocyte numbers following hemin injection (supplemental Figure 7A), suggestive of a protective role of IFN-I-mediated monocyte migration against hemolysis-induced liver damage. In support of this, Mⲫ/monocyte depletion using Clo-Lipo exacerbated damage to liver parenchymal cells and endothelium in sickle mice and in hemin-treated WT mice (supplemental Figure 7B). These findings are in line with our working model that IFN-Is promote CMo recruitment to the liver in SCD to protect against hemolytic hepatic injury by replenishing the liver Mⲫ pool lost through intravascular hemolysis-induced cell death.57 Initial attempts to test this using short-term (3 day) anti-IFNaR1 antibody treatment did not significantly change the frequencies of Tim-4− Mⲫ s in sickle mice (data not shown), suggesting the need for longer term antibody treatment or the use of monocyte/Mⲫ IFNaR1 or CCR2 floxed sickle mice to block all IFN signals. We speculate that IFN-I may also be activated in splenic and/or hepatic monocyte/Mⲫ populations in thalassemia and other hemolytic anemias because of increase in local heme levels resulting from extravascular RBC destruction, leading to monocyte recruitment and expansion of MoMⲫ populations as a protective host defense against potential hemolytic injury.
This protective role of IFN-I was counterbalanced by our findings that hemolysis-induced IFN-I led to increased erythrophagocytosis of antibody sensitized RBCs in SCD (Figure 4), especially when alloantibody levels were low. Mechanistically, increased RBC destruction was due to IFN-I-driven expansion of liver monocyte and Mⲫ with potential for erythrophagocytosis and upregulation of CD64 Fc receptor on monocyte/Mⲫ populations (Figure 4). CD64 binds with high affinity to IgG1, IgG3, and IgG4, but has no affinity for IgG2 in humans, whereas in mice it is the high-affinity receptor for only IgG2a. In our studies, the anti-hGPA antibody used was a IgG2a monoclonal and as expected, increased CD64 levels by heme-driven led to shortened transfused hGPA-Tg RBC survival in anti-hGPA antibody-treated mice (Figure 4), although other anti-hGPA isotypes were not tested. The human anti-RhD is polyclonal sera expected to increase erythrophagocytosis of sensitized RBCs except those coated with IgG2 isotype, although this was not tested. SCD patients are at higher risk of experiencing severe DHTRs likely because of activation of the alternative pathway of complement by heme.58 In about 30% of severe cases of DHTR, no antibodies can be detected,38 although it remains unclear if this is due to low levels of antibodies that escape detection by serological assays. Interestingly, we did not find a role for IFN-I signaling in affecting erythrophagocytosis of transfused RBCs in the absence of alloantibodies in SCD (Figure 4E,G; supplemental Figure 5G). Instead, SCD CMo had a higher phagocytic activity against RBCs sensitized with low levels of antibodies than HD CMo (Figure 4B), which was further increased with treatment with IFN-I (Figure 4C), likely because of CD64 upregulation. We speculate that hemolysis driven IFN-I increases destruction of RBCs sensitized with low levels of antibodies in SCD patients who serologically test negative. Interestingly, our analysis of 2 recent DHTR cases (hemoglobin levels: 7.7 g/dL and 7.4 g/dL; heme levels: 246 µM and 252 µM) with no detectable antibodies was associated with higher levels of IFN-α (1.28 pg/mL and 2.2 pg/mL). Gibb et al have elegantly demonstrated a role for IFN-I in inflammation-induced alloimmunization in mice.59 In severe DHTR, hemolysis-driven IFN-I may also contribute to the development of new alloantibodies in patients at high risk.60 Careful monitoring including longitudinal measurements of IFN-I levels together with immune profiling in the same individual at steady state and during DHTR may help establish potential correlative patterns and may even identify in advance patients at high risk.
In summary, we have identified hemolysis as a driver of IFN-I production in monocyte/Mⲫ in SCD. Hemolysis-induced IFN-I produced by liver monocyte/Mⲫ led to monocyte recruitment to the liver and their differentiation and activation, increasing alloantibody-mediated erythrophagocytosis in SCD. We speculate that a heightened alloantibody mediated RBC destruction by monocyte/Mⲫ driven by IFN-I activation may be responsible for increased risk of severe DHTRs in SCD, opening up the potential for development of IFN-I-based diagnostics and potentially therapeutics.
Acknowledgments
This work was supported in part by grants from the National Institutes of Health National Heart, Lung, and Blood Institute P01 HL149626 (K.Y.) and R01 HL145451 (K.Y.), Hugoton Foundation (H.Z.), and BNY Mellon (C.A.L. and K.Y.).
Authorship
Contribution: Y.L. conceived the idea, performed experiments, and analyzed the data; M.P. and W.B. performed experiments, and analyzed the data; X.A. and C.A.L. assisted with project concept and design; P.A.S. and D.M. were involved with all aspects of selection, recruitment, and provision of blood samples from patients and controls; H.Z. analyzed and interpreted data; K.Y. directed the overall research design, and project supervision; and K.Y. and Y.L. wrote the manuscript with consultation and contribution from all coauthors.
Conflict-of-interest disclosure: The authors declare no competing financial interests. The RNA-Seq data reported in this article have been deposited in the Gene Expression Omnibus (GEO) database (acquisition number GSE168532).
All data supporting the findings of this study are available within the article, supplemental figures, or from the corresponding authors upon reasonable request.
Correspondence: Karina Yazdanbakhsh, Laboratory of Complement Biology, New York Blood Center, 310 E 67th St, New York, NY10065; e-mail: kyazdanbakhsh@nybc.org.
The online version of this article contains a data supplement.
There is a Blood Commentary on this article in this issue.
The publication costs of this article were defrayed in part by page charge payment. Therefore, and solely to indicate this fact, this article is hereby marked “advertisement” in accordance with 18 USC section 1734.

This feature is available to Subscribers Only
Sign In or Create an Account Close Modal