

Key Points
Placental-derived HTRA1 cleaves A1AT, resulting in the generation of neonatal NIPs.
Neonatal neutrophils from HTRA1−/− mice become NET competent earlier after birth compared with HTRA1+/+ littermate controls.

Abstract
Neutrophil extracellular traps (NETs) are important components of innate immunity. Neonatal neutrophils (polymorphonuclear leukocytes [PMNs]) fail to form NETs due to circulating NET-inhibitory peptides (NIPs), cleavage fragments of α1-antitrypsin (A1AT). How fetal and neonatal blood NIPs are generated remains unknown, however. The placenta expresses high-temperature requirement serine protease A1 (HTRA1) during fetal development, which can cleave A1AT. We hypothesized that placentally expressed HTRA1 regulates the formation of NIPs and that NET competency changed in PMNs isolated from neonatal HTRA1 knockout mice (HTRA1−/−). We found that umbilical cord blood plasma has elevated HTRA1 levels compared with adult plasma and that recombinant and placenta-eluted HTRA1 cleaves A1AT to generate an A1AT cleavage fragment (A1ATM383S-CF) of molecular weight similar to previously identified NIPs that block NET formation by adult neutrophils. We showed that neonatal mouse pup plasma contains A1AT fragments that inhibit NET formation by PMNs isolated from adult mice, indicating that NIP generation during gestation is conserved across species. Lipopolysaccharide-stimulated PMNs isolated from HTRA1+/+ littermate control pups exhibit delayed NET formation after birth. However, plasma from HTRA1−/− pups had no detectable NIPs, and PMNs from HTRA1−/− pups became NET competent earlier after birth compared with HTRA1+/+ littermate controls. Finally, in the cecal slurry model of neonatal sepsis, A1ATM383S-CF improved survival in C57BL/6 pups by preventing pathogenic NET formation. Our data indicate that placentally expressed HTRA1 is a serine protease that cleaves A1AT in utero to generate NIPs that regulate NET formation by human and mouse PMNs.
Introduction
Successful human placentation and gestation require maternal immune tolerance at the maternal–fetal interface. In addition, neonates must acquire and maintain a modicum of immune tolerance after birth, thereby preventing maladaptive early immune responses to antigens associated with nonpathogenic microbes ex utero. Robust mechanisms are used to provide specific maternal immune tolerance to placental and fetal tissues while maintaining a protective immune response to pathogens that will affect both mother and fetus.1-3 Fetal and neonatal immune tolerance is also required for successful placentation and gestation.4,5
Neutrophil extracellular traps (NETs) form in select polymorphonuclear leukocytes (PMNs; neutrophils) in response to inflammatory stimuli, including activated platelets, cytokines, chemokines, microbes, and damage-associated molecular patterns.6,7 Although NET formation clearly limits the spread of infection and may even affect extracellular microbial killing, exaggerated NET formation causes inflammatory tissue damage8 and is associated with worse outcomes for patients with inflammatory syndromes such as sepsis,9 transfusion-related acute lung injury,10,11 and autoimmune diseases such as systemic lupus erythematosus.12 Recently, our group and others have also observed exaggerated NET formation in patients with COVID-19.13,14
We discovered that umbilical cord blood PMNs fail to form NETs due to an endogenous NET-inhibitory factor, which we labeled neonatal NET-inhibitory factor (nNIF).6 nNIF results from cleavage of the carboxy-terminus of α1-antitrypsin (A1AT) and circulates in human umbilical cord blood. Although we identified A1AT as the source of nNIF, the protease responsible for the generation of this A1AT cleavage fragment remains unknown. Given the decreased NET-inhibitory activity in peripheral blood plasma compared with umbilical cord blood plasma, we hypothesized that a placentally expressed protease cleaves A1AT, leading to the generation of NET-inhibitory peptides (NIPs). Other investigators have reported that human placenta expresses high levels of high-temperature requirement serine protease A1 (HTRA1) throughout pregnancy, especially during the third trimester,15 and that HTRA1 cleaves A1AT.16 Here, we report that placentally expressed HTRA1 cleaves A1AT to generate a carboxy-terminus fragment with NET-inhibitory activity, the A1AT-cleavage fragment (A1ATM383S-CF). We also report that treatment with A1ATM383S-CF improves survival in a mouse model of neonatal sepsis.
Methods
Details regarding the sources of materials and additional methods are provided in the supplemental Methods (available on the Blood Web site).
Study approval
The University of Utah Institutional Review Board approved this study (Institutional Review Board #00011919, #00119244, #00051506, and #00065007), and all human subjects provided informed consent in accordance with the Declaration of Helsinki.
HTRA1−/− mice studies
All murine experiments were approved by the University of Utah Institutional Animal Care and Use Committee (18-11012). Kang Zhang kindly donated HTRA1−/− mice for in vivo experiments.17 The homozygous knockout HTRA1 −/− mice were crossed with C57BL/6 mice (The Jackson Laboratory) to obtain the heterozygous HTRA1+/−. HTRA1−/− knockout embryos and adult mice were produced by HTRA1+/− inbreeding to generate HTRA1+/+, HTRA1+/−, and HTRA1−/− littermate controls in the expected ratio of 1:2:1, respectively. For genotyping, genomic DNA extraction and polymerase chain reaction were performed with tail or ear clips by using the AccuStart II Mouse Genotyping Kit (VWR). The genotyping primers were described previously.18 Briefly, the mutant allele was identified with BGEO (5'-AATGGGCTGACCGCTTCCTCGTGCTT-3') and S84R (5'-TGTGCACGCCGTCGTACTGT-3') primers and the HTRA1+/+ allele with G-R4 (5'-CACTACGCATTGCAGCCCCTC-3') and G-L1 (5'-CGTACCACGCTCCTGTCTTT-3') primers. Due to the high GC content in the HTRA1+/+ allele, 5% dimethyl sulfoxide was added to the polymerase chain reaction. All littermates were dam-fostered after birth and housed in a single cage until experimentation. Mice were housed on a 12-hour light/12-hour dark cycle with a constant temperature in the University of Utah Center for Comparative Animal Studies.
HTRA1 protein extraction
We extracted human HTRA1 protein from homogenized human placental tissue and umbilical cord blood plasma from both term and preterm gestations by using an HTRA1 Extraction Kit (catalog #30501103; BioTeZ Berlin-Buch GmbH). Placental tissue was homogenized by placing frozen tissue and phosphate-buffered saline in a chilled Bead Lysis Kit (Next Advance, Inc) and running in a Bullet Blender Storm 24 (Next Advance, Inc) for 10 minutes at 4°C. HTRA1 protein extractions from placenta and umbilical cord blood resulted in purified human HTRA1 protein. We also used a recombinant human HTRA1 protein purchased from R&D Systems (catalog #2916-SE-020) in select experiments.
A1ATM383S-CF protein detection
Placental tissue homogenates, umbilical cord blood plasma, mature mouse plasma, and mouse pup plasma were analyzed for A1ATM383S-CF by using western blotting and confirmatory mass spectroscopy. After sample preparation, each sample was subjected to size separation by using gel electrophoresis with precast 16% TRIS-Tricine gels (Bio-Rad) designed to separate low-molecular-weight proteins. Synthesized nNIF protein was loaded as a positive control for size and amino acid sequence (Utah DNA/Peptide Synthesis Core). After transfer, each membrane was incubated with a primary antibody specific for the carboxy-terminus of human A1AT (LS Bio). In other gels, we stained with Coomassie dye and extracted the appropriate protein band for mass spectroscopy using the reference sequence for A1ATM383S-CF as the peptide search criterion (Utah Mass Spectroscopy Core).
Statistical analysis
GraphPad Prism software (version 8.4) was used for all statistical analyses. For each experimental variable, the mean ± standard error of the mean (SEM) was determined. All data used in each statistical test met the assumptions of the specific test and were normally distributed. A 1-way analysis of variance with Tukey’s post hoc testing was performed when multiple comparisons were made. An unpaired Student t test or Mann-Whitney U test was used when comparing 2 samples. A value of P < .05 was considered statistically significant.
Results
Human placenta secretes HTRA1 into the fetal circulation; decreased HTRA1 plasma levels after birth associate with decreased levels of NIPs
We used immunofluorescence to determine the expression and localization of HTRA1 and A1AT in placentas from term and preterm pregnancies. Placentas from term and preterm pregnancies robustly expressed HTRA1 in the syncytiotrophoblast and cytotrophoblast cells (Figure 1A). Interestingly, although HTRA1 and A1AT were expressed in close proximity, they did not colocalize (Figure 1A, inset). Western blot analysis of total human placental homogenates further confirmed that HTRA1 and A1AT are expressed in human placentas from both term and preterm gestations (Figure 1B).
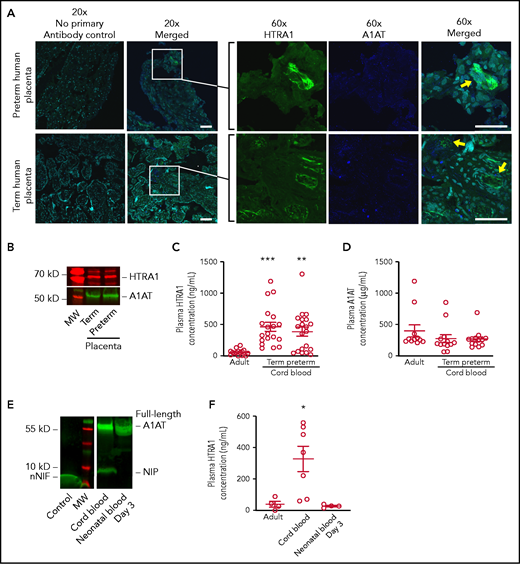
The human placenta expresses both HTRA1 and A1AT, and umbilical cord blood NIP levels correlate with plasma HTRA1 levels after birth. (A) Human placental tissue from both term and preterm gestations was subjected to immunofluorescence studies using primary antibodies targeting HTRA1 (green) and the C-terminus of A1AT (blue). DAPI was used as a nuclear counterstain (aqua). (Both 20× and 60× objectives were used; scale bars, 50 μm.) These images are representative of experiments performed by using 3 different placental samples from each group. Yellow arrows indicate juxtaposition of A1AT and HTRA1. (B) We further determined placental HTRA1 (red) and A1AT (green) protein expression via western blotting in placental extracts from both term and preterm gestations. The western blot is representative of 3 separate experiments in each group. We next assessed plasma concentrations of both HTRA1 and A1AT in plasma isolated from healthy adults and umbilical cord blood isolated from both healthy term neonates and preterm neonates. (C) The y-axis depicts plasma HTRA1 concentration ± SEM for adult plasma, term umbilical cord blood plasma, and preterm umbilical cord blood plasma. (D) The y-axis depicts plasma A1AT concentration ± SEM for adult plasma, term umbilical cord blood plasma, and preterm umbilical cord blood plasma. (E) Umbilical cord blood plasma and peripheral blood taken from the same neonate 3 days after delivery were subjected to western blotting using a primary antibody to detect the C-terminus of A1AT (green). nNIF, another NIP, was used as a positive control (Control). This western blot is representative of 3 separate experiments using plasma samples from 3 different neonates. (F) The plasma concentration was determined of HTRA1 in adult peripheral blood plasma, umbilical cord blood plasma, and plasma from neonates 3 days after birth. The y-axis depicts plasma HTRA1 concentration ± SEM. *P < .05 for umbilical cord blood vs both adult and day 3 neonatal plasma. **P < .01, ***P < .001. MW, molecular weight.
The human placenta expresses both HTRA1 and A1AT, and umbilical cord blood NIP levels correlate with plasma HTRA1 levels after birth. (A) Human placental tissue from both term and preterm gestations was subjected to immunofluorescence studies using primary antibodies targeting HTRA1 (green) and the C-terminus of A1AT (blue). DAPI was used as a nuclear counterstain (aqua). (Both 20× and 60× objectives were used; scale bars, 50 μm.) These images are representative of experiments performed by using 3 different placental samples from each group. Yellow arrows indicate juxtaposition of A1AT and HTRA1. (B) We further determined placental HTRA1 (red) and A1AT (green) protein expression via western blotting in placental extracts from both term and preterm gestations. The western blot is representative of 3 separate experiments in each group. We next assessed plasma concentrations of both HTRA1 and A1AT in plasma isolated from healthy adults and umbilical cord blood isolated from both healthy term neonates and preterm neonates. (C) The y-axis depicts plasma HTRA1 concentration ± SEM for adult plasma, term umbilical cord blood plasma, and preterm umbilical cord blood plasma. (D) The y-axis depicts plasma A1AT concentration ± SEM for adult plasma, term umbilical cord blood plasma, and preterm umbilical cord blood plasma. (E) Umbilical cord blood plasma and peripheral blood taken from the same neonate 3 days after delivery were subjected to western blotting using a primary antibody to detect the C-terminus of A1AT (green). nNIF, another NIP, was used as a positive control (Control). This western blot is representative of 3 separate experiments using plasma samples from 3 different neonates. (F) The plasma concentration was determined of HTRA1 in adult peripheral blood plasma, umbilical cord blood plasma, and plasma from neonates 3 days after birth. The y-axis depicts plasma HTRA1 concentration ± SEM. *P < .05 for umbilical cord blood vs both adult and day 3 neonatal plasma. **P < .01, ***P < .001. MW, molecular weight.
We next examined the expression levels of HTRA1 and A1AT proteins in plasma samples isolated from healthy adults and umbilical cord blood from both term and preterm pregnancies. A significant increase in plasma HTRA1 expression was observed in both term and preterm umbilical cord blood samples compared with samples from healthy adults (Figure 1C). However, no difference in plasma A1AT levels was noted between neonates and healthy adults (Figure 1D).
We next determined whether plasma NIP protein levels decrease after delivery. We found undetectable plasma NIP expression by western blotting just 3 days after delivery (Figure 1E). In an additional preterm neonate, NIP levels were assessed over the first 2 weeks after delivery, and a decrease in NIP expression over time was noted, with the first 72 hours after delivery exhibiting the greatest interval decrease in NIP expression (supplemental Figure 1). Because removal of the placenta results in decreased NIP expression in the plasma, we queried if plasma HTRA1 levels also decrease. We detected significantly reduced plasma HTRA1 levels from peripheral blood samples taken 3 days after delivery compared with plasma HTRA1 levels in umbilical cord blood from the same neonate. Interestingly, HTRA1 levels in plasma from neonates 3 days after delivery were similar to plasma levels observed in healthy adults (Figure 1F).
Placental HTRA1 cleaves A1AT and generates a carboxy-terminus cleavage fragment of A1AT
We next determined if HTRA1 generates a carboxy-terminus peptide of A1AT with properties similar to nNIF. Based on published work16 and computer modeling, we identified a probable cut site of A1AT by HTRA1 between amino acid residues 382 and 383, resulting in a peptide fragment with a molecular weight of 4132.226 Da (Figure 2A). In cell-free reactions using recombinant HTRA1 and A1AT, we observed generation of an ∼4 kD carboxy-terminus fragment of A1AT. We named this peptide A1ATM383S cleavage fragment (A1ATM383S-CF). A1ATM383S-CF rose with increasing concentrations of recombinant HTRA1, suggesting that HTRA1 cleaves A1AT (Figure 2B-C). In addition, we observed A1ATM383S-CF only when A1AT and HTRA1 were incubated together, further suggesting that HTRA1 cleaves A1AT (Figure 2D). We next confirmed by mass spectroscopy that the sequence of A1ATM383S-CF was identical to the predicted A1AT HTRA1-dependent cleavage fragment and was strikingly similar to nNIF (Figure 2A,E). Furthermore, HTRA1 was isolated from human umbilical cord blood and placenta to determine if HTRA1 derived from these sources cleaves A1AT to generate A1ATM383S-CF. Similar to recombinant HTRA1, both umbilical cord blood and placenta-derived HTRA1 cleaved A1AT to generate the predicted carboxy-terminus peptide with a molecular weight of 4132.2257 Da (Figure 2E).
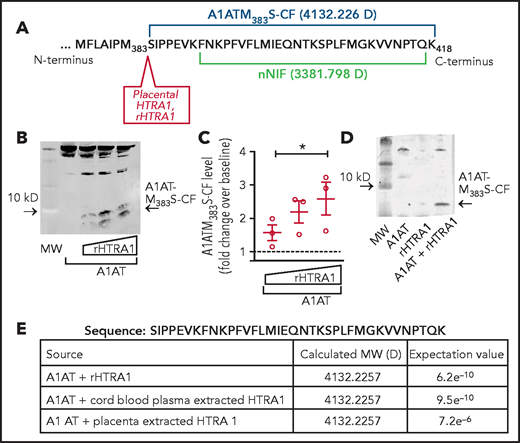
HTRA1 cleaves A1AT to generate a 4.1 kD C-terminus cleavage fragment, A1ATM383S-CF. (A) HTRA1 is known to cleave A1AT after the methionine 383 residue generating a 4132.226 Da carboxy-terminus fragment in amino acid sequence similar to the NIP, nNIF. (B) Cell-free assays were performed of A1AT incubated with increasing concentrations of recombinant HTRA1 (rHTRA1) protein (1-100 μg/mL). Western blotting with a primary antibody specific for the C-terminus of A1AT was used to detect A1ATM383S-CF, an ∼4.1 kD cleavage fragment of A1AT. (C) Relative fluorescence intensity was used to quantitate A1ATM383S-CF levels in the reaction products in panel B. The y-axis depicts the relative A1ATM383S-CF levels after western blotting. (D) Western blotting was performed on cell-free reaction products using full-length A1AT alone, rHTRA1 alone, and A1AT incubated with rHTRA1. The western blot is representative of 3 separate experiments. (E) We incubated full-length A1AT with rHTRA1, HTRA1 protein extracted from umbilical cord blood, and HTRA1 protein extracted from placental homogenates and submitted them for analysis via mass spectroscopy. The sequence, resolved molecular weights (MWs), and expectation values from the analysis are shown. *P < .05 compared with baseline, arbitrarily set at 1 (dashed line).
HTRA1 cleaves A1AT to generate a 4.1 kD C-terminus cleavage fragment, A1ATM383S-CF. (A) HTRA1 is known to cleave A1AT after the methionine 383 residue generating a 4132.226 Da carboxy-terminus fragment in amino acid sequence similar to the NIP, nNIF. (B) Cell-free assays were performed of A1AT incubated with increasing concentrations of recombinant HTRA1 (rHTRA1) protein (1-100 μg/mL). Western blotting with a primary antibody specific for the C-terminus of A1AT was used to detect A1ATM383S-CF, an ∼4.1 kD cleavage fragment of A1AT. (C) Relative fluorescence intensity was used to quantitate A1ATM383S-CF levels in the reaction products in panel B. The y-axis depicts the relative A1ATM383S-CF levels after western blotting. (D) Western blotting was performed on cell-free reaction products using full-length A1AT alone, rHTRA1 alone, and A1AT incubated with rHTRA1. The western blot is representative of 3 separate experiments. (E) We incubated full-length A1AT with rHTRA1, HTRA1 protein extracted from umbilical cord blood, and HTRA1 protein extracted from placental homogenates and submitted them for analysis via mass spectroscopy. The sequence, resolved molecular weights (MWs), and expectation values from the analysis are shown. *P < .05 compared with baseline, arbitrarily set at 1 (dashed line).
A1ATM383S-CF inhibits NET formation in vitro
We next determined whether A1ATM383S-CF inhibits NET formation by human PMNs in vitro using synthetic A1ATM383S-CF or a scrambled (SCR) peptide control, which contains an identical amino acid content and length but randomly generated amino acid sequence. Using live cell imaging with cell-permeable and cell-impermeable DNA dyes, it was observed that PMNs from healthy adults produce robust NET formation in response to phorbol-12-myristate acetate (PMA). As expected, preincubation with nNIF reduced NET formation qualitatively and quantitatively compared with the nNIF SCR peptide control (Figure 3A-B). A1ATM383S-CF also decreased NET formation qualitatively and quantitatively in response to PMA compared with A1ATM383S-CF SCR peptide control.
![A1ATM383S-CF inhibits NET formation by PMNs isolated from healthy adults. A1ATM383S-CF as well as its SCR peptide control were synthesized for use in in vitro assays of NET formation. (A) PMNs were pretreated with A1ATM383S-CF (1.2 μM) or nNIF (1.2 μM) or their SCR control peptides for 1 hour before stimulation with PMA (20 nM; 2 hours). NET formation was assessed by live cell imaging using confocal microscopy with DNA stains, one that is cell permeable (SYTO Green [Thermo Fisher Scientific], nuclear DNA, green) and the other that is cell impermeable (SYTOX Orange [Thermo Fisher Scientific], NETs, magenta). Images are representative of 4 different experiments in PMNs isolated from 4 different donors. (B) NET formation was quantified by using a high-throughput DNA fluorescence assay for PMNs treated as in panel A. The y-axis represents NET formation with relative fluorescent intensity ± SEM. (C) We performed a concentration curve of A1ATM383S-CF or its SCR peptide control (241 pM to 12 μM) and assessed NET formation in PMNs isolated from healthy adults using live cell imaging as in panel A. PMNs were pretreated for 1 hour with either A1ATM383S-CF or its SCR peptide control before stimulation with LPS (100 ng/mL; 2 hours). Images are representative of 3 separate experiments using PMNs from 3 different donors. (D) A standardized grid system was used to semiquantitate NET formation by PMNs treated as in panel C. The y-axis depicts NET formation with NETs crossing standardized grid lines/high-power field (hpf) (± SEM). (E) We pretreated PMNs with recombinant HTRA1 (rHTRA1) alone (1 nM) or full-length A1AT alone (1 nM) for 1 hour before stimulation with LPS (100 ng/mL; 2 hours). NET formation was assessed by live cell imaging as in panel A. Images are representative of 3 different experiments using PMNs isolated from 3 different donors. (F) We pretreated PMNs with nNIF (0.5 or 1.2 μM), A1ATM383S-CF (0.5 or 1.2 μM), or full-length human recombinant A1AT (0.5 or 1.2 μM) for 1 hour before stimulation with LPS (100 ng/mL; 2 hours). NET formation was quantified by using a high-throughput DNA fluorescence assay for PMNs treated as in panel A. The y-axis represents NET formation with relative fluorescent intensity over baseline, arbitrarily set at 1 (±SEM). (G) PMNs were pretreated with the cell-free incubation reaction products of placental extracted or rHTRA1 (0.08 mg/mL) with full-length A1AT (0.8 mg/mL) for 1 hour before stimulation with LPS (100 ng/mL; 2 hours). NET formation was assessed by live cell imaging as in panel A. Images are representative of 3 different experiments using PMNs isolated from 3 different PMN donors. Scale bars, 50 μm for all images in this figure. *P < .05, **P < .01, ***P < .001.](https://ash.silverchair-cdn.com/ash/content_public/journal/blood/138/11/10.1182_blood.2020009021/3/m_bloodbld2020009021f3.png?Expires=1767738231&Signature=sAom9g7pK77QOMu1MQHkTjgOzeSzL87nAVeSo3~dsYIzoxpt4Vz3H87wYcK41L5dnmiUX0Cy7~Q1aKnmLM5bsUhfmRFqb9Wa-3TYUgwk-aJqmys4TrUOSXiJJltBGDt8PWjJIbNUJ8Eu-y3oA2FssafXp5E4igHVsUtahZcFmaTZiP7jv3SqWv96xppU0VCPjbuY18BTXeCVZcNN2IZ~YKb66b8MgTGqso2VrKHAkOpYe~YNkCkTUfDjMs5shyfP3CXszGkCn9v-5YoXolKcjRQE1JGzGfIGry~k4egLj7hw2DqtUP~zjB5gtH5e8fxia7RKs6H341nJVjwfxQgT4w__&Key-Pair-Id=APKAIE5G5CRDK6RD3PGA)
A1ATM383S-CF inhibits NET formation by PMNs isolated from healthy adults. A1ATM383S-CF as well as its SCR peptide control were synthesized for use in in vitro assays of NET formation. (A) PMNs were pretreated with A1ATM383S-CF (1.2 μM) or nNIF (1.2 μM) or their SCR control peptides for 1 hour before stimulation with PMA (20 nM; 2 hours). NET formation was assessed by live cell imaging using confocal microscopy with DNA stains, one that is cell permeable (SYTO Green [Thermo Fisher Scientific], nuclear DNA, green) and the other that is cell impermeable (SYTOX Orange [Thermo Fisher Scientific], NETs, magenta). Images are representative of 4 different experiments in PMNs isolated from 4 different donors. (B) NET formation was quantified by using a high-throughput DNA fluorescence assay for PMNs treated as in panel A. The y-axis represents NET formation with relative fluorescent intensity ± SEM. (C) We performed a concentration curve of A1ATM383S-CF or its SCR peptide control (241 pM to 12 μM) and assessed NET formation in PMNs isolated from healthy adults using live cell imaging as in panel A. PMNs were pretreated for 1 hour with either A1ATM383S-CF or its SCR peptide control before stimulation with LPS (100 ng/mL; 2 hours). Images are representative of 3 separate experiments using PMNs from 3 different donors. (D) A standardized grid system was used to semiquantitate NET formation by PMNs treated as in panel C. The y-axis depicts NET formation with NETs crossing standardized grid lines/high-power field (hpf) (± SEM). (E) We pretreated PMNs with recombinant HTRA1 (rHTRA1) alone (1 nM) or full-length A1AT alone (1 nM) for 1 hour before stimulation with LPS (100 ng/mL; 2 hours). NET formation was assessed by live cell imaging as in panel A. Images are representative of 3 different experiments using PMNs isolated from 3 different donors. (F) We pretreated PMNs with nNIF (0.5 or 1.2 μM), A1ATM383S-CF (0.5 or 1.2 μM), or full-length human recombinant A1AT (0.5 or 1.2 μM) for 1 hour before stimulation with LPS (100 ng/mL; 2 hours). NET formation was quantified by using a high-throughput DNA fluorescence assay for PMNs treated as in panel A. The y-axis represents NET formation with relative fluorescent intensity over baseline, arbitrarily set at 1 (±SEM). (G) PMNs were pretreated with the cell-free incubation reaction products of placental extracted or rHTRA1 (0.08 mg/mL) with full-length A1AT (0.8 mg/mL) for 1 hour before stimulation with LPS (100 ng/mL; 2 hours). NET formation was assessed by live cell imaging as in panel A. Images are representative of 3 different experiments using PMNs isolated from 3 different PMN donors. Scale bars, 50 μm for all images in this figure. *P < .05, **P < .01, ***P < .001.
A1ATM383S-CF inhibits NET formation by PMNs isolated from healthy adults. A1ATM383S-CF as well as its SCR peptide control were synthesized for use in in vitro assays of NET formation. (A) PMNs were pretreated with A1ATM383S-CF (1.2 μM) or nNIF (1.2 μM) or their SCR control peptides for 1 hour before stimulation with PMA (20 nM; 2 hours). NET formation was assessed by live cell imaging using confocal microscopy with DNA stains, one that is cell permeable (SYTO Green [Thermo Fisher Scientific], nuclear DNA, green) and the other that is cell impermeable (SYTOX Orange [Thermo Fisher Scientific], NETs, magenta). Images are representative of 4 different experiments in PMNs isolated from 4 different donors. (B) NET formation was quantified by using a high-throughput DNA fluorescence assay for PMNs treated as in panel A. The y-axis represents NET formation with relative fluorescent intensity ± SEM. (C) We performed a concentration curve of A1ATM383S-CF or its SCR peptide control (241 pM to 12 μM) and assessed NET formation in PMNs isolated from healthy adults using live cell imaging as in panel A. PMNs were pretreated for 1 hour with either A1ATM383S-CF or its SCR peptide control before stimulation with LPS (100 ng/mL; 2 hours). Images are representative of 3 separate experiments using PMNs from 3 different donors. (D) A standardized grid system was used to semiquantitate NET formation by PMNs treated as in panel C. The y-axis depicts NET formation with NETs crossing standardized grid lines/high-power field (hpf) (± SEM). (E) We pretreated PMNs with recombinant HTRA1 (rHTRA1) alone (1 nM) or full-length A1AT alone (1 nM) for 1 hour before stimulation with LPS (100 ng/mL; 2 hours). NET formation was assessed by live cell imaging as in panel A. Images are representative of 3 different experiments using PMNs isolated from 3 different donors. (F) We pretreated PMNs with nNIF (0.5 or 1.2 μM), A1ATM383S-CF (0.5 or 1.2 μM), or full-length human recombinant A1AT (0.5 or 1.2 μM) for 1 hour before stimulation with LPS (100 ng/mL; 2 hours). NET formation was quantified by using a high-throughput DNA fluorescence assay for PMNs treated as in panel A. The y-axis represents NET formation with relative fluorescent intensity over baseline, arbitrarily set at 1 (±SEM). (G) PMNs were pretreated with the cell-free incubation reaction products of placental extracted or rHTRA1 (0.08 mg/mL) with full-length A1AT (0.8 mg/mL) for 1 hour before stimulation with LPS (100 ng/mL; 2 hours). NET formation was assessed by live cell imaging as in panel A. Images are representative of 3 different experiments using PMNs isolated from 3 different PMN donors. Scale bars, 50 μm for all images in this figure. *P < .05, **P < .01, ***P < .001.
We then used a more physiologically relevant agonist for NET formation, lipopolysaccharide (LPS), and assessed qualitatively and quantitatively A1ATM383S-CF potency for NET inhibition. A1ATM383S-CF inhibited NET formation by LPS-stimulated human PMNs in a concentration-dependent manner (Figure 3C-D). Finally, we incubated recombinant or placenta-derived HTRA1 with recombinant A1AT and determined if the resulting reaction product inhibits NET formation through the generation of A1ATM383S-CF. PMNs stimulated with LPS in the presence of placenta-derived HTRA1 (data not shown), recombinant HTRA1, or A1AT alone generated NETs, indicating that HTRA1 or A1AT by themselves do not inhibit NET formation at micromolar concentrations (Figure 3E-F). However, the combination of recombinant or placental HTRA1 with A1AT resulted in a reaction product that decreased NET formation (Figure 3G). Taken together, these data strongly suggest HTRA1 cleavage of A1AT results in the generation of an NIP, A1ATM383S-CF.
A1ATM383S-CF does not inhibit other key neutrophil activities in vitro
To further determine the effects of A1ATM383S-CF on neutrophil function, we studied its effect on other key PMN activities, including chemotaxis, reactive oxygen species generation, phagocytosis, and intracellular microbial killing. Using a Transwell plate system (Corning), A1ATM383S-CF and nNIF effects on chemotaxis in response to interleukin-8 were assessed. No significant differences were detected in PMN chemotaxis when PMNs were preincubated with A1ATM383S-CF or nNIF compared with their respective SCR peptide or vehicle controls (Figure 4A). In addition, no differences were observed in reactive oxygen species generation in the presence or absence of A1ATM383S-CF compared with SCR peptides (Figure 4B). We also detected no significant differences in PMN phagocytosis of green fluorescent protein–labeled Escherichia coli when PMNs were incubated with A1ATM383S-CF or SCR peptide control (Figure 4C-D). Finally, we examined bacterial killing of a pathogenic strain of E coli by LPS-stimulated PMNs. A1ATM383S-CF–treated PMNs exhibited a significant decrease in bacterial killing compared with vehicle control PMNs and the SCR peptide control (Figure 4E). Of note, A1ATM383S-CF decreased total bacterial killing in this model to the level of DNase-treated controls. Treatment with DNase after LPS-induced NET formation limits NET-mediated extracellular bacterial killing, as the DNase degrades NETs formed in response to LPS. Taken together, our data show that A1ATM383S-CF decreases bacterial killing through NET inhibition while maintaining other key PMN functions.
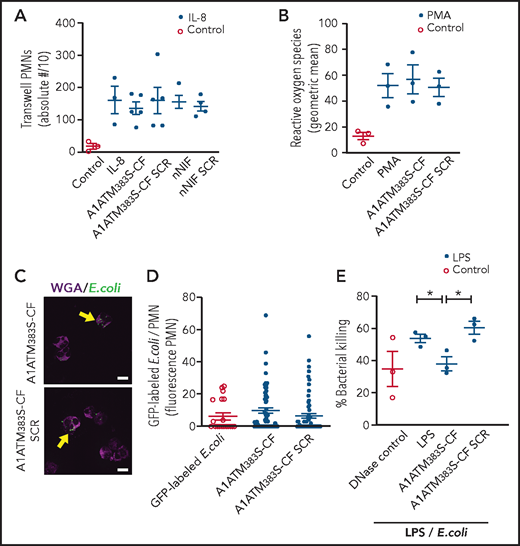
A1ATM383S-CF inhibits NET-mediated bacterial killing but does not inhibit neutrophil chemotaxis, reactive oxygen species (ROS) generation, or phagocytosis. PMNs were isolated from healthy adult donors for these experiments. All PMNs were pretreated ± vehicle, A1ATM383S-CF (1.2 μM), nNIF (1.2 μM), or their SCR peptide controls. (A) Chemotaxis was determined by using recombinant interleukin-8 (70 pg/mL) as a chemoattractant in a modified Boyden chamber. The y-axis depicts the absolute number of neutrophils transversing the Transwell membrane/10 ± SEM. N = 3 to 5 samples per group. (B) ROS generation was determined by using the flow cytometric dihydrorhodamine assay. The y-axis depicts ROS generation (geometric mean ± SEM). N = 3 samples per group. PMN phagocytosis was determined after a 1-hour preincubation with A1ATM383S-CF or SCR peptide control (1.2 μM) using 488 nm fluorescently labeled E coli (multiplicity of infection, 3:1). Immunocytochemistry was used to determine the number and fluorescent intensity of green fluorescent protein (GFP)-labeled E coli inside each PMN (yellow arrows). (C) Representative images of PMN phagocytosis at 1.2 μM concentrations of A1ATM383S-CF or SCR peptide control (N = 3). Scale bars, 10 μm. (D) A1ATM383S-CF or SCR peptide control treatment (1.2 μM). The y-axis depicts GFP fluorescence per PMN ± SEM for control and A1ATM383S-CF or SCR peptide control–treated PMNs. N = 3 experiments with 20 to 70 individual PMNs assessed in each group. (E) We determined NET-mediated bacterial killing of a pathogenic strain of E coli by LPS-stimulated (100 ng/mL; 1 hour) PMNs ± A1ATM383S-CF or SCR peptide control (1.2 μM). Micrococcal DNase (1850 mU/mL) was added to LPS-stimulated PMNs to break up NETs formed after LPS stimulation but before incubation with the E coli, and it served as a positive control for inhibition of NET-mediated extracellular bacterial killing. The y-axis depicts percentage of bacterial killing ± SEM for the 3 treatment groups. *P < .05.
A1ATM383S-CF inhibits NET-mediated bacterial killing but does not inhibit neutrophil chemotaxis, reactive oxygen species (ROS) generation, or phagocytosis. PMNs were isolated from healthy adult donors for these experiments. All PMNs were pretreated ± vehicle, A1ATM383S-CF (1.2 μM), nNIF (1.2 μM), or their SCR peptide controls. (A) Chemotaxis was determined by using recombinant interleukin-8 (70 pg/mL) as a chemoattractant in a modified Boyden chamber. The y-axis depicts the absolute number of neutrophils transversing the Transwell membrane/10 ± SEM. N = 3 to 5 samples per group. (B) ROS generation was determined by using the flow cytometric dihydrorhodamine assay. The y-axis depicts ROS generation (geometric mean ± SEM). N = 3 samples per group. PMN phagocytosis was determined after a 1-hour preincubation with A1ATM383S-CF or SCR peptide control (1.2 μM) using 488 nm fluorescently labeled E coli (multiplicity of infection, 3:1). Immunocytochemistry was used to determine the number and fluorescent intensity of green fluorescent protein (GFP)-labeled E coli inside each PMN (yellow arrows). (C) Representative images of PMN phagocytosis at 1.2 μM concentrations of A1ATM383S-CF or SCR peptide control (N = 3). Scale bars, 10 μm. (D) A1ATM383S-CF or SCR peptide control treatment (1.2 μM). The y-axis depicts GFP fluorescence per PMN ± SEM for control and A1ATM383S-CF or SCR peptide control–treated PMNs. N = 3 experiments with 20 to 70 individual PMNs assessed in each group. (E) We determined NET-mediated bacterial killing of a pathogenic strain of E coli by LPS-stimulated (100 ng/mL; 1 hour) PMNs ± A1ATM383S-CF or SCR peptide control (1.2 μM). Micrococcal DNase (1850 mU/mL) was added to LPS-stimulated PMNs to break up NETs formed after LPS stimulation but before incubation with the E coli, and it served as a positive control for inhibition of NET-mediated extracellular bacterial killing. The y-axis depicts percentage of bacterial killing ± SEM for the 3 treatment groups. *P < .05.
We next determined whether A1ATM383S-CF inhibits nuclear decondensation as an initial step in the regulated cell death process termed NETosis leading to NET formation. We reported significantly decreased nuclear size after PMA stimulation for PMNs preincubated with A1ATM383S-CF compared with its SCR peptide and vehicle controls (supplemental Figure 2). Furthermore , preincubation with Cl-amidine, a nonphysiological peptidyl arginine deiminase 4 (PAD4) inhibitor, displayed a similar effect, suggesting the possibility that A1ATM383S-CF inhibits nuclear decondensation through PAD4 inhibition. We also assessed A1ATM383S-CF effects on histone citrullination via western blotting and found that A1ATM383S-CF statistically decreased histone H3 citrullination at 30 minutes compared with the SCR peptide control. These data show that, similar to nNIF, A1ATM383S-CF inhibits nuclear decondensation and subsequent NETosis, and are consistent with possible PAD4 inhibition.
In addition to PAD4 histone citrullination, other signaling pathways associated with NETosis include neutrophil elastase (NE)-initiated nuclear histone degradation and inflammasome-triggered cleavage of gasdermin D leading to plasma membrane rupture. We therefore examined these pathways as well. We determined that A1ATM383S-CF fails to directly inhibit NE activity in cell-free assays and does not affect NE release during LPS-induced PMN degranulation in vitro (supplemental Figure 3). We also determined that A1ATM383S-CF failed to inhibit caspase 11 activity and caspase 11–mediated cleavage of recombinant gasdermin D in cell-free assays as well as gasdermin D cleavage in PMA-stimulated human PMNs in vitro (supplemental Figure 4).
Placental HTRA1 generates A1ATM383S-CF, which inhibits NET formation in vivo
To extend our findings in vivo, we began by determining if NET formation by PMNs isolated from C57BL/6 wild-type mouse pups is delayed during the first weeks of life in a manner similar to our published findings in prematurely born human neonates.6 As hypothesized, PMNs isolated from C57BL/6 mouse pups immediately after birth and 5 days after birth produced significantly less NETs in vitro after LPS stimulation compared with murine PMNs isolated from C57BL/6 pups 8, 10, and 16 days after birth (Figure 5A-B). We next tested C57BL/6 mouse pup plasma isolated immediately after birth for NET-inhibitory activity. We found that plasma isolated from WT pups immediately after birth inhibited NET formation by PMNs isolated from mature mice (Figure 5C-D).
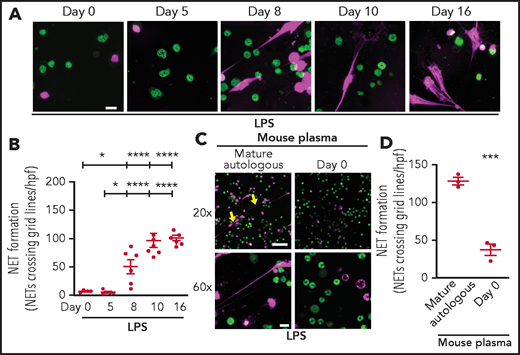
Neutrophils isolated from mouse pups fail to form NETs; a recapitulation of human peripartum NETosis inhibition. (A) NET formation in response to LPS stimulation (100 ng/mL; 1 hour) was detected in mouse PMNs isolated from C57BL/6 pups on days 0, 5, 8, 10, and 16 following birth. Confocal microscopy images of NET formation were obtained by using DNA stains, one that is cell permeable (SYTO Green, nuclear DNA, green) and the other that is cell impermeable (SYTOX Orange, NETs, magenta). Images are representative of 4 to 7 different experiments in PMNs isolated from 4 to 7 separate mouse pups per group. Scale bar, 10 μm. (B) A grid system was used to semiquantitatively assess NET formation. The y-axis depicts NET formation with NETs crossing standardized grid lines/high-power field (hpf) (± SEM). (C) Plasma “switch” experiments were performed, and NET formation was assessed by using PMNs isolated from mature mice ± a 1-hour pretreatment with day 0 mouse pup plasma. PMNs were then stimulated with LPS (100 ng/mL; 1 hour) and live cell imaging performed as in panel A. Images are representative of 3 different experiments in PMNs isolated from 3 separate mouse pups per group. Yellow arrows indicate NET formation. Scale bars, 50 μm (10 μm for the 20× and 60× magnification images, respectively). (D) A grid system was used to semiquantitatively assess NET formation. The y-axis depicts NET formation with NETs crossing standardized grid lines/hpf (± SEM) . *P < .05 and ****P < .0001 for comparison of day 8 and days 10 and 16 with day 0 and day 5, respectively; ***P < .001.
Neutrophils isolated from mouse pups fail to form NETs; a recapitulation of human peripartum NETosis inhibition. (A) NET formation in response to LPS stimulation (100 ng/mL; 1 hour) was detected in mouse PMNs isolated from C57BL/6 pups on days 0, 5, 8, 10, and 16 following birth. Confocal microscopy images of NET formation were obtained by using DNA stains, one that is cell permeable (SYTO Green, nuclear DNA, green) and the other that is cell impermeable (SYTOX Orange, NETs, magenta). Images are representative of 4 to 7 different experiments in PMNs isolated from 4 to 7 separate mouse pups per group. Scale bar, 10 μm. (B) A grid system was used to semiquantitatively assess NET formation. The y-axis depicts NET formation with NETs crossing standardized grid lines/high-power field (hpf) (± SEM). (C) Plasma “switch” experiments were performed, and NET formation was assessed by using PMNs isolated from mature mice ± a 1-hour pretreatment with day 0 mouse pup plasma. PMNs were then stimulated with LPS (100 ng/mL; 1 hour) and live cell imaging performed as in panel A. Images are representative of 3 different experiments in PMNs isolated from 3 separate mouse pups per group. Yellow arrows indicate NET formation. Scale bars, 50 μm (10 μm for the 20× and 60× magnification images, respectively). (D) A grid system was used to semiquantitatively assess NET formation. The y-axis depicts NET formation with NETs crossing standardized grid lines/hpf (± SEM) . *P < .05 and ****P < .0001 for comparison of day 8 and days 10 and 16 with day 0 and day 5, respectively; ***P < .001.
To show in vivo that placental HTRA1 cleaves A1AT to generate A1ATM383S-CF and inhibit NET formation, we used a mouse model in which HTRA1 is globally deleted (HTRA1−/−). We first assessed whether plasma from HTRA1−/− neonatal pups at 4 to 6 days and 7 to 10 days after birth contained lower concentrations of NIPs compared with littermate control HTRA1+/+ pups. According to western blot analysis, less NIPs (<5 kD carboxy-terminal fragments of A1AT) was observed in HTRA1−/− pups compared with HTRA1+/+ littermate controls 4 to 6 days after birth and no NIPs in either HTRA1−/− or HTRA1+/+ littermate controls at 7 to 10 days after birth (Figure 6A). Furthermore, plasma samples obtained from HTRA1−/− mouse pups in 3 different age groups (days 1-3, 4-6, and 7-10 after birth) exhibited significant decreases in NET-inhibitory capacity on days 1 to 3 and days 4 to 6 after birth when preincubated with LPS-stimulated, freshly isolated mature murine PMNs compared with plasma from littermate controls (Figure 6B). Finally, we isolated PMNs from HTRA1−/− pups and HTRA+/+ littermate controls for in vitro assessment of NET formation. PMNs isolated from HTRA1−/− and their littermate controls generated very little NET formation 1 to 3 days after birth (Figure 6C-D). However, PMNs isolated from HTRA1−/− pups 4 to 6 days after birth and stimulated with LPS generated significantly more NETs compared with their HTRA1+/+ littermate controls. By 7 to 10 days after birth, both HTRA1+/+ littermate controls and HTRA1−/− pups generated NETs in response to LPS. These data strongly suggest placenta-derived HTRA1 as a putative serine protease responsible for generating NIPs in vivo and regulating neonatal PMN NET formation.
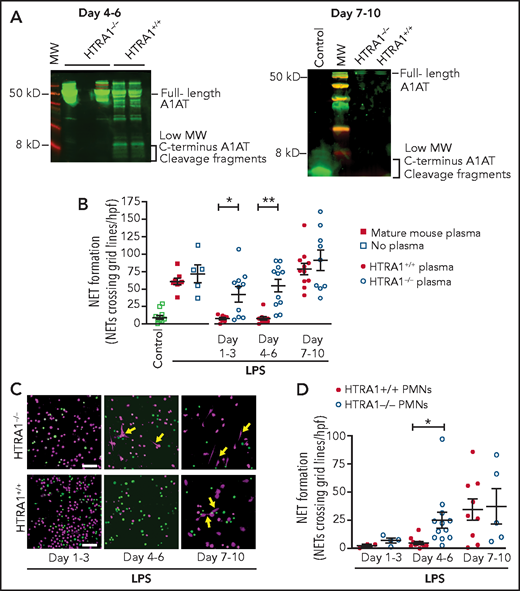
HTRA1 generates A1ATM383S-CF in vivo, which decreases early NET formation in neonatal mouse pups. (A) We tested plasma isolated from mouse pups, both HTRA1+/+ littermate controls and HTRA1−/−, for low-molecular-weight HTRA1 C-terminus cleavage fragments via western blotting between days 4 to 6 and 7 to 10 following birth. The western blots shown are representative of 3 separate experiments using 3 different mouse pups per group. (B) Plasma “switch” experiments were performed by using plasma isolated 1 to 3, 4 to 6, or 7 to 10 days following birth from both HTRA1+/+ (filled circles) and HTRA1−/− (open circles) mouse pups. Mature C57BL/6 mouse plasma served as a negative control (open and filled squares). We preincubated PMNs isolated from mature mouse bone marrow with mouse pup plasma or mature mouse control plasma for 1 hour before stimulation with LPS (100 ng/mL; 1 hour). NET formation was quantified by using a standardized grid system. The y-axis depicts NET formation with NETs crossing standardized grid lines/high-power field (hpf) ± SEM. We next isolated PMNs from mouse pups, both HTRA1+/+ (filled circles) and HTRA1−/− (open circles), at the indicated times and stimulated them with LPS (100 ng/mL; 1 hour). NET formation was assessed qualitatively via live cell imaging (C) and semiquantitatively by using a standardized grid system (D). Yellow arrows indicate NET formation. Images are representative of 3 to 12 separate experiments using between 3 and 12 different mouse pups per group. Scale bars, 50 μm. *P < .05, **P < .01. MW, molecular weight.
HTRA1 generates A1ATM383S-CF in vivo, which decreases early NET formation in neonatal mouse pups. (A) We tested plasma isolated from mouse pups, both HTRA1+/+ littermate controls and HTRA1−/−, for low-molecular-weight HTRA1 C-terminus cleavage fragments via western blotting between days 4 to 6 and 7 to 10 following birth. The western blots shown are representative of 3 separate experiments using 3 different mouse pups per group. (B) Plasma “switch” experiments were performed by using plasma isolated 1 to 3, 4 to 6, or 7 to 10 days following birth from both HTRA1+/+ (filled circles) and HTRA1−/− (open circles) mouse pups. Mature C57BL/6 mouse plasma served as a negative control (open and filled squares). We preincubated PMNs isolated from mature mouse bone marrow with mouse pup plasma or mature mouse control plasma for 1 hour before stimulation with LPS (100 ng/mL; 1 hour). NET formation was quantified by using a standardized grid system. The y-axis depicts NET formation with NETs crossing standardized grid lines/high-power field (hpf) ± SEM. We next isolated PMNs from mouse pups, both HTRA1+/+ (filled circles) and HTRA1−/− (open circles), at the indicated times and stimulated them with LPS (100 ng/mL; 1 hour). NET formation was assessed qualitatively via live cell imaging (C) and semiquantitatively by using a standardized grid system (D). Yellow arrows indicate NET formation. Images are representative of 3 to 12 separate experiments using between 3 and 12 different mouse pups per group. Scale bars, 50 μm. *P < .05, **P < .01. MW, molecular weight.
Because neonates are susceptible to sepsis shortly after delivery, and pathogenic NET formation can lead to increased inflammation, we queried whether A1ATM383S-CF alters NET formation and survival in a neonatal cecal slurry sepsis model19,20 in a manner similar to mature mice in the cecal ligation and puncture model of polymicrobial sepsis.6 Intraperitoneal injection of NET-competent C57BL/6 neonatal pups was performed 7 to 10 days after birth with A1ATM383S-CF or SCR peptide control followed by 1.3 mg/g body weight of intraperitoneal cecal slurry. In addition, Cl-amidine, a PAD4 inhibitor and known inhibitor of NETs, and DNase 1, a NET-dismantling agent, were used as controls for NET inhibition. For all groups, survival was monitored over a 96-hour period. Treatment of neonatal mice with A1ATM383S-CF improved survival compared with the vehicle control (Figure 7A). Treatment with Cl-amidine or DNase 1 also improved survival, suggesting that the improvement in survival seen in response to A1ATM383S-CF treatment in this model correlated with its NET-inhibitory effect. In agreement with this, A1ATM383S-CF treatment decreased intraperitoneal NET formation at 3 hours after cecal slurry injection compared with the SCR peptide control (Figure 7B).
![A1ATM383S-CF improves survival in the cecal slurry injection preclinical model of neonatal sepsis. (A) We compared survival of C57BL/6 mouse pups (7-10 days following birth) treated intraperitoneally 1 hour before and 4 hours after intraperitoneal cecal slurry injection (1.3 mg/g mouse body weight) with A1ATM383S-CF (N = 16; 10 mg/kg mouse body weight; red dashed line), SCR peptide control (N = 11; 10 mg/kg; red solid line), or DNase 1 (N = 14; 3 mg/g; NET dismantler; green solid line). Cl-amidine (N = 14; 40 mg/g; NET inhibitor; blue solid line) was injected 1 hour before intraperitoneal cecal slurry injection. Vehicle-treated control pups are denoted by the blue dashed line (N = 16). (B) Peritoneal fluid NET formation was assessed 3 hours after cecal slurry injection in 7- to 10-day old C57BL/6 mouse pups ± pretreatment with A1ATM383S-CF or SCR peptide control (1 hour; 10 mg/kg; intraperitoneal injection). NET formation was quantitated in the peritoneal fluid using the myeloperoxidase-DNA (MPO-DNA) ELISA. The y-axis depicts NETs: MPO-DNA complexes (optical density [OD] values − background). (C) We compared survival in the cecal slurry injection model of neonatal sepsis between 4- to 6-day old HTRA1+/+ littermate controls (N = 13; blue dashed line) and HTRA1−/− mouse pups (N = 11; solid red line). (D) We compared survival of HTRA1−/− mouse pups treated intraperitoneally 1 hour before and 4 hours after cecal slurry injection with A1ATM383S-CF (N = 7; 10 mg/kg mouse body weight; blue dashed line) or SCR peptide control (N = 7; 10 mg/kg; red solid line). *P < .05, **P < .01, ***P < .001. ns, no significant difference according to the log-rank (Mantel-Cox) statistical tool.](https://ash.silverchair-cdn.com/ash/content_public/journal/blood/138/11/10.1182_blood.2020009021/3/m_bloodbld2020009021f7.png?Expires=1767738231&Signature=RF6arGCMN3BJOX6gzvNjxdxPNFOZlTg0RDPLKTRz2MdwvZkDuGJwGMav3UmBzmZHZubp8VDgI8yTf1QeSkjIZwtKjC~5ov2M34R1B9sq49vB7nEEgGdOGzCvFRVJUOd1ZlETq5VR8Kebj1C-e7FUPLBWVSF61usKNLw9YOLelwFxgxb68Tw1vlJ-8gAosYlVyE92FGEoOKQrWPUFPRFU37KQCIqbajZIe~Ndk~LyyvjZ1hsU9q1vaXn1NBNeRj-ZRFqf-TXpXg3bHtBI9v0zb-ylJnrVfO5lLDP1QwGgQLmqkgTHAmh13ubpP1gyFMwATefR~9s5In2VVzJ3uPcZGQ__&Key-Pair-Id=APKAIE5G5CRDK6RD3PGA)
A1ATM383S-CF improves survival in the cecal slurry injection preclinical model of neonatal sepsis. (A) We compared survival of C57BL/6 mouse pups (7-10 days following birth) treated intraperitoneally 1 hour before and 4 hours after intraperitoneal cecal slurry injection (1.3 mg/g mouse body weight) with A1ATM383S-CF (N = 16; 10 mg/kg mouse body weight; red dashed line), SCR peptide control (N = 11; 10 mg/kg; red solid line), or DNase 1 (N = 14; 3 mg/g; NET dismantler; green solid line). Cl-amidine (N = 14; 40 mg/g; NET inhibitor; blue solid line) was injected 1 hour before intraperitoneal cecal slurry injection. Vehicle-treated control pups are denoted by the blue dashed line (N = 16). (B) Peritoneal fluid NET formation was assessed 3 hours after cecal slurry injection in 7- to 10-day old C57BL/6 mouse pups ± pretreatment with A1ATM383S-CF or SCR peptide control (1 hour; 10 mg/kg; intraperitoneal injection). NET formation was quantitated in the peritoneal fluid using the myeloperoxidase-DNA (MPO-DNA) ELISA. The y-axis depicts NETs: MPO-DNA complexes (optical density [OD] values − background). (C) We compared survival in the cecal slurry injection model of neonatal sepsis between 4- to 6-day old HTRA1+/+ littermate controls (N = 13; blue dashed line) and HTRA1−/− mouse pups (N = 11; solid red line). (D) We compared survival of HTRA1−/− mouse pups treated intraperitoneally 1 hour before and 4 hours after cecal slurry injection with A1ATM383S-CF (N = 7; 10 mg/kg mouse body weight; blue dashed line) or SCR peptide control (N = 7; 10 mg/kg; red solid line). *P < .05, **P < .01, ***P < .001. ns, no significant difference according to the log-rank (Mantel-Cox) statistical tool.
A1ATM383S-CF improves survival in the cecal slurry injection preclinical model of neonatal sepsis. (A) We compared survival of C57BL/6 mouse pups (7-10 days following birth) treated intraperitoneally 1 hour before and 4 hours after intraperitoneal cecal slurry injection (1.3 mg/g mouse body weight) with A1ATM383S-CF (N = 16; 10 mg/kg mouse body weight; red dashed line), SCR peptide control (N = 11; 10 mg/kg; red solid line), or DNase 1 (N = 14; 3 mg/g; NET dismantler; green solid line). Cl-amidine (N = 14; 40 mg/g; NET inhibitor; blue solid line) was injected 1 hour before intraperitoneal cecal slurry injection. Vehicle-treated control pups are denoted by the blue dashed line (N = 16). (B) Peritoneal fluid NET formation was assessed 3 hours after cecal slurry injection in 7- to 10-day old C57BL/6 mouse pups ± pretreatment with A1ATM383S-CF or SCR peptide control (1 hour; 10 mg/kg; intraperitoneal injection). NET formation was quantitated in the peritoneal fluid using the myeloperoxidase-DNA (MPO-DNA) ELISA. The y-axis depicts NETs: MPO-DNA complexes (optical density [OD] values − background). (C) We compared survival in the cecal slurry injection model of neonatal sepsis between 4- to 6-day old HTRA1+/+ littermate controls (N = 13; blue dashed line) and HTRA1−/− mouse pups (N = 11; solid red line). (D) We compared survival of HTRA1−/− mouse pups treated intraperitoneally 1 hour before and 4 hours after cecal slurry injection with A1ATM383S-CF (N = 7; 10 mg/kg mouse body weight; blue dashed line) or SCR peptide control (N = 7; 10 mg/kg; red solid line). *P < .05, **P < .01, ***P < .001. ns, no significant difference according to the log-rank (Mantel-Cox) statistical tool.
We next compared survival after cecal slurry injection in HTRA1−/− and HTRA1+/+ littermate control pups at 4 to 6 days after birth when HTRA1−/− pups are NET competent and HTRA1+/+ littermate controls are not. Surprisingly, HTRA1+/+ and HTRA1−/− pups had similar survival (Figure 7C). These similar survival curves may be due in part to the global, instead of placenta-specific, knockout of HTRA1. However, HTRA1−/− pups treated with A1ATM383S-CF before intraperitoneal cecal slurry injection were significantly protected compared with HTRA1−/− pups treated with SCR peptide control (Figure 7D). These data suggest that inhibition of NET formation during experimental neonatal sepsis improves survival.
Discussion
Neutrophils have many functions critical to host defense against invading pathogens,9,21 including degranulation, chemotaxis toward inflammatory niduses, microbial phagocytosis, reactive oxygen species generation, and intracellular killing. Although deficits in neonatal neutrophil function exist, many such deficits result from inadequate microbial opsonization, not from intrinsic deficits of neonatal neutrophils.22 Thus, our discovery that PMNs isolated from umbilical cord blood fail to form NETs in vitro prompted further investigation into the etiology of this element of neonatal neutrophil dysfunction.23 Subsequently, our laboratory discovered that impaired NET formation by umbilical cord blood isolated neutrophils results not from an intrinsic, developmental deficit but from circulating NIPs in the fetal blood.6,23 Interestingly, we identified the NIP as an ∼4 kD fragment of the C-terminus of A1AT, generated by an unknown serine protease acting on A1AT through proteolytic cleavage. Although the identity of the serine protease responsible for the generation of this NIP had remained elusive, our data now strongly suggest HTRA1 as a placentally expressed serine protease responsible for cleaving A1AT and generating circulating NIPs.
HTRA1 belongs to the high-temperature requirement serine protease A family first identified in bacteria.24 HTRA1 is essential for bacterial survival at high temperatures as the serine protease chaperones and degrades misfolded proteins.25 In humans, the physiological function of HTRA1 remains unclear, but altered expression of HTRA1 correlates with multiple disease states, including arthritis, macular degeneration, small vessel vascular disease, cancer, and preeclampsia.26-29 Some of these disease states have been successfully modeled in mice, and the phenotype of the HTRA1−/− mouse shows failure of vascular smooth muscle contraction and maturation,30 decreased retinal vascular development,17 and decreased cartilage degradation in models of osteoarthritis.31
Human expression of HTRA1 is highest in the placenta, with expression increasing over the course of pregnancy and maximal expression occurring in the third trimester15; expression is highest in the syncytiotrophoblasts.6,32,33 The current study found that HTRA1 is present in both preterm and term placentas. Interestingly, our immunofluorescence studies show that HTRA1 fails to colocalize with A1AT in the placenta. We also measured HTRA1 expression in umbilical cord blood plasma, as it is a secreted serine protease. Significantly higher HTRA1 levels were found in cord blood plasma compared with adult plasma. Furthermore, HTRA1 levels in neonatal plasma decline rapidly when umbilical cord blood plasma is compared with neonatal plasma levels 3 days after birth. Strikingly, the decrease in HTRA1 levels 3 days after delivery coincides with decreased NIP levels and with neonatal PMNs becoming NET competent. Of note, our results show that A1AT levels are not significantly different in plasma from neonates and adults. Because NIP levels decrease after delivery, corresponding with decreased plasma HTRA1, our data strongly point to the placenta as the source of HTRA1, a placentally expressed serine protease responsible for generating NIPs in utero.
We next determined whether HTRA1 from 3 different sources (recombinant, umbilical cord blood plasma, or placental extracted) could cleave A1AT in cell-free assays to generate NIPs. All 3 sources of HTRA1 generated the same ∼4 kD peptide A1ATM383S-CF, consistent with our sequence analysis of the C-terminus of A1AT and verified by using mass spectroscopy. A1ATM383S-CF inhibits NET formation in a dose-dependent manner and inhibits NET formation in response to multiple different stimuli, similar to nNIF. Furthermore, similar to nNIF, key neutrophil functions such as phagocytosis, chemotaxis, and reactive oxygen species generation are not inhibited by A1ATM383S-CF. Mechanistically, NIPs such as nNIF block nuclear decondensation and histone citrullination, at least partially through a PAD4-dependent mechanism.6 A1ATM383S-CF seems to work through similar mechanisms by inhibiting nuclear decondensation and histone citrullination (supplemental Figure 2). A1ATM383S-CF also seems to have little effect on NE activity or NE release through degranulation (supplemental Figure 3). Furthermore, A1ATM383S-CF also does not alter cleavage of gasdermin D, another potential mechanistic target for NIPs (supplemental Figure 4). However, how NIPs enter the neutrophil to block nuclear decondensation and downstream signaling associated with NET formation remains unknown.
Similar to plasma from humans, plasma from WT neonatal mice expresses low-molecular-weight A1AT C-terminus cleavage fragments, and their neutrophils fail to form NETs in response to NET-inducing agonists such as LPS. To our knowledge, this report is the first showing that NET inhibition in the peripartum period is conserved across species. Again, similar to humans, our data strongly suggest that a plasma factor is responsible for NET inhibition during this time frame as neonatal mouse pup plasma robustly inhibits NET formation by LPS-stimulated mature C57BL/6 mouse neutrophils. Interestingly, this time window also corresponds to when we observed circulating NIP-like fragments of A1AT in plasma from C57BL/6 pups. Plasma isolated from HTRA1−/− mice, unlike plasma from HTRA1+/+ littermate controls, exhibits minimal cleavage of A1AT, with no detectable cleavage observed at 4 to 10 days after birth. When NET-competent mature mouse neutrophils are incubated with plasma from neonatal HTRA1−/− mice, robust NET formation still occurs in response to LPS, which is in stark contrast to mature neutrophils incubated with HTRA1+/+ neonatal plasma. To further clarify the role of HTRA1 in regulating NIP production and subsequent NET formation, we isolated neutrophils from HTRA1+/+ and littermate HTRA1−/− mice and examined NET formation. Neutrophils from HTRA1+/+ and HTRA1−/− pups both fail to form NETs within the first 3 days after birth. Our results suggest that within the first 3 days after birth, additional NET-inhibitory mechanisms such as neutrophil immaturity or an unknown additional plasma factor may account for this unexpected finding. However, by 4 to 6 days after birth, neutrophils isolated from HTRA1+/+ mice remain unable to form NETs, whereas neutrophils from HTRA1−/− mice produce robust NETs in response to LPS. Although our finding that 4- to 6-day-old HTRA1−/− pups exhibited no survival difference compared with HTRA1+/+ in the cecal slurry model of neonatal sepsis was unexpected, treatment of HTRA1−/− pups with A1ATM383S-CF significantly increased survival compared with pups treated with SCR peptide control. We speculate that this unexpected finding may be a consequence of global knockout of HTRA1, which is associated with other phenotypic characteristics such as intrauterine growth restriction32 and retinal development abnormalities.17 We believe further characterization of the immunologic sequelae of global HTRA1−/− is warranted and are pursuing these lines of inquiry in ongoing studies. Regardless, these data strongly suggest that placental HTRA1 is a primary serine protease responsible for NIP production in utero. Intriguingly, A1AT cleavage fragments seem to circulate longer in murine plasma than in humans. The reasons for this are currently unknown and are the focus of additional ongoing studies in our laboratory.
Fundamentally, it remains unclear why under physiological conditions NIPs are only found systemically in neonates. NIPs disappear within 3 days after birth in human neonates and are not detected in plasma from healthy adults.6 Because NETs may be observed in the placenta in pathological conditions such as preeclampsia,34 it is possible that NET-inducing agonists are present at the maternal–fetal interface. If unchecked, NET formation could potentially harm the growing fetus through NET-mediated inflammatory tissue damage. Our data suggest that the placenta plays an important protective role in regulating excessive NET formation by secreting HTRA1 throughout the pregnancy. Placental HTRA1 expression increases during pregnancy,29 and it is possible that NET-inducing agonists also increase during pregnancy. Thus, the placenta may serve an additional protective role during pregnancy by secreting HTRA1 to limit NET formation. Previous literature suggests that the absence or altered expression of HTRA1 is detrimental to the fetus.32 For these studies, we did not robustly characterize placental pathology in HTRA1−/− mice or assess for histopathologic correlates with placental markers of preeclampsia and, therefore, cannot draw conclusions regarding the effects of NIPs generated by HTRA1 on placental disease states. Yet, it is intriguing to hypothesize that dysregulated placental HTRA1 expression limits NIP expression in utero, leading to dysregulated NET formation and gestational morbidity.
Although the current study focused primarily on neonatal HTRA1, we hypothesize that HTRA1 may alter NET formation in other disease settings in which local concentrations of HTRA1 might influence NETosis. For example, HTRA1 levels are reduced in ulcerative colitis and colorectal cancer, in which dysregulated NET formation plays a pathological role in the disease process.35 In the context of aging, HTRA1 levels are significantly increased in patients with the geriatric syndrome known as frailty.36 Interestingly, NET formation in aged individuals is reduced consistent with increased HTRA1 levels found in the plasma. It remains unknown if HTRA1-dependent NIPs are found in these different settings, but we speculate that altered concentrations of HTRA1 or other serine proteases, which are capable of cleaving A1AT,37 may change the local or systemic concentration of NIPs, resulting in downregulated NETosis compared with physiological conditions.
Maintenance of immune tolerance after birth represents another potential function of NIPs generated by placentally expressed HTRA1 in the peripartum period (Visual Abstract). The transition from an in utero environment devoid of most microbes to the ex utero microbial morass requires immunotolerance as the neonate identifies and sorts pathogens from colonizing microbes. Neonates account for the majority of culture-proven sepsis in the pediatric age group.38 The neonatal response to sepsis is decidedly proinflammatory, with increased cytokine release from monocytes and dendritic cells leading to neutrophil activation.19,39 Failed NET inhibition in the peripartum period may lead to neutrophil hyperreactivity with excessive NET formation in response to both nonpathogenic colonization and pathogen-induced sepsis. Exaggerated postnatal NET formation in either circumstance might lead to increased organ dysfunction and mortality. Previously, we reported that NIPs are protective in bacterial sepsis in mature mice,6 and we have now extended these findings using A1ATM383S-CF as a therapeutic in a neonatal model of sepsis. Coinciding with increased survival, A1ATM383S-CF decreased NET formation in the peritoneal cavity, suggesting that the improved survival was at least partly mediated by the lack of pathogenic NET formation. In further support of the role of NETs as pathogenic in neonatal sepsis, Cl-amidine and DNase 1 (both known to decrease NET formation either through PAD4 inhibition or dismantling already released NETs, respectively) increased survival similarly to A1ATM383S-CF. Taken together, these findings indicate that NIPs such as A1ATM383S-CF may have potential as anti-inflammatory therapy in neonates in whom exaggerated NET formation leads to increased inflammation, morbidity, and mortality.
Acknowledgments
The authors thank Diana Lim for graphic design expertise and figure preparation, and Guy Zimmerman, Matthew Rondina, Hansjorg Schwertz, Jesse Rowley, and Andrew Weyrich for insightful discussions. The authors also thank the University of Utah DNA/Peptide Synthesis, Flow Cytometry, and Mass Spectroscopy cores .
This work was supported by National Institutes of Health (NIH) Eunice Kennedy Shriver National Institute of Child Health and Human Development grant R01HD093826 (C.C.Y.); NIH National Institute on Aging grant K01AG059892 and National Heart, Lung, and Blood Institute (NHLBI) grant R33HL141783 (both R.A.C.); NIH NHLBI grant R33HL141783 (H.D.C.) and Utah StrokeNet, National Institute of Neurological Disorders and Stroke grant U24NS107228 and American Heart Association grant 830138 (both F.D.). The flow cytometry–generated research reported in this publication was also supported by the NIH National Center for Research Resources under Award 1S10OD026959-01.
Authorship
Contribution: C.C.Y. and R.A.C. conceived of the project and designed the experiments; C.C.Y. and H.D.C. performed the patient phenotyping and obtained consent for neonatal and maternal study participation; R.A.C. provided statistical expertise; M.J.C., J.S.B., F.D., J.L.C., J.L.R., J.M., and R.A.C. conducted experiments; Y.K. and M.J.C. developed experimental tools and mouse models; R.A.C., F.D., and C.V.d.A. wrote portions of the manuscript; and R.A.C. and C.C.Y. provided overall direction for the project, reviewed and analyzed data from all experiments, wrote sections of the manuscript, and edited the whole manuscript.
Conflict-of-interest disclosure: C.C.Y. authors a US patent (patent no. 10,232,023 B2) held by the University of Utah for the use of NIPs for the “treatment of and prophylaxis against inflammatory disorders,” for which PEEL Therapeutics, Inc holds the exclusive license. The remaining authors declare no competing financial interests.
Correspondence: Christian C. Yost, Pediatrics, University of Utah School of Medicine, Eccles Institute of Human Genetics, Room 4220A, 15 North 2030 East, Salt Lake City, UT 84112; e-mail: christian.yost@u2m2.utah.edu.
The online version of this article contains a data supplement.
There is a Blood Commentary on this article in this issue.
The publication costs of this article were defrayed in part by page charge payment. Therefore, and solely to indicate this fact, this article is hereby marked “advertisement” in accordance with 18 USC section 1734.

This feature is available to Subscribers Only
Sign In or Create an Account Close Modal