

Key Points
RA-responsive mononuclear cells are increased in IL-23–rich human GI-GVHD tissue and are associated with poor outcome.
These cells have a GI-tropic IL-23R+ CD8 effector T-cell phenotype and are expanded by allostimulation in RA- and IL-23–rich conditions.

Abstract
Gastrointestinal (GI) graft-versus-host disease (GVHD) is a major barrier in allogeneic hematopoietic stem cell transplantation (allo-HSCT). The metabolite retinoic acid (RA) potentiates GI-GVHD in mice via alloreactive T cells expressing the RA receptor-α (RARα), but the role of RA-responsive cells in human GI-GVHD remains undefined. Therefore, we used conventional and novel sequential immunostaining and flow cytometry to scrutinize RA-responsive T cells in tissues and blood of patients who had received allo-HSCT and to characterize the impact of RA on human T-cell alloresponses. Expression of RARα by human mononuclear cells was increased after exposure to RA. RARαhi mononuclear cells were increased in GI-GVHD tissue, contained more cellular RA-binding proteins, localized with tissue damage, and correlated with GVHD severity and mortality. By using a targeted candidate protein approach, we predicted the phenotype of RA-responsive T cells in the context of increased microenvironmental interleukin-23 (IL-23). Sequential immunostaining confirmed the presence of a population of RARαhi CD8 T cells with the predicted phenotype that coexpressed the effector T-cell transcription factor T-bet and the IL-23–specific receptor (IL-23R). These cells were increased in GI- but not skin-GVHD tissues and were also selectively expanded in the blood of patients with GI-GVHD. Finally, functional approaches demonstrated that RA predominantly increased alloreactive GI-tropic RARαhi CD8 effector T cells, including cells with the phenotype identified in vivo. IL-23–rich conditions potentiated this effect by selectively increasing β7 integrin expression on CD8 effector T cells and reducing CD4 T cells with a regulatory cell phenotype. In summary, we have identified a population of RA-responsive effector T cells with a distinctive phenotype that is selectively expanded in human GI-GVHD and that represents a potential new therapeutic target.
Introduction
Acute graft-versus-host disease (aGVHD) is mediated by alloreactive donor T cells that recognize and destroy healthy recipient tissues, and it results in significant morbidity and mortality after allogeneic hematopoietic stem cell transplantation (allo-HSCT).1-3 aGVHD can target the skin and liver, but patients with disease that involves the gastrointestinal (GI) tract have the poorest outcome.4 Current strategies to prevent GI-GVHD lack specificity, and available therapies are unsatisfactory and cause significant toxicity. Better understanding of the tissue-specific pathways involved in the differentiation, expansion, and migration of alloreactive donor T cells that mediate GI-GVHD will help us find better ways to prevent or treat this barrier to successful allo-HSCT.
Retinoic acid (RA), a metabolite of vitamin A, is a ligand for the nuclear RA receptors (RAR) α, β, and γ, which dimerize with retinoid X receptors at RA-response element sites to recruit coactivator proteins and promote gene transcription. The interaction of RA with RARα increases T-cell homing capacity to the GI tract.5 In addition, RA has diverse effects on immune cells by influencing both antigen-presenting cell (APC) function and T-cell differentiation. RA signaling in the presence of transforming growth factor β promotes immune tolerance in vitro by increasing CD4 regulatory T-cell numbers and reducing cytokine production by CD4 effector T cells.6,7 RA production by APCs in GI-associated lymphoid tissue contributes to the maintenance of oral antigen–induced tolerance in vivo in steady-state conditions.8 However, RA has also been shown to be essential for effector T-cell lineage stability,9 and in proinflammatory conditions, RA increases CD4 T helper (Th)1 and Th17 effector T-cell responses10 and potentiates CD8 effector T-cell differentiation.11,12 Thus, the immune effects of RA are depend on its context; RA contributes to the maintenance of tolerance in steady-state conditions but promotes effector T-cell responses in inflammatory microenvironments.
Recent allo-HSCT studies in mice have shown that diets deficient in vitamin A reduce GI-GVHD13 and that RARα signaling in allogeneic donor T cells potentiates GI-GVHD by increasing T-cell GI migration and also by modifying T-cell differentiation.14,15 Furthermore, there is emerging evidence that RA-dependent T-cell differentiation may be influenced by cytokines that are increased in GI-GVHD, including interleukin-23 (IL-23), which reduces RA-induced expansion of CD4 regulatory T cells in other contexts,16 and IL-33, which enhances RA-signaling in CD4 T cells.17 Thus, RA and cytokines that influence the impact of RA on T-cell differentiation could represent important new therapeutic targets for preventing or treating GI-GVHD. However, the impact of RA at the tissue level in human GI-GVHD is currently unknown. We therefore combined analyses of tissue biopsies and peripheral blood from patients who had received an allo-HSCT and in vitro modeling to investigate the potential role of RA-responsive T cells in human GI-GVHD.
Materials and methods
Ethics approval
The study was approved by the London Research Ethical Committee (05/Q0605/140 and 06/Q0604/110) and conducted in accordance with the Declaration of Helsinki. Blood and tissue samples were obtained after patients provided signed informed consent.
Patients and biopsies
Biopsies were performed to investigate classical or late-onset aGVHD in 54 allo-HSCT patients with hematologic malignancies or bone marrow failure (males, n = 35; females, n = 19; median age, 51 years [range, 20-66 years]). Patients underwent granulocyte colony-stimulating factor–mobilized peripheral blood HSCT from HLA-matched (n = 50; 93%), single-antigen mismatched (n = 4; 7%), related (n = 20; 37%), or unrelated (n = 34; 63%) donors using mostly fludarabine-based reduced-intensity conditioning (n = 49; 91%) (Table 1). All patients received uniform pharmacologic immunoprophylaxis with short methotrexate and calcineurin inhibition weaned at day +90 in the absence of GVHD. Then, 118 formalin-fixed paraffin-embedded biopsies (107 from the GI tract; 11 from skin) from allo-HSCT patients performed before initiation of steroid therapy were studied along with an additional 8 GI biopsies from healthy controls with normal colonoscopies (supplemental Figures 1 and 2; supplemental Table 1, available on the Blood Web site). Biopsies were independently reviewed by an expert histopathologist (M.C.), and histologic GVHD was confirmed by using standard criteria.18 Clinical organ-specific aGVHD staging at the time of biopsy used modified Glucksberg criteria.19 Steroid refractoriness was defined as no improvement after 14 days of 1 to 2 mg/kg prednisolone or equivalent once per day. Peripheral blood CD3 T-cell donor chimerism was assessed at the time of first biopsy by variable number tandem repeat analysis as previously described (supplemental Figure 3).
Patient demographics, donor details, and transplant conditioning for allo-HSCT patients whose biopsies were included in study
| Patient UPN | Age, y | Diagnosis | Conditioning | Donor | HLA match |
|---|---|---|---|---|---|
| 1 | 32 | AML | RIC (Flu/Mel*) | Unrelated | M/m |
| 2 | 65 | CLL | RIC (Flu/Bu) | Unrelated | Matched |
| 3 | 36 | CML | RIC (Flu/Mel*) | Related | M/m |
| 4 | 50 | AML | RIC (Flu/Mel*) | Unrelated | M/m |
| 5 | 51 | Myeloma | RIC (Flu/Cy) | Related | Matched |
| 6 | 62 | FL (LPD) | RIC (Flu/Cy) | Unrelated | Matched |
| 7 | 62 | MDS | RIC (Flu/Cy) | Unrelated | Matched |
| 8 | 47 | Myeloma | RIC (Flu/Cy) | Unrelated | Matched |
| 9 | 51 | ALL | RIC (Flu/Cy) | Unrelated | Matched |
| 10 | 53 | NHL | RIC (Flu/Cy) | Unrelated | Matched |
| 11 | 32 | MDS | RIC (Flu/Cy) | Unrelated | Matched |
| 12 | 51 | MDS | RIC (Flu/Cy) | Unrelated | Matched |
| 13 | 44 | AML | RIC (Flu/Cy) | Related | Matched |
| 14 | 31 | ALL | MA (Cy/TBI) | Unrelated | Matched |
| 15 | 62 | MDS | RIC (Flu/Cy) | Unrelated | Matched |
| 16 | 58 | MCL (LPD) | RIC (Flu/Cy) | Related | Matched |
| 17 | 46 | MF | RIC (Flu/Cy) | Related | Matched |
| 18 | 59 | CLL (LPD) | RIC (Flu/Bu) | Unrelated | Matched |
| 19 | 41 | FL (LPD) | RIC (Flu/Cy) | Unrelated | Matched |
| 20 | 35 | CML | MA (Bu/Cy) | Related | Matched |
| 21 | 22 | ALL | MA (Bu/Cy) | Unrelated | Matched |
| 22 | 53 | AML | RIC (Flu/Cy) | Related | Matched |
| 23 | 57 | FL (LPD) | RIC (Flu/Cy) | Unrelated | Matched |
| 24 | 30 | ALL | MA (Cy/TBI) | Unrelated | Matched |
| 25 | 63 | AML | RIC (Flu/Cy) | Related | Matched |
| 26 | 66 | CLL (LPD) | RIC (Flu/Bu) | Unrelated | Matched |
| 27 | 64 | MCL (LPD) | RIC (Flu/Cy) | Related | Matched |
| 28 | 42 | HD (LPD) | RIC (BEAM)* | Unrelated | Matched |
| 29 | 59 | AML | RIC (Flu/Cy) | Related | Matched |
| 30 | 51 | MDS | RIC (Flu/Cy) | Related | Matched |
| 31 | 43 | ALL | RIC (Flu/Cy) | Related | Matched |
| 32 | 41 | MDS | RIC (Flu/Cy) | Unrelated | Matched |
| 33 | 33 | AA | RIC (Flu/Cy/TBI*) | Unrelated | Matched |
| 34 | 38 | ALL | RIC (Flu/Cy) | Related | Matched |
| 35 | 39 | CLL (LPD) | RIC (Flu/Mel*) | Unrelated | M/m |
| 36 | 20 | AML | RIC (Flu/Cy) | Unrelated | Matched |
| 37 | 43 | MDS | RIC (Flu/Cy) | Unrelated | Matched |
| 38 | 38 | ALL | RIC (Flu/Cy) | Unrelated | Matched |
| 39 | 56 | MCL (LPD) | RIC (Flu/Cy) | Related | Matched |
| 40 | 53 | MDS | RIC (Flu/Cy) | Unrelated | Matched |
| 41 | 41 | MCL (LPD) | RIC (Flu/Cy) | Related | Matched |
| 42 | 51 | AML | RIC (Flu/Cy) | Related | Matched |
| 43 | 60 | CLL (LPD) | RIC (Flu/Bu) | Unrelated | Matched |
| 44 | 64 | AML | RIC (Flu/Cy) | Related | Matched |
| 45 | 58 | MDS | RIC (Flu/Cy) | Unrelated | Matched |
| 46 | 47 | MDS | RIC (Flu/Cy) | Unrelated | Matched |
| 47 | 43 | FL (LPD) | RIC (Flu/Cy) | Unrelated | Matched |
| 48 | 65 | AML | RIC (Flu/Cy) | Unrelated | Matched |
| 49 | 64 | MCL (LPD) | RIC (Flu/Cy) | Related | Matched |
| 50 | 55 | CLL (LPD) | RIC (Flu/Bu) | Related | Matched |
| 51 | 48 | MDS | RIC (Flu/Cy) | Unrelated | Matched |
| 52 | 57 | AML | RIC (Flu/Cy) | Unrelated | Matched |
| 53 | 51 | DLBCL (LPD) | RIC (Flu/Cy) | Unrelated | Matched |
| 54 | 52 | AML | RIC (Flu/Cy) | Related | Matched |
Matched, HLA-matched (at A, B, C and DR); M/m, HLA-mismatched at a single HLA-A or -C locus.
AA, aplastic anemia; ALL, acute lymphoblastic leukemia; AML, acute myeloid leukemia; BEAM, carmustine, etoposide, cytarabine, and melphalan; Bu, busulphan; CLL, chronic lymphocytic leukemia; CML, chronic myeloid leukemia; Cy, cyclophosphamide; DLBCL, diffuse large B-cell lymphoma; FL, follicular lymphoma; Flu, fludarabine; LPD, lymphoproliferative disorder; MA, myeloablative; MCL, mantle cell lymphoma; MDS, myelodysplastic syndrome; Mel, melphalan; MF, myelofibrosis; M/m, mismatched (single antigen); MPD, myeloproliferative disorder; NHL, non-Hodgkin lymphoma; RIC, reduced-intensity conditioning; TBI, total body irradiation; UPN, unique patient number.
In vivo alemtuzumab.
Conventional immunohistochemistry
Appropriate negative and positive healthy tissue controls (based on published expression patterns) were used to optimize antibody staining (supplemental Figure 4). Images were captured with an Olympus Ariol microscope, and Ariol automated image analysis (Genetix, San Jose, CA) was used to identify and enumerate mononuclear cells on the basis of hematoxylin nuclear counterstaining characteristics. Antibody staining was digitized, and the mean intensity was calculated according to the number of pixels per mononuclear cell. Cells were considered positive if intensity was equivalent to cells in positive controls, and positive cells were counted automatically using the Ariol system. RARα antibody staining (using a rabbit polyclonal antibody at 1:4000 dilution; Santa Cruz Biotechnology, Dallas, TX), and the image analysis threshold was set to identify only mononuclear cells with high RARα expression. We used 2 regional approaches to RARαhi mononuclear cell enumeration; first we enumerated RARαhi mononuclear cells in the whole biopsy, excluding epithelial areas which were diffusely positive for RARα, which made identification of the small numbers of intraepithelial RARαhi mononuclear cells impossible. We also enumerated RARαhi mononuclear cells in subcrypt regions adjacent to basal crypts where GVHD-related epithelial stem cell damage occurs (supplemental Figure 5). Further technical details of antibody staining are provided in supplemental Methods; supplemental Table 2.
Sequential immunostaining
Sequential immunostaining, stripping, and reprobing on the same formalin-fixed paraffin-embedded biopsies were used to determine cellular coexpression of multiple markers.20 After antigen retrieval, slides were stained with primary antibody, secondary antibody, and VIP chromogen (because 3,3′-diaminobenzidine [DAB] could not be adequately stripped) and imaged before stripping by pressure-cooking and subsequent reprobing with the next antibody. Adequate stripping of primary antibodies was ensured by restaining with secondary antibody and chromogen. Panoramic Viewer v1.15.4 (3DHistech Ltd, Budapest, Hungary) was used to image cells. Cells that showed high levels of staining were identified manually by the operator. To determine coexpression patterns of individual cells, each mononuclear cell within a minimum of 3 subcrypt regions per biopsy was electronically marked, and cellular expression of sequential immunostains was recorded (supplemental Figure 6). The absolute number per unit area and proportion of mononuclear cells (minimum 200 per biopsy) with each distinct expression pattern were collated. SPICE software version 5.3 (National Institute of Allergy and Infectious Diseases) was used to depict frequencies of subpopulations of CD8 T cells based on coexpression patterns of other molecules.
Patient blood samples, flow cytometry, and cluster analysis
Flow cytometry used directly conjugated antibodies (supplemental Table 3) and viability dies to exclude dead cells. Analysis was performed using FlowJo software version 10 (FlowJo LLC, Ashland, OR). t-Distributed stochastic neighbor embedding (t-SNE) plots were generated, and cluster analysis was performed using Phenograph (https://bioconductor.org/packages/cytofkit/).21
Allogeneic cocultures
Peripheral blood mononuclear cells (PBMCs) were isolated by density gradient centrifugation from healthy blood donor filters or patient samples 30 days after allo-HSCT and labeled with a cell proliferation tracker (carboxyfluorescein succinimidyl ester; Invitrogen, Waltham MA) or Cell Trace Violet (Invitrogen). Labeled responders were cocultured with equal numbers of irradiated HLA-mismatched allogeneic stimulator PBMCs with all-trans RA 100 mM to 1 µM (Sigma-Aldrich, St Louis, MO), lipopolysaccharide (LPS) 1 μg/mL (Sigma-Aldrich), human recombinant IL-23 10 ng/mL (BioLegend, San Diego CA), or vehicle controls in RPMI containing 10% fetal bovine serum (Gibco, Gaithersburg, MD), penicillin 500 IU, and streptomycin 0.5 mg/mL (Sigma-Aldrich). For some experiments, the RARα-specific inhibitor ER-50891 (Santa Cruz Biotechnology) was added. Responder T-cell alloproliferation was determined on day 9 by cell label dilution as previously described.22
Statistical methods
Two-tailed unpaired or paired tests were used to compare 2 groups as appropriate. Nonparametric tests were used for non-normally distributed data sets. Comparison of multiple groups used unpaired or paired analysis of variance (equal groups) or mixed effects models (unequal groups) with posttest correction. Cumulative incidence of GI-GVHD–related mortality was calculated with non-GVHD–related mortality and disease relapse as competing risks. Statistical analysis was performed using Prism version 5.0 (GraphPad, San Diego CA) and STATA version 13 (StataCorp, College Station, TX). Details of experimental and analytical techniques are provided in supplemental Methods.
Results
RA-responsive mononuclear cells are increased in areas of GI-GVHD tissue damage
Because cellular RA cannot be measured in fixed tissue, and because previous studies have shown that exposure to RA increases RARα messenger RNA in antigen-stimulated T cells,23,24 we reasoned that cellular RARα expression could be used to identify RA-responsive cells. This notion was supported by initial observations that RARα protein expression was increased in PBMCs by exposure to RA during in vitro allostimulation (Figure 1A-B). We therefore developed an approach using conventional immunohistochemistry (IHC) to identify RA-responsive mononuclear cells with high RARα expression (Figure 1C) to scrutinize GI biopsies from allo-HSCT patients with suspected GI-GVHD. Using this approach, RARαhi cells represented a median of 17% (range, 2% to 61%) of mononuclear cells in the entire nonepithelial area of GI biopsies and correlated with cells that expressed cellular RA-binding proteins I and II (CRABPI/II), which reflect cellular RA content and deliver RA to nuclear RARs (Figure 1D).25-27 Regional analysis demonstrated significant enrichment of RARαhi cells in subcrypt regions adjacent to areas of epithelial stem cell damage in GI-GVHD (Figure 1E-F).

RA-responsive mononuclear cells are increased in areas adjacent to GI-GVHD tissue damage. (A) RARα protein expression measured by flow cytometry in human PBMCs allostimulated in the presence or absence of exogenous RA. Example pseudodot plots are shown. Cells with high expression of RARα are shown in Region 1 (R1). (B) RARα protein expression in human PBMCs allostimulated in the presence or absence of exogenous RA. Results depict 18 independent experiments. (C) Identification of RARαhi mononuclear cells in GI biopsies using IHC staining for RARα (upper panel, brown) with hematoxylin counterstaining (blue). After antigen retrieval, tissue was stained with rabbit anti-human RARα antibody (Clone F-9; Santa Cruz Biotechnology) for 40 minutes at room temperature. Sections were then stained using the Biogenex SuperSensitive Polymer-HRP IHC Kit and diaminobenzidine (DAB) chromogen and were counterstained with hematoxylin. Mononuclear cells were identified by size and nuclear staining characteristics (middle panel, blue dots), and RARα staining intensity was digitized using the Ariol Olympus microscope and automated image analysis system (middle panel, red). A threshold of RARα staining intensity was set to identify cells with high RARα expression (lower panel, yellow dots). RARαhi mononuclear cells (lower panel, black arrows) were distinguished from mononuclear cells with lower expression of RARα (lower panel, green arrows). Scale bars, 10 μm. (D) Correlation between RARαhi mononuclear cell numbers and cellular RA-binding protein CRABPI/II+ cell numbers in upper and lower GI biopsies from allogeneic hematopoietic stem cell transplantation (allo-HSCT) patients. Solid lines denote linear regression and dotted lines denote 95% confidence intervals. P and r values are for Pearson correlation. (E) Representative GI biopsy stained for RARα using conventional IHC and DAB chromogen. Subcrypt regions are outlined in black and are indicated by arrows. Scale bar, 50 μm. (F) Enrichment of RARαhi mononuclear cell numbers enumerated using the Ariol automated system in subcrypt regions of GI biopsies. (G) Representative GI biopsies from healthy controls and allo-HSCT patients with and without histologic GVHD were stained for RARα using conventional IHC and DAB chromogen. Scale bars, 50 μm. Black arrows depict mononuclear cells with high expression of RARα. (H) RARαhi mononuclear cell numbers in subcrypts of GI biopsies from allo-HSCT patients and healthy controls with and without histologic GVHD. (I) Receiver operating characteristic curves for subcrypt RARαhi cell numbers, RARαhi cell intensity, and CRABPI/II+ cell numbers and the presence of histologic GVHD. (J) RARαhi mononuclear cell numbers in subcrypts of upper (left) and lower (right) GI biopsies with and without histologic GVHD. Horizontal lines on graphs depict medians. AUC, area under the curve; FSC, forward scatter; LR, likelihood ratio; ns, not significant. *P < .05; **P < .01; ***P < .001; ****P < .0001, Mann-Whitney U tests (B,F) and analysis of variance (ANOVA) tests with correction for multiple comparisons (H,J).
RA-responsive mononuclear cells are increased in areas adjacent to GI-GVHD tissue damage. (A) RARα protein expression measured by flow cytometry in human PBMCs allostimulated in the presence or absence of exogenous RA. Example pseudodot plots are shown. Cells with high expression of RARα are shown in Region 1 (R1). (B) RARα protein expression in human PBMCs allostimulated in the presence or absence of exogenous RA. Results depict 18 independent experiments. (C) Identification of RARαhi mononuclear cells in GI biopsies using IHC staining for RARα (upper panel, brown) with hematoxylin counterstaining (blue). After antigen retrieval, tissue was stained with rabbit anti-human RARα antibody (Clone F-9; Santa Cruz Biotechnology) for 40 minutes at room temperature. Sections were then stained using the Biogenex SuperSensitive Polymer-HRP IHC Kit and diaminobenzidine (DAB) chromogen and were counterstained with hematoxylin. Mononuclear cells were identified by size and nuclear staining characteristics (middle panel, blue dots), and RARα staining intensity was digitized using the Ariol Olympus microscope and automated image analysis system (middle panel, red). A threshold of RARα staining intensity was set to identify cells with high RARα expression (lower panel, yellow dots). RARαhi mononuclear cells (lower panel, black arrows) were distinguished from mononuclear cells with lower expression of RARα (lower panel, green arrows). Scale bars, 10 μm. (D) Correlation between RARαhi mononuclear cell numbers and cellular RA-binding protein CRABPI/II+ cell numbers in upper and lower GI biopsies from allogeneic hematopoietic stem cell transplantation (allo-HSCT) patients. Solid lines denote linear regression and dotted lines denote 95% confidence intervals. P and r values are for Pearson correlation. (E) Representative GI biopsy stained for RARα using conventional IHC and DAB chromogen. Subcrypt regions are outlined in black and are indicated by arrows. Scale bar, 50 μm. (F) Enrichment of RARαhi mononuclear cell numbers enumerated using the Ariol automated system in subcrypt regions of GI biopsies. (G) Representative GI biopsies from healthy controls and allo-HSCT patients with and without histologic GVHD were stained for RARα using conventional IHC and DAB chromogen. Scale bars, 50 μm. Black arrows depict mononuclear cells with high expression of RARα. (H) RARαhi mononuclear cell numbers in subcrypts of GI biopsies from allo-HSCT patients and healthy controls with and without histologic GVHD. (I) Receiver operating characteristic curves for subcrypt RARαhi cell numbers, RARαhi cell intensity, and CRABPI/II+ cell numbers and the presence of histologic GVHD. (J) RARαhi mononuclear cell numbers in subcrypts of upper (left) and lower (right) GI biopsies with and without histologic GVHD. Horizontal lines on graphs depict medians. AUC, area under the curve; FSC, forward scatter; LR, likelihood ratio; ns, not significant. *P < .05; **P < .01; ***P < .001; ****P < .0001, Mann-Whitney U tests (B,F) and analysis of variance (ANOVA) tests with correction for multiple comparisons (H,J).
We next compared numbers of RARαhi mononuclear cells in GI biopsies with and without histologic GVHD. Subcrypt RARαhi cell numbers were significantly higher in biopsies with histologic GVHD than in biopsies from allo-HSCT patients without histologic GVHD or from healthy controls (Figure 1G-H). Total CRABPI/II was also significantly increased in subcrypt regions of GI biopsies with histologic GVHD, consistent with local enrichment of cellular RA (supplemental Figure 7). Subcrypt RARαhi cell numbers had an optimal sensitivity of 77% and specificity of 91% for the presence of histologic GVHD, with superior receiver operating characteristics compared with RARαhi staining intensity or number of CRABPI/II+ cells (Figure 1I). Importantly, subcrypt RARαhi mononuclear cells were significantly increased in biopsies with histologic GVHD from both the upper and lower GI tract (Figure 1J), but were not significantly different in biopsies grouped by patient, donor, or other clinical factors, including time to biopsy (Table 2).
Effect of clinical variables on GI biopsy subcrypt RARαhi cell numbers
| Variable | No. of patients | Mean subcrypt RARαhi cell no. ± SE | P* |
|---|---|---|---|
| Recipient age | |||
| Below median | 25 | 1387 ± 248 | .957 |
| Above median | 25 | 1407 ± 280 | |
| Recipient diagnosis | |||
| Lymphoid malignancy | 30 | 1404 ± 244 | .910 |
| Myeloid malignancy | 20 | 1387 ± 289 | |
| Donor | |||
| Family | 19 | 1182 ± 361 | .420 |
| Unrelated | 31 | 1522 ± 204 | |
| Conditioning | |||
| RIC | 46 | 1422 ± 198 | .450 |
| FIC | 4 | 1112 ± 426 | |
| HLA match in GVHD vector | |||
| Fully matched | 46 | 1231 ± 169 | .09 |
| Single antigen mismatch | 4 | 3263 ± 818 | |
| T-cell depletion | |||
| No | 44 | 1276 ± 175 | .286 |
| Yes | 6 | 2002 ± 817 | |
| Time to biopsy | |||
| Before day +180 | 31 | 1574 ± 246 | .219 |
| After day +180 | 19 | 1117 ± 272 | |
| Histologic GVHD | |||
| No | 10 | 498 ± 85 | <.001 |
| Yes | 40 | 1599 ± 213 |
FIC, full-intensity conditioning; RIC, reduced-intensity conditioning; SE, standard error.
Unpaired Student t test without assuming equal variance.
RARαhi mononuclear cell numbers are associated with severity, response to treatment, and mortality of GI-GVHD
Subcrypt RARαhi cell numbers were significantly higher in patients with severe GI-GVHD (clinical stage III to IV) than in patients without GI-GVHD, although RARαhi cells numbers did not differentiate patients with nonsevere (stage I to II) GI-GVHD. However, when this analysis was restricted to biopsies of the lower GI, RARαhi cell numbers differentiated between patients with no GVHD, nonsevere GI-GVHD, and severe GI-GVHD. Similarly, numbers of subcrypt RARαhi cells were significantly higher in biopsies of the lower GI tract from patients who were subsequently refractory to steroid therapy. We then examined the association of subcrypt RARαhi cells with the cumulative incidence of death attributable to GI-GVHD. We divided the patient cohort into tertiles according to subcrypt RARαhi mononuclear cell numbers. The cumulative incidence of GI-GVHD–related death was significantly greater in patients with higher numbers of subcrypt RARαhi cells (76% in the first, 32% in the second, and 10% in the third tertile; P = .002, Gray’s test) (supplemental Figure 8). Taken together, these data support an important role for RA-responsive mononuclear cells in human GI-GVHD.
A targeted candidate protein approach identifies a predicted phenotype of RA-responsive cells in the context of increased microenvironmental IL-23
In view of these findings, we next used conventional IHC to quantify T-cell lineage markers, transcription factors, and the IL-23 and IL-33 cytokines and their receptors in the same biopsy cohort to predict the likely phenotype of RA-responsive cells (Figure 2A). When both upper and lower GI biopsies were included, the numbers of CD8 T cells in subcrypt regions were significantly increased, and CD4 T-cell numbers were significantly decreased in biopsies with histologic GVHD (Figure 2B).

A targeted candidate protein approach identifies a predicted phenotype of RA-responsive cells in the context of increased microenvironmental IL-23. (A) Mononuclear cell staining for T-cell lineage markers, transcription factors, and the cytokines IL-23 and IL-33 and their receptors using conventional IHC in the same GI biopsy cohort. Scale bars, 100 µm. Positive cells (brown) are stained by DAB, SG (CD4) or AEC (CD8) chromogen. Cells are counterstained with hematoxylin. Insets show higher manifaction with positice cells identified with arrows in gray (CD4) or red (all other markers). (B) CD8 and CD4 T-cell numbers were enumerated automatically using the Ariol system in subcrypt regions of upper and lower GI biopsies from allo-HSCT patients with and without histologic GVHD. (C) Mononuclear cell numbers were enumerated automatically using the Ariol system expressing T-cell transcription factors, cytokines, and cytokine receptors in subcrypt regions of upper and lower GI biopsies from allo-HSCT patients with and without histologic GVHD. (D) Volcano plot depicting fold change and statistical significance of RARαhi mononuclear cell numbers and number of cells expressing T-cell lineage markers, transcription factors, cytokines, and cytokine receptors in subcrypt regions of upper and lower GI biopsies from allo-HSCT patients with and without histologic GVHD. (E) Total cellular IL-23 (calculated as the product of the number of IL-23+ mononuclear cells and the mean intensity of staining of cells for IL-23) in subcrypt regions of upper and lower GI biopsies from allo-HSCT patients with and without histologic GVHD. (F) Volcano plot depicting correlation coefficients and statistical significance of numbers of RARαhi mononuclear cells and cells expressing T-cell lineage markers, transcription factors, cytokines, and cytokine receptors in subcrypt regions of upper and lower GI biopsies from allo-HSCT patients. P and r values are for Pearson correlations. Cells expressing CD8, T-bet, and IL-23R (circled) were significantly positively correlated with numbers of RARαhi mononuclear cells. Horizontal lines are medians. P > .10 indicates nonsignificant values. *P < .05; ** P < .01, Mann-Whitney U tests (A-E).
A targeted candidate protein approach identifies a predicted phenotype of RA-responsive cells in the context of increased microenvironmental IL-23. (A) Mononuclear cell staining for T-cell lineage markers, transcription factors, and the cytokines IL-23 and IL-33 and their receptors using conventional IHC in the same GI biopsy cohort. Scale bars, 100 µm. Positive cells (brown) are stained by DAB, SG (CD4) or AEC (CD8) chromogen. Cells are counterstained with hematoxylin. Insets show higher manifaction with positice cells identified with arrows in gray (CD4) or red (all other markers). (B) CD8 and CD4 T-cell numbers were enumerated automatically using the Ariol system in subcrypt regions of upper and lower GI biopsies from allo-HSCT patients with and without histologic GVHD. (C) Mononuclear cell numbers were enumerated automatically using the Ariol system expressing T-cell transcription factors, cytokines, and cytokine receptors in subcrypt regions of upper and lower GI biopsies from allo-HSCT patients with and without histologic GVHD. (D) Volcano plot depicting fold change and statistical significance of RARαhi mononuclear cell numbers and number of cells expressing T-cell lineage markers, transcription factors, cytokines, and cytokine receptors in subcrypt regions of upper and lower GI biopsies from allo-HSCT patients with and without histologic GVHD. (E) Total cellular IL-23 (calculated as the product of the number of IL-23+ mononuclear cells and the mean intensity of staining of cells for IL-23) in subcrypt regions of upper and lower GI biopsies from allo-HSCT patients with and without histologic GVHD. (F) Volcano plot depicting correlation coefficients and statistical significance of numbers of RARαhi mononuclear cells and cells expressing T-cell lineage markers, transcription factors, cytokines, and cytokine receptors in subcrypt regions of upper and lower GI biopsies from allo-HSCT patients. P and r values are for Pearson correlations. Cells expressing CD8, T-bet, and IL-23R (circled) were significantly positively correlated with numbers of RARαhi mononuclear cells. Horizontal lines are medians. P > .10 indicates nonsignificant values. *P < .05; ** P < .01, Mann-Whitney U tests (A-E).
Subcrypt mononuclear cells expressing T-bet, a Th1/Tc1 effector T-cell transcription factor implicated in the pathogenesis of aGVHD,28 and cells expressing the regulatory T-cell transcription factor FOXP3 were significantly increased in biopsies with histologic GVHD, whereas there was no significant change in cells expressing the Th17/Tc17 transcription factor ROR-γt.29 In addition, cells expressing the IL-23p19 heterodimeric subunit of IL-23 (subsequently termed IL-23) and cells expressing the IL-23 receptor (IL-23R) were both significantly increased in biopsies with histologic GVHD, whereas cells expressing IL-33 and the IL-33R were not (Figure 2C-D). These findings persisted when analyses were restricted to either upper or lower GI biopsies (supplemental Figure 9). Importantly, in addition to an increase in number of IL-23+ cells, the total cellular IL-23 was also significantly increased in subcrypt regions of GI biopsies with histologic GVHD (Figure 2E). Correlation analyses demonstrated that despite some intersample variation, RARαhi cell numbers were modestly but significantly positively correlated with CD8 T cells, cells expressing T-bet, and cells expressing IL-23R, but not with numbers of cells expressing IL-23 (Figure 2F; supplemental Figure 10). These data are consistent with the expansion of a population of RARαhi CD8 T cells that coexpress T-bet and IL-23R in GI-GVHD tissue in the context of increased microenvironmental IL-23.
Sequential immunostaining confirms the presence of tissue-specific RARαhi CD8 effector T cells coexpressing T-bet and IL-23R in GI-GVHD
To further delineate the phenotype of RA-responsive T cells in GI biopsies, we used a novel approach that included sequential immunostaining, stripping, and re-probing to measure expression of multiple markers on single cells (Figure 3A). Importantly, we validated the accuracy of this approach by demonstrating close correlation between frequencies of cells enumerated with the sequential immunostaining pipeline and a manual counting approach in which frequencies of cells were enumerated with single-stain IHC and automated counting (Figure 3B).
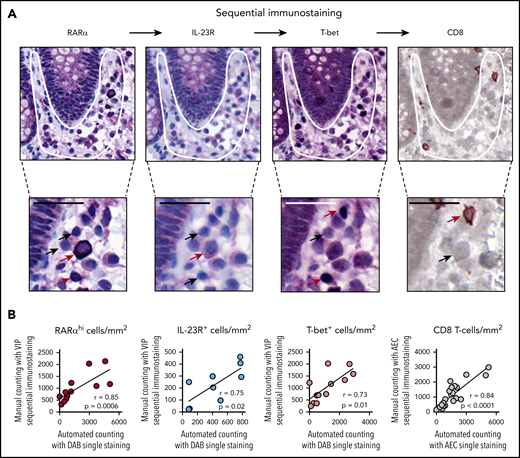
Sequential immunostaining of GI biopsies. (A) Representative example of a GI biopsy stained sequentially for RARα, IL-23R, and T-bet using VIP chromogen and hematoxylin counterstain; positive cells stained purple, and CD8 stained brown (using DAB chromogen). Subcrypt regions are indicated by a white outline. Cells with high and low or no expression of individual markers are indicated with red and black arrows, respectively. Scale bars, 25 µm. (B) Sequential immunostaining was validated by demonstrating a close correlation between mononuclear cell numbers in sequentially stained sections enumerated using manual counting. Mononuclear cell numbers in the same sections were stained by using conventional single-stain IHC and enumerated by using automated cell counting with the Ariol system. P and r values are for Pearson correlation coefficients.
Sequential immunostaining of GI biopsies. (A) Representative example of a GI biopsy stained sequentially for RARα, IL-23R, and T-bet using VIP chromogen and hematoxylin counterstain; positive cells stained purple, and CD8 stained brown (using DAB chromogen). Subcrypt regions are indicated by a white outline. Cells with high and low or no expression of individual markers are indicated with red and black arrows, respectively. Scale bars, 25 µm. (B) Sequential immunostaining was validated by demonstrating a close correlation between mononuclear cell numbers in sequentially stained sections enumerated using manual counting. Mononuclear cell numbers in the same sections were stained by using conventional single-stain IHC and enumerated by using automated cell counting with the Ariol system. P and r values are for Pearson correlation coefficients.
We used sequential immunostaining to phenotype subcrypt T cells in 26 upper and lower GI biopsies from 22 allo-HSCT patients and 4 healthy controls. Initial analyses confirmed a significant increase in RARαhi CD8 T cells in GI biopsies with histologic GVHD, but there was no significant change in RARαhi CD4 T cells. In addition, numbers of CD8 T cells (but not CD4 T cells) expressing either T-bet or IL-23R were also significantly increased in biopsies with histologic GVHD (Figure 4A-D; supplemental Figure 11A-B). With that in mind, we next enumerated 8 phenotypically distinct subpopulations of CD8 T cells based on coexpression patterns of RARα, T-bet, and IL-23R. Importantly, the only CD8 T-cell subpopulation present in significantly increased proportions in GI biopsies with histologic GVHD co-expressed high levels of RARα, T-bet, and IL-23R (triple-positive [TP] cells) (Figure 4E-F). This translated into a significant increase in the absolute number of TP CD8 T cells in GI biopsies with histologic GVHD (Figure 4G), which was also seen when analysis was restricted to lower GI biopsies (supplemental Figure 11C-D).

Sequential immunostaining reveals an increase in tissue-specific RARαhi CD8 effector T cells coexpressing T-bet and IL-23R in GI-GVHD. (A) RARαhi CD8 and (B) CD4 T-cell numbers in subcrypt regions of upper and lower GI biopsies from allo-HSCT patients with and without histologic GVHD and lower GI biopsies from healthy controls. (C) CD8 T-cell numbers co-expressing T-bet or (D) IL-23R in subcrypt regions of upper and lower GI biopsies from allo-HSCT patients with and without histologic GVHD and lower GI biopsies from healthy controls. (E) SPICE plots depicting subpopulations of CD8 T cells in subcrypt regions of GI biopsies. Arcs represent median frequencies of CD8 T cells expressing high RARα, T-bet, or IL-23R. Slices represent median frequencies of CD8 T-cell subpopulations by coexpression patterns of RARα, T-bet, and IL-23R. Results are shown for upper and lower GI biopsies from 4 healthy controls and 22 allo-HSCT patients, 15 with and 7 without histologic GVHD. (F) CD8 T-cell subpopulations expressed as a percentage of total CD8 cells in subcrypt regions of upper and lower GI biopsies from 4 healthy controls (circles) and 22 allo-HSCT patients, 15 with (diamonds) and 8 without (triangles) histologic GVHD. (G) Absolute numbers of CD8 T-cell subpopulations in subcrypt regions of GI biopsies. Color key is as shown in panel E. (H) SPICE plots depicting frequencies of subpopulations of CD8 T cells in epidermis of skin biopsies from allo-HSCT patients. Pie arcs and slices are designated as in panel E. Results are shown for biopsies from 11 allo-HSCT patients, 8 with and 3 without histologic skin GVHD. (I) Absolute numbers of RARαhi CD4 T cells coexpressing FOXP3 in subcrypt regions of GI biopsies from 12 allo-HSCT patients and 4 healthy controls. Numbers of RARαhi T-bet+ CD8 effector T cells in GI biopsies from allo-HSCT patients with histologic GVHD are shown for comparison. Horizontal lines and adjacent numbers are medians. *P < .05; **P < .01; ***P < .001, analysis of variance (ANOVA) tests with posttest correction for multiple comparisons.
Sequential immunostaining reveals an increase in tissue-specific RARαhi CD8 effector T cells coexpressing T-bet and IL-23R in GI-GVHD. (A) RARαhi CD8 and (B) CD4 T-cell numbers in subcrypt regions of upper and lower GI biopsies from allo-HSCT patients with and without histologic GVHD and lower GI biopsies from healthy controls. (C) CD8 T-cell numbers co-expressing T-bet or (D) IL-23R in subcrypt regions of upper and lower GI biopsies from allo-HSCT patients with and without histologic GVHD and lower GI biopsies from healthy controls. (E) SPICE plots depicting subpopulations of CD8 T cells in subcrypt regions of GI biopsies. Arcs represent median frequencies of CD8 T cells expressing high RARα, T-bet, or IL-23R. Slices represent median frequencies of CD8 T-cell subpopulations by coexpression patterns of RARα, T-bet, and IL-23R. Results are shown for upper and lower GI biopsies from 4 healthy controls and 22 allo-HSCT patients, 15 with and 7 without histologic GVHD. (F) CD8 T-cell subpopulations expressed as a percentage of total CD8 cells in subcrypt regions of upper and lower GI biopsies from 4 healthy controls (circles) and 22 allo-HSCT patients, 15 with (diamonds) and 8 without (triangles) histologic GVHD. (G) Absolute numbers of CD8 T-cell subpopulations in subcrypt regions of GI biopsies. Color key is as shown in panel E. (H) SPICE plots depicting frequencies of subpopulations of CD8 T cells in epidermis of skin biopsies from allo-HSCT patients. Pie arcs and slices are designated as in panel E. Results are shown for biopsies from 11 allo-HSCT patients, 8 with and 3 without histologic skin GVHD. (I) Absolute numbers of RARαhi CD4 T cells coexpressing FOXP3 in subcrypt regions of GI biopsies from 12 allo-HSCT patients and 4 healthy controls. Numbers of RARαhi T-bet+ CD8 effector T cells in GI biopsies from allo-HSCT patients with histologic GVHD are shown for comparison. Horizontal lines and adjacent numbers are medians. *P < .05; **P < .01; ***P < .001, analysis of variance (ANOVA) tests with posttest correction for multiple comparisons.
To assess whether this novel population of TP CD8 effector T cells was specific to GI tissues, we also performed sequential immunostaining on skin biopsies from 11 allo-HSCT patients. There was no increase in the proportion of TP CD8 T cells in skin biopsies with histologic GVHD (Figure 4H). These findings support GI tissue specificity of the TP CD8 T-cell effector population.
Because RA expands CD4 regulatory T cells under some conditions,6,7 and because we found increased FOXP3+ mononuclear cells in GI biopsies with histologic GVHD, we also enumerated FOXP3+ CD4 T cells using sequential immunostaining. Despite a reduction in overall RARαhi CD4 T cells, RARαhi FOXP3+ CD4 T cells were modestly increased in GI biopsies with histologic GVHD, although these biopsies had fivefold more RARαhi CD8 effector T cells than RARαhi FOXP3+ CD4 T cells, consistent with a net proinflammatory effect of RA-responsive T cells (Figure 4I).
RARαhi effector T cells are also selectively expanded in the peripheral blood of GI-GVHD patients
We next quantified RARαhi T-cell populations in peripheral blood of patients after allo-HSCT. Frequencies of TP CD8 T cells were significantly increased in peripheral blood of GI-GVHD patients compared with patients with skin GVHD, patients without GVHD, or healthy controls (Figure 5A-B). In contrast, there was no significant increase in the frequency of RARαhi or TP CD4 T cells in peripheral blood of GI-GVHD patients (Figure 5C).
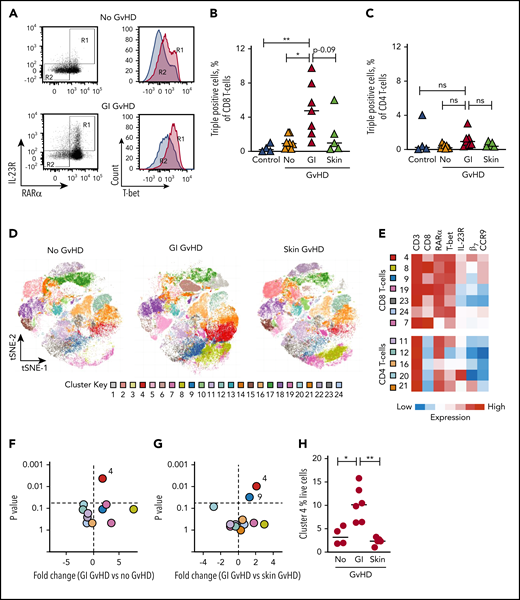
RARαhi effector T cells are also selectively expanded in the peripheral blood of GI-GVHD patients. (A) Representative dot plots and histograms of RARα, IL-23R, and T-bet expression on live CD8 T cells in peripheral blood of an allo-HSCT patient at onset of GI-GVHD and an allo-HSCT patient without GVHD from a similar time point. CD8 T cells coexpressing high RARα and IL-23R in boxed region R1 (left) expressed high levels of T-bet (right), whereas RARαdim/neg and IL-23Rneg CD8 T cells in boxed region R2 expressed low levels of T-bet. Percentage of live TP (B) CD8 and (C) CD4 T cells (coexpressing high RARα, T-bet, and IL-23R) in peripheral blood from healthy controls (n = 4) and allo-SCT patients with GI-GVHD (n = 7) or skin GVHD (n = 5) or without GVHD (n = 8) at matched time points. (D) Unsupervised phenotypic clustering of live mononuclear cells from samples depicted in panel B displayed as phenograph-generated t-distributed stochastic neighbor embedding (t-SNE) plots. Each cluster represents 1 of 24 phenotypically distinct T-cell subsets. (E) Heat map of relative expression levels of RARα, T-bet, IL-23R, and the GI-tropic molecules β7 and CCR9 of distinct CD3 T-cell clusters displayed in panel D. (F-G) Volcano plots depicting fold-change and statistical significance of abundance of distinct clusters within the peripheral blood live CD3 T-cell compartment from allo-HSCT patients with or without (F) GI-GVHD and with (G) GI- or skin GVHD. (H) Percentage of live mononuclear cells in cluster 4 in peripheral blood of allo-HSCT patients. Horizontal lines are medians. P > .10 indicates nonsignificant (ns) values. *P < .05; **P < .01, analysis of variance (ANOVA) with posttest correction for multiple comparisons (B,C,H) or Mann-Whitney U tests (F-G) .
RARαhi effector T cells are also selectively expanded in the peripheral blood of GI-GVHD patients. (A) Representative dot plots and histograms of RARα, IL-23R, and T-bet expression on live CD8 T cells in peripheral blood of an allo-HSCT patient at onset of GI-GVHD and an allo-HSCT patient without GVHD from a similar time point. CD8 T cells coexpressing high RARα and IL-23R in boxed region R1 (left) expressed high levels of T-bet (right), whereas RARαdim/neg and IL-23Rneg CD8 T cells in boxed region R2 expressed low levels of T-bet. Percentage of live TP (B) CD8 and (C) CD4 T cells (coexpressing high RARα, T-bet, and IL-23R) in peripheral blood from healthy controls (n = 4) and allo-SCT patients with GI-GVHD (n = 7) or skin GVHD (n = 5) or without GVHD (n = 8) at matched time points. (D) Unsupervised phenotypic clustering of live mononuclear cells from samples depicted in panel B displayed as phenograph-generated t-distributed stochastic neighbor embedding (t-SNE) plots. Each cluster represents 1 of 24 phenotypically distinct T-cell subsets. (E) Heat map of relative expression levels of RARα, T-bet, IL-23R, and the GI-tropic molecules β7 and CCR9 of distinct CD3 T-cell clusters displayed in panel D. (F-G) Volcano plots depicting fold-change and statistical significance of abundance of distinct clusters within the peripheral blood live CD3 T-cell compartment from allo-HSCT patients with or without (F) GI-GVHD and with (G) GI- or skin GVHD. (H) Percentage of live mononuclear cells in cluster 4 in peripheral blood of allo-HSCT patients. Horizontal lines are medians. P > .10 indicates nonsignificant (ns) values. *P < .05; **P < .01, analysis of variance (ANOVA) with posttest correction for multiple comparisons (B,C,H) or Mann-Whitney U tests (F-G) .
To assess GI tissue selectivity of peripheral blood RARαhi CD8 effector T cells, we also measured coexpression of molecules that confer GI migratory capacity, including the β7 subunit of the α4β7 integrin (because α4 is expressed on more than 90% of peripheral blood T cells) and CCR9. To contextualize these cells within broader immune reconstitution, we performed unsupervised phenotypic clustering analysis on all live mononuclear cells. By using the expression of 7 cell surface and intracellular molecules, we identified 24 phenotypically distinct T-cell clusters, 12 of which were T-cell populations (Figure 5D-E). Only 1 cluster (cluster 4) was present at significantly increased abundance in peripheral blood from GI-GVHD patients but not patients with skin or no GvHD or healthy controls. This cluster possessed the TP phenotype and expressed both β7 and CCR9 and was expanded to a median frequency of 10% of live mononuclear cells in GI-GVHD patients (Figure 5F-H).
The dominant effect of RA on human alloresponses is an increase in GI-tropic RARαhi CD8 effector T cells
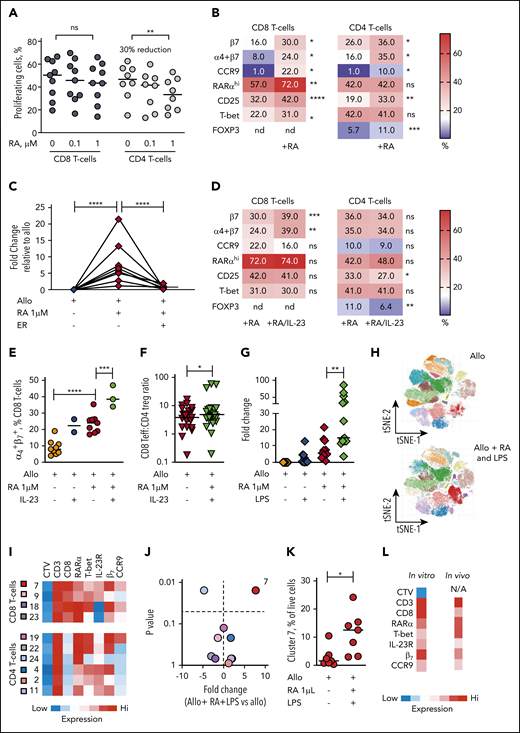
In view of the selective expansion of RARαhi CD8 effector T cells that we demonstrated in both GI tissue and blood of GI-GVHD patients, we used allogeneic healthy donor PBMC cocultures to investigate the impact of exogenous (all trans) RA on human T-cell alloresponses. At lower doses of RA, alloproliferation of both CD8 and CD4 T cells was preserved. However, at higher doses of RA, alloproliferation of CD8 T cells was not significantly impacted, whereas CD4 T-cell alloproliferation was significantly reduced (median 30% reduction) (Figure 6A).
The dominant effect of RA on human alloresponses is to increase GI-tropic RARαhi CD8 effector T cells and is potentiated in IL-23–rich conditions. (A) Proportion of CD8 and CD4 T cells proliferating after allostimulation in the absence or presence of RA (0.1 and 1 µM). Results are shown for 9 independent experiments. (B) Heat map of percentage of alloproliferative CD8 and CD4 T cells expressing GI-tropic molecules, high RARα, the activation marker CD25, the effector T-cell transcription factor T-bet, and the CD4 regulatory T-cell transcription factor FOXP3 after allostimulation with or without exogenous RA (1 µM). Results depict median values for 6 to 25 independent experiments. (C) Fold-change in frequency of alloproliferative GI-tropic TP CD8 effector T cells (coexpressing high RARα, T-bet, IL-23R) after allostimulation with or without exogenous RA (1 µM) and the RARα-specific inhibitor ER-50891 (ER). Results depict 8 independent experiments. (D) Heat map of percentage of alloproliferative CD8 and CD4 T cells the molecules depicted in panel B after allostimulation with exogenous RA (1 µM) with or without IL-23. Results depict median values for 12 to 27 independent experiments except for α4β7 coexpression (3 independent experiments). (E) Percentage of live alloproliferative CD8 T cells expressing both α4 and β7 integrins allostimulated with or without exogenous RA (1 µM) with or without IL-23. Results depict 3 to 9 independent experiments. (F) Ratio of live alloproliferative cells with a CD8 effector T-cell (Teff):CD4 regulatory T-cell (Treg) phenotype after allostimulation with exogenous RA (1 µM) with or without IL-23. Results depict 24 independent experiments. (G) Fold-change in frequency of live alloproliferative GI-tropic TP CD8 effector T cells after allostimulation with or without exogenous RA (1 µM) and/or LPS. Results depict 13 independent experiments. (H) Unsupervised phenotypic clustering of live PBMCs after allostimulation with or without exogenous RA (1 µM) and LPS displayed as phenograph-generated tSNE plots. Clusters are derived from 7 independent experiments. (I) Heat map of relative expression levels of RARα, T-bet, IL-23R, and the GI-tropic molecules β7 and CCR9 of distinct cell trace violet (CTV)dim alloproliferative CD3 T-cell clusters. (J) Volcano plot depicting fold-change and statistical significance of abundance of distinct T-cell clusters within live PBMCs allostimulated with or without RA (1 µM) and LPS. Cluster colors are depicted in panel I. (K) Percentage of live mononuclear cells in cluster 7 in PBMCs allostimulated in the presence or absence of RA and LPS. (L) Phenotypic heat map for in vitro cluster 7 in human PBMCs allostimulated with RA and LPS. The phenotype for cluster 4 seen in peripheral blood of GI-GVHD patients is also shown for comparison. Horizontal lines are medians. nd, not done. *P < .05; **P < .01; ***P < .001; ****P < .0001, Wilcoxon matched pairs signed-rank test (B,D,E,J-K) or mixed effects models with posttest correction (A,C,E,G).
The dominant effect of RA on human alloresponses is to increase GI-tropic RARαhi CD8 effector T cells and is potentiated in IL-23–rich conditions. (A) Proportion of CD8 and CD4 T cells proliferating after allostimulation in the absence or presence of RA (0.1 and 1 µM). Results are shown for 9 independent experiments. (B) Heat map of percentage of alloproliferative CD8 and CD4 T cells expressing GI-tropic molecules, high RARα, the activation marker CD25, the effector T-cell transcription factor T-bet, and the CD4 regulatory T-cell transcription factor FOXP3 after allostimulation with or without exogenous RA (1 µM). Results depict median values for 6 to 25 independent experiments. (C) Fold-change in frequency of alloproliferative GI-tropic TP CD8 effector T cells (coexpressing high RARα, T-bet, IL-23R) after allostimulation with or without exogenous RA (1 µM) and the RARα-specific inhibitor ER-50891 (ER). Results depict 8 independent experiments. (D) Heat map of percentage of alloproliferative CD8 and CD4 T cells the molecules depicted in panel B after allostimulation with exogenous RA (1 µM) with or without IL-23. Results depict median values for 12 to 27 independent experiments except for α4β7 coexpression (3 independent experiments). (E) Percentage of live alloproliferative CD8 T cells expressing both α4 and β7 integrins allostimulated with or without exogenous RA (1 µM) with or without IL-23. Results depict 3 to 9 independent experiments. (F) Ratio of live alloproliferative cells with a CD8 effector T-cell (Teff):CD4 regulatory T-cell (Treg) phenotype after allostimulation with exogenous RA (1 µM) with or without IL-23. Results depict 24 independent experiments. (G) Fold-change in frequency of live alloproliferative GI-tropic TP CD8 effector T cells after allostimulation with or without exogenous RA (1 µM) and/or LPS. Results depict 13 independent experiments. (H) Unsupervised phenotypic clustering of live PBMCs after allostimulation with or without exogenous RA (1 µM) and LPS displayed as phenograph-generated tSNE plots. Clusters are derived from 7 independent experiments. (I) Heat map of relative expression levels of RARα, T-bet, IL-23R, and the GI-tropic molecules β7 and CCR9 of distinct cell trace violet (CTV)dim alloproliferative CD3 T-cell clusters. (J) Volcano plot depicting fold-change and statistical significance of abundance of distinct T-cell clusters within live PBMCs allostimulated with or without RA (1 µM) and LPS. Cluster colors are depicted in panel I. (K) Percentage of live mononuclear cells in cluster 7 in PBMCs allostimulated in the presence or absence of RA and LPS. (L) Phenotypic heat map for in vitro cluster 7 in human PBMCs allostimulated with RA and LPS. The phenotype for cluster 4 seen in peripheral blood of GI-GVHD patients is also shown for comparison. Horizontal lines are medians. nd, not done. *P < .05; **P < .01; ***P < .001; ****P < .0001, Wilcoxon matched pairs signed-rank test (B,D,E,J-K) or mixed effects models with posttest correction (A,C,E,G).
Predictably, RA increased expression of GI-tropic molecules on both alloproliferative CD8 and CD4 T cells, with maximum upregulation at 1-µm concentrations (supplemental Figure 12). Notably, RA at 1-µM concentrations also significantly increased the proportion of alloproliferative CD8 T cells that express high levels of RARα, the activation marker CD25, and the effector cell transcription factor T-bet (Figure 6B). A similar increase in the proportion of activated alloproliferative CD8 T cells that express CD25 was seen with RA added at the beginning of coculture or at later time points, consistent with a direct effect on alloreactive T cells rather than an effect on APCs. CD8 effector T cells expressing T-bet were found predominantly within the RARαhi CD8 T-cell compartment after RA exposure, as were cells that upregulate GI-tropic molecules (supplemental Figure 13A-C). Exogenous RA resulted in a twofold increase in alloproliferative CD8 T cells with the TP phenotype we identified in tissue and blood of patients with GI-GVHD and a fivefold increase in TP CD8 T cells that express GI-homing molecules, which was effectively blocked by a specific inhibitor of RARα (Figure 6B), as was expansion of CD8 T cells that express each individual protein (supplemental Figure 13D), demonstrating that the effect is mediated by RARα ligation.
In contrast, RA exposure did not increase the proportion of alloproliferative CD4 effector T cells that express high levels of T-bet, but it did increase the proportion coexpressing CD25 and FOXP3, which reflects an increase in cells with a CD25hiFOXP3+ regulatory T-cell phenotype (supplemental Figure 13E). However, RA exposure resulted in significantly larger increases in alloproliferative CD8 effector T cells than in CD4 FOXP3+ cells, consistent with a net proinflammatory effect on T-cell alloresponses and also mirroring our findings in GI-GVHD tissue biopsies. Importantly, RA exposure induced similar phenotypic changes in alloproliferative T cells in peripheral blood samples from allo-HSCT patients (supplemental Figure 13 F-G).
IL-23–rich conditions potentiate selective expansion of RA-responsive GI-tropic alloreactive CD8 effector T cells
Because we found that IL-23+ mononuclear cells and RARαhi CD8 effector T cells expressing IL-23R were both increased in GI-GVHD tissues, we next sought to determine the impact of the combination of IL-23 and RA on human T-cell alloresponses. Increased frequencies of RARαhi CD8 effector T cells were maintained with IL-23 and RA during allostimulation but not at significantly higher frequencies than with RA alone (Figure 6D; supplemental Figure 14A-D). In contrast, the combination of RA and IL-23 resulted in significantly more alloproliferative CD8 T cells expressing the β7 integrin subunit and coexpressing both the α4 and β7 integrin subunits than RA or IL-23 alone, an effect that was not seen in alloproliferative CD4 T cells (Figure 6 D-E; supplemental Figure 14E-G). The increased expression of β7 induced by IL-23 and RA was largely restricted to RARαhi CD8 T cells, resulting in a significant increase in β7 expression on CD8 effector T cells with the TP phenotype identified in vivo (supplemental Figure 14H). Importantly, IL-23 also significantly reduced RA-induced expansion of FOXP3+ CD4 T cells (supplemental Figure 14I), increasing the ratio of CD8 effectors to FOXP3+ CD4 T cells within the alloproliferative compartment (Figure 6F).
To assess the impact of wider IL-23–rich proinflammatory environments on RA-responsive T-cell alloresponses, we examined the effect of LPS, which is increased in GI tissue after allo-HSCT, induces macrophages to release IL-23, and provides multiple additional proinflammatory signals.30 LPS alone did not significantly increase alloproliferative RA-responsive CD8 effector T cells, whereas RA and LPS significantly increased frequencies of alloproliferative CD8 effector T cells, including cells with a GI-tropic TP phenotype (Figure 6G). This larger expansion facilitated the phenotypic cluster analysis we had used in patient blood samples (Figure 6H-I). A single cluster of alloproliferative CD8 effector T cells was present at significantly higher frequency after RA and LPS exposure with a TP GI-tropic phenotype similar to that identified in peripheral blood of GI-GVHD patients. Notably this cluster had bright expression of β7 consistent with the effect we had identified in vitro with IL-23 and RA (Figure 6J-L). Taken together, these data are consistent with IL-23 increasing GI recruitment and/or retention of RA-responsive alloreactive CD8 effector T cells and also limiting RA-induced expansion of CD4 T cells with a regulatory phenotype, which results in a net proinflammatory effect.
Discussion
In this study, we showed that RA-responsive T cells are selectively increased at sites of GI-GVHD tissue damage in humans in the context of increased IL-23, and the increase correlates with disease severity and mortality. Furthermore, we characterized these cells as predominantly CD8 effector T cells expressing high levels of RARα, T-bet, and IL-23R. Our functional experiments confirm that the dominant effect of RA on human T-cell alloresponses is to increase GI-tropic CD8 effector T cells and is potentiated in IL-23–rich environments. Selectively targeting this RA-responsive CD8 effector T-cell population could provide a new strategy for preventing or treating GI-GVHD.
We studied patient biopsies from both the upper and lower GI tract, although most patients had biopsies from just the lower GI tract or from both sites. Although studies have shown that lower GI-GVHD has a more significant impact than upper GI-GVHD on GVHD-related mortality,31 upper GI pathology may increase lower GI-GVHD symptoms.32 Importantly, although numbers of RA-responsive cells in lower GI biopsies were more closely associated with clinical severity of GI-GVHD than numbers in upper GI biopsies, we found an increase in RA-responsive cells in both upper and lower GI biopsies, which supports a pathogenic role for RA-responsive cells throughout the GI tract.
Intriguingly, several GI biopsies with no histologic GVHD had evidence of alternative infective or inflammatory processes despite low levels of RA-responsive cells. However, the role of RA-responsive cells in allo-HSCT patients with cytomegalovirus colitis (which can occur after transplantation and were not included in our study) will be important to further assess the specificity of these cells.
To our knowledge, no previous studies have examined the role of RA at the tissue level in human GI-GVHD, although several animal studies have shown that vitamin A depletion, which reduces tissue RA levels, selectively reduces GI-GVHD.33,34 A recent study in pediatric transplant recipients found that GI-GVHD was associated with low plasma vitamin A levels.35 Although we did not measure the plasma vitamin A levels in our patients, we did show that RA-responsive effector T cells and levels of RA-binding proteins (which are proportional to cellular RA content) were increased in GI-GVHD tissues. The precise relationship between plasma vitamin A levels and cellular RA levels in GI tissue remains to be determined, but our current findings highlight the importance of scrutinizing the GI microenvironment in which metabolites may be regionally concentrated.
Our findings are consistent with recent murine studies that show GI-GVHD is mediated by RA-responsive T cells with increased RARα expression.14,15 In contrast to the findings in mice, despite RA upregulating GI-tropic molecules on alloproliferative CD8 and CD4 cells, we found increases only in RARαhi CD8 effector cells in GI-GVHD biopsies. One explanation for this may have been the selective reduction in CD4 alloproliferation we observed after in vitro RA exposure, potentially reflecting a differential RA-response element use in murine and human T cells. However, in common with these murine studies, our data showed that larger increases in RA-responsive effector T cells were accompanied by smaller increases in CD4 T cells with a regulatory phenotype in GI-GVHD tissue and after in vitro allostimulation in the presence of RA. This qualitatively distinct action of RA on human CD8 and CD4 T-cell alloresponses could represent a therapeutic opportunity if the 2 effects could be dissociated or selectively manipulated.
Although most previous studies report that T-cell infiltrates in human GI-GVHD tissue are predominantly CD8 T cells,36,37 other studies show that pathogenic CD4 T cells play a role that may be licensed by microenvironmental factors other than RA.38-40 It is therefore likely that RA-responsive CD8 effector T cells represent 1 of several distinct immune cell subsets that contribute to the pathogenesis of GI-GVHD, so the temporal distinction, interplay, and functional dominance between RA-responsive CD8 effector T cells and these other cell subsets remains to be determined.
Although we did not directly demonstrate a causal role for IL-23 in selectively concentrating RA-responsive CD8 effector T cells in vivo, our findings suggest that IL-23, which modulates T-cell responses to RA in other contexts may be one of the local factors that influence RA-responsive T-cell alloresponses in the GI microenvironment. Mononuclear cells expressing IL-23 were increased in GI-GVHD tissues but did not correlate with RARαhi or CD8 T cells, consistent with a trans effect on RA-responsive CD8 T cells. IL-23 has been implicated in the pathogenesis of both murine and human GI-GVHD,41,42 and IL-23p19–specific blockade is used in the clinic to treat autoimmune disease. However, because only half of RARαhi CD8 effector T cells in GI-GVHD tissues expressed the IL-23R, our results support targeting IL-23 as an adjunct but not an alternative to directly targeting RA-responsive CD8 effector T cells. Furthermore, we cannot exclude the contribution of untested microenvironmental factors in licensing RA-responsive CD8 effector T cells, and the larger effect seen in vitro with LPS and RA compared with IL-23 and RA suggests that additional LPS-induced signals are also likely to contribute to the expansion of these pathogenic cells.
The vast majority of biopsies in our study were from patients who had undergone allo-HSCT using reduced-intensity conditioning. Although this approach is commonly applied worldwide, we do not yet know if our findings can be generalized more widely to other full-intensity conditioning transplant platforms. It will be important to validate our findings after more intensive allo-HSCT conditioning regimens (including those that contain total body irradiation), and it is likely that expansion of RA-responsive effector T cells also occurs in GI-GVHD in this setting because total body irradiation increases both LPS release and RA-signaling in the GI microenvironment in mice.43,44
Further exploration of mechanisms by which RA directs alloreactive T-cell differentiation will be key to translating our findings into strategies to prevent or treat GI-GVHD. Although RARα blockade is under development in other clinical contexts, this direct approach may not be optimal in the context of GI-GVHD because RA also has an important role in maintaining GI-mucosal integrity, and vitamin A deprivation in mice that have received a transplant can redirect GVHD to other target organs.33,34 Identification of the individual RA-response elements in human alloreactive CD8 and CD4 T cells could facilitate targeted therapeutic intervention, potentially uncoupling the impact of RA on CD8 effector T cells and regulatory CD4 T cells to promote tolerogenic T-cell alloresponses within GI tissue.
For original data, please contact j.k.davies@qmul.ac.uk.
The online version of this article contains a data supplement.
The publication costs of this article were defrayed in part by page charge payment. Therefore, and solely to indicate this fact, this article is hereby marked “advertisement” in accordance with 18 USC section 1734.
Acknowledgments
This work was supported by grants from by Bloodwise (Project Grant 15007) and Cancer Research UK (CRUK; Barts Cancer Centre grant).
Authorship
Contribution: J.A.B. performed and analyzed IHC and sequential immunostaining of biopsies, designed, performed, and analyzed patient peripheral blood and allogeneic coculture experiments, and wrote the manuscript; A.C. optimized and performed IHC and sequential immunostaining of tissue biopsies; J.A. performed tSNE and cluster analyses of patient peripheral blood and in vitro data; S.C., C.B., and M.M. contributed to experimental design and data analysis and helped write the article; A.S. and J.O.L. helped conceive the project and experimental design; J.C. contributed patient samples; M.C. helped conceive the project and performed histological review of tissue biopsies; J.G.G. helped conceive the project, contributed patient samples, contributed to experimental design, and helped write the article; J.D. conceived, designed, and supervised the study, analyzed and interpreted experiments and clinical data, and wrote the manuscript; and all authors approved the final manuscript.
Conflict-of-interest disclosure: The authors declare no competing financial interests.
Correspondence: Jeff Davies, Centre for Haemato-Oncology, Barts Cancer Institute, Queen Mary University of London, John Vane Building, Charterhouse Square, London EC1M 6BQ, United Kingdom; e-mail: j.k.davies@qmul.ac.uk

This feature is available to Subscribers Only
Sign In or Create an Account Close Modal