

Key Points
KPT-330 with salicylates improves CRM1 inhibition, induces S-phase arrest, and inhibits cellular DNA-damage repair mechanisms.
This novel all-oral drug combination is active across a broad range of high-risk malignancies.

Abstract
Chromosome region maintenance protein 1 (CRM1) mediates protein export from the nucleus and is a new target for anticancer therapeutics. Broader application of KPT-330 (selinexor), a first-in-class CRM1 inhibitor recently approved for relapsed multiple myeloma and diffuse large B-cell lymphoma, have been limited by substantial toxicity. We discovered that salicylates markedly enhance the antitumor activity of CRM1 inhibitors by extending the mechanisms of action beyond CRM1 inhibition. Using salicylates in combination enables targeting of a range of blood cancers with a much lower dose of selinexor, thereby potentially mitigating prohibitive clinical adverse effects. Choline salicylate (CS) with low-dose KPT-330 (K+CS) had potent, broad activity across high-risk hematological malignancies and solid-organ cancers ex vivo and in vivo. The K+CS combination was not toxic to nonmalignant cells as compared with malignant cells and was safe without inducing toxicity to normal organs in mice. Mechanistically, compared with KPT-330 alone, K+CS suppresses the expression of CRM1, Rad51, and thymidylate synthase proteins, leading to more efficient inhibition of CRM1-mediated nuclear export, impairment of DNA-damage repair, reduced pyrimidine synthesis, cell-cycle arrest in S-phase, and cell apoptosis. Moreover, the addition of poly (ADP-ribose) polymerase inhibitors further potentiates the K+CS antitumor effect. K+CS represents a new class of therapy for multiple types of blood cancers and will stimulate future investigations to exploit DNA-damage repair and nucleocytoplasmic transport for cancer therapy in general.
Introduction
Tumor cells depend on nucleocytoplasmic trafficking of macromolecules to sustain their proliferation and survival.1 Chromosome region maintenance protein1 (CRM1; encoded by XPO1 gene) is the principal transport receptor mediating the nuclear efflux of proteins.2 In tumor cells, CRM1 expression is often upregulated to facilitate the increased demand for nuclear export of proteins including tumor-suppressor proteins, leading to enhanced proliferation and survival.2-8 Accordingly, CRM1 has gained attention as a novel target in anticancer therapeutics. KPT-330 (selinexor; Karyopharm Therapeutics), a first-in-class CRM1 inhibitor, was recently approved by the US Federal Drug Administration (FDA) at 60 mg orally twice-weekly for patients with relapsed and/or refractory (R/R) diffuse large B-cell lymphoma (DLBCL) and 80 mg orally twice-weekly with dexamethasone for patients with R/R multiple myeloma (MM), producing an overall response rate of 28% and 26%, respectively.9,10 However, the adverse effects (AEs) of KPT-330 at these doses were substantial with >50% grade ≥3 hematologic AEs and over 70% nonhematologic AEs.9-11 To address this clinical problem, we focused on identifying novel strategies to boost the potency, reduce toxicity, and broaden the applicability of CRM1 inhibitors to a wider range of malignancies.
Methods
Primary patient samples
Primary patient samples were obtained through the University of Iowa/Mayo Clinic Lymphoma Specialized Program of Research Excellence (SPORE)-Biospecimen Core or the Predolin-Biobank following Mayo Clinic Institutional Review Board approval. All studies were conducted in accordance with the Declaration of Helsinki. Mononuclear cells were obtained from bone marrow, spleen, peripheral blood, and lymph nodes via Ficoll-Paque density gradient centrifugation.
Cell-viability assessment
Cells were treated with the indicated drug conditions (KPT-330, choline salicylate [CS], KPT-330+CS [K+CS] or dimethyl sulfoxide [DMSO] control) for 48 hours (72 hours for OCI-Ly1), then stained with fluorescein isothiocyanate – annexin V for 30 minutes at 4°C followed by addition of propidium iodide. Cell viability was assessed by flow cytometry. All experiments were done multiple times and the data presented are in triplicates except in rare cases (patient samples) where analyses were done only in duplicates due to the limited number of cells.
In vivo studies
All studies were approved by the institutional animal care and use committee of the Mayo Clinic. Four- to 6-week-old male NSG (NOD.Cg-PrkdcscidIl2rgtm1Wjl/SzJ) NOD SCID γ mice were engrafted with JeKo-1 cells. On day 4 following inoculation, 20 mice were randomly assigned to 4 groups: vehicle, KPT-330 at 15 mg/kg, CS 500 mg/kg, and K+CS at the aforementioned doses by oral gavage. KPT-330 was administered twice-weekly, similar to approved dosing in humans; CS was administered consecutively 6 days per week. Tumor growth was monitored thru day 26 and tumor volume was calculated by measuring tumor length × width2/2.12
Comet assay
The comet assay was conducted based on the manufacturer’s protocol (R&D Systems); SYBR gold DNA stain was used to stain DNA. Slides were subsequently imaged by a Zeiss LSM 780 confocal microscope at ×10.
Cell-cycle analysis
Following incubation, cells were fixed with 70% cold ethanol and kept at 4°C for 24 hours, followed by propidium-iodide staining. Cell-cycle analysis was performed using a FACSCalibur flow cytometer (BD Biosciences) and analyzed using FlowJo software.
Additional methods including methods for proteomic, genomic, nuclear transport, DNA-damage repair, and antitumor activity on patient-derived xenograft (PDX) assessments can be found in supplemental Methods (available on the Blood Web site).
Results
Increased potency of CRM1 inhibitors when combined with salicylates
Previously, we demonstrated that KPT-330 treatment relocalizes i-κ-β (IKβ) to the nucleolus in non-Hodgkin lymphoma (NHL) cells.8 Pairing this finding with the ability of salicylates to localize RelA (p65) to the nucleolus in cancer cells,13 we questioned whether salicylates could potentiate the antitumor effect of CRM1 inhibitors. To that end, we assessed the antitumor activity of various CRM1 inhibitors, leptomycin B (LMB), KPT-185, and KPT-330, in combination with well-established salicylate compounds, acetyl salicylate (AS), sodium salicylate (NaS), and CS. As expected, salicylates alone had no effect on mantle cell lymphoma (MCL; JeKo-1 cell line) cell viability (Figure 1A); however, their combination with low doses of CRM1 inhibitors significantly enhanced cytotoxicity (Figure 1B-D). No synergistic or additive antitumor effects were observed when salicylates were combined with traditional chemotherapeutic agents (ie, gemcitabine or bortezomib), or when nonsalicylate nonsteroidal anti-inflammatory drugs were combined with CRM1 inhibitors (data not shown), suggesting that the synergy between CRM1 inhibitors and salicylates is specific for these drug classes. For further studies, we selected KPT-330 as the prototypical CRM1 inhibitor given its current FDA approval status and characterized pharmacokinetics,11 and CS as the prototypical salicylate given its favorable pharmacokinetics and reduced antiplatelet, renal, neurological, and gastrointestinal AEs in humans compared with other salicylates.14 The selected ex vivo dose range for CS of 1 to 3 mM is clinically relevant, achievable, and tolerable in humans.13,14 We used serial concentrations of KPT-330 ranging from <1 µM, which induces a minimal antitumor effect in NHL, to 2.5 µM, a concentration that is clinically achievable based on the 80 mg twice-weekly FDA-approved dose that is efficacious, but with AEs.9,11 Treatment with KPT-330 in combination with CS yielded markedly lower 50% inhibitory concentration (IC50) values compared with KPT-330 alone in the MCL cell line, JeKo-1 (from 1.3 µM to 0.3 µM), and the DLBCL cell line, OCI-Ly1 (from 1.8µM to 0.4 µM) (Figure 1E-F). Moreover, KPT-330 concentrations as low as 0.1 µM and 0.25 µM were also synergistic with 3 mM CS in both JeKo-1 and OCI-Ly-1 cells, respectively (supplemental Table 1). Furthermore, the potent antitumor effect of K+CS was observed across a broad range of cell lines in both hematological and solid-organ malignancies, thus highlighting its potential broad applicability for cancer therapy (Figure 1G; supplemental Table 2). This potency was also seen in acute lymphoblastic leukemia cells (CRL-1873) carrying an E571K mutation: the most common mutation in XPO1 (supplemental Table 2).15

KPT-330+CS potentiates the antitumor effect of CRM1 inhibitors ex vivo. (A-D) Cell-viability analysis using Annexin V/PI on JeKo-1 cell treated with various salicylates (AS, 2.5 mM; NaS, 3 mM; CS, 3 mM) and CRM1 inhibitors (LMB, 2 nM; KPT-185, 0.2 µM; KPT-330, 0.5 µM) in combination or as single agents. (E-F) Relative IC50 was calculated for JeKo-1 (E) and OCI-Ly1 cell lines (F). The IC50 decreased from 1.3 µM to 0.3 µM on JeKo-1 cells (E), and from 1.8 µM to 0.4 µM on OCI-Ly1 cells (F) when treated with CS 3 mM and KPT-330 at the indicated concentrations as compared with KPT-330 single-agent treatment. (G) Cell viability using Annexin V/PI analysis on cell lines from different hematologic malignancies and solid tumors treated with KPT-330 (from 0.1 µM to 0.5 µM) and CS (from 1 mM to 3 mM). Results were normalized by the respective controls. *P < .05 to P < .005; **P < .005 to P < .0005; ***P < .0005. The paired Student t test was used to compare all continuous variables. A value of P < .05 was considered statistically significant. Con, control.
KPT-330+CS potentiates the antitumor effect of CRM1 inhibitors ex vivo. (A-D) Cell-viability analysis using Annexin V/PI on JeKo-1 cell treated with various salicylates (AS, 2.5 mM; NaS, 3 mM; CS, 3 mM) and CRM1 inhibitors (LMB, 2 nM; KPT-185, 0.2 µM; KPT-330, 0.5 µM) in combination or as single agents. (E-F) Relative IC50 was calculated for JeKo-1 (E) and OCI-Ly1 cell lines (F). The IC50 decreased from 1.3 µM to 0.3 µM on JeKo-1 cells (E), and from 1.8 µM to 0.4 µM on OCI-Ly1 cells (F) when treated with CS 3 mM and KPT-330 at the indicated concentrations as compared with KPT-330 single-agent treatment. (G) Cell viability using Annexin V/PI analysis on cell lines from different hematologic malignancies and solid tumors treated with KPT-330 (from 0.1 µM to 0.5 µM) and CS (from 1 mM to 3 mM). Results were normalized by the respective controls. *P < .05 to P < .005; **P < .005 to P < .0005; ***P < .0005. The paired Student t test was used to compare all continuous variables. A value of P < .05 was considered statistically significant. Con, control.
K+CS treatment is efficacious and nontoxic in vivo
Given the ex vivo efficacy of K+CS in various cell lines, we tested K+CS on tumor xenografts in NSG mice subcutaneously engrafted with JeKo-1 cells. Tumor-bearing mice were randomized to treatment by oral gavage with vehicle, low-dose KPT-330, CS, or K+CS in combination. Validating our ex vivo results, significant decreases in tumor growth rate (Figure 2A) and tumor volume (Figure 2A-B) were observed in the K+CS group. No significant AEs such as weight loss or treatment-related mortality were observed. A formal toxicological assessment was also performed in non–tumor-bearing mice treated with vehicle or K+CS, and no treatment-related visceral toxicities were noted following independent pathology analysis of internal organs. Grade I renal tubular hyperplasia was observed in 1 of 5 vehicle-treated mice and 4 of 5 K+CS-treated mice (Figure 2C).
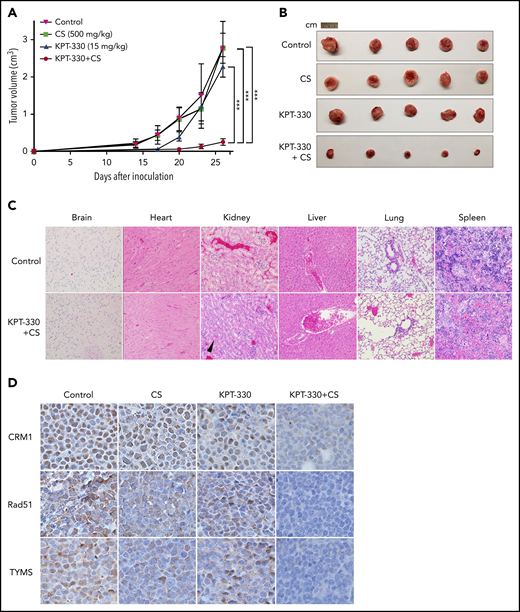
KPT-330+CS shows potent antitumor effect without substantial in vivo organ toxicity. Tumor volume curves (A) and extracted tumor (B) of NSG mice transplanted subcutaneously with JeKo-1 cells and treated with vehicle, KPT-330, CS, or KPT-330+CS. Tumor volumes were measured daily for 26 days. (C) Histopathological assessment of organs from non–tumor-bearing mice treated with KPT-330+CS or vehicle for 26 days (original magnification ×10; hematoxylin and eosin stain). Grade I renal tubular hyperplasia (black arrowhead points to a renal tubule with increased cellularity) was seen in 4 of 5 mice as compared with 1 of 5 mice in the treatment and control groups, respectively. (D) The expression of CRM1, Rad51, and TYMS proteins assessed through immunohistochemistry on tumor tissue following treating tumor-bearing NSG mice with respective drug combinations for 26 days (original magnification ×100). ***P < .0005. The paired Student t test was used to compare all continuous variables. A value of P < .05 was considered statistically significant.
KPT-330+CS shows potent antitumor effect without substantial in vivo organ toxicity. Tumor volume curves (A) and extracted tumor (B) of NSG mice transplanted subcutaneously with JeKo-1 cells and treated with vehicle, KPT-330, CS, or KPT-330+CS. Tumor volumes were measured daily for 26 days. (C) Histopathological assessment of organs from non–tumor-bearing mice treated with KPT-330+CS or vehicle for 26 days (original magnification ×10; hematoxylin and eosin stain). Grade I renal tubular hyperplasia (black arrowhead points to a renal tubule with increased cellularity) was seen in 4 of 5 mice as compared with 1 of 5 mice in the treatment and control groups, respectively. (D) The expression of CRM1, Rad51, and TYMS proteins assessed through immunohistochemistry on tumor tissue following treating tumor-bearing NSG mice with respective drug combinations for 26 days (original magnification ×100). ***P < .0005. The paired Student t test was used to compare all continuous variables. A value of P < .05 was considered statistically significant.
K+CS is a more potent inhibitor of nuclear export than KPT-330 alone
To elucidate the robust antitumor activity of the K+CS combination both ex vivo and in vivo, we first examined the efficiency of nuclear export and spatial expression of CRM1 protein in K+CS-treated cells. To assess nuclear export function, an engineered reporter construct encoding green fluorescent protein (GFP) carrying the nuclear localization sequence (NLS) and the nuclear export sequence (NES) was transiently transfected into U2OS cells in which the nuclear and cytoplasmic compartments are easily visualized. In untreated cells, the reporter protein freely shuttled between the nucleus and cytoplasm. With K+CS treatment, complete nuclear localization of the GFP was observed compared with an incomplete nuclear localization in cells treated with KPT-330 alone at 0.5 µM (Figure 3A). To quantify the efficiency of nuclear export, we scored 100 reporter-expressing cells for complete vs incomplete GFP nuclear localization. As shown in Figure 3B, 78% of cells in the K+CS group had complete nuclear localization of GFP compared with 28% of cells treated with KPT-330 alone (P = .02). We also observed decreased expression of CRM1 protein by immunofluorescence in K+CS-treated cells compared with CS or KPT-330–treated cells as single agents or DMSO control (Figure 3A in red). K+CS treatment therefore causes more efficient inhibition of nuclear export than KPT-330 alone, and this inhibition is associated with a significant reduction of nuclear CRM1 protein expression.

KPT-330+CS is a better inhibitor of nuclear export and decreases CRM1 expression. (A) Immunofluorescence microscopy images obtained from Zeiss LSM 780 confocal microscope at original magnification ×60 showing the subcellular localization of GFP (green) and endogenous CRM1 (red) in U2OS cells transfected with nuclear export reporter construct (NLS-GFP-NES), and treated with the indicated conditions for 24 hours. (B) Quantitation of nuclear export efficiency. GFP-transfected U2OS cells were evaluated and scored for percentage with complete nuclear localization of GFP signal. (C) Immunoblot images showing the expression of transfected CRM1-YFP and endogenous CRM1 in U2OS, HeLa, and HEK293 cells treated with the indicated conditions for 24 hours. *P = .02. The paired Student t test was used to compare all continuous variables. A value of P < .05 was considered statistically significant.
KPT-330+CS is a better inhibitor of nuclear export and decreases CRM1 expression. (A) Immunofluorescence microscopy images obtained from Zeiss LSM 780 confocal microscope at original magnification ×60 showing the subcellular localization of GFP (green) and endogenous CRM1 (red) in U2OS cells transfected with nuclear export reporter construct (NLS-GFP-NES), and treated with the indicated conditions for 24 hours. (B) Quantitation of nuclear export efficiency. GFP-transfected U2OS cells were evaluated and scored for percentage with complete nuclear localization of GFP signal. (C) Immunoblot images showing the expression of transfected CRM1-YFP and endogenous CRM1 in U2OS, HeLa, and HEK293 cells treated with the indicated conditions for 24 hours. *P = .02. The paired Student t test was used to compare all continuous variables. A value of P < .05 was considered statistically significant.
K+CS treatment enhanced the degradation of CRM1 protein
To further investigate the mechanism of the reduction of CRM1 protein expression in K+CS-treated cells, we treated U2OS, HeLa, and HEK293 cells with K+CS for 24 hours followed by immunoblotting for CRM1. Indeed, endogenous CRM1 protein expression was significantly decreased upon K+CS treatment compared with control. To determine whether this was due to suppression of XPO1 expression at the transcriptional level or increased degradation of CRM1 at the protein level, we transfected a construct expressing the YFP-CRM1 fusion protein (YFP-CRM1) under a nonnative cytomegalovirus promoter into U2OS, HeLa, and HEK293 cells, and treated with K+CS for 24 hours. K+CS treatment notably reduced the level of CRM1-YFP similar to the endogenous CRM1 protein in all cell lines (Figure 3C). Because different promoters drive the transcription of endogenous CRM1 and the CRM1-YFP transgene, the finding that both of these proteins were similarly reduced suggests that posttranslational protein degradation occurs upon K+CS treatment.
To further assess whether CRM1 degradation is mediated by proteasome-dependent mechanism, we treated JeKo-1 cells with K+CS in the presence or absence of bortezomib, a proteasome inhibitor. Cotreatment with bortezomib indeed prevented the lowering of CRM1 protein, further validating that the reduced expression of CRM1 is due to a proteasome-mediated protein-degradation mechanism (supplemental Figure 1A).
K+CS affects cellular proteins involved in cell cycle, DNA-damage repair, and DNA synthesis
The decreased expression of CRM1 protein observed following K+CS treatment prompted us to perform a global proteomic analysis by mass spectroscopy in JeKo-1 cells under the same conditions. We identified a group of ∼100 proteins whose expression was also affected by K+CS treatment including Rad51, thymidylate synthase (TYMS), Bub1b, polo-like kinase 1 (PLK1), aurora kinase A (AURKA), and cyclin B1 (CCNB1) (Figure 4A-E,J). These results were independently validated by immunoblotting in JeKo-1 (Figure 4F-H), DLBCL cell line, OCI-Ly1 (supplemental Figure 1B), and also in U2OS, HeLa, and HEK293 cells (data not shown). Gene-set enrichment analyses (GSEAs) identified the affected proteins to be primarily associated with DNA synthesis, DNA-damage repair, and the mitotic checkpoint pathways (Figure 4I).
![KPT-330+CS inhibits proteins in key cellular pathways. Jeko-1 cells were treated with KPT-330 (0.5 μM), CS (3m M) as single-agent treatment and in combination for 24 hours, respectively. Subsequently, cellular proteins were cataloged through mass spectroscopy. (A-E) Volcano plots showing protein changes associated with each treatment condition; (A) KPT-330+CS vs control; (B) KPT-330 vs control; (C) CS vs control; (D) CS vs KPT-330; (E) KPT-330+CS vs KPT-330. Significantly differentially expressed proteins (absolute log2 fold change ≥2 and false discovery rate [FDR] ≤0.05) are highlighted in red. Key proteins in cell-cycle, nucleotide synthesis, and DNA-damage repair pathways are tagged where detected. (F-H) Immunoblot images validating the findings of proteomic studies following JeKo-1 cells treated with respective drug conditions. (I) Heat map showing significantly affected pathways by KPT-330+CS. An ANOVA test was used to detect the differentially expressed protein groups and cellular pathways between pairs of experimental groups. (J) Heat map showing the downregulation of selected proteins involved in DNA-damage repair, cell-cycle progression, DNA synthesis, and nuclear molecular export. Each condition was performed in biological triplicates of the JeKo-1 cell line. Differential expression P values were FDR-corrected using Benjamini-Hochberg procedure. A total of 5 group comparisons were performed: KPT-330 vs control, CS vs control, KPT-330+CS vs control, KPT-330+CS vs KPT-330, and CS vs KPT-330. For each comparison, protein groups with an FDR ≤0.05 and an absolute log2 (fold change) ≥2.0 were considered as significantly differentially expressed.](https://ash.silverchair-cdn.com/ash/content_public/journal/blood/137/4/10.1182_blood.2020009013/1/m_bloodbld2020009013f4.png?Expires=1762538256&Signature=yhPn7BuF-10DKluoqE--ZSTaL0CWM4Kj1qVqRzGHieIF8Bep7kcG8ceMjDHc7m0OSAzNwpGPVaONmJojFmmzmbNvebMkLzq4Lo-tCB8wT5AcE52X7GNu84pwEc8J~i7aIOdbn~V76HRnzuHvv~otPLQ30nKDK74QIX5GsupRNMWJiDsnMc4qUX8YgkxAj2Ly4sbgzDRyqh3Ex7cWjckqbLAwCtjubFmi5IbCvPsS18rJRkeGKHVRR1ijpCbGGrQ0oRLUpP~o0c92vicLl~2vMqibE4sTdZq7vOeCzXh7bv2p-HjXVQvG8-bpPKdcucowFt6qedsihrVeGpanThQtBw__&Key-Pair-Id=APKAIE5G5CRDK6RD3PGA)
KPT-330+CS inhibits proteins in key cellular pathways. Jeko-1 cells were treated with KPT-330 (0.5 μM), CS (3m M) as single-agent treatment and in combination for 24 hours, respectively. Subsequently, cellular proteins were cataloged through mass spectroscopy. (A-E) Volcano plots showing protein changes associated with each treatment condition; (A) KPT-330+CS vs control; (B) KPT-330 vs control; (C) CS vs control; (D) CS vs KPT-330; (E) KPT-330+CS vs KPT-330. Significantly differentially expressed proteins (absolute log2 fold change ≥2 and false discovery rate [FDR] ≤0.05) are highlighted in red. Key proteins in cell-cycle, nucleotide synthesis, and DNA-damage repair pathways are tagged where detected. (F-H) Immunoblot images validating the findings of proteomic studies following JeKo-1 cells treated with respective drug conditions. (I) Heat map showing significantly affected pathways by KPT-330+CS. An ANOVA test was used to detect the differentially expressed protein groups and cellular pathways between pairs of experimental groups. (J) Heat map showing the downregulation of selected proteins involved in DNA-damage repair, cell-cycle progression, DNA synthesis, and nuclear molecular export. Each condition was performed in biological triplicates of the JeKo-1 cell line. Differential expression P values were FDR-corrected using Benjamini-Hochberg procedure. A total of 5 group comparisons were performed: KPT-330 vs control, CS vs control, KPT-330+CS vs control, KPT-330+CS vs KPT-330, and CS vs KPT-330. For each comparison, protein groups with an FDR ≤0.05 and an absolute log2 (fold change) ≥2.0 were considered as significantly differentially expressed.
KPT-330+CS inhibits proteins in key cellular pathways. Jeko-1 cells were treated with KPT-330 (0.5 μM), CS (3m M) as single-agent treatment and in combination for 24 hours, respectively. Subsequently, cellular proteins were cataloged through mass spectroscopy. (A-E) Volcano plots showing protein changes associated with each treatment condition; (A) KPT-330+CS vs control; (B) KPT-330 vs control; (C) CS vs control; (D) CS vs KPT-330; (E) KPT-330+CS vs KPT-330. Significantly differentially expressed proteins (absolute log2 fold change ≥2 and false discovery rate [FDR] ≤0.05) are highlighted in red. Key proteins in cell-cycle, nucleotide synthesis, and DNA-damage repair pathways are tagged where detected. (F-H) Immunoblot images validating the findings of proteomic studies following JeKo-1 cells treated with respective drug conditions. (I) Heat map showing significantly affected pathways by KPT-330+CS. An ANOVA test was used to detect the differentially expressed protein groups and cellular pathways between pairs of experimental groups. (J) Heat map showing the downregulation of selected proteins involved in DNA-damage repair, cell-cycle progression, DNA synthesis, and nuclear molecular export. Each condition was performed in biological triplicates of the JeKo-1 cell line. Differential expression P values were FDR-corrected using Benjamini-Hochberg procedure. A total of 5 group comparisons were performed: KPT-330 vs control, CS vs control, KPT-330+CS vs control, KPT-330+CS vs KPT-330, and CS vs KPT-330. For each comparison, protein groups with an FDR ≤0.05 and an absolute log2 (fold change) ≥2.0 were considered as significantly differentially expressed.
To exclude the possibility that the decreased expression of these proteins was mediated by caspases during apoptosis, we probed for their temporal expression following concurrent treatment of K+CS with a pan-caspase inhibitor, Q-VD-OPh. The presence of Q-VD-OPh rescued cells from K+CS-induced cell death (supplemental Figure 2A), but did not prevent the decreased expression of the candidate proteins tested (supplemental Figure 2B). Therefore, the decreased expression of these proteins is inherently induced by K+CS, and is likely the cause, not the effect, of caspase-mediated programmed cell death.16
We also used data from the proteomic analysis to test our original hypothesis that K+CS affects the NF-κB–signaling pathway; however, the Ingenuity Pathways Analyses and GSEA determined that the expression of NF-κB–signaling pathway proteins were not significantly altered by K+CS treatment (supplemental Figure 3).
K+CS induces cell-cycle arrest in S phase
To determine the net cellular effect of all pathways identified by GSEA to be affected by K+CS (DNA synthesis, DNA-damage repair, and mitotic checkpoint regulation), we performed cell-cycle analysis. After 48 hours of K+CS treatment, JeKo-1 cells were blocked in S phase with a considerable sub-G1 peak (apoptotic cells) and such an effect was not observed in cells treated with KPT-330, CS, or DMSO control. Furthermore, only 0.7% of cells treated with K+CS were in G2/M phase compared with 12%, 15%, and 11% in cells treated with DMSO control, KPT-330, and CS, respectively (Figure 5A). To validate these findings, we synchronized JeKo-1 cells with a double-thymidine block followed by release in the presence of K+CS and observed S-phase blockade coinciding with the emergence of the sub-G1 population (Figure 5B). Given the S-phase arrest, we independently validated the decreased proportion of cells in G2/M phase through calculating the mitotic index in unsynchronized JeKo-1 cells by light microscopy; the mitotic index was 5/10 high-power fields (HPFs) after 48 hours of K+CS treatment compared with 166/10 HPFs, 153/10 HPFs, and 166/10 HPFs in cells treated with CS only, KPT-330 only, and control, respectively (P < .001 for K+CS vs KPT-330). These data suggest that K+CS blocks S-phase progression and prevents cells from entering the G2/M phases of the cell cycle. The S-phase arrest of the cell cycle induced only by K+CS treatment was also validated in the OCI-Ly1 cell line (supplemental Figure 4A).

KPT-330+CS arrests cells in S phase and inhibits DNA damage repair. (A) Cell-cycle profile of CS, KPT-330, and KPT-330+CS–treated unsynchronized JeKo-1 cells. The KPT-330+CS treatment arrests cells at S phase (blue filled arrow) and induces cell death (blue hollow arrow). (B) Cell-cycle profiles of KPT-330+CS–treated JeKo-1 cells assessed at different time points from release after G1-phase synchronization. Blue filled arrow indicates progression of S-phase arrest with time and blue hollow arrow indicates fraction of cell death. (C) γ-H2AX foci (green) formed in JeKo-1 cells following KPT-330+CS treatment of 24 hours. Images were obtained from a Zeiss LSM 780 confocal microscope at ×100 magnification (D) Immunoblot assessing γ-H2AX and Rad51 in JeKo-1 cells following KPT-330+CS treatment. (E) Comet assay indicated DNA damage (comet tail) in JeKo-1 cells treated with KPT-330+CS for 24 hours. Images were obtained from Zeiss LSM 780 confocal microscope at ×10 magnification after staining with SYBR gold DNA stain (red square denotes cells additionally magnified 2×). (F) HRD assessment following respective drug treatments. Y-axis represents percent GFP+ cells assessed through flow cytometry. The GFP+ cell signifies the degree of HR proficiency. (G)Viability assessment of JeKo-1 cells through Annexin V/PI assay following 48 hours of incubation with respective drug concentrations; KPT-330 (0.5 µM), and CS (3 mM) and olaparib (10 µM). **P = .0016. The paired Student t test was used to compare all continuous variables. A value of P < .05 was considered statistically significant.
KPT-330+CS arrests cells in S phase and inhibits DNA damage repair. (A) Cell-cycle profile of CS, KPT-330, and KPT-330+CS–treated unsynchronized JeKo-1 cells. The KPT-330+CS treatment arrests cells at S phase (blue filled arrow) and induces cell death (blue hollow arrow). (B) Cell-cycle profiles of KPT-330+CS–treated JeKo-1 cells assessed at different time points from release after G1-phase synchronization. Blue filled arrow indicates progression of S-phase arrest with time and blue hollow arrow indicates fraction of cell death. (C) γ-H2AX foci (green) formed in JeKo-1 cells following KPT-330+CS treatment of 24 hours. Images were obtained from a Zeiss LSM 780 confocal microscope at ×100 magnification (D) Immunoblot assessing γ-H2AX and Rad51 in JeKo-1 cells following KPT-330+CS treatment. (E) Comet assay indicated DNA damage (comet tail) in JeKo-1 cells treated with KPT-330+CS for 24 hours. Images were obtained from Zeiss LSM 780 confocal microscope at ×10 magnification after staining with SYBR gold DNA stain (red square denotes cells additionally magnified 2×). (F) HRD assessment following respective drug treatments. Y-axis represents percent GFP+ cells assessed through flow cytometry. The GFP+ cell signifies the degree of HR proficiency. (G)Viability assessment of JeKo-1 cells through Annexin V/PI assay following 48 hours of incubation with respective drug concentrations; KPT-330 (0.5 µM), and CS (3 mM) and olaparib (10 µM). **P = .0016. The paired Student t test was used to compare all continuous variables. A value of P < .05 was considered statistically significant.
It is known that some cell-cycle–related proteins are only expressed during the cell-cycle stages in which they are scheduled to function, whereas others are constitutively expressed throughout the cell cycle.17-24 Given that K+CS treatment leads to S-phase arrest, we anticipated that some proteins specific to stages outside of S-phase should be underexpressed, especially those specific for the G2/M phase. Using a protein-expression database (https://cyclebase.org/CyclebaseSearch), we identified that more than one-third of proteins downregulated following K+CS treatment were specific for G2/M including Bub1, Bub1b, AURKA, CDCA3, and PLK1. To validate this, we profiled the temporal expression of proteins with specific functions in S phase (Rad51 and TYMS) or G2/M phase (AURKA, Bub1b, and PLK1) by immunoblotting. In untreated synchronized JeKo-1 cells, AURKA, Bub1b, and PLK1 were only expressed in G2/M whereas Rad51 and TYMS were expressed throughout the cell cycle (supplemental Figure 4B).17-21
Evaluating DNA damage following K+CS treatment
To investigate the antitumor mechanism(s) of K+CS, we focused on Rad51 and TYMS because the decreased expression of Aurora A, PLK1, CDCA3, Bub1, and Bub1b proteins were likely secondary to S-phase arrest rather than a direct drug effect.17-21 Given that K+CS induced cell-cycle arrest in S phase and caused decreased expression of Rad51 (Figure 4A,F,J), we hypothesized that K+CS may also hinder DNA-damage repair pathways leading to induction of DNA breaks that are readily visualized by serine 139–phosphorylated H2AX (γ-H2AX) foci, the hallmark of ongoing DNA-damage repair.25 Indeed, strong γ-H2AX+ foci were detectable by immunofluorescence in K+CS-treated JeKo-1 cells but not in control (Figure 5C). In a second independent approach, we observed strong expression of γ-H2AX protein by immunoblotting with concomitant decrease of Rad51 in K+CS-treated JeKo-1 cells (Figure 5D) and a primary patient sample with marginal zone lymphoma (supplemental Figure 5A).
To further demonstrate that these γ-H2AX+ DNA foci are evidence of unproductive DNA repair due to the reduced Rad51 expression, we performed a comet assay that directly detects the integrity of cellular DNA. K+CS-treated JeKo-1 exhibited DNA fragmentation resulting in “comet-like” DNA-mobility profiles (Figure 5E), thus confirming that K+CS-treated cells harbor a significant level of unrepaired DNA breaks: a condition known to be detrimental to cell-cycle progression and survival.26 The presence of unrepaired DNA breaks, which is caused by K+CS treatment, was also independently validated through comet assay in OCI-Ly1 cells (supplemental Figure 5B).
K+CS treatment induces homologous recombination deficiency
Given that the major role of Rad51 in DNA-damage repair is through homologous recombination (HR),25 we assessed the HR status following drug treatment by using a reporter construct. Previously validated Hela-DR-GFP cells, which stably express a reporter construct to detect DNA-damage repair through HR, was used.27 As shown in Figure 5F, KPT-330 single-agent treatment induced HR deficiency (HRD) in Hela cells in a concentration-dependent manner. However, when KPT-330 at the same concentrations was combined with CS, the HRD was significantly more pronounced when compared with KPT-330 single-agent treatment.
PARP inhibitors further potentiate the antitumor effect of K+CS
The reduced expression of Rad51 coupled with evidence of HRD following K+CS treatment offers an opportunity to further enhance antitumor activity through the induction of Rad51 insufficiency. Because Rad51 and BRCA proteins are essential for HR,28,29 and BRCA deficiency can lead to synthetic lethality in malignant cells treated with poly (ADP-ribose) polymerase (PARP) inhibitors,30 we hypothesized that K+CS-treated cells would also be sensitive to PARP inhibitors such as olaparib.28 Olaparib alone or with single-agent KPT-330 or CS did not have any antitumor activity (Figure 5G); however, K+CS with olaparib induced more cytotoxicity than K+CS alone, suggesting that K+CS treatment induces a phenotype similar to BRCA deficiency. This profound HRD state induced by K+CS through downregulation of Rad51 could functionally be exploited through rational combinations with PARP inhibitors.
K+CS treatment depresses DNA synthesis by affecting thymidine synthesis
Given the decrease of TYMS protein expression in cell lines (Figure 4F) and primary patient samples with K+CS (supplemental Figure 6A), we explored the role of TYMS in K+CS-induced antitumor activity. Cells were cultured in thymidine-free media and treated with KPT-330 and CS alone or in combination, and with or without exogenous thymidine supplementation. The addition of exogenous thymidine produced a statistically significant increase in cell viability after K+CS treatment (supplemental Figure 6B), suggesting that the K+CS antitumor effect also involves, at least in part, the TYMS-mediated pyrimidine synthesis pathway.
K+CS treatment decreases the expression of CRM1, Rad51, and TYMS in vivo
After establishing the effect of K+CS on CRM1, Rad51, and TYMS proteins in vitro, we assessed the expression of these proteins in vivo through immunohistochemistry following KPT-330, CS single-agent and K+CS treatment in NSG mice bearing subcutaneously engrafted MCL tumors. As depicted in Figure 2D, K+CS treatment decreased the expression of the aforementioned proteins, therefore validating our in vitro data.
K+CS affects the cellular transcriptome
Given that gene transcription requires efficient nucleocytoplasmic transport of many regulatory proteins, we investigated the effect of K+CS treatment on global and pathway-specific gene expression by RNA sequencing. Transcripts of proteins involved in DNA-damage repair, DNA synthesis, and cell-cycle regulation were downregulated following K+CS treatment (supplemental Figure 7A-D). Of interest, the transcription of XPO1 was upregulated upon K+CS treatment, further suggesting that protein degradation is a major mechanism behind the observed diminution of CRM1 expression (supplemental Figure 7A). Moreover, the pathway analysis of the affected transcriptome strongly overlaps with that of the affected proteins, thereby confirming that K+CS treatment affects the transcription of proteins involved in DNA-damage repair, DNA synthesis, and cell-cycle progression (supplemental Figure 7E; supplemental Table 3). We also validated the expression of selected transcripts (Rad51, TYMS, and XPO1) in JeKo-1 cells by quantitative PCR and K+CS significantly decreased the expression of Rad51 and TYMS while increasing the expression of XPO1 transcripts (supplemental Figure 7F).
K+CS has potent antitumor effects on primary patient samples
Strong antitumor effects were observed with K+CS compared with single agents or DMSO control in fresh primary patient tumor samples ex vivo (Figure 6A). More importantly, the antitumor effect was even more pronounced in aggressive hematologic malignancies, including transformed DLBCL, DLBCL with MYC translocation and BCL2/BCL6 rearrangement, MM with high-risk cytogenetics,31 MCL resistant to the Bruton tyrosine kinase inhibitor (BTKi) and the B-cell lymphoma 2 inhibitor, high-risk chronic lymphocytic leukemia (CLL)32 resistant to BTKi, and high-risk CLL with TP53 deletion refractory to BTKi and idelalisib-based regimens (supplemental Table 4). We also measured cell proliferation by Ki-67 staining in representative control primary tumor samples used in these experiments and the results confirmed that the majority of cells in the ex vivo culture and experimental conditions are in the growth phase of the cell cycle (data not shown). To assess the effects of K+CS on nonmalignant human cells, we tested mononuclear cells from blood, spleens, lymph nodes, and marrows obtained from patients without a pathologic- or flow cytometry–proven diagnosis of malignancy and found minimal cytotoxicity compared with malignant cells (Figure 6B; supplemental Table 4). The observations of potent cytotoxicity in high proliferative tumors but significantly fewer on normal cells is understandable because the molecular pathways affected by K+CS are more used by tumor cells compared with nonmalignant cells.

KPT-330+CS imposes significant antitumor effect on primary malignant patient samples. (A) Viability assay on mononuclear cells obtained from primary patient tissue samples with malignancy following 48 hours of incubation with respective drug treatment. Plasma cells from patients with MM were obtained following CD138 sorting through positive selection. (B) Viability assay showing the effect of KPT-330, CS and KPT-330+CS on mononuclear cells obtained from peripheral blood of healthy donors without a flow cytometry proven diagnosis of malignancy, and tissue biopsies from the indicated tissue types from patients without a diagnosis of cancer per histopathologic review. Cells were treated with 0.5 µM KPT-330 and 3 mM CS as single agent or in combination for 48 hours. (C) Patient tumor samples derived from PDX (5 ovarian cancers and 2 gliomas) were treated ex vivo with KPT-330 and CS as single agents, or in combination. Ovarian tumor cells were treated with 0.6 µM KPT-330 and 0.6 mM CS as single agent or in combination. Glioma cells were treated with 0.1 µM KPT-330 and 0.3 mM CS as single agent or in combination. *P < .05 to P < .005; **P < .005 to P < .0005; ***P < .0005. Paired Student t test was used to compare all continuous variables. A P value of <.05 was considered statistically significant.BM, bone marrow; CLL, chronic lymphocytic leukemia; CMML, chronic myelomonocytic leukemia; LPL, lymphoplasmacytic lymphoma with IgG monoclonal gammopathy; MCL, mantle cell lymphoma; MZL, marginal zone lymphoma; PBMC, peripheral blood mononuclear cell; PDX, patient-derived xenograft; TCL, T-cell lymphoma; WM, Waldenstrom macroglobulinemia.
KPT-330+CS imposes significant antitumor effect on primary malignant patient samples. (A) Viability assay on mononuclear cells obtained from primary patient tissue samples with malignancy following 48 hours of incubation with respective drug treatment. Plasma cells from patients with MM were obtained following CD138 sorting through positive selection. (B) Viability assay showing the effect of KPT-330, CS and KPT-330+CS on mononuclear cells obtained from peripheral blood of healthy donors without a flow cytometry proven diagnosis of malignancy, and tissue biopsies from the indicated tissue types from patients without a diagnosis of cancer per histopathologic review. Cells were treated with 0.5 µM KPT-330 and 3 mM CS as single agent or in combination for 48 hours. (C) Patient tumor samples derived from PDX (5 ovarian cancers and 2 gliomas) were treated ex vivo with KPT-330 and CS as single agents, or in combination. Ovarian tumor cells were treated with 0.6 µM KPT-330 and 0.6 mM CS as single agent or in combination. Glioma cells were treated with 0.1 µM KPT-330 and 0.3 mM CS as single agent or in combination. *P < .05 to P < .005; **P < .005 to P < .0005; ***P < .0005. Paired Student t test was used to compare all continuous variables. A P value of <.05 was considered statistically significant.BM, bone marrow; CLL, chronic lymphocytic leukemia; CMML, chronic myelomonocytic leukemia; LPL, lymphoplasmacytic lymphoma with IgG monoclonal gammopathy; MCL, mantle cell lymphoma; MZL, marginal zone lymphoma; PBMC, peripheral blood mononuclear cell; PDX, patient-derived xenograft; TCL, T-cell lymphoma; WM, Waldenstrom macroglobulinemia.
Having demonstrated the antitumor activity of K+CS on hematological malignancies, we aimed to understand whether this combination could exert similar toxicity on PDX from solid tumors. To that end, 8 ovarian cancer samples obtained from PDX models were treated ex vivo with K+CS, KPT-330, or CS as single agents, or with DMSO control. Of the 8 samples, 5 (63%) showed significant synergistic antitumor effects with K+CS, and the combination index was <1.0 at 50% fraction affected (Figure 6C; supplemental Figure 8). Because both KPT-33033 and salicylates34 penetrate the blood-brain barrier, 2 PDX tumor samples (an aggressive fibrillary astrocytoma and a glioblastoma) were also tested ex vivo, and potent cytotoxicity with K+CS treatment was observed (Figure 6C).
Discussion
The recent approval of KPT-330 is important because it is the first in a new class of drugs that target CRM1.35 At the approved dose, KPT-330 exhibits substantial toxicity in patients that has limited further dose escalation and testing of that schedule in other cancers.9,36 Herein, we describe that the combination of KPT-330 with CS produces a robust antitumor effect across a broad range of hematological malignancies and solid tumors, primary patient samples obtained from patients bearing high-risk tumors, ex vivo cultures made from PDX, and in vivo studies in mice with relatively few effects on nonmalignant cells and organ systems. These data indicate that K+CS is selectively targeting cellular mechanisms vital to multiple cancer cell types.37 Although the synergy and lower IC50 of K+CS we report are important, the discovered mechanisms of action are even more intriguing because they go beyond CRM1 inhibition. In addition to enhanced inhibition of nuclear protein export, we show that K+CS can arrest the cells in S phase and inhibit DNA-damage repair necessary for the completion of DNA replication.38
Previous studies have shown that KPT-330 single-agent treatment leads to G0/G1 cell-cycle arrest and some have reported that KPT-330 single-agent treatment could result in decreased expression of CRM1 and Rad51, leading to a DNA-damage phenotype.8,39-49 Furthermore, in MCL cell lines, KPT-330 has been shown to induce G0/G1 phase arrest and could overcome inherit ibrutinib resistance through NF-κB inhibition.50 In our experimental model, we did not find a significant decrease in CRM1 or Rad51 expression with single-agent KPT-330 treatment (Figure 4G; supplemental Figure 1B). K+CS treatment did induce HRD to a greater extent than KPT-330 alone. Furthermore, the synergistic antitumor effect observed when K+CS is combined with a PARP inhibitor offers phenotypic validation to the profound HRD induced by K+CS treatment as compared with KPT-330 single-agent treatment where no antitumor effect was observed when combined with PARP inhibitors.
More importantly, our study showed that K+CS induces S-phase arrest leading to cancer cell death. To our knowledge, this report presents the first account of S-phase arrest induced by a drug treatment with a CRM1 inhibitor, thereby demonstrating that the mechanisms responsible for the antitumor activity of K+CS are different from those previously reported for KPT-330 alone. This S-phase arrest also confirms the cellular phenotype of impaired expression of Rad51 and TYMS.51-55 Hence, this constellation of effects on malignant cells with K+CS is different from the standard classes of antitumor agents currently in use, and therefore has the potential to be a novel treatment option for high-risk, difficult-to-treat cancers.
As the next step of this work, a phase 1 clinical trial of low-dose KPT-330 plus CS has been approved by the US FDA for patients with R/R NHL to learn the toxicity profile and provide early insights on efficacy. Correlative studies on pretreatment biopsies will assess tumor proliferation rate, CRM1 expression, and the status of DNA-damage repair proficiency in relation to tumor response. This report will also stimulate further investigations into DNA-damage repair in hematological malignancies given our observed effects of K+CS on Rad51 and the resulting synergy with olaparib. Moreover, considering the role of PARP inhibition in LMO2+ DLBCL, the combination of K+CS should be tested in that subgroup.56
We acknowledge that, despite the extensive experiments we conducted, how the 2 drugs are interacting with each other, CRM1, or the other proteins studied is not known. Although the mechanisms that we have put forward along with the S-phase arrest are novel, the interdependency of these cellular processes makes it difficult to infer whether these mechanisms occur in parallel or in a serial manner to cause cellular apoptosis. Notwithstanding these limitations, our strong preclinical data suggest that this novel drug combination has the potential to reenergize investigations into the use of CRM1 inhibitors by use of lower doses that will reduce toxicity while expanding their use into cancers other than MM and NHL.
The RNA-sequencing data reported in this article have been deposited in the Gene Expression Omnibus database (accession number GSE160186).
For original RNA-sequencing and proteomic data, contact witzig.thomas@mayo.edu.
The online version of this article contains a data supplement.
The publication costs of this article were defrayed in part by page charge payment. Therefore, and solely to indicate this fact, this article is hereby marked “advertisement” in accordance with 18 USC section 1734.
Acknowledgments
The authors acknowledge Carrie K. Holtz Heppelmann, Michael W. Holmes, Kenneth L. Johnson, and Cristine M. Charlesworth, and the Proteomics, Gene Analysis, and Flow Cytometry Cores at Mayo Clinic (Rochester, MN).
This work was supported by a Conquer Cancer Young Investigator Award and by The Hearst Foundation. This research was supported in part by the following Specialized Program of Research Excellence (SPORE) grants from the National Institutes of Health (NIH)/National Cancer Institute: the University of Iowa/Mayo Clinic Lymphoma SPORE (CA97274), the Mayo Clinic Breast SPORE (P50CA116201), the Mayo Clinic SPORE in Myeloma (CA186781), and the Mayo Clinic Ovarian SPORE (P50 CA136393). This research was also supported by the Predolin Foundation Biobank and by Public Health Service grant UL1TR002377 from the NIH/National Center for Advancing Translational Sciences (NCATS).
Any opinions, findings, and conclusions expressed in this material are those of the author(s) and do not necessarily reflect those of the American Society of Clinical Oncology, Conquer Cancer, or The Hearst Foundation.
Authorship
Contribution: J.P.A., X.W., K.E.N., and T.E.W. conceptually designed experiments; J.P.A., X.W., K.E.N., S.D., A.R., R.L.K., J.B., M.J.S., R.M.C., M.K.M., J.Y., J.C.B, L.W., J.P., J.R.M., S.I.R., and M.P.G. acquired, analyzed, and interpreted data; P.K., S.A.P., and S.K. obtained patient samples; S.D. performed bioinformatics and statistical analyses; J.P.A., K.E.N., X.W., J.L.P., and A.L.F. performed in vivo studies in NSG mice; S.J.W., X.H., J.N.S., and A.C.M. performed studies using PDX models; C.H. and F.J.C. performed experiments to assess HRD status in drug-treated cells; and X.W., M.M.P., and T.E.W. supervised the study.
Conflict-of-interest disclosure: For clinical studies in which S.A.P. was principal investigator, research funding was provided to the institution from Pharmacyclics, MorphoSys, Janssen, AstraZeneca, TG Therapeutics, Celgene, AbbVie, and Ascentage Pharma; S.A.P. also serves in advisory board meetings for Pharmacyclics, AstraZeneca, Genentech, Gilead, GlaxoSmithKline, Verastem Oncology, and AbbVie (not personally compensated for participation). J.N.S. received financial support greater than $10 000 dollars from Novartis, Basilea, Genentech, Sanofi, Beigene, Lilly, GlaxoSmithKline, Peloton, Glionova, Bristol Myers Squibb Pharmaceuticals, Cavion, Curtana, Forma, AbbVie, Actuate, Boehringer Ingelheim, Bayer, Celgene, Cible, Mitochon Wayshine, and Nerviano Medical Sciences. P.K. received clinical research support from Takeda Pharmaceuticals North America, Inc, Amgen, Inc, AbbVie, GlaxoSmithKline, Janssen, and Sanofi US; served on a scientific advisory board or as a consultant or expert witness for Sanofi-Aventis US, GlaxoSmithKline, and Takeda Pharmaceuticals North America, Inc, with compensation to Mayo Clinic; and has received personal compensation from Pharmacyclics, Cellectar, and Karyopharm for serving on a scientific advisory board or as a consultant. M.M.P. served on an advisory board for Stem Line Pharmaceuticals. T.E.W. served on an advisory board meeting in 2018 for Karyopharm Pharmaceuticals and was personally compensated and serves on other advisory boards, none of which have any bearing on the subject of this manuscript. Mayo Clinic has received funding from Karyopharm to conduct clinical trials and has a patent pending on this research. The remaining authors declare no competing financial interests.
Correspondence: Thomas E. Witzig, Division of Hematology, Department of Medicine, Mayo Clinic, 200 First St SW, Rochester, MN 55905; e-mail: witzig.thomas@mayo.edu.

This feature is available to Subscribers Only
Sign In or Create an Account Close Modal