

Key Points
GC resistance remains a clinical challenge in the treatment of lymphoid malignancies.
We demonstrate that PGE2 increases cAMP and potentiates GC-induced leukemic cell death.

Abstract
Glucocorticoid (GC) resistance remains a clinical challenge in pediatric acute lymphoblastic leukemia where response to GC is a reliable prognostic indicator. To identify GC resistance pathways, we conducted a genome-wide, survival-based, short hairpin RNA screen in murine T-cell acute lymphoblastic leukemia (T-ALL) cells. Genes identified in the screen interfere with cyclic adenosine monophosphate (cAMP) signaling and are underexpressed in GC-resistant or relapsed ALL patients. Silencing of the cAMP-activating Gnas gene interfered with GC-induced gene expression, resulting in dexamethasone resistance in vitro and in vivo. We demonstrate that cAMP signaling synergizes with dexamethasone to enhance cell death in GC-resistant human T-ALL cells. We find the E prostanoid receptor 4 expressed in T-ALL samples and demonstrate that prostaglandin E2 (PGE2) increases intracellular cAMP, potentiates GC-induced gene expression, and sensitizes human T-ALL samples to dexamethasone in vitro and in vivo. These findings identify PGE2 as a target for GC resensitization in relapsed pediatric T-ALL.
Introduction
Glucocorticoids (GCs) are a mainstay of treatment of lymphoid malignancies, and resistance to GCs is the single most reliable prognostic indicator for relapse among children with acute lymphoblastic leukemia (ALL).1,2 Despite the importance of GCs in ALL therapy, the biologic mechanisms that result in de novo or acquired resistance are poorly understood.
GCs exert their effect through the GC receptor (GR, encoded by the NR3C1 gene). The GR is a cytosolic ligand-activated zinc finger transcription factor of the nuclear receptor family. In the absence of ligand, GR resides in the cytoplasm, sequestered by its interactions with heat shock proteins. On ligand binding, the GR dissociates from this complex and translocates into the nucleus, where it binds DNA as a homodimer at tandem GC-responsive elements (GREs) or as a monomer at a GRE half site. The GR is phosphorylated after ligand binding by several serine/threonine kinases including p38 mitogen-activated protein kinase (MAPK), cyclin-dependent kinase (CDK)1/5, and protein kinase B (AKT)1, which regulate GR transcriptional activity and/or localization.3-6 In lymphoid cells, GR induces expression of BCL2L11, which encodes the proapoptotic BCL-2–like protein 11 (BIM), triggering apoptosis.7 Other proapoptotic proteins such as PUMA also contribute as BIM-deficient murine lymphoid cells remain sensitive to dexamethasone-mediated apoptosis.8,9
GC resistance can involve upregulation of antiapoptotic family members including BCL2 and MCL1, which antagonize BIM function,10,11 or can involve epigenetic deregulation of BCL2L11.12 GC resistance can also reflect MAPK, Janus kinase (JAK)/signal transducer and activator of transcription (STAT), WNT, or phosphatidylinositol 3-kinase/AKT/mechanistic target of rapamycin (mTOR) pathway activation,6,13-16 which promotes survival and may also directly disable GR function(s).6 Several strategies have been explored to enhance GC-mediated apoptosis of leukemic cells in preclinical studies, including use of mTOR or glycolysis inhibitors,10,16-18 and in T-cell ALL (T-ALL), where NOTCH1 is frequently mutated, γ secretase inhibitors.14 However, these agents show limited efficacy, and toxicity precludes their incorporation into reinduction therapy for relapsed patients. Herein we undertook a functional approach to identify GC resistance genes.
Materials and methods
Primary mouse and patient T-ALL cells and cell lines
Mouse Tal1/Lmo2 T-ALL and human T-ALL cell lines were cultured as described previously.19 Human T-ALL cell lines were validated using STR10 authentication assay. Primary human T-ALL samples were obtained from children with T-ALL enrolled in clinical trials at the Dana-Farber Cancer Institute or University of Massachusetts Memorial Hospital. Samples were collected with informed consent, with approval of the institutional review board, and in accordance with the Declaration of Helsinki. Primary human T-ALL samples were expanded and cultured as previously described.19
In vivo studies
For complete details see supplemental Methods, available on the Blood Web site. Briefly Gnas-deficient mouse T-ALL cells were transplanted into sublethally irradiated recipients. Mice were then randomized and injected intraperitoneally with vehicle or dexamethasone daily for 3 weeks (5 days on; 2 days off). T-ALL patient-derived xenografts (PDXs) were established as described previously.20,21 When human leukemic blasts reached 5% or 20% (human CD45+), PDXs were treated with vehicle, dexamethasone, 16,16-dimethyl-prostaglandin E2 (dmPGE2), or the combination. Mice were treated for 2 weeks (5 days on; 2 days off), and leukemic burden or survival was measured. All mouse procedures used in this study were approved by the University of Massachusetts Medical School Institutional Animal Care and Use Committee.
Short hairpin RNA library infection and MiSeq analysis
Library infection and preparation of the bar-coded library (sequences in supplemental Table 7) and samples were sequenced using the MiSeq system as previously described.22 Complete methods can be found in the supplemental Materials and methods.
DNA and RNA analyses
RNA was extracted and cDNA synthesized and quantitative real-time polymerase chain reaction (qPCR) was performed as previously described,19 using primers specified in supplemental Table 8. Gene expression was determined using the ΔΔCT method normalized to β-actin, and the vehicle control was set to 1.
Cell viability and death assays
Leukemic cell lines or patient samples were treated with dexamethasone or cyclic adenosine monophosphate (cAMP)-activating agents for 48 to 72 hours, and metabolic activity was assayed using the CellTiter-Glo chemiluminescence reagent (Promega) or MTS reagent (Promega), and nonlinear dose-response curves were fitted as described previously19 using Prism 7 software (GraphPad). To quantify apoptotic cells, T-ALL cells lines were stained with Annexin V and 7-aminoactinomycin D (7AAD) following the manufacturer’s protocol (BD Bioscience) and analyzed by flow cytometry.
Statistical measures
Data are presented as means ± standard error of the mean (SEM). Statistical analysis was performed using the unpaired, 2-tailed Student t test or 1- or 2-way analysis of variance with post hoc Tukey’s test. Kaplan-Meier survival curves were performed using GraphPad Prism software, version 7.0, as described previously.19
Results
Whole-genome survival-based short hairpin RNA screen identifies glucocorticoid resistance genes
To identify genes that regulate GC resistance in T-ALL, we transduced murine T-ALL cells with a mouse whole-genome lentiviral TRC (The RNAi Consortium) library, containing ∼75 000 short hairpin RNA (shRNA) constructs directed against 16 000 genes in 15 pools in the form of high-titer lentiviral supernatant (TRC library; 3-5 shRNAs per transcript). Leukemic cells were infected at a multiplicity of infection of 0.2 to achieve a single shRNA copy per cell, selected with puromycin, and treated with dexamethasone to kill >99% of the leukemic cells (Figure 1A). We conducted the screen in mouse T-ALL cells because most human T-ALL cell lines fail to undergo sufficient levels of apoptosis for a survival-based approach6,14 (supplemental Figure 1A-B). Mouse T-ALL cell lines are sensitive to dexamethasone-induced apoptosis (supplemental Figure 1C-D; average GI50 = 14 nM), thereby providing us with a unique opportunity to identify genes that prevent dexamethasone-induced apoptosis. We retested our shRNA pools for dexamethasone sensitivity and detected significantly fewer apoptotic cells in the shRNA pools compared with nonsilencing (NS) cells, indicating that the dexamethasone-resistant phenotype was stable and reproducible (supplemental Figure 1E). To ensure technical reproducibility, 2 replicate libraries (A and B) were created using 2 individual barcodes. Scatter plots show the correlation of log10 of shRNA abundance between pools (Figure 1B; R = .99). Relative representation of each shRNA in viable cells after dexamethasone treatment was determined by counts per million reads (Figure 1C; supplemental Table 1). The top hit in the screen was Nr3c1, which encodes the GR. Multiple Nr3c1-specific shRNAs (TRC shRNAs numbers 223, 186, and 182) were enriched in the screen (Figure 1D). Importantly, Nr3c1 shRNA rank correlated with both dexamethasone effects on leukemic cell viability and decreases in Nr3c1 mRNA and protein levels (Figure 1E-G). Several other genes known to interact with the GR or to mediate GC resistance were identified (Figure 1H).23-26 Notably, tumor suppressor genes important in ALL and GC resistance scored as hits in our mouse screen.26-29 Additional genes identified in the screen were found mutated in relapsed ALL samples30,31 (Figure 1H). Validation of candidate genes identified in the shRNA screen was 74.5%; knockdown of 35 of 47 genes resulted in GC resistance in mouse leukemia cells (Figure 1I; supplemental Figure 1F).

A genome-wide shRNA screen for dexamethasone resistance identify genes enriched in cAMP signaling. (A) Schematic of whole-genome survival-based shRNA screen performed in the mouse T-ALL cell line 1390. (B) Biological reproducibility of the relative changes in shRNA abundance between 2 independent preparations of shRNA MiSeq libraries. (C) Number of shRNAs identified by counts per million reads in MiSeq analysis. (D) shRNA rank by average counts per million determined by MiSeq. shRNAs to the glucocorticoid receptor (Nr3c1) are highlighted in red. (E) Annexin V/7AAD staining of mouse T-ALL 1390 cells stably expressing nonsilencing (NS) or Nr3c1 shRNAs treated with vehicle or dexamethasone (50 nM) for 48 hours. (F) Quantitative PCR (qPCR) analysis of Nr3c1 mRNA in mouse T-ALL cells transduced with Nr3c1-specific shRNAs or an NS shRNA after dexamethasone (100 nM) treatment of 6 hours. (G) NR3C1 protein levels in mouse T-ALL 1390 cells expressing NS or Nr3c1 shRNAs treated with vehicle or dexamethasone (100 nM) for 6 hours. (H) Venn diagram showing genes identified in shRNA screen that interact with NR3C1, have tumor suppressor function, been previously implicated in glucocorticoid resistance, and are mutated in ALL patients. (I) Validation of selected shRNAs identified in the shRNA screen using MTS assay in mouse T-ALL cell line 1390 after dexamethasone (0-1 μM) treatment of 48 hours. All data were normalized to vehicle-treated cells. (J) Volcano plot showing genes identified in shRNA screen cross referenced with genes differentially expressed in microarray of paired ALL patient samples at the time of diagnosis or at relapse. (K) Venn diagram of genes identified in shRNA screen and decreased in microarray tables of relapse ALL patients (P < .05; N = 49 paired patient samples). (L) KEGG pathway analysis performed in the Database for Annotation, Visualization and Integrated Discovery (DAVID) on genes identified in shRNA screen and genes significantly downregulated at the time of relapse (GSE28460, or in GC-resistant patient samples (GSE66702, GSE66705). (M) Venn diagram of cAMP genes identified in shRNA screen and decreased in relapsed patient (relapsed genes, right circle) or GC resistant patient samples (resistance genes, left circle). (N) Expression levels of cAMP genes in 49 paired samples at diagnosis and on relapse as determined by microarray identified in shRNA screen (GSE28460). Paired t test values are shown, and connecting lines represent paired samples. All results are averages of at least 3 independent experiments, and error bars represent SEM. *P < .05, **P < .01, ***P < .001.
A genome-wide shRNA screen for dexamethasone resistance identify genes enriched in cAMP signaling. (A) Schematic of whole-genome survival-based shRNA screen performed in the mouse T-ALL cell line 1390. (B) Biological reproducibility of the relative changes in shRNA abundance between 2 independent preparations of shRNA MiSeq libraries. (C) Number of shRNAs identified by counts per million reads in MiSeq analysis. (D) shRNA rank by average counts per million determined by MiSeq. shRNAs to the glucocorticoid receptor (Nr3c1) are highlighted in red. (E) Annexin V/7AAD staining of mouse T-ALL 1390 cells stably expressing nonsilencing (NS) or Nr3c1 shRNAs treated with vehicle or dexamethasone (50 nM) for 48 hours. (F) Quantitative PCR (qPCR) analysis of Nr3c1 mRNA in mouse T-ALL cells transduced with Nr3c1-specific shRNAs or an NS shRNA after dexamethasone (100 nM) treatment of 6 hours. (G) NR3C1 protein levels in mouse T-ALL 1390 cells expressing NS or Nr3c1 shRNAs treated with vehicle or dexamethasone (100 nM) for 6 hours. (H) Venn diagram showing genes identified in shRNA screen that interact with NR3C1, have tumor suppressor function, been previously implicated in glucocorticoid resistance, and are mutated in ALL patients. (I) Validation of selected shRNAs identified in the shRNA screen using MTS assay in mouse T-ALL cell line 1390 after dexamethasone (0-1 μM) treatment of 48 hours. All data were normalized to vehicle-treated cells. (J) Volcano plot showing genes identified in shRNA screen cross referenced with genes differentially expressed in microarray of paired ALL patient samples at the time of diagnosis or at relapse. (K) Venn diagram of genes identified in shRNA screen and decreased in microarray tables of relapse ALL patients (P < .05; N = 49 paired patient samples). (L) KEGG pathway analysis performed in the Database for Annotation, Visualization and Integrated Discovery (DAVID) on genes identified in shRNA screen and genes significantly downregulated at the time of relapse (GSE28460, or in GC-resistant patient samples (GSE66702, GSE66705). (M) Venn diagram of cAMP genes identified in shRNA screen and decreased in relapsed patient (relapsed genes, right circle) or GC resistant patient samples (resistance genes, left circle). (N) Expression levels of cAMP genes in 49 paired samples at diagnosis and on relapse as determined by microarray identified in shRNA screen (GSE28460). Paired t test values are shown, and connecting lines represent paired samples. All results are averages of at least 3 independent experiments, and error bars represent SEM. *P < .05, **P < .01, ***P < .001.
We identified human orthologs to the top shRNAs (supplemental Table 2) and cross-referenced with microarray data from 2 published studies of GC-sensitive and -resistant pediatric ALL patients and from paired ALL samples isolated at diagnosis and on relapse.32,33 We found that 272 genes identified in our screen were downregulated in leukemia patients at relapse (Figure 1J-K). Analysis of microarray data from GC-resistant ALL patients found 369 genes identified in the screen significantly decreased in GC-resistant patient samples (supplemental Figure 1H-I).33 Kyoto Encyclopedia of Genes and Genomes (KEGG) pathway analysis identified JAK-STAT and WNT pathways in dexamethasone resistance and relapse, consistent with previous reports (Figure 1L; supplemental Tables 4-6).15,16 Notably, the cAMP pathway was significantly enriched in each data set with several genes identified in the mouse screen downregulated in GC-resistant or -relapsed ALL patients (Figures 1L-N; supplemental Figure 1G,J,K; supplemental Tables 4-6). The canonical cAMP cascade initiated by heterotrimeric guanine nucleotide–binding protein (G protein)–coupled receptors, stimulates adenyl cyclases (ACs), and activates protein kinase A (PKA) or the guanine exchange factor EPAC1 (Figure 2A).
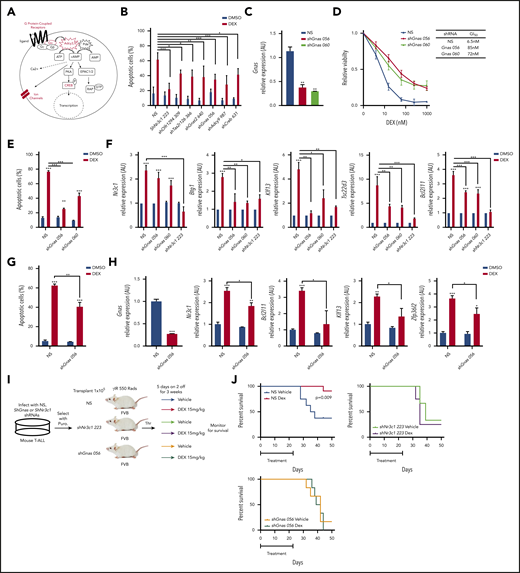
Gnas deficiency in mouse T-ALL cells results in dexamethasone resistance in vitro and in vivo. (A) Schematic of cAMP pathway highlighting genes identified in the shRNA screen using red. (B) Quantification of apoptotic 1390 T-ALL cells stably infected with shRNAs to cAMP pathway member and treated with vehicle or dexamethasone (10 nM) for 48 hours. (C) qPCR analysis of Gnas mRNA in mouse T-ALL 1390 cells stably transduced with 2 Gnas specific shRNAs or NS shRNA. (D) Relative viability of mouse T-ALL cells transduced with NS or Gnas-specific shRNAs and treated with dexamethasone (0-1 µM) for 48 hours. GI50 values are reported in table. Values are normalized to vehicle treated cells. (E) Quantification of apoptotic 1390 cells stably infected with Gnas shRNAs and treated with vehicle or dexamethasone (10 nM) for 48 hours. (F) qPCR analysis of NR3C1 target genes in 1390 cells stably transduced with NS, Gnas-specific shRNAs or a Nr3c1 shRNA following dexamethasone (100 nM) treatment of 6hrs. Values are normalized to vehicle treated controls. (G) Quantification of apoptotic 5059 cells stably infected with NS or a Gnas shRNA treated with vehicle or dexamethasone (10 nM) for 48 hours. (H) qPCR analysis of Gnas, Nr3c1, Bcl2l11, Klf13, and Zfp3612 in 5059 cells stably transduced with NS or a Gnas-specific shRNA after vehicle or dexamethasone (100 nM) treatment of 6 hours. Values are normalized to vehicle-treated controls. (I) Experimental design to assay dexamethasone resistance in vivo. (J) Kaplan-Meier curves of mice transplanted with 1390 leukemic cells transduced with NS (N = 19 mice) or shNr3c1 (N = 7) or shGnas-specific shRNAs (N = 12 mice) treated with vehicle or dexamethasone (15 mg/kg) for 3 weeks (5 days on; 2 days off). The difference in overall survival between vehicle vs dexamethasone treated mice is shown. All results are averages of at least 3 independent experiments, and error bars represent SEM. *P < .05, **P < .01, ***P < .001.
Gnas deficiency in mouse T-ALL cells results in dexamethasone resistance in vitro and in vivo. (A) Schematic of cAMP pathway highlighting genes identified in the shRNA screen using red. (B) Quantification of apoptotic 1390 T-ALL cells stably infected with shRNAs to cAMP pathway member and treated with vehicle or dexamethasone (10 nM) for 48 hours. (C) qPCR analysis of Gnas mRNA in mouse T-ALL 1390 cells stably transduced with 2 Gnas specific shRNAs or NS shRNA. (D) Relative viability of mouse T-ALL cells transduced with NS or Gnas-specific shRNAs and treated with dexamethasone (0-1 µM) for 48 hours. GI50 values are reported in table. Values are normalized to vehicle treated cells. (E) Quantification of apoptotic 1390 cells stably infected with Gnas shRNAs and treated with vehicle or dexamethasone (10 nM) for 48 hours. (F) qPCR analysis of NR3C1 target genes in 1390 cells stably transduced with NS, Gnas-specific shRNAs or a Nr3c1 shRNA following dexamethasone (100 nM) treatment of 6hrs. Values are normalized to vehicle treated controls. (G) Quantification of apoptotic 5059 cells stably infected with NS or a Gnas shRNA treated with vehicle or dexamethasone (10 nM) for 48 hours. (H) qPCR analysis of Gnas, Nr3c1, Bcl2l11, Klf13, and Zfp3612 in 5059 cells stably transduced with NS or a Gnas-specific shRNA after vehicle or dexamethasone (100 nM) treatment of 6 hours. Values are normalized to vehicle-treated controls. (I) Experimental design to assay dexamethasone resistance in vivo. (J) Kaplan-Meier curves of mice transplanted with 1390 leukemic cells transduced with NS (N = 19 mice) or shNr3c1 (N = 7) or shGnas-specific shRNAs (N = 12 mice) treated with vehicle or dexamethasone (15 mg/kg) for 3 weeks (5 days on; 2 days off). The difference in overall survival between vehicle vs dexamethasone treated mice is shown. All results are averages of at least 3 independent experiments, and error bars represent SEM. *P < .05, **P < .01, ***P < .001.
Silencing of cAMP pathway components results in glucocorticoid resistance in T-ALL
shRNAs targeting several components of the cAMP pathway were enriched in our screen including several G protein–coupled receptors (GPCRs) (Olfr294, Tas2r126), AC 3 and 9 (Adcy3,9), activating guanine nucleotide binding protein, α-stimulating Gα subunit Gnas and guanine nucleotide binding protein, α-transducing 2 Gnat2, and the cAMP responsive element binding proteins Creb1,3,5 (Figure 2A; supplemental Table 1). Knockdown of these genes in the mouse T-ALL cell line 1390 reduced dexamethasone-induced cell death (Figure 2B; supplemental Figure 1F).
Two shRNAs targeting Gnas that encodes the Gα stimulatory subunit (Gαs) of the heterotrimeric G proteins that mediate GPCR signaling were among the top 200 genes enriched in our shRNA screen (supplemental Table 1). Both shRNAs resulted in greater than 50% reduction in Gnas expression in mouse T-ALL 1390 cells (Figure 2C) and resistance to dexamethasone-induced cell death, increasing the GI50 by 12-fold (Figure 2D). Similar effects were observed in the mouse T-ALL cell line 5059 (Figure 2G-H). Dexamethasone induced apoptosis on average in 69 ± 2.1% of mouse T-ALL cells, whereas Gnas silencing reduced dexamethasone-induced apoptosis to 32.75 ± 3.3% (Figure 2E,G). We hypothesized that Gnas knockdown may mediate GC resistance by interfering with GR transcription and quantified dexamethasone-induced gene expression in mouse T-ALL (1390) cells stably expressing NS, Gnas-specific shRNAs (TRC056 060), or an Nr3c1-specific shRNA (TRC223). We detected significant decreases in the mRNA levels of known GR target genes in Gnas-deficient but not control leukemic cells (Figure 2F). As expected, Nr3c1 knockdown prevented dexamethasone-induced gene expression (Figure 2F). To test whether a Gnas deficiency alters the dexamethasone response in vivo, we transplanted mice with isogenic mouse 1390 leukemia cells stably expressing NS or Gnas- or Nr3c1-specific shRNAs and treated mice with vehicle or dexamethasone (Figure 2I). Although mice engrafted with NS control leukemic cells and treated with vehicle died from leukemia with a mean latency of 36.5 days, dexamethasone treatment prevented leukemic progression in 10 of 11 mice (Figure 2J). No significant difference in disease latency or penetrance was observed between vehicle or dexamethasone-treated mice transplanted with shGnas- or shNr3c1- transduced leukemic cells (Figure 2J), revealing that Gnas, like Nr3c1 knockdown, confers dexamethasone resistance in vivo.
GNAS deficiency reduces intracellular cAMP and NR3C1 expression in mouse and human T-ALL cells
We found that Gnas suppression in mouse 1390 T-ALL cells reduced basal Nr3c1 mRNA and protein levels (Figure 3A-B). To determine whether cAMP signaling stimulates Nr3c1 transcription and induces cell death, we used the adenylate cyclase activating agent forskolin. Forskolin increases intracellular cAMP, Nr3c1 mRNA, and protein levels and induces apoptosis in mouse T-ALL cells (Figure 3C-F). GC induced Nr3c1 mRNA levels (Figure 3D); however, NR3C1 protein levels were reduced in mouse T-ALL cells treated with dexamethasone for 6 hours (Figure 3E) because of GR ubiquitination and degradation.34 By contrast, forskolin significantly increased both NR3C1 mRNA and protein levels (Figure 3D-E). GNAS also regulates adenylate cyclase activity,35,36 and we found that Gnas silencing interfered with forskolin-induced increases in intracellular cAMP, Nr3c1 expression, and leukemic cell death (Figure 3C-F).
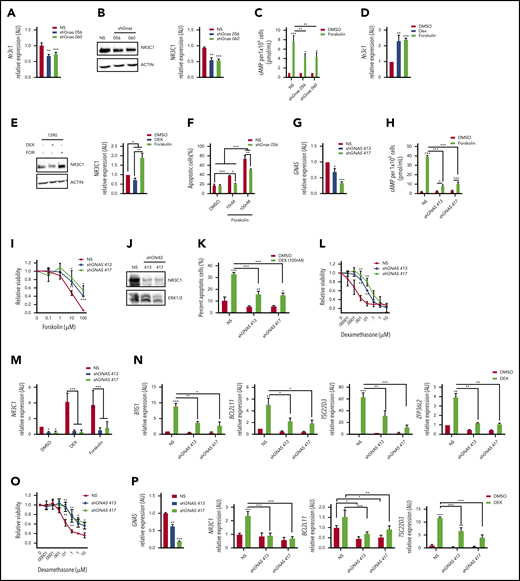
GNAS deficiency reduces NR3C1 levels and results in dexamethasone resistance in mouse and human T-ALL cells. (A) qPCR analysis of Nr3c1 mRNA in mouse T-ALLs expressing NS or Gnas shRNAs. (B) NR3C1 protein levels in mouse T-ALL cells stably transduced with NS or Gnas-specific shRNAs (TRC056060). Protein levels of 3 separate Western blots quantifed by densitometric analysis. (C) Intracellular cAMP levels of 1 × 10⁶ mouse T-ALL cells stably transduced with NS or Gnas shRNAs after vehicle or forskolin (100 nM) treatment for 30 minutes. (D-E) qPCR analysis of Nr3c1 mRNA (D) and NR3C1 protein levels (E) in mouse 1390 T-ALL cells treated with dexamethasone (100 nM) or forskolin (100 nM) for 6 hours. (F) Quantification of apoptotic cells after 48 hours of vehicle or forskolin treatment (10 or 100 nM) of mouse T-ALL 1390 cells expressing NS or a Gnas shRNA. (G) qPCR analysis of GNAS mRNA in the human T-ALL cell line DND41 stably transduced with NS or GNAS-specific shRNAs. (H) Intracellular cAMP levels in 2 × 10⁶ DND41 cells transduced with NS or GNAS-specific shRNAs treated with vehicle or forskolin (10µM) for 30 minutes. (I) Relative viability measured by cell titer glo of DND41 cells transduced with NS or GNAS-specific shRNAs after treatment with increasing concentrations of forskolin (0-100 µM) for 72 hours. (J) NR3C1 and ERK1/2 protein levels in DND41 cells transduced with NS or GNAS-specific shRNAs. (K) Quantification of apoptotic DND41 cells transduced with NS or GNAS-specific shRNAs after vehicle or dexamethasone treatment (100 nM) for 72 hours. (L) Relative viability measured by cell titer glo of DND41 cells transduced with NS or GNAS-specific shRNAs after treatment with increasing concentrations of dexamethasone (0-10 µM) for 72 hours. Data are normalized to vehicle-treated cells. (M) qPCR analysis of NR3C1 mRNA levels in DND41 cells transduced with NS or GNAS shRNAs treated with vehicle, dexamethasone (1 µM), or forskolin (10 µM) for 6 hours. (N) qPCR analysis of NR3C1 target genes in DND41 cells transduced with NS or GNAS shRNAs and treated with vehicle or dexamethasone (1 µM) for 6 hours. (O) Relative viability measured by cell titer glo of NALM-6 cells transduced with NS or GNAS-specific shRNAs after treatment with increasing concentrations of dexamethasone (0-10 µM) for 72 hours. Data are normalized to vehicle-treated cells. (P) qPCR analysis of GNAS, NR3C1, BCL2L11, and TSC22D3 in NALM-6 cells transduced with NS or GNAS shRNAs treated with vehicle or dexamethasone (1 µM) for 6 hours. ALL results are averages of at least 3 independent experiments, and error bars represent SEM. *P < .05, **P < .01, ***P < .001.
GNAS deficiency reduces NR3C1 levels and results in dexamethasone resistance in mouse and human T-ALL cells. (A) qPCR analysis of Nr3c1 mRNA in mouse T-ALLs expressing NS or Gnas shRNAs. (B) NR3C1 protein levels in mouse T-ALL cells stably transduced with NS or Gnas-specific shRNAs (TRC056060). Protein levels of 3 separate Western blots quantifed by densitometric analysis. (C) Intracellular cAMP levels of 1 × 10⁶ mouse T-ALL cells stably transduced with NS or Gnas shRNAs after vehicle or forskolin (100 nM) treatment for 30 minutes. (D-E) qPCR analysis of Nr3c1 mRNA (D) and NR3C1 protein levels (E) in mouse 1390 T-ALL cells treated with dexamethasone (100 nM) or forskolin (100 nM) for 6 hours. (F) Quantification of apoptotic cells after 48 hours of vehicle or forskolin treatment (10 or 100 nM) of mouse T-ALL 1390 cells expressing NS or a Gnas shRNA. (G) qPCR analysis of GNAS mRNA in the human T-ALL cell line DND41 stably transduced with NS or GNAS-specific shRNAs. (H) Intracellular cAMP levels in 2 × 10⁶ DND41 cells transduced with NS or GNAS-specific shRNAs treated with vehicle or forskolin (10µM) for 30 minutes. (I) Relative viability measured by cell titer glo of DND41 cells transduced with NS or GNAS-specific shRNAs after treatment with increasing concentrations of forskolin (0-100 µM) for 72 hours. (J) NR3C1 and ERK1/2 protein levels in DND41 cells transduced with NS or GNAS-specific shRNAs. (K) Quantification of apoptotic DND41 cells transduced with NS or GNAS-specific shRNAs after vehicle or dexamethasone treatment (100 nM) for 72 hours. (L) Relative viability measured by cell titer glo of DND41 cells transduced with NS or GNAS-specific shRNAs after treatment with increasing concentrations of dexamethasone (0-10 µM) for 72 hours. Data are normalized to vehicle-treated cells. (M) qPCR analysis of NR3C1 mRNA levels in DND41 cells transduced with NS or GNAS shRNAs treated with vehicle, dexamethasone (1 µM), or forskolin (10 µM) for 6 hours. (N) qPCR analysis of NR3C1 target genes in DND41 cells transduced with NS or GNAS shRNAs and treated with vehicle or dexamethasone (1 µM) for 6 hours. (O) Relative viability measured by cell titer glo of NALM-6 cells transduced with NS or GNAS-specific shRNAs after treatment with increasing concentrations of dexamethasone (0-10 µM) for 72 hours. Data are normalized to vehicle-treated cells. (P) qPCR analysis of GNAS, NR3C1, BCL2L11, and TSC22D3 in NALM-6 cells transduced with NS or GNAS shRNAs treated with vehicle or dexamethasone (1 µM) for 6 hours. ALL results are averages of at least 3 independent experiments, and error bars represent SEM. *P < .05, **P < .01, ***P < .001.
We also examined the effects of GNAS knockdown in human ALL cells by stably transducing DND41 or NALM-6 cells with a NS shRNA or with 2 GNAS-specific shRNAs. Both shRNAs reduced GNAS mRNA levels compared with NS control (Figure 3G,P). GNAS silencing in DND-41 blunted forskolin-induced increases in intracellular cAMP and prevented forskolin effects on leukemic cell viability in a dose-dependent manner (Figure 3H-I). GNAS deficiency also reduced basal NR3C1 protein levels and dexamethasone-induced leukemic cell death and significantly altered the dexamethasone GI50 by approximately 200-fold (Figure 3J-L; from 0.1 to 26 nM with TRC413 or 19.2 nM with TRC417). A GNAS deficiency in DND41 also interfered with dexamethasone- and cAMP-induced increases in NR3C1 mRNA levels and significantly reduced GR target gene expression (Figure 3M-N). Similarly, a GNAS deficiency in the human B-ALL cell line NALM-6 shifted the dexamethasone dose response 176- to 445-fold (from 0.06 to 10.6 μM with TRC413 or 26.7 μM with TRC417) and blunted dexamethasone-induced gene expression (Figure 3O-P). Together these data demonstrate that a GNAS deficiency in mouse and human T-ALL cells reduces cellular cAMP and NR3C1 expression levels and alters dexamethasone sensitivity in mouse T-ALL cells and human T- and B-ALL cell lines.
cAMP synergizes with dexamethasone to reverse GC resistance in human T-ALL cells.
Intracellular cAMP homeostasis is maintained by phosphodiesterases (PDEs) that degrade intracellular cyclic nucleotides converting cAMP into AMP. PDEs are expressed in ALL cells37 ; therefore, we treated human T-ALL cells with the broad spectrum PDE inhibitor 3-isobutyl-1-methylxanthine (IBMX) to maintain intracellular cAMP levels38 in the presence of increasing concentrations of forskolin. We demonstrate that forskolin/IBMX (designated F/I) treatment significantly alters the dexamethasone GI50 from 0.0183 to 0.0041 μM in KOPTK1 cells, resulting in 54-fold decrease in the concentration of dexamethasone required to induce equivalent leukemic cell death (Figure 4A). The human T-ALL cell line CUTLL139 was resistant to dexamethasone at the concentrations tested; however, when combined with the cAMP-elevating agents (F/I), dexamethasone significantly arrested leukemic cell growth (Figure 4C). Isobologram analysis revealed that cAMP and dexamethasone acted synergistically to impair human T-ALL growth (Figure 4B,D). Dexamethasone treatment of GC responsive human T-ALL cell lines DND41 and KOPTK1 induced apoptosis on average in 31.5% and 28.2% of the cells, respectively, but had no significant effects on cell death in CUTLL1 or MOLT4 cell lines (Figure 4E; supplemental Figure 1B). The cAMP-inducing regimen was as effective as dexamethasone in inducing apoptosis in KOPTK1 (average, 30.7 ± 12%) but had little effect on the cell death observed in other human T-ALL cell lines (Figure 4E). When used in combination with dexamethasone, cAMP activation significantly increased the leukemic cell death observed in CUTLL1 and MOLT4 (Figure 4E; average, 11-85 ± 2% and 10-63 ± 19%). We then examined the effects of cAMP signaling on dexamethasone sensitivity of primary T-ALL patient samples.19,21 We found the IBMX and forsoklin concentrations used for the human T-ALL cell lines were toxic to some primary patient samples (supplemental Figure 2B); therefore, we treated with forsoklin only to assess cAMP-dexamethasone cooperativity in T-ALL patient samples. Forskolin increased intracellular cAMP and cooperated with dexamethasone to significantly reduce the viability of diagnostic (DX) and relapsed (REL) T-ALL patient samples (Figure 4F-G, supplemental Table 9). Collectively, these in vitro data suggest that cAMP signaling sensitizes mouse and human T-ALL cells and patient samples to dexamethasone-mediated cell death.
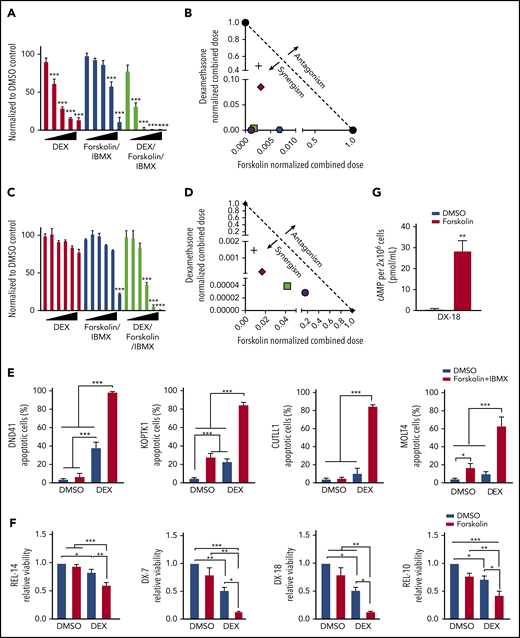
cAMP pathway activation synergizes with dexamethasone to reverse GC resistance in human T-ALL cells. Relative cell viability by cell titer glo of KOPTK1 (A) or CUTLL1 (C) cells after treatment with dexamethasone (0-10 μM), forskolin (0-100 µM), and IBMX (100 μM) or the combination (dexamethasone/forsoklin/IBMX) for 72 hours. Data are normalized to vehicle-treated cells. Isobologram plot showing synergism between forskolin/IBMX and dexamethasone treatment in human T-ALL cell lines KOPTK1 (B) and CUTLL1 (D). (E) Human T-ALL cell lines were treated with vehicle, forskolin (10 μM), and IBMX (100 μM), dexamethasone (1 μM), or with the combination (dexamethasone, forskolin/IBMX) for 72 hours, and Annexin V/7AAD-positive cells were determined by flow cytometry. (F) Relative viability by cell titer glo of 4 T-ALL patient samples (GC sensitive: TALL-x-7 and 18; GC resistant: TALL-x-14 and 10) treated in vitro with vehicle or dexamethasone (1 μM) in the presence or absence of forskolin (10 μM) for 72 hours. Data are normalized to vehicle-treated cells. (G) Intracellular cAMP levels in 2 × 10⁶ primary TALL-x-18 cells treated with vehicle or forsoklin for 30 minutes. The results are averages of at least 3 independent experiments, and error bars represent SEM. *P < .05, **P < .01, ***P < .001.
cAMP pathway activation synergizes with dexamethasone to reverse GC resistance in human T-ALL cells. Relative cell viability by cell titer glo of KOPTK1 (A) or CUTLL1 (C) cells after treatment with dexamethasone (0-10 μM), forskolin (0-100 µM), and IBMX (100 μM) or the combination (dexamethasone/forsoklin/IBMX) for 72 hours. Data are normalized to vehicle-treated cells. Isobologram plot showing synergism between forskolin/IBMX and dexamethasone treatment in human T-ALL cell lines KOPTK1 (B) and CUTLL1 (D). (E) Human T-ALL cell lines were treated with vehicle, forskolin (10 μM), and IBMX (100 μM), dexamethasone (1 μM), or with the combination (dexamethasone, forskolin/IBMX) for 72 hours, and Annexin V/7AAD-positive cells were determined by flow cytometry. (F) Relative viability by cell titer glo of 4 T-ALL patient samples (GC sensitive: TALL-x-7 and 18; GC resistant: TALL-x-14 and 10) treated in vitro with vehicle or dexamethasone (1 μM) in the presence or absence of forskolin (10 μM) for 72 hours. Data are normalized to vehicle-treated cells. (G) Intracellular cAMP levels in 2 × 10⁶ primary TALL-x-18 cells treated with vehicle or forsoklin for 30 minutes. The results are averages of at least 3 independent experiments, and error bars represent SEM. *P < .05, **P < .01, ***P < .001.
cAMP-PKA pathway resensitizes to dexamethasone via effects on NR3C1 expression and activity
To determine how cAMP sensitizes human T-ALL cells to dexamethasone, we examined cAMP effects on NR3C1 expression, phosphorylation, and activation. We observed significant increases in NR3C1 mRNA and protein levels in the human T-ALL cell lines treated with F/I or with dexamethasone + F/I (Figure 5A-D). GCs trigger GR autoinduction,24 and modest increases in NR3C1 transcription were detected in dexamethasone-treated mouse and human T-ALL cells (Figures 3D and 5E-F). However, GR activity is also regulated by receptor ubiquitination and degradation,34 and consequently, reduced NR3C1 protein levels were observed in mouse and human T-ALL cell lines at various times after dexamethasone treatment (Figures 3E and 5B). By contrast, cAMP signaling resulted in sustained increases in GR protein levels (Figures 3E and 5B,D).
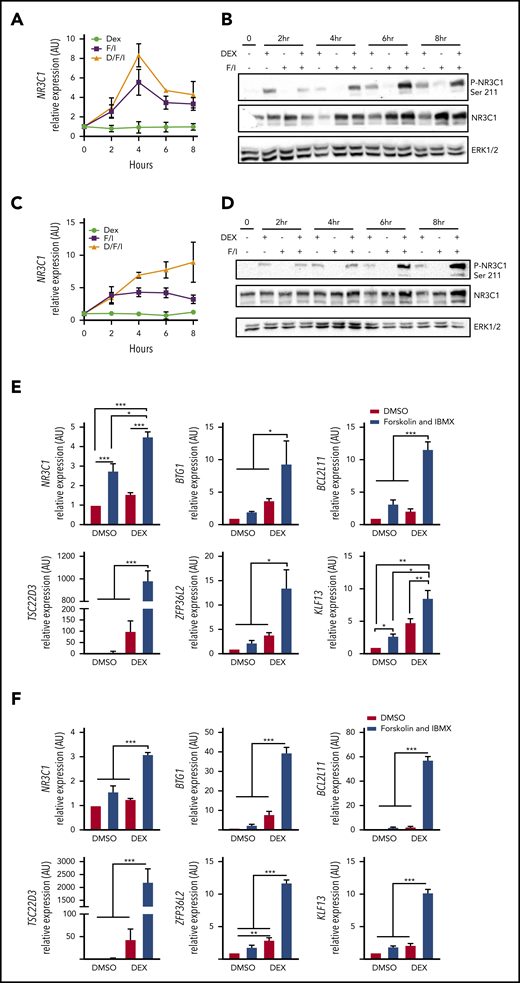
cAMP signaling increases GR expression and activity and potentiates dexamethasone-induced gene expression. (A-D) Analysis of NR3C1 mRNA and total and Ser-211 phosphorylated NR3C1 protein levels in (A-B) CUTLL1 or (C-D) KOPTK1 cells treated with vehicle, dexamethasone (1 μM), forskolin (10 µM), and IBMX (100 μM) designated F/I or dexamethasone + F/I for 2, 4, 6, and 8 hours. (E-F) qPCR analysis of NR3C1 target genes in CUTLL1 (E) and KOPTK1 (F) cells treated as indicated for 24 hours. All qPCR values were normalized to vehicle-treated cells. The results are averages of 3 independent experiments, and error bars represent SEM. *P < .05, **P < .01, ***P < .001.
cAMP signaling increases GR expression and activity and potentiates dexamethasone-induced gene expression. (A-D) Analysis of NR3C1 mRNA and total and Ser-211 phosphorylated NR3C1 protein levels in (A-B) CUTLL1 or (C-D) KOPTK1 cells treated with vehicle, dexamethasone (1 μM), forskolin (10 µM), and IBMX (100 μM) designated F/I or dexamethasone + F/I for 2, 4, 6, and 8 hours. (E-F) qPCR analysis of NR3C1 target genes in CUTLL1 (E) and KOPTK1 (F) cells treated as indicated for 24 hours. All qPCR values were normalized to vehicle-treated cells. The results are averages of 3 independent experiments, and error bars represent SEM. *P < .05, **P < .01, ***P < .001.
Phosphorylation of the NR3C1 at Ser211 stimulates glucocorticoid receptor nuclear localization and stability and enhances its transcriptional activity.3,4,40-42 Although cAMP pathway activation increased NR3C1 mRNA and protein levels, it did not trigger detectable NR3C1 phosphorylation on Ser211 during the time periods examined (Figure 5B,D). However, when cAMP activating agents (F/I) were given with dexamethasone, significant increases in NR3C1 mRNA and protein levels were sustained over time in the human T-ALL cell lines CUTLL1 and KOPTK1 (Figure 5). Importantly, cAMP activation and dexamethasone enhanced NR3C1 Ser211 phosphorylation compared with leukemic cells treated with dexamethasone or F/I only (Figure 5B,D). Consistent with this finding, the combination treatment (F/I + dexamethasone) significantly enhanced the expression of GR regulated genes compared with treatment with dexamethasone or F/I only (Figure 5E-F). To determine whether cAMP effects on NR3C1 mRNA and protein levels were mediated by PKA or EPAC1/2 (Figure 2A), we treated KOPTK1 cells with the cAMP analog and PKA agonist 8-Br-cAMP or the EPAC1/2 agonist 8CPT-2Me-cAMP. 8-Br-cAMP but not 8CPT-2Me-cAMP increased dexamethasone-induced leukemic cell death (supplemental Figure 3A-B) and potentiated the expression of canonical GC-regulated genes in all 3 human T-ALL cell lines examined (supplemental Figure 3C-E). Collectively, these data suggest that cAMP-PKA signaling not only stimulates NR3C1 transcription but, in the presence of dexamethasone, enhances NR3C1 Ser211 phosphorylation and transcriptional activity.
PGE2 increases cAMP and sensitizes GC resistant T-ALL samples to dexamethasone-mediated cell death
We analyzed RNA-seq data on T-ALL patients for GPCR that interact with Gα subunits that stimulate cAMP production. We found the prostaglandin E2 family of receptors specifically PTGER4 abundantly expressed on pediatric T-ALL samples, whereas PTGER1-3 are expressed at lower levels (Figure 6A; supplemental Figure 4A-B). We validated these data by examining PTGER1-4 mRNA levels in human thymus and pediatric T-ALL samples (Figure 6B). PGE2 binds E-type prostanoid EP1-4 receptors and depending on the Gα proteins (stimulatory [GαS] or inhibitory [Gαi]) coupled to these receptors can modulate the cAMP, Ca2+, and inositol phosphate levels.43 A long acting derivative of PGE2, dmPGE2, binds EP4 and is in its fourth clinical trial to improve hematopoietic stem cell engraftment and reduce graft-versus-host disease.44 Consistent with its ability to stimulate the cAMP pathway, dmPGE2 induces a cAMP response element binding protein (CREB) transcriptional signature in human CD34+ cells.45 We demonstrate that treatment of primary T-ALL samples with PGE2 increases intracellular cAMP and NR3C1 protein levels (Figure 6C-D).
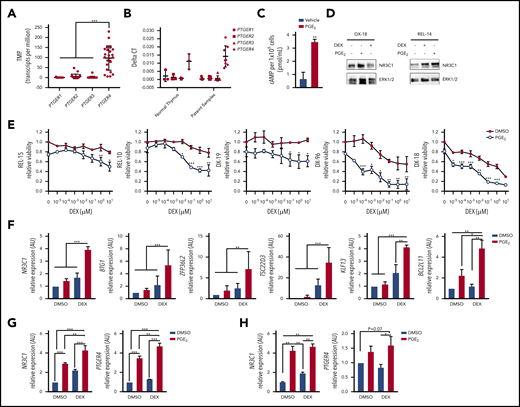
Prostaglandin E2 stimulates PTGER4 expression, increases intracellular cAMP, and sensitizes primary T-ALL patient samples to dexamethasone. (A) RNA seq data from PDX samples showing PTGER (1-4) expression (N = 23 patient samples). (B) qPCR analysis of PTGER (1-4) mRNA levels in normal thymus (N = 3) or in primary T-ALL samples expanded in PDX (N = 7-8). (C) Intracellular cAMP levels determined by ELISA in 1 × 10⁶ primary T-ALL cells (DX-18) treated with vehicle or PGE2 (20 μM) for 30 minutes. (D) NR3C1 protein levels in patient samples (DX-18, REL-14) treated with vehicle, dexamethasone (1 µM), or PGE2 (20 μM) for 24 hours. (E) Relative viability by cell titer glo of T-ALL patient samples treated with increasing concentrations of dexamethasone (0-10 μM) in the absence or presence of PGE2 (20 μM) for 72 hours. (F) qPCR analysis of NR3C1 target genes in T-ALL patient sample (DX-96) treated with vehicle, dexamethasone (1 μM), PGE2 (20 μM), or the combination. (G-H) qPCR analysis of NR3C1 and PTGER4 in primary T-ALL patient samples after treatment with vehicle, dexamethasone (1 μM), PGE2 (20 μM), or the combination (dexamethasone + PGE2) for 6 hours: (G) DX-96 and (H) REL-18. All qPCR values were normalized to vehicle-treated cells. The results are averages of at least 3 independent experiments, and error bars represent SEM. *P < .05, **P < .01, ***P < .001.
Prostaglandin E2 stimulates PTGER4 expression, increases intracellular cAMP, and sensitizes primary T-ALL patient samples to dexamethasone. (A) RNA seq data from PDX samples showing PTGER (1-4) expression (N = 23 patient samples). (B) qPCR analysis of PTGER (1-4) mRNA levels in normal thymus (N = 3) or in primary T-ALL samples expanded in PDX (N = 7-8). (C) Intracellular cAMP levels determined by ELISA in 1 × 10⁶ primary T-ALL cells (DX-18) treated with vehicle or PGE2 (20 μM) for 30 minutes. (D) NR3C1 protein levels in patient samples (DX-18, REL-14) treated with vehicle, dexamethasone (1 µM), or PGE2 (20 μM) for 24 hours. (E) Relative viability by cell titer glo of T-ALL patient samples treated with increasing concentrations of dexamethasone (0-10 μM) in the absence or presence of PGE2 (20 μM) for 72 hours. (F) qPCR analysis of NR3C1 target genes in T-ALL patient sample (DX-96) treated with vehicle, dexamethasone (1 μM), PGE2 (20 μM), or the combination. (G-H) qPCR analysis of NR3C1 and PTGER4 in primary T-ALL patient samples after treatment with vehicle, dexamethasone (1 μM), PGE2 (20 μM), or the combination (dexamethasone + PGE2) for 6 hours: (G) DX-96 and (H) REL-18. All qPCR values were normalized to vehicle-treated cells. The results are averages of at least 3 independent experiments, and error bars represent SEM. *P < .05, **P < .01, ***P < .001.
To determine whether PGE2 potentiates GC responses, we treated relapsed (REL-15, REL-10) and diagnostic (DX-19, DX-96, DX-18) samples with increasing concentrations of dexamethasone with and without PGE2 and measured effects on cell viability. PGE2 cooperated with dexamethasone to significantly reduce the viability of T-ALL patient samples including those from relapsed patients (Figure 6E). Notably PGE2 treatment resulted in 31% to 76% decrease in cell viability compared with 1 μM dexamethasone alone, consistent with dexamethasone-sensitizing effects observed with other cAMP-PKA activating agents (Figure 4F; supplemental Figure 3A). PGE2 (like F/I and the PKA agonist 8-Br-cAMP) cooperated with dexamethasone to significantly increase NR3C1 expression and GR target gene expression (Figure 6F-H; supplemental Figures 3 and 4C). PGE2 administration has been shown to increase PTGER2 and PTGER4 mRNA expression in T cells, whereas having no effect on the expression of cAMP inhibitory receptors PTGER1 and PTGER3.46 Consistent with these data, PGE2 treatment induced PTGER4 expression in the pediatric T-ALL samples examined (Figure 6G, H) revealing an auto-regulatory feedback loop that may potentiate cAMP and GR signaling in leukemic cells.
PGE2 enhances the anti-leukemic activity of dexamethasone in vivo
Our in vitro data using T-ALL patient samples suggest that stabilized PGE2 may sensitize human leukemic cells to dexamethasone treatment in vivo. To test this, we engrafted NSG mice with pediatric T-ALL cells obtained at diagnosis, and when human leukemic blasts reached 5% of mouse peripheral blood (Figure 7B), mice were randomized to 1 of 4 groups and treated with vehicle, dexamethasone, dmPGE2, or the combination therapy (dexamethasone and dmPGE2; Figure 7A) for 2 weeks and then monitored for 4 additional weeks. To assess target engagement, treatments were readministered, and 3 hours later, NR3C1 mRNA levels were quantified in the spleens of mice from each treatment group. We detected significant increases in NR3C1 mRNA levels in the spleens of mice treated with dexamethasone or dexamethasone and dmPGE2 compared with vehicle or dmPGE2-only treated mice (Figure 7C). However, NR3C1 mRNA levels were not significantly increased in the spleens of mice treated with the combination therapy compared with those treated with dexamethasone only (Figure 7C). This could indicate that, in vivo, a single acute dose of dmPGE2 is not sufficient or that longer treatment periods (>3 hours) are required to detect significant increases in NR3C1 mRNA levels over that observed in dexamethasone-treated leukemic cells. Dexamethasone reduced splenomegaly in the leukemic mice; however, only the combination therapy resulted in statistically significant reductions in spleen weight (Figure 7D-E). Dexamethasone and dmPGE2 also significantly reduced the leukemic burden in the bone marrow compared with vehicle-treated mice (Figure 7F). Importantly, the combination therapy was more effective than single treatments at reducing the number of human leukemic cells in the bone marrow (Figure 7F).
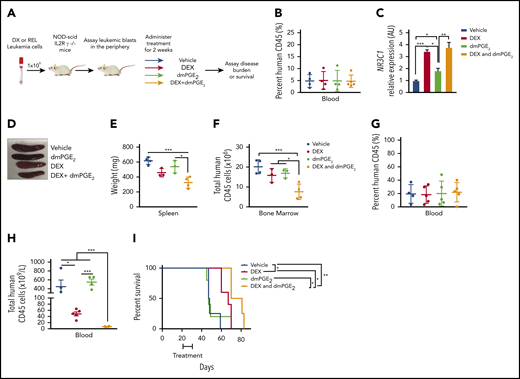
dmPGE2 enhances the anti-leukemia activity of dexamethasone in vivo. (A) Schematic of PDX experiment. (B) Percentage of human CD45+ cells in the blood of mice engrafted with a diagnostic T-ALL patient sample (DX-96) at the time of treatment. (C) qPCR analysis of NR3C1 mRNA levels in splenocytes isolated from mice treated with vehicle (N = 4), dmPGE2 (200 μg/kg; N = 3), dexamethasone (15 mg/kg; N = 3), or the combination (dmPGE2 + dexamethasone; N = 4) 3 hours after single treatment. (D) Representative images of spleens isolated 4 weeks after final treatment(s). (E) Weights of spleens isolated from mice treated with vehicle, dmPGE2, dexamethasone, or the combination. (F) Total number of human CD45+ cells in bone marrow of mice 4 weeks after treatment. (G) Treatment effects on the survival of mice engrafted with a relapsed pediatric T-ALL sample (REL-14). Percentage of relapsed leukemic (human CD45+) cells in the blood of mice at the initiation of treatment. (H) Total number of human CD45+ leukemic cells in the blood of mice after 4 weeks of treatment. (I) Kaplan-Meier survival curves of mice transplanted with relapsed pediatric T-ALL cells (REL-14) treated with vehicle (N = 4), dexamethasone (5 mg/kg; N = 5), dmPGE2 (200 μg/kg; N = 5), or the combination (N = 4) for 2 weeks (5 days on; 2 days off). The difference in overall survival between the treatment groups is shown. All data are represented as SEM. *P < .05, **P < .01, ***P < .001.
dmPGE2 enhances the anti-leukemia activity of dexamethasone in vivo. (A) Schematic of PDX experiment. (B) Percentage of human CD45+ cells in the blood of mice engrafted with a diagnostic T-ALL patient sample (DX-96) at the time of treatment. (C) qPCR analysis of NR3C1 mRNA levels in splenocytes isolated from mice treated with vehicle (N = 4), dmPGE2 (200 μg/kg; N = 3), dexamethasone (15 mg/kg; N = 3), or the combination (dmPGE2 + dexamethasone; N = 4) 3 hours after single treatment. (D) Representative images of spleens isolated 4 weeks after final treatment(s). (E) Weights of spleens isolated from mice treated with vehicle, dmPGE2, dexamethasone, or the combination. (F) Total number of human CD45+ cells in bone marrow of mice 4 weeks after treatment. (G) Treatment effects on the survival of mice engrafted with a relapsed pediatric T-ALL sample (REL-14). Percentage of relapsed leukemic (human CD45+) cells in the blood of mice at the initiation of treatment. (H) Total number of human CD45+ leukemic cells in the blood of mice after 4 weeks of treatment. (I) Kaplan-Meier survival curves of mice transplanted with relapsed pediatric T-ALL cells (REL-14) treated with vehicle (N = 4), dexamethasone (5 mg/kg; N = 5), dmPGE2 (200 μg/kg; N = 5), or the combination (N = 4) for 2 weeks (5 days on; 2 days off). The difference in overall survival between the treatment groups is shown. All data are represented as SEM. *P < .05, **P < .01, ***P < .001.
We then examined the effects of each treatment on the survival of mice engrafted with a relapsed pediatric T-ALL sample that exhibited GC resistance in vitro (Figure 4F). Using an experimental design to reflect greater disease burden, mice were engrafted with a relapsed pediatric T-ALL sample (REL-14), and when human leukemic blasts reached 20% (Figure 7G), mice were randomized to 1 of 4 treatment groups and treated for 2 weeks. Treatment with dexamethasone and dmPGE2 significantly reduced the number of relapsed T-ALL cells in blood compared with treatment with vehicle or either monotherapy (Figure 7H). Mice treated with vehicle or dmPGE2 succumbed rapidly to disease with an average latency of 47 days, whereas mice treated with dexamethasone or dexamethasone and dmPGE2 survived significantly longer, with average latencies of 67 vs 75.5 days, respectively (Figure 7I; P = .0363). These data suggest that dmPGE2 enhances the anti-leukemic activity of dexamethasone in vivo and suggest that dmPGE2 or other selective EP4 agonists cooperate with dexamethasone to limit the expansion of diagnostic and relapsed pediatric T-ALL cells in vivo.
Discussion
We performed a survival-based shRNA screen in mouse T-ALL cells to identify GC resistance genes/pathways implicated in relapse and/or GC resistance in human ALL. The top pathway identified in the screen was the cAMP pathway. We demonstrate that multiple shRNAs to cAMP signaling components at every level (GPCRs, Gαs, ACs, CREB) alter the dexamethasone response in mouse T-ALL cells (Figure 2B). We show that a GNAS deficiency in mouse and human T-ALL cells reduces intracellular cAMP and NR3C1 expression levels and significantly alters the dexamethasone dose response (Figures 2 and 3). Consistent with these data, we find genes involved in cAMP signaling underexpressed in GC-resistant and -relapsed ALL patients (Figure 1; supplemental Figure 1).32,33
We show that cAMP-PKA signaling increases NR3C1 mRNA and protein levels in mouse and human T-ALL cells (Figures 3 and 5; supplemental Figure 3), consistent with correlative studies in a mouse lymphoma cell line and human CEM subclones.3,38,47 cAMP-PKA signaling increases GR protein levels but does not trigger GR Ser211 phosphorylation (Figure 5; supplemental Figure 3), indicating that in contrast to previous studies,48,49 PKA does not directly phosphorylate the GR in human T-ALL cells. cAMP activation does not significantly stimulate the expression of the GC-regulated genes examined (Figure 5E-F); however, when combined with dexamethasone, increases in phosphorylated Ser211 GR levels correlate with significant increases in the expression of GR target genes (Figure 5B,D-F). These data raise the possibility that CREBBP (c-AMP response element-binding protein CREB binding protein) mutations enriched in relapsed ALL and associated with GC resistance28 may reflect, in part, reduced GR expression/activity caused by impaired cAMP signaling. Consistent with this idea, CREBBP mutations have been shown by others to result in reduced expression of glucocorticoid receptor–and cAMP-responsive CREB target genes.28
Although several studies have identified GC resistance pathways, few have demonstrated that GC sensitization is achievable in vivo. We provide evidence that PGE2 increases intracellular cAMP and significantly shifts the dexamethasone dose response and enhances GC-induced gene expression in T-ALL patient samples (Figure 6C-F; supplemental Figure 4C), suggesting that, like cAMP-activating agents, PGE2 potentiates GR transcriptional activity. An independent shRNA screen to identify GC resistance genes was recently performed in the human B-ALL cell line NALM-6. This study identified PTGES3 as the second most important gene for GC-induced cell death behind the GR. In addition to serving as a GR chaperone protein, PTGES3 converts prostaglandin endoperoxide H2 to PGE2.50 These data are consistent with our findings and suggest that impaired PGE2-cAMP signaling contributes to GC resistance and relapse in pediatric ALL. Moreover, dmPGE2 and the EP4 agonist (ONO-4819CD) are well tolerated in patients,51,52 indicating that either agent could be used as a GC sensitizer. Although we demonstrate that PGE2 generates cAMP and sensitizes human leukemic cells to dexamethasone in vitro and in vivo, other cAMP-elevating receptors and/or phosphodiesterase inhibitors could also be used to increase cAMP levels and enhance the anti-leukemic activity of GCs.
PDX RNA-sequencing data are publicly available through the NCBI Sequence Read Archive (BioProject ID PRJNA314605). Gene expression data available at GEO accession: GSE66702, GSE66705, GSE28460, GSE42328, GSE26713.
The online version of this article contains a data supplement.
The publication costs of this article were defrayed in part by page charge payment. Therefore, and solely to indicate this fact, this article is hereby marked “advertisement” in accordance with 18 USC section 1734.
Acknowledgments
The authors thank members of the M.A.K. laboratory for helpful discussion; Adolfo Ferrando for kindly providing CUTLL1 cells; and William Evans for providing primary T-ALL patient samples.
The University of Massachusetts Medical School (UMMS) Flow Cytometry, Deep Sequencing Core and Ai Cores provided support of this work. This work was supported by National Institutes of Health/National Cancer Institute (NIH/NCI) grant CA06899, an Alex’s Lemonade Stand Innovator Award, and Hyundai Hope on Wheels Award (M.A.K.). J.E.R. was the recipient of American Cancer Society (ACS) Postdoctoral Fellowship award 125087-PF-13-247-01-LIB. K.M.G. and K.W.O. were supported by NIH/NCI Cancer Biology grant T32 CA130807. K.W.O. was also supported, in part, by NIH/National Institute of General Medical Sciences Medical Scientist Training Program (MSTP) grant T32 GM107000.
Authorship
Contribution: J.E.R., M.R.G., and M.A.K. conceived and designed the project. J.E.R. and M.A.K. developed the methodology; J.E.R., K.M.G., L.C.M., K.W.O., K.T., B.Z., M.A.B., D.L.G., M.R.G., and M.A.K. acquired data (provided animals, acquired and managed patients, provided facilities, etc); J.E.R., K.M.G., K.W.O., J.Y., L.J.Z., and M.A.K. analyzed and interpreted the data (eg, statistical analysis, biostatistics, computational analysis); J.E.R., K.M.G., K.W.O., and M.A.K. wrote, reviewed, and revised the manuscript; J.E.R., K.M.G., L.C.M., K.W.O., K.T., B.Z., M.A.B., D.L.G., M.R.G., and M.A.K. provided administrative, technical, or material support (ie, reporting or organizing data, constructing databases); and M.A.K. provided study supervision.
Conflict-of-interest disclosure: M.A.K. received previous research support from Merck, Glaxo-Smith Kline, and Sanofi, Inc. M.A.B. and D.L.G. are consultants for The Jackson Laboratory. The remaining authors declare no competing financial interests.
Correspondence: Michelle A. Kelliher, Department of Molecular, Cell and Cancer Biology, University of Massachusetts Medical School, 364 Plantation St, Worcester, MA 01605; e-mail: michelle.kelliher@umassmed.edu.

This feature is available to Subscribers Only
Sign In or Create an Account Close Modal