

Key Points
T-PLL cells predominantly depend functionally on BCL-2 for survival; this dependence can be enhanced by JAK/STAT pathway inhibition.
Combination of ruxolitinib and venetoclax was highly active preclinically and had promising clinical effects in 2 patients with T-PLL.

Abstract
Conventional therapies for patients with T-cell prolymphocytic leukemia (T-PLL), such as cytotoxic chemotherapy and alemtuzumab, have limited efficacy and considerable toxicity. Several novel agent classes have demonstrated preclinical activity in T-PLL, including inhibitors of the JAK/STAT and T-cell receptor pathways, as well as histone deacetylase (HDAC) inhibitors. Recently, the BCL-2 inhibitor venetoclax also showed some clinical activity in T-PLL. We sought to characterize functional apoptotic dependencies in T-PLL to identify a novel combination therapy in this disease. Twenty-four samples from patients with primary T-PLL were studied by using BH3 profiling, a functional assay to assess the propensity of a cell to undergo apoptosis (priming) and the relative dependence of a cell on different antiapoptotic proteins. Primary T-PLL cells had a relatively low level of priming for apoptosis and predominantly depended on BCL-2 and MCL-1 proteins for survival. Selective pharmacologic inhibition of BCL-2 or MCL-1 induced cell death in primary T-PLL cells. Targeting the JAK/STAT pathway with the JAK1/2 inhibitor ruxolitinib or HDAC with belinostat both independently increased dependence on BCL-2 but not MCL-1, thereby sensitizing T-PLL cells to venetoclax. Based on these results, we treated 2 patients with refractory T-PLL with a combination of venetoclax and ruxolitinib. We observed a deep response in JAK3-mutated T-PLL and a stabilization of the nonmutated disease. Our functional, precision-medicine–based approach identified inhibitors of HDAC and the JAK/STAT pathway as promising combination partners for venetoclax, warranting a clinical exploration of such combinations in T-PLL.
Introduction
T-cell prolymphocytic leukemia (T-PLL) is a rare and usually aggressive T-lymphoid malignancy with a cytogenetic hallmark of inv(14)(q11q32) or t(14;14)(q11;q32), involving the T-cell receptor (TCR) α/δ gene locus at 14q11 and the TCL1A gene cluster at 14q32.1.1 Recently, gain-of-function mutations in JAK/STAT pathway genes, including loss of negative regulators of STAT5B, have been identified in ∼90% of T-PLL cases, suggesting that this pathway is another hallmark of T-PLL pathophysiology.2
Cytotoxic chemotherapy rarely provides durable remission for patients with T-PLL.3 The monoclonal anti-CD52 antibody alemtuzumab is the frontline standard of care, with responses observed in ∼90% of patients.4,5 However, severe leukopenia and infectious complications are common with alemtuzumab, and responses are usually short lived. For patients with T-PLL who achieve response, allogeneic stem cell transplantation is the only reasonable hope for long-term survival.6,7 With these therapeutic options, the median overall survival is only ∼20 months.8
Given the chemoresistance of T-PLL, as well as the safety profile and broad target range of alemtuzumab, recent work focused on more targeted agents. An ex vivo high-throughput drug sensitivity and resistance testing platform on primary T-PLL samples9,10 identified the BCL-2 inhibitor venetoclax and histone deacetylase inhibitors (HDACis) as promising targeted agents. Integrated large-scale genetic profiling assays also identified various recurrent lesions in DNA repair molecules and histone modifiers in T-PLL.11 Early clinical data suggest that HDACi have ex vivo activity in T-PLL and may partially overcome chemoresistance in T-PLL.12 High-throughput drug testing studies also demonstrated in vitro sensitivity of T-PLL cells to JAK inhibitors. In addition, a modest activity was reported with the combination of tofacitinib (a pan-JAK inhibitor) and ruxolitinib (a JAK 1/2 inhibitor).13 Despite the promising data of novel agents for treatment of T-PLL, the early clinical data also suggest that a sustained response to these drugs is unlikely when they are given as monotherapy.10,14 Combining different classes of drugs, such as HDACis, MDM2 inhibitors, chemotherapeutics, and BCL-2 antagonists, is proposed to act synergistically.15,16 We recently identified that the Bruton tyrosine kinase inhibitor ibrutinib may be a promising combination partner for venetoclax in T-PLL.17 An off-target effect of ibrutinib is inhibition of IL-2–inducible kinase (ITK), a T-cell–dominant member of the TEC kinase family that drives proximal T-cell receptor (TCR) signaling.18 Consistent with this, ex vivo assays also demonstrated inhibitory activity of PRN694, a specific ITK inhibitor (ITKi), against T-PLL.19 Taking into account these data, as well as current accessibility of the different drugs, we decided to select 4 drug candidates to target 3 main pathways: (1) belinostat, one of the most effective HDACi described in T-PLL, which is approved for peripheral T-cell lymphoma; (2) ruxolitinib, the most effective JAKi described in T-PLL, which is approved for the treatment of myeloproliferative disorders; and (3) ibrutinib, the first potential ITKi described to be effective in T-PLL, and PRN694, a highly selective ITKi (50% inhibitory concentration [IC50]: 0.3 nM vs 2.2 nM for ibrutinib). To evaluate the combination of BH3 mimetics with these 3 drugs, we used a previously developed functional assay, BH3 profiling, which interrogates mitochondria to assess both their proximity to the threshold of apoptosis (“mitochondrial priming”), and their relative dependence on the antiapoptotic BCL-2 family of proteins, such as BCL-2, MCL-1, and BCL-xL. We have chosen BH3 profiling because this novel functional precision-medicine technique provides orthogonal information that is not provided by genomics and traditional viability assays alone. We also used dynamic BH3 profiling (DBP), which measures early drug-induced changes in net proapoptotic signaling,20 to identify optimal combination partners. We further report on the impact of drugs from the 3 chosen classes on T-PLL mitochondrial priming and drug sensitivity.
Material and methods
Study design and patient samples
The study was undertaken in compliance with the principles of the Declaration of Helsinki, and all patients provided written informed consent. Twenty-four clinically annotated samples from patients with primary T-PLL were obtained from the French Innovative Leukemia Organization network, Medical University of Vienna, and the Dana-Farber Cancer Institute. Figure 1A outlines the methodology we used in this work. Primary cells from peripheral blood were viably frozen in fetal bovine serum supplemented with 10% DMSO until the time of thawing. To enrich our analysis for T-PLL cells, we used flow cytometry to gate CD5+ CD19− T cells, which generally accounted for >90% of the total cells. Patients had to fulfill the current criteria for a diagnosis of T-PLL.1 Twenty-four primary samples from patients with treatment-naive chronic lymphocytic leukemia (CLL) were used as a comparator for baseline BH3 profiling. Ex vivo drug treatments and immunoblot analysis by western blot were performed as previously described21 and are detailed in the supplemental Methods (available on the Blood Web site). Primary T-PLL and CLL cells were treated with venetoclax, AZD5991, S63845, A-1331852, belinostat, ruxolitinib, PRN694, ibrutinib, or the vehicle (DMSO; as the control).
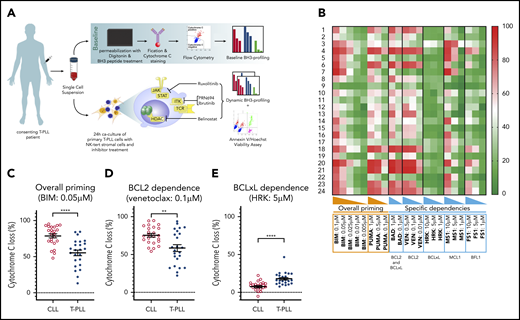
Characterization of T-PLL antiapoptotic dependencies at baseline. (A) We subjected single-cell suspensions of blood samples to baseline BH3 profiling. In parallel, we cocultured primary T-PLL cells with the stromal cell line NKTert and exposed them to ruxolitinib, PRN694, ibrutinib, belinostat, or DMSO. Then, we performed a DBP to measure early drug-induced changes in net proapoptotic signaling and examined whether the findings with DBP could be corroborated with the results of cell viability assays. (B) Heat map of the percentage of cyt c loss, as quantified by flow cytometry on 24 T-PLL patient samples at baseline (green, lowest value; red, highest value). Each row is a sample, with the corresponding number, and each column refers to a BH3-only peptide or a tool compound with which the gently permeabilized cells were incubated for 60 minutes. (C-E) The percentage of cyt c loss for each of the 24 CLL (open circles) and 24 T-PLL (solid circles) samples. Unpaired Student t test; means ± standard error of the mean. The title of each panel denotes the parameter measured (overall priming and specific dependencies), as well as the peptide or tool compound used to probe it. **P < .01; ****P < .0001.
Characterization of T-PLL antiapoptotic dependencies at baseline. (A) We subjected single-cell suspensions of blood samples to baseline BH3 profiling. In parallel, we cocultured primary T-PLL cells with the stromal cell line NKTert and exposed them to ruxolitinib, PRN694, ibrutinib, belinostat, or DMSO. Then, we performed a DBP to measure early drug-induced changes in net proapoptotic signaling and examined whether the findings with DBP could be corroborated with the results of cell viability assays. (B) Heat map of the percentage of cyt c loss, as quantified by flow cytometry on 24 T-PLL patient samples at baseline (green, lowest value; red, highest value). Each row is a sample, with the corresponding number, and each column refers to a BH3-only peptide or a tool compound with which the gently permeabilized cells were incubated for 60 minutes. (C-E) The percentage of cyt c loss for each of the 24 CLL (open circles) and 24 T-PLL (solid circles) samples. Unpaired Student t test; means ± standard error of the mean. The title of each panel denotes the parameter measured (overall priming and specific dependencies), as well as the peptide or tool compound used to probe it. **P < .01; ****P < .0001.
DNA sequencing
DNA was extracted from isolated cells using a QIAmp kit (Sigma-Aldrich, Saint-Quentin Fallavier, France). Mutational landscape was assessed by using Sanger sequencing and/or targeted next generation sequencing (NGS) to examine a panel of candidate genes, as detailed in the supplemental Methods.
Survival assay
For coculture experiments, the stromal NKTert cell line (Riken Cell Bank, Tsukuba, Japan) maintained in R10 (defined in the supplemental Methods) was used. Ninety-six–well plates were seeded with NKTert 24 hours before addition of primary T-PLL cells, as previously described in CLL22 and as detailed in the supplemental Methods. After annexin V/Hoechst staining, the cells were fixed with 4% paraformaldehyde, neutralized with N2 buffer (1.7 M Tris and 1.25 M glycine [pH 9.1]), and analyzed with the BD Fortessa flow cytometer, with the 96-well high-throughput screening plate reader. NKTert cells were excluded by using forward and side scatter, and the analysis was performed on the cells in the CD5+CD19− gate. Individual analyses were performed in triplicate for all drug treatment conditions.
BH3 profiling
BH3 profiling was performed as previously described and as detailed in the supplemental Methods.20 DBP was performed using the same protocol, with the addition of treating primary cells ex vivo with ruxolitinib, belinostat, PRN694, ibrutinib, or the vehicle (DMSO) for 24 hours before analysis. Individual analyses were performed in duplicate for all drug treatment conditions.
Statistical analysis
We used GraphPad Prism 8 to compare 2 paired groups (same samples but different conditions) by paired Student t test, whereas unpaired groups were compared by using an unpaired Student t test. Multiple groups were compared using an analysis of variance for repeated measures. In all figures, paired samples are linked by a line. The correlation between 2 variables was analyzed with a simple linear regression. Two-tailed nominal P ≤ .05 was considered significant.
Results
T-PLL cells are relatively unprimed for apoptosis and have heterogeneous dependence on BCL-2 and MCL-1
BH3 profiling has previously helped to characterize the BCL-2 family interactions of a variety of hematologic malignancies (for example, in CLL), where relatively uniform BCL-2 dependence provided a strong rationale for exploring BCL-2 inhibition with venetoclax.23,24 To help identify potential pharmacologic vulnerabilities in T-PLL, we performed the first study of BH3 profiling in T-PLL on primary samples collected from 24 patients. The patients’ characteristics are described in Table 1 (detailed cytogenetic and molecular data in supplemental Table 1). This baseline BH3 profiling was performed immediately after the tumor cells were thawed. A Trypan blue viability control was systematically performed, and all samples with a viability >50% were excluded (supplemental Table 2). Significant heterogeneity was observed in the level of overall priming for apoptosis, as well as in dependencies on individual antiapoptotic proteins (Figure 1B). Some samples showed T-PLL that was mainly dependent on MCL-1 (eg, T-PLL samples 3, 7, and 22), others were primarily dependent on BCL-2 (eg, T-PLL samples 13, 15, and 21), and some were dependent on both MCL-1 and BCL-2 (eg, T-PLL samples 4 and 20). No significant differences were observed between samples from treatment-naive and relapsed cases, or between samples from JAK/STAT mutated and nonmutated cases (data not shown).
Mutational status of ATM and JAK/STAT associated with patient demographic and clinical diagnostic and prognostic information
| Patient | Sex | Age at diagnosis, y | PB lymph count at sample date, ×109/L | Phenotype | 14q11 abn or TCL1+ | Iso(8)(q10) | ATM chr abn | ATM mutation | JAK-STAT mutated | Treatment-naive sample |
|---|---|---|---|---|---|---|---|---|---|---|
| 1 | M | 80 | 11 | CD4+CD8- | t(14;14) | N | Deletion | WT | JAK3 | Yes |
| 2 | M | 77 | 91 | CD4+CD8+ | inv(14) | Yes | — | K2413R* | STAT5B | Yes |
| 3 | M | 86 | 54 | CD4+CD8- | TCL1+ | N | Deletion | K2700_D2703delinsN | STAT5B/JAK3 | Yes |
| 4 | M | 70 | 37 | CD4+CD8- | NA | NA | NA | R3008C | STAT5B | Yes |
| 5 | F | 70 | 54 | CD4+CD8- | TCL1+ | No | Deletion | G2765S* | STAT5B/JAK3 | Yes |
| 6 | M | 73 | 56 | CD4+CD8- | inv(14) | No | Deletion | WT | JAK3 | No |
| 7 | F | 71 | 25 | CD4+CD8- | TCL1+ | No | — | WT | WT | Yes |
| 8 | F | 65 | 82 | CD4+CD8- | NA | NA | NA | WT | JAK3 | Yes |
| 9 | M | 64 | 14 | CD4+CD8+ | inv(14) | Yes | Deletion | R2032G | JAK3 | Yes |
| 10 | M | 53 | 179 | CD4+CD8- | TCL1+ | Yes | Deletion | L2633Ter | JAK3 | Yes |
| 11 | M | 68 | 300 | CD4+CD8+ | t(X;14) | No | — | WT | STAT5B/JAK3 | Yes |
| 12 | M | 69 | 17 | CD4+CD8- | TCL1+ | No | — | A3006V* | JAK3 | Yes |
| 13 | F | 66 | 5 | CD4-CD8+ | inv(14) | No | Deletion | WT | WT | Yes |
| 14 | M | 65 | 16 | CD4+CD8+ | TCL1+ | Yes | Deletion | L1328W* | WT | Yes |
| 15 | F | 79 | 13 | CD4+CD8- | inv(14) | No | Deletion | F2732_N2736del | JAK1 | Yes |
| 16 | F | 97 | 534 | CD4+CD8+ | NA | NA | NA | D148R | STAT5B/JAK3 | Yes |
| 17 | F | 67 | 14 | CD4+CD8- | NA | NA | NA | T1029N | JAK3 | Yes |
| 18 | F | 59 | 130 | CD4+CD8- | inv(14) | No | — | WT | JAK3 | Yes |
| 19 | M | 64 | 8 | CD4+CD8- | TCL1+ | No | — | WT | WT | Yes |
| 20 | M | 74 | 348 | CD4+CD8- | inv(14) | No | — | K1033T | WT | No |
| 21 | M | 22 | 18 | CD4+CD8- | inv(14) | Yes | — | T910Y | STAT5B | Yes |
| 22 | M | 86 | 205 | CD4+CD8+ | TCL1+ | Yes | Deletion | NA | STAT5B | Yes |
| 23 | F | 63 | 12 | CD4+CD8- | inv(14) | Yes | — | V2727G | JAK3 | No |
| 24 | F | 60 | 499 | CD4+CD8+ | t(14;14) | No | — | NA | JAK3 | Yes |
Deletions or point mutations in the 11q23 locus or ATM gene, respectively, are indicated. The karyotypic or immunohistochemical evidence of rearrangements involving the TCL1A/B or MTCP1 loci is indicated. The presence of 1 or more mutations of genes in the JAK/STAT pathway is indicated.
—, no chromosome abnormality detected; abn, abnormality; chr, chromosome; F, female; M, male; PB, peripheral blood; NA, not available.
An ATM variant of undetermined significance or a rare single-nucleotide polymorphism.
Because the relative interactions of BH3 mimetics with the BCL-2 family are well characterized in CLL,24,25 (most notably, venetoclax26 ) we compared results from the T-PLL samples with those of an independent cohort of CLL samples, processed in the same conditions. Compared with primary CLL cells, T-PLL cells were less primed for apoptosis. The mean cytochrome c (cyt c) release with BIM BH3 peptide (which enables measurement of overall apoptotic priming) was 55.2% for T-PLL vs 78.7% for CLL (Figure 1C). Compared with CLL cells, T-PLL cells were less dependent on BCL-2 (Figure 1D; average cyt c release with venetoclax 58.6% vs 75.4%; P = .0019), and more dependent on BCL-xL (Figure 1E; average cyt c release with HRK 17.9% vs 7.5%). Dependence on MCL-1 or BFL-1 did not differ significantly between T-PLL and CLL (average cyt c release with; MS1 36.3% vs 37.5%, not significant [NS]; FS1 28.4% vs 28.1%, NS). These data indicate that T-PLL cells are generally less primed for apoptosis than CLL cells and depend on both BCL-2 and MCL-1.
Pharmacological inhibition of BCL-2 and MCL-1 induces cell death
We next evaluated whether there is an association between antiapoptotic dependencies in T-PLL cells and the efficacy of BH3 mimetic drugs selectively targeting BCL-2 and MCL-1. In the 13 primary T-PLL samples with sufficient cell count, 24-hour treatment with venetoclax or the MCL-1 inhibitors AZD5991 or S63845 was performed. Each inhibitor induced high levels of apoptotic cell death when used individually (Figure 2A). Consistent with our BH3 profiling data, increased BCL-2 dependence was associated with increased apoptotic cell death induced by venetoclax (Figure 2B; R2 = −0.58; P = .0025). Similarly, increased MCL-1 dependence was associated with increased apoptotic cell death induced by the MCL-1 inhibitor AZD5991 (Figure 2C; R2 = −0.68; P = .0005) or S63845 (Figure 2D; R2 = −0.68; P = .002).
![Association between BH3 profiling and BH3 mimetic activity. (A) Induction of apoptosis shown as a percentage of viable (annexin V negative/Hoechst positive vs control) cells after 24-hour exposure to an increasing concentration of DMSO alone or a BH3 mimetic (1 nM, 10 nM, 100 nM, and 1 μM): venetoclax, AZD5991, or S63845 (n = 13; mean ± standard error of the mean [SEM]). (B-D) Association between cyt c release induced by venetoclax at 0.1 μM (B) and MS1 peptide at 5 μM (C-D) with induction of apoptosis shown as a percentage of viable (annexin V negative/Hoechst positive) cells vs DMSO, after 24-hour exposure to venetoclax 10 nM (B), AZD5991 100 nM (C), or S63845 100 nM (D). Results show individual values for 13 different T-PLL samples and simple linear regression. (E) Induction of apoptosis shown as the percentage of viable (annexin V negative/Hoechst positive vs control) cells after 24-hour exposure to DMSO, AZD5991 100 nM, S63845 100 nM, or A-1331852 1 μM and 4-hour exposure to DMSO alone or an increasing concentration of venetoclax (1 nM, 10 nM, 100 nM, 1 μM, and 10 μM; n = 5; means ± SEM). (F) Same data set as in panel E, focused on venetoclax at 100 nM and showing individual values (n = 5; paired Student t test). *P < .05; P < .01; ***P < .001.](https://ash.silverchair-cdn.com/ash/content_public/journal/blood/137/25/10.1182_blood.2020007303/1/m_bloodbld2020007303f2.png?Expires=1767707816&Signature=TM11iXxMnHV9x5-i8Supanfd6ByVy4-Wr8QsZ779mcBQN0NBnw7RBOyK1ArsRtL-3ja0fKEL~RP30caITiTWzLqyYLkMtVZRXmtRCxp4mMmkfZdHpNEoCtW6beieKxhGtYW39F5ccIJFlG8lRqFxsw4EsAHf0ipunTk8Pd4Z6uq99s7mlLkKks7Jjj6C1QuMnf4RS4iBT58PlSu-iakvKDYY0t88EU-4b66sCnzxck2JZp7nGJphIAculzk9nONvU1WKiQqFrtS6Zz0-ns6Ln8lPH1QFVC0FFVvO3GqoXsQGw9AgCqrsSOslXTgfpd2~FhcdhAcT2r8WQUMvbg~nGw__&Key-Pair-Id=APKAIE5G5CRDK6RD3PGA)
Association between BH3 profiling and BH3 mimetic activity. (A) Induction of apoptosis shown as a percentage of viable (annexin V negative/Hoechst positive vs control) cells after 24-hour exposure to an increasing concentration of DMSO alone or a BH3 mimetic (1 nM, 10 nM, 100 nM, and 1 μM): venetoclax, AZD5991, or S63845 (n = 13; mean ± standard error of the mean [SEM]). (B-D) Association between cyt c release induced by venetoclax at 0.1 μM (B) and MS1 peptide at 5 μM (C-D) with induction of apoptosis shown as a percentage of viable (annexin V negative/Hoechst positive) cells vs DMSO, after 24-hour exposure to venetoclax 10 nM (B), AZD5991 100 nM (C), or S63845 100 nM (D). Results show individual values for 13 different T-PLL samples and simple linear regression. (E) Induction of apoptosis shown as the percentage of viable (annexin V negative/Hoechst positive vs control) cells after 24-hour exposure to DMSO, AZD5991 100 nM, S63845 100 nM, or A-1331852 1 μM and 4-hour exposure to DMSO alone or an increasing concentration of venetoclax (1 nM, 10 nM, 100 nM, 1 μM, and 10 μM; n = 5; means ± SEM). (F) Same data set as in panel E, focused on venetoclax at 100 nM and showing individual values (n = 5; paired Student t test). *P < .05; P < .01; ***P < .001.
Association between BH3 profiling and BH3 mimetic activity. (A) Induction of apoptosis shown as a percentage of viable (annexin V negative/Hoechst positive vs control) cells after 24-hour exposure to an increasing concentration of DMSO alone or a BH3 mimetic (1 nM, 10 nM, 100 nM, and 1 μM): venetoclax, AZD5991, or S63845 (n = 13; mean ± standard error of the mean [SEM]). (B-D) Association between cyt c release induced by venetoclax at 0.1 μM (B) and MS1 peptide at 5 μM (C-D) with induction of apoptosis shown as a percentage of viable (annexin V negative/Hoechst positive) cells vs DMSO, after 24-hour exposure to venetoclax 10 nM (B), AZD5991 100 nM (C), or S63845 100 nM (D). Results show individual values for 13 different T-PLL samples and simple linear regression. (E) Induction of apoptosis shown as the percentage of viable (annexin V negative/Hoechst positive vs control) cells after 24-hour exposure to DMSO, AZD5991 100 nM, S63845 100 nM, or A-1331852 1 μM and 4-hour exposure to DMSO alone or an increasing concentration of venetoclax (1 nM, 10 nM, 100 nM, 1 μM, and 10 μM; n = 5; means ± SEM). (F) Same data set as in panel E, focused on venetoclax at 100 nM and showing individual values (n = 5; paired Student t test). *P < .05; P < .01; ***P < .001.
Given the predominant dependence on BCL-2 and MCL-1, we hypothesized that combining BH3 mimetic drugs targeting these 2 proteins could enhance cell death in T-PLL cells. Therefore, we treated cells for 24 hours with either DMSO (vehicle), AZD5991 100 nM, S63845 100 nM, or the BCL-xL selective inhibitor A-1331852 1 μM (as a control), and 4 hours before fixation, venetoclax was added at a range of doses from 1 nM to 10 μM. The addition of either AZD5991 or S63845 in combination with venetoclax led to markedly increased T-PLL cell death, whereas T-PLL cells were less sensitive to combination with A-1331852 (Figure 2E). At an intermediate venetoclax dose of 100 nM, combination with AZD5991 100 nM reduced cell viability by a mean of 71.94% (Figure 2F). Likewise, pretreatment with S63845 (100 nM) reduced viability by 67.28%, whereas A-1331852 1 μM only modestly reduced cell viability by 6.91%. The weak effect of A-1331852 drug treatment is consistent with the low mean cyt c release we observed with the HRK peptide at 5 μM (17.9%; 95% CI 14.45-21.39) with BH3 profiling (Figure 1E). Overall, these data indicate a good correlation of results of cell viability assays with baseline BH3 profiling and confirm that BCL2 and MCL1 are molecular vulnerabilities in T-PLL.
Belinostat and ruxolitinib selectively increase BCL-2 dependence
We next studied 4 inhibitors of candidate targets in T-PLL pathogenesis, ruxolitinib (JAK1/2i), ibrutinib (ITKi or other “off target”), PRN694 (ITKi), and belinostat (HDACi), as combination partners for BCL-2 or MCL-1 inhibitors. Even though the IC50 of ibrutinib is higher than that of PRN694 on ITK, we included ibrutinib in our assays because its activity in T-PLL could correlate with off-target effects related to inhibition of other kinases. First, we showed that ruxolitinib, PRN694, and belinostat were modulating their proposed targets in primary T-PLL samples (supplemental Figures 2 and 3). However, unlike prior studies where drugs (such as belinostat or ibrutinib) were used at higher doses of 10 μM,9 at the dose of 1 μM in our coculture model, none was cytotoxic to T-PLL cells as single agents (supplemental Figure 1B). Nevertheless, given the importance of these pathways in T-PLL pathogenesis, we hypothesized that even if they did not induce frank cell death on their own, these drugs could augment mitochondrial priming through modulating antiapoptotic protein dependence.
To evaluate this hypothesis, we performed DBP after ex vivo treatment with each drug, to assess the difference between the percentage of cyt c release with the control (DMSO) and each of the 3 drug candidates (“delta-priming”). Evaluating the overall priming with the PUMA peptide at 0.5 μM (Figure 3A), the mean delta priming was 22.7% with belinostat (P = .0035), 8.48% with ruxolitinib (P = .019), and 2.72% with PRN694 (NS). Alteration of BCL-2 dependence was evaluated in the profile with venetoclax at 0.1 μM (Figure 3B), showing an increase in delta priming of 39.16% on average with belinostat, 14.78% with ruxolitinib (P = .017), and 2.7% with PRN694 (NS). MCL-1 dependence was assessed with MS1 peptide at 0.5 μM (Figure 3C), showing an increase in delta priming by 11.04% with belinostat (P = .04) and 1.74% with ruxolitinib (NS) and a decrease by 0.82% with PRN694 (NS). We observed no significant effect of ibrutinib 1 μM on overall priming or dependence on BCL-2 or MCL-1. Together, these data show that treatment with ruxolitinib or belinostat increases overall mitochondrial priming and BCL-2 dependence in T-PLL cells, but not MCL-1 dependence. No significant alteration of mitochondrial priming occurred with PRN694 or ibrutinib at the concentration of 1 μM.
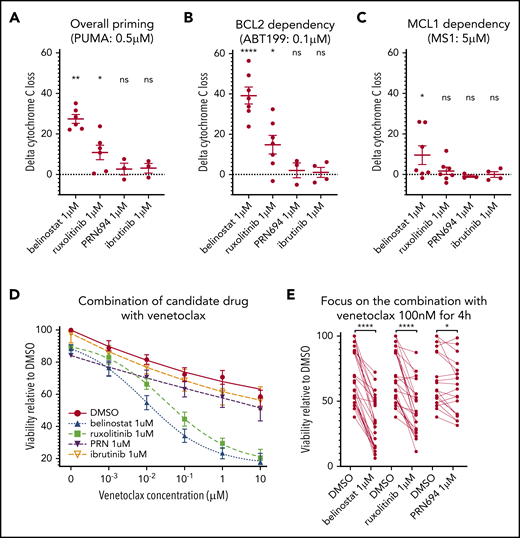
Influence of belinostat, ruxolitinib, PRN694, and ibrutinib on apoptotic priming and viability. (A-C) Impact of 24-hour exposure to 1 μM belinostat, ruxolitinib, PRN694, or ibrutinib on BH3 profiling, shown as delta percentage cyt c loss (delta is percentage loss of T-PLL cells treated with drug minus percentage loss of T-PLL cells in DMSO). Results show individual delta values, as well as means ± standard error of the mean (SEM) for 6 (belinostat), 7 (ruxolitinib), 3 (PRN694), and 4 (ibrutinib) different T-PLL samples (paired Student t test). Overall priming was evaluated with the PUMA peptide at 0.5 μM (A), BCL-2 dependency with venetoclax at 0.1 μM (B), and BCL-2 dependency with MS1 peptide at 0.5 μM (C). (D) Induction of apoptosis shown as percentage of viable (annexin V negative/Hoechst positive, relative to control) cells after a 24-hour exposure to DMSO, ruxolitinib 1 μM, belinostat 1 μM, PRN694 1 μM, or ibrutinib 1 μM and 4-hour exposure to increasing concentrations of DMSO alone and venetoclax (1 nM, 10 nM, 100 nM, 1 μM, and 10 μM; n = 24; mean ± SEM). (E) On the same dataset as in panel D, focused on venetoclax at 100 nM, showing individual values of samples treated with ruxolitinib, belinostat, and PRN694 (n = 24; paired Student t test). *P < .05; **P < .01; ****P < .0001. ns, not significant.
Influence of belinostat, ruxolitinib, PRN694, and ibrutinib on apoptotic priming and viability. (A-C) Impact of 24-hour exposure to 1 μM belinostat, ruxolitinib, PRN694, or ibrutinib on BH3 profiling, shown as delta percentage cyt c loss (delta is percentage loss of T-PLL cells treated with drug minus percentage loss of T-PLL cells in DMSO). Results show individual delta values, as well as means ± standard error of the mean (SEM) for 6 (belinostat), 7 (ruxolitinib), 3 (PRN694), and 4 (ibrutinib) different T-PLL samples (paired Student t test). Overall priming was evaluated with the PUMA peptide at 0.5 μM (A), BCL-2 dependency with venetoclax at 0.1 μM (B), and BCL-2 dependency with MS1 peptide at 0.5 μM (C). (D) Induction of apoptosis shown as percentage of viable (annexin V negative/Hoechst positive, relative to control) cells after a 24-hour exposure to DMSO, ruxolitinib 1 μM, belinostat 1 μM, PRN694 1 μM, or ibrutinib 1 μM and 4-hour exposure to increasing concentrations of DMSO alone and venetoclax (1 nM, 10 nM, 100 nM, 1 μM, and 10 μM; n = 24; mean ± SEM). (E) On the same dataset as in panel D, focused on venetoclax at 100 nM, showing individual values of samples treated with ruxolitinib, belinostat, and PRN694 (n = 24; paired Student t test). *P < .05; **P < .01; ****P < .0001. ns, not significant.
Next, we examined whether these findings with DBP could be corroborated with cell viability assays. Because DBP studies revealed stronger effects on BCL-2 dependence than on MCL-1 dependence, we focused viability testing on venetoclax combinations. Primary samples were treated for 24 hours with DMSO (vehicle), ruxolitinib 1 μM, PRN694 1 μM, or belinostat 1 μM before fixation. Both ruxolitinib and belinostat were highly active in combination with venetoclax (Figure 3D). Similar results were observed with an alternative HDACi (panobinostat; n = 6; data not shown), whereas a minimal effect was observed with PRN694. Pretreatment with ruxolitinib 1 μM in the presence of venetoclax 100 nM reduced viability by a mean of 25.8% (Figure 3E). Pretreatment with belinostat 1 μM reduced viability by 37.06%, whereas pretreatment with PRN694 1 μM reduced viability by 6.67% (P = .01). Consistent with our DBP data, pretreatment with ibrutinib 1 μM in the presence of venetoclax 100 nM did not significantly reduce cell viability (P = .35). Collectively, the results of the viability studies are consistent with the DBP data, thus supporting that ruxolitinib and belinostat increase overall mitochondrial priming and BCL-2 dependence in T-PLL cells.
Primary cells from JAK/STAT pathway–mutated T-PLL are more sensitive to inhibition of JAK1 than of ITK
Although no difference in the ex vivo activity of ruxolitinib, PRN694, ibrutinib, or belinostat was observed according to ATM or TP53 molecular status (data not shown), the activity of ruxolitinib in combination with venetoclax was significantly higher in the samples harboring an activating mutation in the JAK/STAT pathway. The average ratio between viability with ruxolitinib plus venetoclax combination vs venetoclax monotherapy was 0.988 for the 5 patient samples without an activating mutation in the JAK/STAT pathway, and 0.483 for the 19 patient samples with a mutation (Figure 4A). Activity of ruxolitinib in combination with venetoclax was significantly lower in samples with a downstream activating mutation of STAT5B. Pretreatment with ruxolitinib with venetoclax 100 nM for 4 hours reduced viability by a mean of 23.82% in patient samples with a STAT5B mutation vs 42.90% in the samples with an isolated mutation of JAK3 or JAK1 (Figure 4B; P = .03).
![JAK/STAT molecular status influences efficacy of ruxolitinib and PRN694, as well as levels of STAT5b phosphorylation. (A) Induction of apoptosis shown as fold change in viability. Each point is one of the 24 T-PLL samples: 5 without any mutation in the JAK/STAT pathway, and 19 with at least 1 mutation in the pathway. The values presented are the ratio of the viability (percentage vs DMSO), with a combination treatment (ruxolitinib 1 μM for 24 hours and venetoclax 100 nM for 4 hours), vs the viability with monotherapy (venetoclax 100 nM for 4 hours). Unpaired Student t test; means ± standard error of the mean [SEM]). (B) Induction of apoptosis shown as a percentage of viable (annexin V negative/Hoechst positive vs control) cells after a 24-hour exposure to DMSO or ruxolitinib 1 μM and a 4-hour exposure to venetoclax 100 nM, showing individual paired values. The values in the left column of data are those of the 8 samples presenting at least a mutation of STAT5B, the values on the right are those of the 11 samples presenting an isolated mutation of JAK3 or JAK1. The mean reduction of viability (measured viability of DMSO vs ruxolitinib) is significantly larger in the 11 samples without STAT5B mutation (unpaired Student t test). (C) Densitometry analysis of the ratio of expression of phospho-STAT5 to total STAT5, in 9 T-PLL samples (each point is labeled with the T-PLL sample number). The samples were divided into 2 groups: 2 T-PLL samples without mutations in the JAK/STAT pathway genes and 7 T-PLL samples with at least 1 activating mutation in that pathway (unpaired Student t test; means ± SEM). (D) Representative examples of western blot analysis of phospho-STAT5 and total STAT5 in 4 T-PLL samples at baseline. β-Actin was used as the loading control. (E) Induction of apoptosis shown as fold change in viability, in the 24 T-PLL samples. The values presented are the ratio between the viability (percentage vs DMSO) with a combination treatment (PRN694 1 μM for 24 hours and venetoclax 100 nM for 4 hours) vs the viability with monotherapy (venetoclax 100 nM for 4 hours; unpaired Student t test; means ± SEM). *P < .05; **P < .01; ****P < .0001.](https://ash.silverchair-cdn.com/ash/content_public/journal/blood/137/25/10.1182_blood.2020007303/1/m_bloodbld2020007303f4.png?Expires=1767707816&Signature=x87dzPeSES4-K1ODOW7~pAu48hOILQ1EQCfzLdyOlMy4ID5szoDsPpid0HHndBngFeHzl1pvyrnZo5o4FX~lOpvwNA8elyaF2o3kdJOesUy6yl0exx533GID1mr36T2slWcYA8gk2iXAKojrNo0WnF2mGCc73GzZQGQ7VY1WmnznYpdVBcgdzRUAVITuSE4n0KTbsu4I-w7w0as3hoDQYCtHLTYonGfNLQeZBWeTlaFAOlUneP5cMjrs1XuZTre3ikxsNXKj8MWkoXkocI-6zzlHx5HWpjT5rbqnVmZ25GZhSNNwSZt~wqHQaYV5Yk-oVQi6Au7uZKAC84GLYriO9A__&Key-Pair-Id=APKAIE5G5CRDK6RD3PGA)
JAK/STAT molecular status influences efficacy of ruxolitinib and PRN694, as well as levels of STAT5b phosphorylation. (A) Induction of apoptosis shown as fold change in viability. Each point is one of the 24 T-PLL samples: 5 without any mutation in the JAK/STAT pathway, and 19 with at least 1 mutation in the pathway. The values presented are the ratio of the viability (percentage vs DMSO), with a combination treatment (ruxolitinib 1 μM for 24 hours and venetoclax 100 nM for 4 hours), vs the viability with monotherapy (venetoclax 100 nM for 4 hours). Unpaired Student t test; means ± standard error of the mean [SEM]). (B) Induction of apoptosis shown as a percentage of viable (annexin V negative/Hoechst positive vs control) cells after a 24-hour exposure to DMSO or ruxolitinib 1 μM and a 4-hour exposure to venetoclax 100 nM, showing individual paired values. The values in the left column of data are those of the 8 samples presenting at least a mutation of STAT5B, the values on the right are those of the 11 samples presenting an isolated mutation of JAK3 or JAK1. The mean reduction of viability (measured viability of DMSO vs ruxolitinib) is significantly larger in the 11 samples without STAT5B mutation (unpaired Student t test). (C) Densitometry analysis of the ratio of expression of phospho-STAT5 to total STAT5, in 9 T-PLL samples (each point is labeled with the T-PLL sample number). The samples were divided into 2 groups: 2 T-PLL samples without mutations in the JAK/STAT pathway genes and 7 T-PLL samples with at least 1 activating mutation in that pathway (unpaired Student t test; means ± SEM). (D) Representative examples of western blot analysis of phospho-STAT5 and total STAT5 in 4 T-PLL samples at baseline. β-Actin was used as the loading control. (E) Induction of apoptosis shown as fold change in viability, in the 24 T-PLL samples. The values presented are the ratio between the viability (percentage vs DMSO) with a combination treatment (PRN694 1 μM for 24 hours and venetoclax 100 nM for 4 hours) vs the viability with monotherapy (venetoclax 100 nM for 4 hours; unpaired Student t test; means ± SEM). *P < .05; **P < .01; ****P < .0001.
JAK/STAT molecular status influences efficacy of ruxolitinib and PRN694, as well as levels of STAT5b phosphorylation. (A) Induction of apoptosis shown as fold change in viability. Each point is one of the 24 T-PLL samples: 5 without any mutation in the JAK/STAT pathway, and 19 with at least 1 mutation in the pathway. The values presented are the ratio of the viability (percentage vs DMSO), with a combination treatment (ruxolitinib 1 μM for 24 hours and venetoclax 100 nM for 4 hours), vs the viability with monotherapy (venetoclax 100 nM for 4 hours). Unpaired Student t test; means ± standard error of the mean [SEM]). (B) Induction of apoptosis shown as a percentage of viable (annexin V negative/Hoechst positive vs control) cells after a 24-hour exposure to DMSO or ruxolitinib 1 μM and a 4-hour exposure to venetoclax 100 nM, showing individual paired values. The values in the left column of data are those of the 8 samples presenting at least a mutation of STAT5B, the values on the right are those of the 11 samples presenting an isolated mutation of JAK3 or JAK1. The mean reduction of viability (measured viability of DMSO vs ruxolitinib) is significantly larger in the 11 samples without STAT5B mutation (unpaired Student t test). (C) Densitometry analysis of the ratio of expression of phospho-STAT5 to total STAT5, in 9 T-PLL samples (each point is labeled with the T-PLL sample number). The samples were divided into 2 groups: 2 T-PLL samples without mutations in the JAK/STAT pathway genes and 7 T-PLL samples with at least 1 activating mutation in that pathway (unpaired Student t test; means ± SEM). (D) Representative examples of western blot analysis of phospho-STAT5 and total STAT5 in 4 T-PLL samples at baseline. β-Actin was used as the loading control. (E) Induction of apoptosis shown as fold change in viability, in the 24 T-PLL samples. The values presented are the ratio between the viability (percentage vs DMSO) with a combination treatment (PRN694 1 μM for 24 hours and venetoclax 100 nM for 4 hours) vs the viability with monotherapy (venetoclax 100 nM for 4 hours; unpaired Student t test; means ± SEM). *P < .05; **P < .01; ****P < .0001.
To better understand the mechanistic underpinnings of these differences, we measured the baseline activity of the JAK/STAT pathway by the level of phosphorylation of STAT5B. T-PLL cells harboring at least 1 JAK/STAT pathway mutation had a higher level of STAT5B phosphorylation compared with samples with no mutation (n = 7 vs n = 2 respectively; P = .013; protein quantification in Figure 4C, representative examples in Figure 4D and all 9 blots shown in supplemental Figure 4). No difference was observed according to STAT5B mutational status (data not shown). Conversely, the activity of PRN694 in combination with venetoclax was significantly higher in the samples without activating mutations in the JAK/STAT pathway, with a mean of 0.736 for the 5 patient samples without an activating mutation in the JAK/STAT pathway, and 0.956 for the 19 samples with a mutation (P = .002; Figure 4E). No significant difference was seen in these subgroups with belinostat treatment (data not shown).
Venetoclax plus ruxolitinib was effective for 2 patients with refractory T-PLL
Based on our preclinical data, we treated 2 patients with refractory T-PLL, for whom no standard treatment option was suitable, with venetoclax+ruxolitinib. The patients’ baseline characteristics and medical history are shown in supplemental Table 2. They provided informed consent to the therapeutic approach. The treatment schedules as well as white blood cell counts are presented in Figure 5A-B. No patient developed tumor lysis syndrome on this combination. Repeat CT scans after 30 days of combination therapy for patient A showed resolution of splenomegaly (Figure 5C). At latest follow-up, all consensus criteria1 for complete response were met except the circulating lymphocyte count of 23.6 × 10⁹/L (which was above the threshold of 4 × 10⁹/L), classifying patient A as partial response, now maintained for 10 months. Patient B had previously initiated venetoclax monotherapy but began to have a slowly increasing lymphocyte count. The addition of ruxolitinib at day 61 led to stabilization of the disease. The combination was stopped because of the COVID-19 pandemic, as continuation of this off-label therapy was no longer possible in the patient’s nursing facility during lockdown, and disease progression occurred off therapy at day 127 after venetoclax initiation. Patient B never resumed combination therapy and was lost to follow-up. Observed adverse events, their timing and management are described in supplemental Table 3. Of note, the T-PLL cells of patient A were JAK3 mutated, and we did not find any mutation in the JAK/STAT pathway for patient B. Given the more robust clinical response of patient A, these clinical data are consistent with our previous preclinical finding that enhancement of BCL-2 dependence by JAK1 inhibition may be stronger in mutated T-PLL. Of note, a third patient (“patient C” described in supplemental Table 3 and supplemental Figure 5) was treated with the combination of venetoclax and the HDACi romidepsin (used instead of belinostat because of availability). This option was chosen because her disease was not mutated in the JAK/STAT pathway. She achieved a partial response, currently ongoing after 9 months. With maximal venetoclax dosing (800 mg/d) the lymphocyte count has stabilized at ∼40 × 109/L, with occasional need for platelet transfusion support.
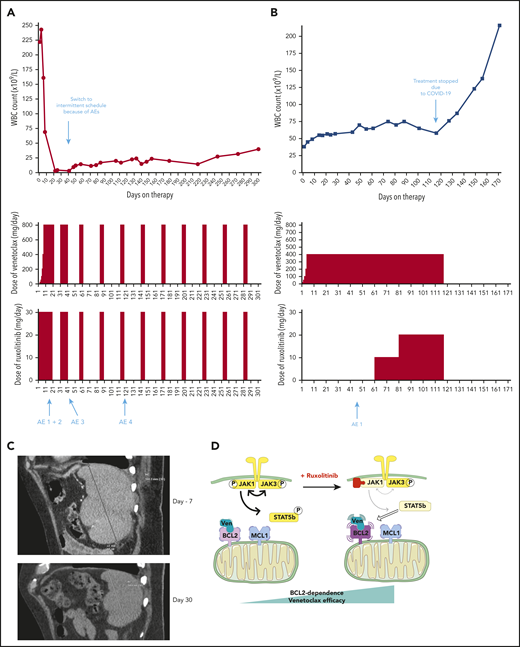
Two patients treated with the venetoclax+ruxolitinib combination. (A) Patient A (top): the curve shows the evolution of white blood cell (WBC) count during treatment with the venetoclax+ruxolitinib combination. The 2 histogram graphs show the daily doses of venetoclax and ruxolitinib received. The combination was started with ruxolitinib 15 mg twice daily and venetoclax 2 days later with a daily ramp-up from 20 to 800 mg over 6 days. Adverse events (AEs): (1) grade 3 urinary infection; (2) grade 3 thrombocytopenia; (3) grade 3 exacerbation of COPD; and (4) grade 3 pneumonia. Because of the repeated infectious AEs and thrombocytopenia, the schedule was modified to an intermittent one, with ruxolitinib 15 mg twice daily given together with venetoclax 400 mg daily for 5 days, at 4-week intervals. (B) Same data for patient B: venetoclax was started first with a daily ramp-up from 20 mg to 800 mg over 6 days. After 2 months of slow progression, ruxolitinib was added at 10 mg/d and then increased to 10 mg twice daily. AE 1: grade 2 thrombocytopenia. (C) A computed tomographic scan of patient A showing the spleen at baseline (largest dimension measured, 168.3 mm) and 1 month after the beginning of treatment with ruxolitinib+venetoclax (largest dimension measured, 110 mm). (D) The proposed mechanism underlying our main findings. At baseline, BCL-2 and MCL-1 are molecular vulnerabilities in T-PLL. JAK/STAT pathway inhibition through JAK1 inhibition selectively increases BCL-2–dependent apoptotic priming and the activity of venetoclax.
Two patients treated with the venetoclax+ruxolitinib combination. (A) Patient A (top): the curve shows the evolution of white blood cell (WBC) count during treatment with the venetoclax+ruxolitinib combination. The 2 histogram graphs show the daily doses of venetoclax and ruxolitinib received. The combination was started with ruxolitinib 15 mg twice daily and venetoclax 2 days later with a daily ramp-up from 20 to 800 mg over 6 days. Adverse events (AEs): (1) grade 3 urinary infection; (2) grade 3 thrombocytopenia; (3) grade 3 exacerbation of COPD; and (4) grade 3 pneumonia. Because of the repeated infectious AEs and thrombocytopenia, the schedule was modified to an intermittent one, with ruxolitinib 15 mg twice daily given together with venetoclax 400 mg daily for 5 days, at 4-week intervals. (B) Same data for patient B: venetoclax was started first with a daily ramp-up from 20 mg to 800 mg over 6 days. After 2 months of slow progression, ruxolitinib was added at 10 mg/d and then increased to 10 mg twice daily. AE 1: grade 2 thrombocytopenia. (C) A computed tomographic scan of patient A showing the spleen at baseline (largest dimension measured, 168.3 mm) and 1 month after the beginning of treatment with ruxolitinib+venetoclax (largest dimension measured, 110 mm). (D) The proposed mechanism underlying our main findings. At baseline, BCL-2 and MCL-1 are molecular vulnerabilities in T-PLL. JAK/STAT pathway inhibition through JAK1 inhibition selectively increases BCL-2–dependent apoptotic priming and the activity of venetoclax.
Discussion
Recent international collaborations1 have begun to promote translational science that may bring the benefits of novel agent-based therapies to T-PLL. Much of this initial preclinical work has focused on the genetics of T-PLL and how that might influence susceptibility to various targeted treatments.27 We report for the first time a functional precision-medicine approach, using BH3 profiling to dissect T-PLL biology and to identify novel combination approaches to therapy. We found that, relative to CLL cells, T-PLL cells are less primed to undergo apoptosis. Unlike CLL cells, which depend primarily on BCL-2 for survival, T-PLL cells are heterogeneous and may commonly also depend on MCL-1. Dual inhibition of BCL-2 and MCL-1 potently induced cell death in our model. Moreover, JAK/STAT pathway inhibition with ruxolitinib and HDAC inhibition with belinostat selectively increased BCL-2 dependence, thereby sensitizing T-PLL cells to venetoclax. A model of these interactions is summarized in Figure 5D. We began to explore the combination of venetoclax and ruxolitinib in vivo by treating 2 patients with refractory T-PLL, and we observed a deep response, which is ongoing after 10 months in the JAK3-mutated T-PLL, as well as a stabilization of the disease in a patient for whom no mutation was found in the JAK/STAT pathway of tumor cells.
Several recent studies have evaluated targeted therapies in T-PLL cells through analysis of isolated primary T-PLL cells derived from the peripheral blood10,14,17 ; however, the microenvironment most likely modulates intracellular survival signaling in T-PLL. One group used stromal support (NKT) and found that SNS-032, a cyclin-dependent kinase inhibitor, overcame the stroma-mediated protective effect.9 In another study, IL-2, IL-4, and CD40L stimulation was used to mimic the effects of the lymph node microenvironment, which led to resistance to inhibition of both BCL-2 and MCL-1.14 We used the NKT stromal coculture system, which is known to generate media enriched with IL-6 and CXCL1028 and also promotes malignant cell survival through direct cell-cell interactions. The use of this coculture model may at least in part explain the lower activity of the drugs used in monotherapy in our study in comparison with other published data.9 An advantage of this model is that it enabled us to confirm, under different conditions, the synergy between inhibition of BCL-2 and MCL-1 in T-PLL, which was also suggested by a recent study.14 Although this promising approach is now under evaluation in other hematologic malignancies, theoretical concerns about the potential for hematologic and cardiac toxicities suggest that we should also investigate other venetoclax combination strategies given the possibility that a BCL-2 plus MCL-1 inhibitor combination is not feasible from a safety perspective.
To explore other potential combination partners for venetoclax, we focused on targeting other pathways crucial to the pathophysiology of T-PLL: JAK/STAT, histone acetylation, and the TCR pathway. In a meta-analysis that included sequence information on JAK or STAT gene loci in 275 patients with T-PLL, a cumulative rate of 62.1% of cases with mutated JAK or STAT genes were found. Functionally, it has been shown that IL2RG-JAK1-JAK3-STAT5B mutations led to STAT5 hyperactivation that transformed Ba/F3 cells, resulting in cytokine-independent growth, and/or enhanced colony formation in Jurkat T cells.29 Prior work has also suggested that pharmacologic inhibition of the JAK/STAT pathway with the phospho-STAT5 inhibitor tool compound pimozide led to decreased T-PLL cell viability and diminished phospho-STAT5 levels.29 Basal STAT5B phosphorylation level in T-PLL cells was evaluated in 2 studies,2,11 and a common finding was noticeable basal phosphorylation of STAT5B in several T-PLL samples, which could be explained by IL2RG-JAK1-JAK3-STAT5B mutations or by genomic losses of hypothetical negative regulators of STAT5B.2 In both studies, the amount of STAT5B phosphorylation was heterogeneous and was higher in cases with mutated JAK1, JAK3, or STAT5B, consistent with our findings.
Previous work has shown that JAK3, even when constitutively active, does not mediate STAT5 phosphorylation without JAK1 and that JAK1 phosphorylates JAK3 and STAT5, whereas JAK3 phosphorylates and fully activates JAK1, but not STAT5.30 Our results are consistent with these data, given that we found that JAK1 inhibition with ruxolitinib (IC50, 3.3 nM) enhances BCL-2 dependence and venetoclax activity, whereas JAK3 inhibition with PRN694 (IC50, 30 nM) does not. Moreover, the growth-promoting activity of mutated STAT5B can be partially abrogated by a JAK1 inhibitor.31 To some extent, even mutated STAT5B needs some phosphorylated JAK1 to transduce signal, consistent with our data showing that ruxolitinib has a preserved, but less pronounced, effect on STAT5B-mutated T-PLL cells. Finally, an influence of phosphorylated STAT5B on BCL-2 family proteins in T cells is described,32-34 but further work is needed to explore this finding in T-PLL.
In addition to JAK/STAT dysregulation, T-PLL is characterized by dysregulation of histone acetylation, which can be targeted by HDACi.11 We showed a significant increase in overall priming after treatment with belinostat, which may help explain the reported synergy of HDACi with chemotherapy and alemtuzumab.12 Likewise, it has been proposed that p53 activation, by reacetylation through HDAC inhibition, can influence BCL-2 family proteins, particularly BCL-2 and BCL-xL.15 Our finding that belinostat increases BCL-2 dependence is consistent with that hypothesis. Finally, our results also shed light on how targeting the TCR pathway could be effective in T-PLL. Although not as pronounced as the effects we saw with JAK/STAT or HDAC inhibitors, we do see a modest effect on viability with TCR pathway inhibition through the selective ITK inhibitor PRN694 when combined with venetoclax. This effect was not significant with ibrutinib at the dose of 1 μM. This is consistent with our previous data, where ibrutinib was used at a higher dose of 10 μM, which inhibited ITK more potently.17 Interestingly, the effect of PRN694 was primarily seen in T-PLL cells without activating mutations in the JAK/STAT pathway, suggesting that the pathophysiology in this subset of patients with T-PLL may rely more on the proximal TCR signalosome.
Our preclinical data on venetoclax with ruxolitinib led to the initial exploration of this combination in 2 patients with refractory T-PLL. One of the patients carried the JAK3 mutation and experienced a deep partial response, which, at this writing, is sustained for 10 months with an intermittent treatment strategy. The second patient (without a JAK-STAT pathway mutation detected in tumor cells) experienced stabilized disease. These results, along with our preclinical data, strongly support the development of a prospective clinical trial to evaluate the safety and efficacy of this combination in T-PLL. Finally, the partial response of patient C (without a JAK-STAT pathway mutation detected in tumor cells and treated with venetoclax and romidepsin), which, at this writing, was sustained for 9 months, supports further evaluation of venetoclax+HDACi in T-PLL, especially in patients without a JAK/STAT pathway mutation in their T-PLL cells.
For original data, please e-mail the corresponding author.
The online version of this article contains a data supplement.
The publication costs of this article were defrayed in part by page charge payment. Therefore, and solely to indicate this fact, this article is hereby marked “advertisement” in accordance with 18 USC section 1734.
Acknowledgments
The authors thank the patients and their families; the French Innovative Leukemia Organization for support and biobanking; and Nathalie Helevaut for excellent technical help. The authors also thank Christophe Roumier and the Lille Hospital Tumor Bank for handling, conditioning, and storing patient samples: Tumorothèque du C2RC Lille, Centre de Biologie Pathologie Pôle de Pathologie Tumorothèque du Centre Régional de Référence en Cancérologie de Lille. 2 Avenue Oscar LAMBRET, 59037 LILLE, certification NF 96900-2014/65453-1, Centre Hospitalier Régional Universitaire de Lille.
This work was supported by Lille University School of Medicine (France), Fondation Monahan, Fulbright Commission Franco-Américaine, SiLLC (association de Soutien et d'Information à la LLC), Vienna Science and Technology Fund (grant LS16-034), the Pan-Massachusetts Challenge Team FLAMES (C.H. and M.S.D.), and a Scholar in Clinical Research award from the Leukemia and Lymphoma Society (M.S.D.).
Authorship
Contribution: C.H., C.K., S.P., P.B.S., and M.S.D. contributed to the overall design, performed research, collected, analyzed, and interpreted data, and prepared and wrote the manuscript; S.P. coordinated sample banking and performed DNA sequencing; M.C.C., R.V., S.J.F.C., and L.H. contributed to the overall design and performed research; C.H., C.K., and M.S.D. analyzed the data and performed the statistical analyses; C.H., M.S.D., O.T., F.L., J.D., A.D., C.T., K.L., L.R., D.R.-W., C.R., E.V.D.N., C.L., F. Merabet, J.V.M., M.T., and F. Morschhauser provided clinical care and collected data; L.Y. and S.N. provided support; P.B.S. and M.S.D. supervised the study; and all authors critically reviewed and approved the final version of the manuscript.
Conflict-of-interest disclosure: C.H. has received research funding from Takeda and AbbVie and honoraria and nonfinancial support from Roche, Janssen-Cilag, AbbVie, and Takeda. C.R. has received research funding from Roche and honoraria and nonfinancial support from Janssen, Roche, and Takeda. M.S.D. has been a consultant for AbbVie, Adaptive Biotechnologies, Ascentage Pharma, AstraZeneca, BeiGene, Celgene, Eli Lilly, Genentech, Janssen, MEI Pharma, Pharmacyclics, Research to Practice, TG Therapeutics, Verastem, and Zentalis and has received research support from AbbVie, Ascentage Pharma, AstraZeneca, Genentech, MEI Pharma, Novartis, Pharmacyclics, Surface Oncology, TG Therapeutics, and Verastem. The remaining authors declare no competing financial interests.
Correspondence: Matthew S. Davids, Department of Medical Oncology, Dana-Farber Cancer Institute, 450 Brookline Ave, Boston, MA 02215; e-mail: matthew_davids@dfci.harvard.edu.

This feature is available to Subscribers Only
Sign In or Create an Account Close Modal