

Key Points
The IgH.TEμ CLL mouse model faithfully replicates features of the human pathology.
Notch facilitates CLL disease initiation, promotes cell proliferation, and CLL disease progression.

Abstract
NOTCH1 gain-of-function mutations are recurrent in B-cell chronic lymphocytic leukemia (B-CLL), where they are associated with accelerated disease progression and refractoriness to chemotherapy. The specific role of NOTCH1 in the development and progression of this malignancy is unclear. Here, we assess the impact of loss of Notch signaling and pathway hyperactivation in an in vivo mouse model of CLL (IgH.TEμ) that faithfully replicates many features of the human pathology. Ablation of canonical Notch signaling using conditional gene inactivation of RBP-J in immature hematopoietic or B-cell progenitors delayed CLL induction and reduced incidence of mice developing disease. In contrast, forced expression of a dominant active form of Notch resulted in more animals developing CLL with early disease onset. Comparative analysis of gene expression and epigenetic features of Notch gain-of-function and control CLL cells revealed direct and indirect regulation of cell cycle–associated genes, which led to increased proliferation of Notch gain-of-function CLL cells in vivo. These results demonstrate that Notch signaling facilitates disease initiation and promotes CLL cell proliferation and disease progression.
Introduction
B-cell chronic lymphocytic leukemia (CLL) is the most prevalent form of adult leukemia.1-4 The disorder is characterized by accumulation of mature B lymphocytes in blood, bone marrow (BM), and lymphoid tissues leading to splenomegaly, lymphadenopathy, and BM failure.3 Some patients remain asymptomatic for years with a relatively normal life expectancy; others progress over time with 10% advancing to Richter syndrome, which is often lethal.2,5 The heterogeneity in disease progression and outcome are associated with a broad diversity of mutational and chromosomal aberrations. CLL patients can be subdivided into 2 major subgroups based on somatic mutations in the immunoglobulin heavy chain variable (IGHV) region genes. Patients carrying IGHV genes with somatic hypermutations have a more favorable prognosis compared with those with unmutated IGHV.3 Several translocations, including 13q14, 11q23, and 17p13, have been characterized in CLL and shown to bolster disease progression by various mechanisms.6-13
Recent whole-genome sequencing efforts of CLL patient samples have identified previously unrecognized genetic mutations,14,15 including those in NOTCH1, which occur at a frequency of 5% to 12% at diagnosis.14,16 NOTCH1 mutations are primarily found in the more aggressive IGHV nonmutated CLL patient group and often correlate with trisomy 12. The mutation frequency appears to increase with disease progression, reaching up to 31% in patients subsequently diagnosed with Richter syndrome transformation and 21% in chemorefractory CLL patients.16 Although NOTCH1 mutations do not appear to be causative for CLL, they are associated with poor outcomes and most likely acquired during disease progression.15,17-19
Notch signaling regulates a multitude of physiological functions, including stem cell self-renewal, cell fate specification, proliferation, and apoptosis.20,21 Physiological Notch signaling is initiated through ligand-receptor interaction between neighboring cells. Upon ligand binding, receptors liberate the Notch intracellular domain (NICD), which translocates to the nucleus and interacts with the transcription factor RBP-J to form a short-lived complex leading to activation of target genes.20
NOTCH1 mutations in CLL are largely frameshift or nonsense mutations in the C-terminal PEST degron increasing the half-life of NICD.14-16,22 Mutations clustering to the PEST sequence of the NOTCH1 gene have also been identified in Mantel cell lymphoma23 and for the NOTCH2 gene in splenic marginal zone cell lymphoma.24,25 The correlation between PEST mutations in NOTCH genes in B-cell neoplasms with poor patient outcome, increased chemoresistance, and disease progression suggests that NOTCH mutations are oncogenic. There is, however, no clear consensus of how increased NOTCH1 signaling might influence disease onset, progression, and/or maintenance. To date, no reliable cell culture system exists that truly mimics CLL. Therefore, we used a mouse model for CLL (IgH.TEμ) that faithfully recapitulates many of the human disease phenotypes.26 We performed genetic Notch loss- and gain-of-function experiments combined with gene expression and epigenetic analysis to investigate how this signaling cascade might be involved in CLL initiation and tumor progression.
Methods
Mice
IgH.TEμ,26 RBP-Jlox/lox,27 RNIClox/lox,28 Mx1-Cre,29 mb1-Cre,30 and CD19-Cre31 mouse lines have been previously described. All strains were backcrossed into 129S2/SvPasCrl (Charles River, France) for 3 generations to generate IgH.TEμ;RBP-Jlox/lox Mx1-Cre, IgH.TEμ;RBP-JΔ/Δ mb1-Cre, IgH.TEμ;RBP-JΔ/Δ CD19-Cre, IgH.TEμ;RNICΔ/+ mb1-Cre, and IgH.TEμ;RNICΔ/+ CD19-Cre. C57BL/6-CD45.1 (Jackson Laboratories, Bar Harbor, ME) and Rag2−/−γc−/− (Taconic Europe, Denmark) were purchased, bred, and maintained at the Ecole Polytechnique Fédérale de Lausanne animal facility. Mx1-Cre-induced gene inactivation was achieved by intraperitoneal injections of 2 μg/g body weight polyI:polyC (Invivogen) at 2-day intervals. Genomic deletion of RBP-J was assessed by polymerase chain reaction (PCR) (primer sequences available in supplemental Methods, available on the Blood Web site).
Flow cytometry analyses and cell sorting
Single-cell suspensions were prepared from spleen, BM, thymus, or peripheral blood lymphocytes (PBL) of mice as previously described.32 CLL cells were defined as CD19+B220low/−CD5+ and B cells as CD19+B220+CD5−. Expansion of CLL cells was followed by flow-cytometric analysis of PBL and at end point in splenocytes and BM. For cleaved α-Notch1 western blot analysis, assay for transposase-accessible chromatin sequencing (ATAC-seq), RNA sequencing (RNA-seq), and chromatin immunoprecipitation sequencing (ChIP-seq) analysis CLL cells were sorted using FACSAria sorters (Becton Dickinson). Purity of sorted subsets was >97%. Flow-cytometric data were acquired on a Gallios cytometer (Beckman Coulter) and flow-cytometric data were analyzed using FlowJo (Tree Star). Cell viability was assessed using 4′,6-diamidino-2-phenylindole (DAPI; Invitrogen). All primary and secondary antibody conjugates are listed in supplemental Methods.
Protein analysis
Proteins of sorted CLL cells (whole cell extracts) were analyzed either by standard western blot techniques or using a partially automated Simple Western System, based on capillary electrophoresis with reagents provided by the manufacturer (Protein Simple). Detailed procedures and all primary and secondary antibodies are described in supplemental Methods.
Ethics statement
All animal work was carried out in accordance with Swiss national guidelines. This study was reviewed and approved by the cantonal veterinary service, Vaud.
Bioinformatic analysis
Detailed bioinformatics tools used for analysis of high-throughput data are provided in supplements. ATAC-seq, RNA-seq, and ChIP-seq data were deposited in the Gene Expression Omnibus database accession number GSE160511. All other methods are provided in supplemental Methods.
Results
IgH.TEμ is a reliable in vivo CLL mouse model
We investigated the role of Notch signaling in CLL using a mouse model of CLL-like disease, IgH.TEμ,26 based on the sporadic expression of the SV40 large T antigen in mature B cells. Disease development is characterized through downregulation of B220 and concomitant upregulation of CD5 and CD43 cell surface markers (Figure 1A). It takes approximately 9 months until mice progress to full-blown disease with downregulation of CD5 and CD43 (Figure 1A-B). At end-stage, all animals develop splenomegaly, lymphadenopathy, anemia, and CLL cell infiltration in the liver (Figure 1C-E). Morphologically, CLL cells are characterized by larger, folded nuclei compared with B lymphocytes of age-matched littermate controls (Figure 1F). The massive infiltration of CLL cells in both spleen and lymph nodes results in complete loss of organ architecture (Figure 1G). All CLL cells have increased Notch1 and Notch2 cell surface receptor expression (Figure 2A). Furthermore, the cleaved form of Notch1 (NICD) in CD19+B220−CD5+ CLL cells is increased three- to fourfold at 3, 6, and 9 months of disease progression compared with physiological B cells (Figure 2B-C; supplemental Figure 1A-B). CLL cells are characterized by increased Bcl-2 levels, which is pronounced at end-stage (Figure 2D-E; supplemental Figure 1C-D), making this a suitable CLL mouse model to study the role of Notch signaling.
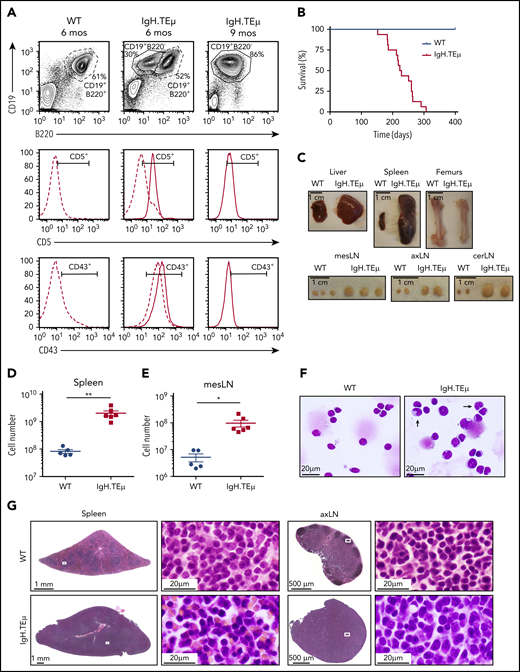
IgH.TEμ CLL mouse model recapitulates key features of the human pathology. Aging mouse cohorts of IgH.TEμ transgenic mice and wild-type (WT) littermate control animals were monitored over time for disease development and progression and analyzed at end-stage. (A) Representative flow cytometric profiles of splenocytes stained for CD19, B220, CD5, and CD43 of WT littermate control and IgH.TEμ mice at indicated time points, 6 and 9 months (mos), are shown. The CD5 and CD43 histograms are gated on CD19+ B220+ B cells for WT control (dashed line, left) and on CD19+ B220+ (dashed line) and CD19+ B220− (solid line, center and right panels) for IgH.TEμ mice. (B) Kaplan-Meier survival curves of WT (blue line, n = 10) and IgH.TEμ (red line, n = 16) aging cohorts. (C) Macroscopic view of representative tissues: 1 liver lobe, spleen, femurs, and lymph nodes (LN) derived from WT and IgH.TEμ mice at end-stage (9 months LN; 10 months spleen, liver, and femur) is depicted. Absolute cell numbers of CD19+ cells (D) in the spleen and (E) mesenteric LN (mesLN) of WT littermates (blue circles, n = 5) and IgH.TEμ mice (red squares, n = 6) are displayed. P values were calculated using unpaired Student t test: **P = .0026, *P = .0150. (F) May Grunwald-Giemsa staining of cytospin preparations of splenocytes from WT littermate control (left) and IgH.TEμ mice (right) at 7 months. Arrows point to the larger and more folded nuclei of B lymphocytes in splenocytes of IgH.TEμ mice. (G) Hematoxylin and eosin staining of spleen and axillary LN (axLN) sections from WT littermate control (upper) and IgH.TEμ mice (lower) at 7 months. Scale bars as indicated.
IgH.TEμ CLL mouse model recapitulates key features of the human pathology. Aging mouse cohorts of IgH.TEμ transgenic mice and wild-type (WT) littermate control animals were monitored over time for disease development and progression and analyzed at end-stage. (A) Representative flow cytometric profiles of splenocytes stained for CD19, B220, CD5, and CD43 of WT littermate control and IgH.TEμ mice at indicated time points, 6 and 9 months (mos), are shown. The CD5 and CD43 histograms are gated on CD19+ B220+ B cells for WT control (dashed line, left) and on CD19+ B220+ (dashed line) and CD19+ B220− (solid line, center and right panels) for IgH.TEμ mice. (B) Kaplan-Meier survival curves of WT (blue line, n = 10) and IgH.TEμ (red line, n = 16) aging cohorts. (C) Macroscopic view of representative tissues: 1 liver lobe, spleen, femurs, and lymph nodes (LN) derived from WT and IgH.TEμ mice at end-stage (9 months LN; 10 months spleen, liver, and femur) is depicted. Absolute cell numbers of CD19+ cells (D) in the spleen and (E) mesenteric LN (mesLN) of WT littermates (blue circles, n = 5) and IgH.TEμ mice (red squares, n = 6) are displayed. P values were calculated using unpaired Student t test: **P = .0026, *P = .0150. (F) May Grunwald-Giemsa staining of cytospin preparations of splenocytes from WT littermate control (left) and IgH.TEμ mice (right) at 7 months. Arrows point to the larger and more folded nuclei of B lymphocytes in splenocytes of IgH.TEμ mice. (G) Hematoxylin and eosin staining of spleen and axillary LN (axLN) sections from WT littermate control (upper) and IgH.TEμ mice (lower) at 7 months. Scale bars as indicated.
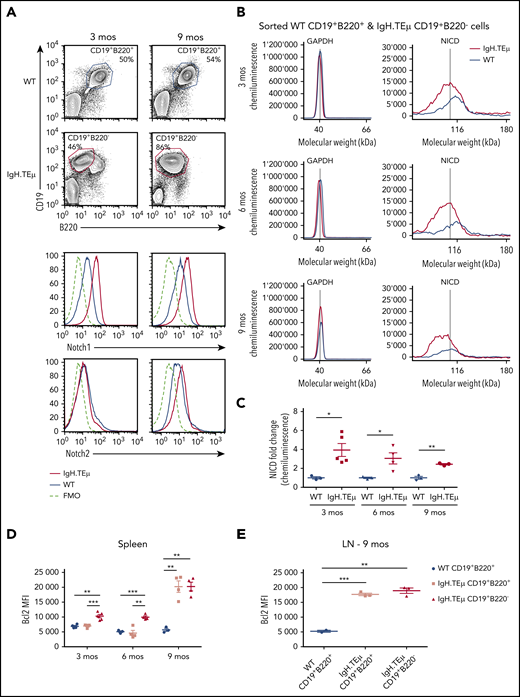
Notch1 signaling is detected in CLL cells. IgH.TEμ and age-matched wild type (WT) littermate control mice were analyzed at different disease stages to assess Notch1 signaling. (A) Representative flow cytometric analysis of total splenocytes stained for CD19, B220, and surface expression of Notch1 and Notch2 in WT littermate control and IgH.TEμ mice at indicated time points of 3 and 9 months (mos) are depicted. Histograms show Notch1 (upper) and Notch2 surface expression (lower) of splenocytes isolated from 3 (left) or 9-mos-old (right) IgH.TEμ (red line) and WT littermate control animals (blue line). Histogram profiles are gated on CD19+B220+ B cells for WT control and on CD19+B220− CLL cells for IgH.TEμ animals. The dashed black line represents the fluorescence minus 1 (FMO) performed on the WT littermate controls omitting either Notch1 or Notch2 antibody staining. (B) Representative chemiluminescence profiles generated for quantification of GAPDH and NICD from whole cell extracts of sorted WT CD19+B220+ and IgH.TEμ CD19+B220− splenocytes from 3-, 6-, and 9-mos-old animals using Simple Western System. (C) Quantification of relative protein expression of NICD comparing WT (n = 3) vs IgH.TEμ (n = 5) samples at 3 mos, WT (n = 3) vs IgH.TEμ (n = 3) samples at 6 mos, and WT (n = 3) vs IgH.TEμ (n = 3) samples at 9 mos using Compass Software (ProteinSimple). Quantification of flow cytometric analysis of relative values using mean fluorescence intensity (MFI) of intracellular Bcl2 expression in (D) spleen WT (n = 4) vs IgH.TEμ CD19+B220+ (n = 4) vs IgH.TEμ CD19+B220− (n = 5) samples at 3 mos, WT (n = 3) vs IgH.TEμ CD19+B220+ (n = 4) vs IgH.TEμ CD19+B220− (n = 3) samples at 6 mos and WT (n = 3) vs IgH.TEμ CD19+B220+ (n = 4) vs IgH.TEμ CD19+B220− (n = 3) samples at 9 mos. (E) Quantification of LN from WT (n = 4) vs IgH.TEμ CD19+B220+ (n = 3) vs IgH.TEμ CD19+B220+ (n = 3) samples at 9 mos. P values were calculated using unpaired Student t test: *P < .05, **P < .01, and ***P < .001.
Notch1 signaling is detected in CLL cells. IgH.TEμ and age-matched wild type (WT) littermate control mice were analyzed at different disease stages to assess Notch1 signaling. (A) Representative flow cytometric analysis of total splenocytes stained for CD19, B220, and surface expression of Notch1 and Notch2 in WT littermate control and IgH.TEμ mice at indicated time points of 3 and 9 months (mos) are depicted. Histograms show Notch1 (upper) and Notch2 surface expression (lower) of splenocytes isolated from 3 (left) or 9-mos-old (right) IgH.TEμ (red line) and WT littermate control animals (blue line). Histogram profiles are gated on CD19+B220+ B cells for WT control and on CD19+B220− CLL cells for IgH.TEμ animals. The dashed black line represents the fluorescence minus 1 (FMO) performed on the WT littermate controls omitting either Notch1 or Notch2 antibody staining. (B) Representative chemiluminescence profiles generated for quantification of GAPDH and NICD from whole cell extracts of sorted WT CD19+B220+ and IgH.TEμ CD19+B220− splenocytes from 3-, 6-, and 9-mos-old animals using Simple Western System. (C) Quantification of relative protein expression of NICD comparing WT (n = 3) vs IgH.TEμ (n = 5) samples at 3 mos, WT (n = 3) vs IgH.TEμ (n = 3) samples at 6 mos, and WT (n = 3) vs IgH.TEμ (n = 3) samples at 9 mos using Compass Software (ProteinSimple). Quantification of flow cytometric analysis of relative values using mean fluorescence intensity (MFI) of intracellular Bcl2 expression in (D) spleen WT (n = 4) vs IgH.TEμ CD19+B220+ (n = 4) vs IgH.TEμ CD19+B220− (n = 5) samples at 3 mos, WT (n = 3) vs IgH.TEμ CD19+B220+ (n = 4) vs IgH.TEμ CD19+B220− (n = 3) samples at 6 mos and WT (n = 3) vs IgH.TEμ CD19+B220+ (n = 4) vs IgH.TEμ CD19+B220− (n = 3) samples at 9 mos. (E) Quantification of LN from WT (n = 4) vs IgH.TEμ CD19+B220+ (n = 3) vs IgH.TEμ CD19+B220+ (n = 3) samples at 9 mos. P values were calculated using unpaired Student t test: *P < .05, **P < .01, and ***P < .001.
RBP-J deficiency delays CLL disease onset and increases overall survival
We investigated the potential role of canonical Notch signaling using a conditional loss-of-function approach for RBP-J. RBP-J mediates Notch signaling through all Notch receptors, and loss of RBP-J completely abrogates canonical Notch signaling.21 IgH.TEμ mice were crossed with conditional RBP-J mice with or without the Mx1-Cre transgene to generate IgH.TEμ;RBP-Jlox/lox and IgH.TEμ;RBP-Jlox/lox Mx1-Cre mice. IgH.TEμ;RBP-Jlox/lox and IgH.TEμ;RBP-Jlox/lox Mx1-Cre mice were treated with the interferon-α-inducer polyI:polyC followed by BM transplantation to investigate how CLL develops in a hematopoietic system lacking RBP-J (supplemental Figure 2A). RBP-J gene inactivation in donor cells was verified by PCR (supplemental Figure 2B). Reconstitution efficiency of both IgH.TEμ;RBP-JΔ/Δ Mx1-Cre and IgH.TEμ;RBP-Jlox/lox chimeras was ≥90% (supplemental Figure 2C). Interestingly, although all IgH.TEμ;RBP-Jlox/lox chimeras developed CLL over a period of 11 months, none of the IgH.TEμ;RBP-JΔ/Δ Mx1-Cre chimeras developed disease (supplemental Figure 2D-E). Because Mx1-Cre-mediated gene inactivation occurs in all hematopoietic cells including hematopoietic stem cells (HSCs) and progenitors, we next investigated whether we would observe a similar effect if RBP-J inactivation specifically occurs in B-cell progenitors. Thus, we generated IgH.TEμ;RBP-Jlox/lox, IgH.TEμ;RBP-JΔ/Δ mb1-Cre, or IgH.TEμ;RBP-JΔ/Δ CD19-Cre mice.30,31 RBP-J was thereby inactivated either at the pro-B or pre-B cell stage, respectively. The effects of RBP-J loss of function in CLL development were assessed in BM chimeras and aging cohorts. PBL analysis for donor-derived cells at 4 weeks and 7 months posttransplantation revealed efficient and comparable engraftment of both IgH.TEμ;RBP-Jlox/lox and IgH.TEμ;RBP-JΔ/Δmb1-Cre BM-derived transplants (Figure 3A). The first IgH.TEμ;RBP-Jlox/lox BM chimeras developed disease 7 months posttransplantation. At 11 months, 8 of 9 IgH.TEμ;RBP-Jlox/lox BM chimeras were sick. In contrast, only 1 of the IgH.TEμ;RBP-JΔ/Δ mb1-Cre BM chimeras developed CLL within the experimental time frame of 12 months (Figure 3B-C). Next, we followed CLL development in aging cohorts of IgH.TEμ;RBP-Jlox/lox, IgH.TEμ;RBP-JΔ/Δ mb1-Cre, and IgH.TEμ;RBP-JΔ/Δ CD19-Cre mice to exclude any bias from the BM transplantation setup. Genetic inactivation of RBP-J and thus loss of canonical Notch signaling was confirmed revealing the expected loss of marginal zone B cells and downregulation of the Notch target gene Hes1 (supplemental Figure 3). IgH.TEμ;RBP-Jlox/lox mice developed and succumbed to CLL-like disease within 12 months. In contrast, <30% of the IgH.TEμ;RBP-JΔ/Δ mb1-Cre and IgH.TEμ;RBP-JΔ/Δ CD19-Cre mice developed disease, with delayed onset within this time frame (Figure 3D-F; supplemental Figure 4). PBL analysis at 6 months showed a significant increase of CD19+B220−CD5+ CLL-like cells in IgH.TEμ;RBP-Jlox/lox compared with both IgH.TEμ;RBP-JΔ/Δ mb1-Cre (Figure 3F) and IgH.TEμ;RBP-JΔ/Δ CD19-Cre animals (supplemental Figure 4C). In addition, 70% of the IgH.TEμ;RBP-JΔ/Δ mb1-Cre and IgH.TEμ;RBP-JΔ/Δ CD19-Cre mice remained disease-free over a time frame of 400 days; nevertheless, 30% of the mice succumb to disease (Figure 3D-E). RBP-J inactivation was confirmed in sorted CLL cells from moribund IgH.TEμ;RBP-JΔ/Δ mb1-Cre or IgH.TEμ;RBP-JΔ/Δ CD19-Cre mice (Figure 3G; supplemental Figure 4D), excluding an outgrowth of RBP-J-sufficient CLL cells. These results strongly suggest that RBP-J is critically implicated in CLL-like disease induction.
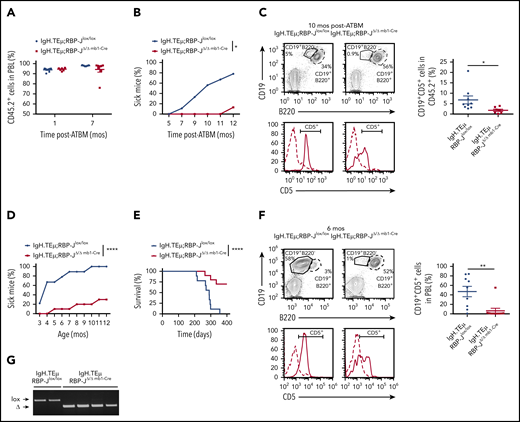
B cell-specific RBP-J deficiency reduces prevalence of CLL initiation. (A-C) Analysis of BM chimeras: Ten million CD45.2+ T cell–depleted BM cells isolated from IgH.TEμ;RBP-Jlox/lox and IgH.TEμ;RBP-JΔ/Δ mb1-Cre donors were transplanted into lethally irradiated CD45.1+ congenic recipients (n = 9 for IgH.TEμ;RBP-Jlox/lox control and n = 8 for IgH.TEμ;RBPΔ/Δ mb1-Cre experimental chimeras). (A) Relative reconstitution of BM chimeras 1 and 7 months (mos) posttransplantation (ATBM). Percentage of CD45.2+ cells in PBLs of control IgH.TEμ;RBP-Jlox/lox (blue, n = 9) and the RBP-J-deficient IgH.TEμ;RBP-JΔ/Δ mb1-Cre chimeras (red, n = 8) is shown. (B) Percentage of animals developing CLL over time post-ATBM within control IgH.TEμ;RBP-Jlox/lox (blue, n = 9) and IgH.TEμ;RBP-JΔ/Δ mb1-Cre (red, n = 8) chimeras is depicted. A mouse is considered sick when >5% of CLL-like cells (CD19+CD5+) are detected within CD45.2+ PBLs. P values were calculated using paired Student t test: *P = .0212. (C) Representative flow cytometric analysis of PBLs stained for CD19, B220 and CD5 derived from control IgH.TEμ;RBP-Jlox/lox (left) and the RBP-J-deficient IgH.TEμ;RBP-JΔ/Δ mb1-Cre (right) chimeras 10 months posttransplantation. The CD5 histograms (lower) are gated on CD19+B220+ B cells (dashed line) and CD19+B220− CLL cells (solid line). The far right panel plots the percentages of CLL cells (CD19+CD5+) within PBLs of respective BM chimeras 10 months posttransplantation. P values were calculated using unpaired Student t test: *P = .0406. Analysis of aging cohorts composed of 9 IgH.TEμ;RBP-Jlox/lox littermate controls and 10 IgH.TEμ;RBP-JΔ/Δ mb1-Cre mice. Disease progression was followed for 400 days. (D) Percentages of IgH.TEμ;RBP-Jlox/lox (blue, n = 9) and IgH.TEμ;RBP-JΔ/Δ mb1-Cre mice (red, n = 10) developing CLL over time is shown. A mouse was considered sick when >10% of CLL-like cells (CD19+CD5+) were present in total PBLs analyzed by flow cytometry. P values were calculated using paired Student t test: ****P < .0001. (E) The Kaplan-Meier method and log-rank (Mantel-Cox) test were applied to monitor survival of IgH.TEμ;RBP-Jlox/lox (blue line, n = 9) and IgH.TEμ;RBP-JΔ/Δ mb1-Cre (red, n = 10) mice. Mantel-Cox test: ****P < .0001. (F) Representative flow cytometric profiles of PBLs stained for CD19, B220, and CD5 derived from 6-month-old control IgH.TEμ;RBP-Jlox/lox (left) and RBP-J deficient IgH.TEμ;RBP-JΔ/Δ mb1-Cre animals (right). The CD5 histograms (lower) are gated on CD19+B220+ B cells (dashed line) and CD19+B220− CLL cells (solid line). The far right panel plots the percentages of CLL cells (CD19+CD5+) within PBLs of the respective animal cohorts as indicated. P values were calculated using unpaired Student t test: *P = .0032. (G) RBP-J deletion PCR performed on DNA isolated from sorted CLL cells from moribund IgH.TEμ;RBP-Jlox/lox control and 2 moribund IgH.TEμ;RBP-JΔ/Δmb1-Cre mice as well as from sorted CD19+B220+ B cells from 2 healthy IgH.TEμ;RBP-JΔ/Δ mb1-Cre mice. lox, loxP RBP-J allele; Δ, recombined RBP-J allele.
B cell-specific RBP-J deficiency reduces prevalence of CLL initiation. (A-C) Analysis of BM chimeras: Ten million CD45.2+ T cell–depleted BM cells isolated from IgH.TEμ;RBP-Jlox/lox and IgH.TEμ;RBP-JΔ/Δ mb1-Cre donors were transplanted into lethally irradiated CD45.1+ congenic recipients (n = 9 for IgH.TEμ;RBP-Jlox/lox control and n = 8 for IgH.TEμ;RBPΔ/Δ mb1-Cre experimental chimeras). (A) Relative reconstitution of BM chimeras 1 and 7 months (mos) posttransplantation (ATBM). Percentage of CD45.2+ cells in PBLs of control IgH.TEμ;RBP-Jlox/lox (blue, n = 9) and the RBP-J-deficient IgH.TEμ;RBP-JΔ/Δ mb1-Cre chimeras (red, n = 8) is shown. (B) Percentage of animals developing CLL over time post-ATBM within control IgH.TEμ;RBP-Jlox/lox (blue, n = 9) and IgH.TEμ;RBP-JΔ/Δ mb1-Cre (red, n = 8) chimeras is depicted. A mouse is considered sick when >5% of CLL-like cells (CD19+CD5+) are detected within CD45.2+ PBLs. P values were calculated using paired Student t test: *P = .0212. (C) Representative flow cytometric analysis of PBLs stained for CD19, B220 and CD5 derived from control IgH.TEμ;RBP-Jlox/lox (left) and the RBP-J-deficient IgH.TEμ;RBP-JΔ/Δ mb1-Cre (right) chimeras 10 months posttransplantation. The CD5 histograms (lower) are gated on CD19+B220+ B cells (dashed line) and CD19+B220− CLL cells (solid line). The far right panel plots the percentages of CLL cells (CD19+CD5+) within PBLs of respective BM chimeras 10 months posttransplantation. P values were calculated using unpaired Student t test: *P = .0406. Analysis of aging cohorts composed of 9 IgH.TEμ;RBP-Jlox/lox littermate controls and 10 IgH.TEμ;RBP-JΔ/Δ mb1-Cre mice. Disease progression was followed for 400 days. (D) Percentages of IgH.TEμ;RBP-Jlox/lox (blue, n = 9) and IgH.TEμ;RBP-JΔ/Δ mb1-Cre mice (red, n = 10) developing CLL over time is shown. A mouse was considered sick when >10% of CLL-like cells (CD19+CD5+) were present in total PBLs analyzed by flow cytometry. P values were calculated using paired Student t test: ****P < .0001. (E) The Kaplan-Meier method and log-rank (Mantel-Cox) test were applied to monitor survival of IgH.TEμ;RBP-Jlox/lox (blue line, n = 9) and IgH.TEμ;RBP-JΔ/Δ mb1-Cre (red, n = 10) mice. Mantel-Cox test: ****P < .0001. (F) Representative flow cytometric profiles of PBLs stained for CD19, B220, and CD5 derived from 6-month-old control IgH.TEμ;RBP-Jlox/lox (left) and RBP-J deficient IgH.TEμ;RBP-JΔ/Δ mb1-Cre animals (right). The CD5 histograms (lower) are gated on CD19+B220+ B cells (dashed line) and CD19+B220− CLL cells (solid line). The far right panel plots the percentages of CLL cells (CD19+CD5+) within PBLs of the respective animal cohorts as indicated. P values were calculated using unpaired Student t test: *P = .0032. (G) RBP-J deletion PCR performed on DNA isolated from sorted CLL cells from moribund IgH.TEμ;RBP-Jlox/lox control and 2 moribund IgH.TEμ;RBP-JΔ/Δmb1-Cre mice as well as from sorted CD19+B220+ B cells from 2 healthy IgH.TEμ;RBP-JΔ/Δ mb1-Cre mice. lox, loxP RBP-J allele; Δ, recombined RBP-J allele.
Enhanced Notch signaling accelerates CLL onset and increases disease aggressiveness
To further investigate the potential role of Notch signaling, we performed reciprocal genetic Notch gain-of-function experiments.28 We generated compound animals, IgH.TEμ;RNIClox/+, IgH.TEμ;RNICΔ/+ mb1-Cre, and IgH.TEμ;RNICΔ/+ CD19-Cre.28 Cre-mediated excision of a lox-STOP-lox cassette results in expression of a dominant active form of Notch1 (NIC), detectable by enhanced green fluorescent protein (eGFP) expression, in B-cell progenitors. The effects of Notch gain-of-function on CLL development and disease progression were assessed in BM chimeras (Figure 4A-C) and aging cohorts (Figure 4D-F; supplemental Figure 5). Interestingly, 70% of IgH.TEμ;RNICΔ/+ mb1-Cre BM chimeras were already sick 4 months posttransplantation, whereas none of the IgH.TEμ;RNIClox/+ chimeras showed any signs of disease (Figure 4A-C). Similarly, within the aging cohorts, the frequency of IgH.TEμ;RNICΔ/+ mb1-Cre and IgH.TEμ;RNICΔ/+ CD19-Cre mice developing disease early was increased significantly compared with IgH.TEμ;RNIClox/+ (Figure 4D; supplemental Figure 5A). Analysis of sick mice revealed a more pronounced disease progression characterized by increased percentages of CD19+B220−CD5+ CLL cells in PBL in IgH.TEμ;RNICΔ/+ mb1-Cre and IgH.TEμ;RNICΔ/+ CD19-Cre mice compared with age-matched controls (Figure 4D; supplemental Figure 5). Although hyperactivated Notch in IgH.TEμ mice resulted in increased numbers of mice developing the disease earlier than controls, surprisingly, we did not observe any difference in overall survival (Figure 4D-F; supplemental Figure 5B). Although counterintuitive, it is well-established that forced expression of NIC in B-cell progenitors is detrimental for B-cell development.33 We reasoned that similar overall survival between the different experimental cohorts could be due to the fact that NIC expression may cause an overall reduction in B-cell numbers. Therefore, we analyzed B-cell populations of RNIClox/+ and RNICΔ/+ mb1-Cre mice. mb1-Cre-mediated NIC expression resulted in a 10-fold reduction in total BM cells. Absolute numbers of all B-cell progenitors as defined by Hardy34 were significantly reduced (supplemental Figure 6A-B). Similarly, total splenic B cells were reduced 20-fold in RNICΔ/+ mb1-Cre compared with RNIClox/+ mice. The absolute decrease of splenic follicular B cells was pronounced compared with marginal zone B cells (supplemental Figure 6C-D), known to require Notch signaling for their development35-37 and therefore tolerate higher levels of enforced expression of NIC.
![B cell–specific Notch1 hyperactivation accelerates CLL onset. (A-C) Analysis of Notch gain-of-function BM chimeras. Ten million CD45.2+ T cell–depleted BM cells isolated from IgH.TEμ;RNIClox/+ and IgH.TEμ;RNICΔ/+ mb1-Cre donors were transplanted into lethally irradiated CD45.1+ congenic recipients (n = 5 for IgH.TEμ;RNIClox/+ control and n = 10 for IgH.TEμ;RNICΔ/+ mb1-Cre experimental chimeras). (A) Relative reconstitution of BM chimeras 1 and 7 months (mos) posttransplantation (ATBM) is shown. Percentages of CD45.2+ cells in PBLs of IgH.TEμ;RNIClox/+ controls (blue, n = 5) and IgH.TEμ;RNICΔ/+ mb1-Cre chimeras (red, n = 10) are plotted. (B) Percentages of animals developing CLL over time post-ATBM within the IgH.TEμ;RNIClox/+ (in blue, n = 5) and IgH.TEμ;RNICΔ/+ mb1-Cre (in red, n = 10) cohorts are depicted. A mouse is considered sick when >5% of CLL cells (CD19+CD5+) are detected within CD45.2+ PBLs. P values were calculated using paired Student t test: *P = .0222. (C) Representative flow cytometric analysis of PBLs stained for CD19, B220 and CD5 derived from control IgH.TEμ;RNIClox/+ (left) and IgH.TEμ;RNIClox/+ mb1-Cre (right) chimeras are shown 6 mos posttransplantation. The CD5 and eGFP histograms, reflecting NIC expression (lower) are gated on CD19+B220+ B cells (dashed line) and CD19+B220− CLL cells (solid line). The plot in the top right shows the percentages of CLL cells (CD19+CD5+) within PBLs of respective chimeras as indicated (IgH.TEμ;RNIClox/+ in blue, n = 5; IgH.TEμ;RNICΔ/+ mb1-Cre in red; n = 10). (D-F) Analysis of aging cohorts composed of 10 IgH.TEμ;RNICxΔ/+ mb1-Cre mice and 10 IgH.TEμ;RNIClox/+ littermate controls. Disease progression was followed until animals reached end-stage disease. (D) Percentages of IgH.TEμ;RNICΔ/+ mb1-Cre (red, n = 10) and IgH.TEμ;RNIClox/+ mice (blue, n = 10) developing CLL over time is shown. A mouse was considered sick when >10% of CLL-like cells (CD19+CD5+) were present in total PBLs. P values were calculated using paired Student t test: *P = .0152. (E) The Kaplan-Meier method was applied to monitor survival of IgH.TEμ;RNIClox/+ (in blue, n = 10) and IgH.TEμ;RNICΔ/+ mb1-Cre (in red, n = 10) animals. (F) Representative flow cytometric profiles of PBLs stained for CD19, B220, and CD5 derived from 3-mos-old IgH.TEμ;RNIClox/+ control (left) and IgH.TEμ;RNICΔ/+ mb1-Cre mice (right). The CD5 and eGFP, reflecting NIC expression, histograms (lower) are gated on CD19+B220+ B cells (dashed line) and CD19+B220− CLL cells (solid line). On the far right plot, the percentages of CLL cells (CD19+CD5+) within PBLs derived from corresponding mice as indicated (IgH.TEμ;RNIClox/+ in blue, n = 10 and IgH.TEμ;RNICΔ/+ mb1-Cre in red, n = 10). The Kaplan-Meier method was applied to monitor survival of Rag2−/−γc−/− recipients transplanted with either (G) 10 000 or (H) 1000 sorted CD19+B220− spleen-derived CLL cells isolated from either IgH.TEμ;RosaNICΔ/+ mb1-Cre mice (red line, n = 4 [G]; n = 7 [H]) or from IgH.TEμ;RosaNIClox/+ control animals (blue line n = 5 [G]; n = 7 [H]). CLL cells were sorted and pooled from 3 donors of each genotype with comparable disease stage.](https://ash.silverchair-cdn.com/ash/content_public/journal/blood/137/22/10.1182_blood.2020006701/1/m_bloodbld2020006701f4.png?Expires=1767716707&Signature=qMQS3dp8XcqpIwn6TzFe3hS5ift0rlFuO~eAk32Whl03tXvlvl8VctpsnAHptHewBCyKFvHeey2aj6elAK1zefDKR4mJ95VYK98e7hwY9VELuI~EvoAQrYt8-SdMdD3aIsVQI1DA2PZyAA8Dcu~ayTNU7PcwI8el6bI6ERddhrm~tCyzzMhnhgNEiIBy~97WnIGOR3~aHHOab~MCqp68ejxPcM2lTv4HlZwPcXuaumqLOsdNZ4oi2jV4XbAfhJ9BnD5z1irOk6ZRr991GN2XT22Q5RVVv3jnlaHTq1~7r2qJ9ZoVV7Ge4UTbf0pUSdYgIx~19I9O~~wk2-Kc6ye7tg__&Key-Pair-Id=APKAIE5G5CRDK6RD3PGA)
B cell–specific Notch1 hyperactivation accelerates CLL onset. (A-C) Analysis of Notch gain-of-function BM chimeras. Ten million CD45.2+ T cell–depleted BM cells isolated from IgH.TEμ;RNIClox/+ and IgH.TEμ;RNICΔ/+ mb1-Cre donors were transplanted into lethally irradiated CD45.1+ congenic recipients (n = 5 for IgH.TEμ;RNIClox/+ control and n = 10 for IgH.TEμ;RNICΔ/+ mb1-Cre experimental chimeras). (A) Relative reconstitution of BM chimeras 1 and 7 months (mos) posttransplantation (ATBM) is shown. Percentages of CD45.2+ cells in PBLs of IgH.TEμ;RNIClox/+ controls (blue, n = 5) and IgH.TEμ;RNICΔ/+ mb1-Cre chimeras (red, n = 10) are plotted. (B) Percentages of animals developing CLL over time post-ATBM within the IgH.TEμ;RNIClox/+ (in blue, n = 5) and IgH.TEμ;RNICΔ/+ mb1-Cre (in red, n = 10) cohorts are depicted. A mouse is considered sick when >5% of CLL cells (CD19+CD5+) are detected within CD45.2+ PBLs. P values were calculated using paired Student t test: *P = .0222. (C) Representative flow cytometric analysis of PBLs stained for CD19, B220 and CD5 derived from control IgH.TEμ;RNIClox/+ (left) and IgH.TEμ;RNIClox/+ mb1-Cre (right) chimeras are shown 6 mos posttransplantation. The CD5 and eGFP histograms, reflecting NIC expression (lower) are gated on CD19+B220+ B cells (dashed line) and CD19+B220− CLL cells (solid line). The plot in the top right shows the percentages of CLL cells (CD19+CD5+) within PBLs of respective chimeras as indicated (IgH.TEμ;RNIClox/+ in blue, n = 5; IgH.TEμ;RNICΔ/+ mb1-Cre in red; n = 10). (D-F) Analysis of aging cohorts composed of 10 IgH.TEμ;RNICxΔ/+ mb1-Cre mice and 10 IgH.TEμ;RNIClox/+ littermate controls. Disease progression was followed until animals reached end-stage disease. (D) Percentages of IgH.TEμ;RNICΔ/+ mb1-Cre (red, n = 10) and IgH.TEμ;RNIClox/+ mice (blue, n = 10) developing CLL over time is shown. A mouse was considered sick when >10% of CLL-like cells (CD19+CD5+) were present in total PBLs. P values were calculated using paired Student t test: *P = .0152. (E) The Kaplan-Meier method was applied to monitor survival of IgH.TEμ;RNIClox/+ (in blue, n = 10) and IgH.TEμ;RNICΔ/+ mb1-Cre (in red, n = 10) animals. (F) Representative flow cytometric profiles of PBLs stained for CD19, B220, and CD5 derived from 3-mos-old IgH.TEμ;RNIClox/+ control (left) and IgH.TEμ;RNICΔ/+ mb1-Cre mice (right). The CD5 and eGFP, reflecting NIC expression, histograms (lower) are gated on CD19+B220+ B cells (dashed line) and CD19+B220− CLL cells (solid line). On the far right plot, the percentages of CLL cells (CD19+CD5+) within PBLs derived from corresponding mice as indicated (IgH.TEμ;RNIClox/+ in blue, n = 10 and IgH.TEμ;RNICΔ/+ mb1-Cre in red, n = 10). The Kaplan-Meier method was applied to monitor survival of Rag2−/−γc−/− recipients transplanted with either (G) 10 000 or (H) 1000 sorted CD19+B220− spleen-derived CLL cells isolated from either IgH.TEμ;RosaNICΔ/+ mb1-Cre mice (red line, n = 4 [G]; n = 7 [H]) or from IgH.TEμ;RosaNIClox/+ control animals (blue line n = 5 [G]; n = 7 [H]). CLL cells were sorted and pooled from 3 donors of each genotype with comparable disease stage.
B cell–specific Notch1 hyperactivation accelerates CLL onset. (A-C) Analysis of Notch gain-of-function BM chimeras. Ten million CD45.2+ T cell–depleted BM cells isolated from IgH.TEμ;RNIClox/+ and IgH.TEμ;RNICΔ/+ mb1-Cre donors were transplanted into lethally irradiated CD45.1+ congenic recipients (n = 5 for IgH.TEμ;RNIClox/+ control and n = 10 for IgH.TEμ;RNICΔ/+ mb1-Cre experimental chimeras). (A) Relative reconstitution of BM chimeras 1 and 7 months (mos) posttransplantation (ATBM) is shown. Percentages of CD45.2+ cells in PBLs of IgH.TEμ;RNIClox/+ controls (blue, n = 5) and IgH.TEμ;RNICΔ/+ mb1-Cre chimeras (red, n = 10) are plotted. (B) Percentages of animals developing CLL over time post-ATBM within the IgH.TEμ;RNIClox/+ (in blue, n = 5) and IgH.TEμ;RNICΔ/+ mb1-Cre (in red, n = 10) cohorts are depicted. A mouse is considered sick when >5% of CLL cells (CD19+CD5+) are detected within CD45.2+ PBLs. P values were calculated using paired Student t test: *P = .0222. (C) Representative flow cytometric analysis of PBLs stained for CD19, B220 and CD5 derived from control IgH.TEμ;RNIClox/+ (left) and IgH.TEμ;RNIClox/+ mb1-Cre (right) chimeras are shown 6 mos posttransplantation. The CD5 and eGFP histograms, reflecting NIC expression (lower) are gated on CD19+B220+ B cells (dashed line) and CD19+B220− CLL cells (solid line). The plot in the top right shows the percentages of CLL cells (CD19+CD5+) within PBLs of respective chimeras as indicated (IgH.TEμ;RNIClox/+ in blue, n = 5; IgH.TEμ;RNICΔ/+ mb1-Cre in red; n = 10). (D-F) Analysis of aging cohorts composed of 10 IgH.TEμ;RNICxΔ/+ mb1-Cre mice and 10 IgH.TEμ;RNIClox/+ littermate controls. Disease progression was followed until animals reached end-stage disease. (D) Percentages of IgH.TEμ;RNICΔ/+ mb1-Cre (red, n = 10) and IgH.TEμ;RNIClox/+ mice (blue, n = 10) developing CLL over time is shown. A mouse was considered sick when >10% of CLL-like cells (CD19+CD5+) were present in total PBLs. P values were calculated using paired Student t test: *P = .0152. (E) The Kaplan-Meier method was applied to monitor survival of IgH.TEμ;RNIClox/+ (in blue, n = 10) and IgH.TEμ;RNICΔ/+ mb1-Cre (in red, n = 10) animals. (F) Representative flow cytometric profiles of PBLs stained for CD19, B220, and CD5 derived from 3-mos-old IgH.TEμ;RNIClox/+ control (left) and IgH.TEμ;RNICΔ/+ mb1-Cre mice (right). The CD5 and eGFP, reflecting NIC expression, histograms (lower) are gated on CD19+B220+ B cells (dashed line) and CD19+B220− CLL cells (solid line). On the far right plot, the percentages of CLL cells (CD19+CD5+) within PBLs derived from corresponding mice as indicated (IgH.TEμ;RNIClox/+ in blue, n = 10 and IgH.TEμ;RNICΔ/+ mb1-Cre in red, n = 10). The Kaplan-Meier method was applied to monitor survival of Rag2−/−γc−/− recipients transplanted with either (G) 10 000 or (H) 1000 sorted CD19+B220− spleen-derived CLL cells isolated from either IgH.TEμ;RosaNICΔ/+ mb1-Cre mice (red line, n = 4 [G]; n = 7 [H]) or from IgH.TEμ;RosaNIClox/+ control animals (blue line n = 5 [G]; n = 7 [H]). CLL cells were sorted and pooled from 3 donors of each genotype with comparable disease stage.
Within the CLL mouse model, NIC expression may result in faster development of CLL-like cells but simultaneously render cells more fragile and susceptible to apoptosis. To test this, we analyzed IgH.TEμ;RNIClox/+, IgH.TEμ;RNICΔ/+ mb1-Cre, and IgH.TEμ;RNICΔ/+ CD19-Cre animals bearing CLL-like disease. Indeed, NIC-expressing CLL cells derived from either IgH.TEμ;RNICΔ/+ mb1-Cre or IgH.TEμ;RNICΔ/+ CD19-Cre mice showed two- to threefold increased apoptosis compared with controls (supplemental Figure 6E-G). Although CLL cells can be detected in circulation earlier, it could take more time to accumulate lethal numbers of CLL cells in IgH.TEμ;RNICΔ/+ mb1-Cre or IgH.TEμ;RNICΔ/+ CD19-Cre mice.
To assess aggressiveness of NIC-expressing CLL cells, we transplanted limiting numbers of either 1000 or 10 000 sorted CD19+B220−CD5+ CLL cells from IgH.TEμ;RNIClox/+ or IgH.TEμ;RNICΔ/+ mb1-Cre mice with comparable disease status into Rag2−/−γc−/− mice (Figure 4G-H). Interestingly, recipients receiving NIC-expressing CLL cells died earlier compared with controls. Although not statistically significant, the observation was made with both 1000 and 10 000 transplanted CLL cells. Despite NIC-hyperactivated CLL cells being more fragile, our findings support the hypothesis that enforced Notch signaling accelerates CLL induction and enhances CLL aggressiveness.
Notch hyperactivation promotes cell cycle–associated and E2F target gene expression
We next aimed to identify how enforced Notch signaling in CLL cells induces accelerated or more aggressive disease. First, we performed global gene expression analysis. Unsupervised clustering showed that all NIC-expressing CLL samples clustered well together, independent of whether they were derived from sorted CD19+B220−CD5+ CLL cells of IgH.TEμ;RNIClox/+, IgH.TEμ;RNICΔ/+ mb1-Cre, or IgH.TEμ;RNICΔ/+ CD19-Cre mice (Figure 5A). Using log fold-change of 1 and an adjusted P value < .05, 896 genes were significantly up- and 502 downregulated in NIC-expressing compared with control CLL cells (supplemental Tables 6 and 7). The most significantly upregulated Hallmarks in Notch gain-of-function samples included E2F, G2M checkpoint, Mitotic spindle, and Myc targets, whereas pathways such as tumor necrosis factor-α signaling, interferon-α response, and interleukin-2 Stat5 signaling were among the most significantly downregulated (Figure 5B-C). Interestingly, although Notch, E2F, and Myc target genes are clearly upregulated in our RNA-seq analysis, gene expression of Myc was not significantly upregulated (Figure 5C-D). Next, we validated a panel of Notch and E2F target genes as well as Myc by quantitative reverse transcriptase (qRT) PCR, western blot, and immunohistochemistry (Figure 5E-H). Notch, E2F, and Myc targets were all upregulated either at the transcript or protein level. However, Myc expression was not differentially expressed confirming the initial RNA-seq analysis (Figure 5E,G-H). Because NIC-driven CLL cells were generated in a SV40 large T antigen-driven mouse model, this opens the possibility that overexpression of Notch could influence expression of large T. To exclude this, we performed coculture experiments using an IgH.TEμ-derived CLL cell line (TC67) on DL1-expressing OP9 stroma in the presence or absence of pharmacological Notch inhibition using the γ-secretase inhibitor LY3039478. Although Notch target genes were regulated in a Notch-dependent manner, large T or Myc protein levels were not. Similar results were obtained expressing a γ-secretase sensitive ΔE/NOTCH1 construct in TC67 CLL cells (supplemental Figure 7). Thus, enforced Notch signaling results in upregulation of many genes involved in cell-cycle regulation, proliferation, and Myc target genes without directly regulating Myc or large T expression.
Notch1 hyperactivation induces cell cycle–related gene expression in CLL cells. (A) Sample clustering based on correlation of gene expression (Pearson correlation of 1000 most variable genes) in sorted splenic CLL cells (CD19+B220−) from IgH.TEμ;RNIC lox/+ controls (in blue) or from IgH.TEμ;RNICΔ/+ CD19-Cre and IgH.TEμ;RNICΔ/+ mb1-Cre mice (in red) is illustrated. (B) Pathways from Hallmark collection (MSigDB) significantly induced or repressed (false discovery rate < 0.05) as result of GSEA are shown. Genes are ranked according to differential expression in sorted CLL cells comparing IgH.TEμ;RNICΔ/+ CD19-Cre and IgH.TEμ;RNICΔ/+ mb1-Cre mice to IgH.TEμ;RNIClox/+ mice. P values were obtained by permutation test (n = 100 000) and FDR adjusted.54 (C) Detailed GSEA plots for E2F (left) and MYC target genes (right) from the Hallmark collection are depicted. (D) RNA expression of E2F target genes that are significantly induced (log fold-change > 1 and adjusted P value < .05) in IgH.TEμ;RNICΔ/+ CD19-Cre and IgH.TEμ;RNICΔ/+ mb1-Cre mice compared with IgH.TEμ;RNIClox/+ controls are shown. (E) RNA expression of Notch target genes Hes1, Hey1, Hey2, HeyL, and c-Myc assessed by qRT-PCR and normalized to the expression of Hprt is shown from sorted splenic CLL cells (CD19+B220−) of IgH.TEμ;control (n = 7 composed of n = 3 IgH.TEμmb1-Cre and n = 4 IgH.TEμ;RNIClox/+ mice, blue dots) and of IgH.TEμ;RNIClox/+mb1-Cre mice (n = 6, red squares). P values were calculated using unpaired Student t test: Hes1 P < .0001, Hey1 P = .0126, Hey2 P = .0077, HeyL P = .0075, c-Myc P = .0117. (F) RNA expression of Ccna2, Ccnb2, Ccne2, Cdc6, MCM5, MCM6, MCM7, and Dbf4 assessed by qRT-PCR and normalized to the expression of Hprt is depicted for the same samples used in panel A. P values were calculated using unpaired Student t test: Ccna2 P < .0001, Ccnb2 P = .0002, Ccne2 P = .0042, Cdc6 P = .0066, MCM5 P = .0025, MCM6 P = .0147, MCM7 P = .0093, Dbf4 P = .0003. (G) Protein expression of Cyclin A2, Cyclin E2, and c-Myc assessed by immunoblotting from sorted splenic CLL (CD19+B220−) cells of IgH.TEμ;control (n = 2 IgH.TEμ;RNIClox/+ and n = 2 IgH.TEμmb1-Cre) and IgH.TEμ;RNIClox/+ mb1-Cre mice (n = 4) is shown. (H) Representative immunohistochemical staining for c-Myc of spleen (top) and LN (bottom) sections from 7-month-old WT control, IgH.TEμ, and IgH.TEμ;RNICΔ/+ mb1-Cre mice is shown. Quantification of c-Myc+ stained cells in WT (n = 4), IgH.TEμ (n = 4) and IgH.TEμ;RNICΔ/+ mb1-Cre (n = 3) is depicted on the right.
Notch1 hyperactivation induces cell cycle–related gene expression in CLL cells. (A) Sample clustering based on correlation of gene expression (Pearson correlation of 1000 most variable genes) in sorted splenic CLL cells (CD19+B220−) from IgH.TEμ;RNIC lox/+ controls (in blue) or from IgH.TEμ;RNICΔ/+ CD19-Cre and IgH.TEμ;RNICΔ/+ mb1-Cre mice (in red) is illustrated. (B) Pathways from Hallmark collection (MSigDB) significantly induced or repressed (false discovery rate < 0.05) as result of GSEA are shown. Genes are ranked according to differential expression in sorted CLL cells comparing IgH.TEμ;RNICΔ/+ CD19-Cre and IgH.TEμ;RNICΔ/+ mb1-Cre mice to IgH.TEμ;RNIClox/+ mice. P values were obtained by permutation test (n = 100 000) and FDR adjusted.54 (C) Detailed GSEA plots for E2F (left) and MYC target genes (right) from the Hallmark collection are depicted. (D) RNA expression of E2F target genes that are significantly induced (log fold-change > 1 and adjusted P value < .05) in IgH.TEμ;RNICΔ/+ CD19-Cre and IgH.TEμ;RNICΔ/+ mb1-Cre mice compared with IgH.TEμ;RNIClox/+ controls are shown. (E) RNA expression of Notch target genes Hes1, Hey1, Hey2, HeyL, and c-Myc assessed by qRT-PCR and normalized to the expression of Hprt is shown from sorted splenic CLL cells (CD19+B220−) of IgH.TEμ;control (n = 7 composed of n = 3 IgH.TEμmb1-Cre and n = 4 IgH.TEμ;RNIClox/+ mice, blue dots) and of IgH.TEμ;RNIClox/+mb1-Cre mice (n = 6, red squares). P values were calculated using unpaired Student t test: Hes1 P < .0001, Hey1 P = .0126, Hey2 P = .0077, HeyL P = .0075, c-Myc P = .0117. (F) RNA expression of Ccna2, Ccnb2, Ccne2, Cdc6, MCM5, MCM6, MCM7, and Dbf4 assessed by qRT-PCR and normalized to the expression of Hprt is depicted for the same samples used in panel A. P values were calculated using unpaired Student t test: Ccna2 P < .0001, Ccnb2 P = .0002, Ccne2 P = .0042, Cdc6 P = .0066, MCM5 P = .0025, MCM6 P = .0147, MCM7 P = .0093, Dbf4 P = .0003. (G) Protein expression of Cyclin A2, Cyclin E2, and c-Myc assessed by immunoblotting from sorted splenic CLL (CD19+B220−) cells of IgH.TEμ;control (n = 2 IgH.TEμ;RNIClox/+ and n = 2 IgH.TEμmb1-Cre) and IgH.TEμ;RNIClox/+ mb1-Cre mice (n = 4) is shown. (H) Representative immunohistochemical staining for c-Myc of spleen (top) and LN (bottom) sections from 7-month-old WT control, IgH.TEμ, and IgH.TEμ;RNICΔ/+ mb1-Cre mice is shown. Quantification of c-Myc+ stained cells in WT (n = 4), IgH.TEμ (n = 4) and IgH.TEμ;RNICΔ/+ mb1-Cre (n = 3) is depicted on the right.
Furthermore, several reports suggest that NOTCH1 regulates MYC gene expression at the transcriptional level through a c-Myc superenhancer in multiple B-cell malignancies.38,39 We therefore reanalyzed publicly available datasets (GSE9262639 and GSE2102940 ) of primary human CLL samples and correlated those to MYC messenger RNA expression. Interestingly, we could not find any significant gene expression differences for MYC comparing NOTCH1 mutated (n = 10) vs NOTCH1 WT samples or samples in which NIC1 was detected (n = 21) or highly expressed (n = 10 for BM; n = 9 for lymph nodes [LN]) vs those that were negative for NIC1 (n = 26) or expression was low (n = 9 for BM; n = 8 for LN). Thus, MYC messenger RNA expression seems to be independent of both the NOTCH1 mutational status and presence of detectable NIC1 protein expression levels within the analyzed cohorts (supplemental Figure 8).
Forced Notch signaling mediates increased expression of cell cycle–associated genes through direct and indirect mechanisms promoting proliferation
Next, we performed ATAC-seq and ChIP-seq for RBP-J and H3K27ac, associated with active chromatin, on sorted CLL cells from IgH.TEμ;control, IgH.TEμ;RNICΔ/+ mb1-Cre mice to gain further molecular insight into the impact of forced Notch signaling. Using a false discovery rate (FDR) of 0.05, we identified 3300 differentially accessible ATAC-seq peaks, 2822 RBP-J, and 4982 H3K27ac ChIP-seq peaks in NIC-expressing CLLs (Figure 6A). Although the number of gene-associated peaks for RBP-J is 4.7-fold higher in NIC-expressing CLL cells compared with control, the number of H3K27ac peaks remained comparable. Transcription start site-centered analysis of RBP-J and H3K27ac peaks revealed preferential intra- and intergenetic localization (Figure 6B; supplemental Figure 9A). Global Gene Set Enrichment Analysis (GSEA) identified NIC-dependent ATAC-seq, RBP-J, and H3K27ac ChIP-seq peaks, which regulate expression of proximal genes, from Hallmark sets including Notch signaling, mitotic spindle, and G2M checkpoint. In addition, E2F targets were identified as one of the most significantly associated Hallmark gene sets in H3K27ac ChIP-seq analysis (Figure 6C; supplemental Figure 9B). Increased expression of Notch target genes such as Hes1, Hey1, and HeyL in NIC-expressing CLL cells (Figure 5; supplemental Figure 9C) correlated with increased chromatin accessibility and increased RBP-J and H3K27ac peaks, indicating direct regulation by canonical Notch signaling at the promoter proximal regions (Figure 6D; supplemental Figure 9C). Additional mechanisms that can indirectly regulate these genes can of course not be excluded. Interestingly, the epigenetic changes are much more pronounced for Hey1 and HeyL compared with the well-established Notch target gene Hes1 (Figure 6D), correlating with their gene expression (Figure 5E). Investigation of genes associated with cell cycle revealed both direct and indirect NIC-dependent regulation. The promoter proximal regions of Mybl2 show a moderate increase in RBP-J and H3K27ac peaks compared with control CLL cells (Figure 6D). This correlates with increased gene expression in NIC-expressing CLL cells (supplemental Figure 9D), indicating that this proliferation-associated gene is in part directly regulated through canonical Notch signaling. In contrast, increased chromatin accessibility and activation (H3K27ac) of the promoter region of Ccnb2, with slight reduction in RBP-J binding, point to indirect regulation through forced NIC expression leading to transcriptional activation of gene expression (Figure 6E).
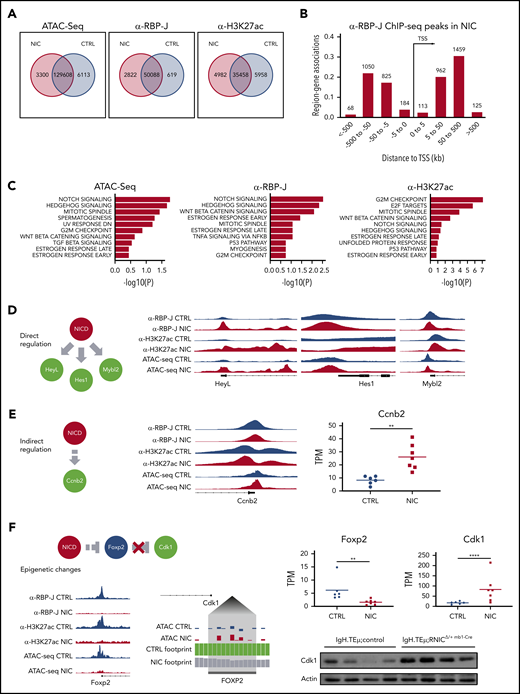
Enforced Notch signaling in CLL cells induces increased expression of cell cycle associated genes through direct and indirect epigenetic mechanisms. Splenic CD19+B220− CLL cells were sorted from 3- to 5-month-old IgH.TEμ;control (CTRL) and IgH.TEμ;RNICΔ/+ mb1-Cre (NIC) stage-matched littermates and analyzed for chromatin accessibility (ATAC-seq) and genome-wide binding of RBP-J and H3K27ac (ChIP-seq). (A) Venn diagram representing regions significantly (false discovery rate < 0.05) changed between CTRL and NIC for peaks called in ATAC-seq (fold > 1 for NIC and > −1 for CTRL), ChIP-seq for α-RBP-J and α-H3K27ac. (B) Binned orientation and distance to a transcription start site (TSS) for peaks called specifically in NIC, but not in CTRL. Distance to TSS is depicted in kilobases (kb). (C) GSEA for top Hallmark gene sets (MSigDB) affected by significant peaks (false discovery rate < 0.05) associated to the most proximal gene specifically in NIC and with regulated expression induced by enhanced Notch signaling (adjusted P value < 0.05). Panels from left to right depict Hallmark gene sets from ATAC-seq analysis, ChIP-seq for RBP-J, and ChIP-seq for H3K27ac. (D) Proposed mechanism of direct regulation by NIC at the proximal promoter regions of HeyL, Hes1, and Mybl2. Right panels represent genomic regions of regulated genes from Integrative Genomics Viewer (version 2.7.2) with peaks called from α-RBP-J ChIP-seq in CTRL and NIC, then α -H3K27ac ChIP-seq and ATAC-seq. Gene structure is shown below the tracks. (E) Proposed mechanism of indirect regulation by NIC at the proximal promoter region of cell-cycle gene Ccnb2 (left). Center panel represents genomic region of regulated gene from IGV with peaks called from α-RBP-J ChIP-seq in CTRL and NIC, then α-H3K27ac ChIP-seq and ATAC-seq. Gene structure is shown below the tracks. Gene expression from RNA-seq analysis represented as transcript per kilobase million (TPM) in CTRL (n = 7) and NIC (n = 6) is shown on the right. P value was calculated using unpaired Student t test: **P < .01. (F) Schematic depicts superphysiological NIC indirectly suppressing Foxp2 promoter by epigenetic mechanisms resulting in loss of Cdk1 repression. Bottom left panel represents IGV tracks of epigenetically regulated Foxp2 promoter, with peaks called in α-RBP-J ChIP-seq, α-H3K27ac ChIP-seq, and ATAC-seq shown for CTRL and NIC. Centered panel depicts a zoomed view of ATAC-seq footprinting analysis (TOBIAS version 11) upstream from Cdk1 promoter (Cdk1 gene structure is schematically indicated on the top left of the zoomed footprint). Tracks at the Foxp2 binding motif show the corrected ATAC-seq signal for CTRL and NIC, translated by TOBIAS into CTRL and NIC footprint score (CTRL bound site with score 1.6, NIC unbound site with score 0.8). Right panels show gene expression from RNA-seq for Foxp2 and Cdk1 expression between CTRL (n = 6) and NIC (n = 7) CLL cells. Total Cdk1 protein level was assessed by western blot analysis on ex vivo CLL cells from IgH.TEμ:control (n = 4) and IgH.TEμ;RNICΔ/+ mb1-Cre (n = 4) mice with antibodies α-Cdk1 (35 kDa) and α-β-Actin (42 kDa). P values were calculated using paired Student t test: **P < .01; ****P < .0001.
Enforced Notch signaling in CLL cells induces increased expression of cell cycle associated genes through direct and indirect epigenetic mechanisms. Splenic CD19+B220− CLL cells were sorted from 3- to 5-month-old IgH.TEμ;control (CTRL) and IgH.TEμ;RNICΔ/+ mb1-Cre (NIC) stage-matched littermates and analyzed for chromatin accessibility (ATAC-seq) and genome-wide binding of RBP-J and H3K27ac (ChIP-seq). (A) Venn diagram representing regions significantly (false discovery rate < 0.05) changed between CTRL and NIC for peaks called in ATAC-seq (fold > 1 for NIC and > −1 for CTRL), ChIP-seq for α-RBP-J and α-H3K27ac. (B) Binned orientation and distance to a transcription start site (TSS) for peaks called specifically in NIC, but not in CTRL. Distance to TSS is depicted in kilobases (kb). (C) GSEA for top Hallmark gene sets (MSigDB) affected by significant peaks (false discovery rate < 0.05) associated to the most proximal gene specifically in NIC and with regulated expression induced by enhanced Notch signaling (adjusted P value < 0.05). Panels from left to right depict Hallmark gene sets from ATAC-seq analysis, ChIP-seq for RBP-J, and ChIP-seq for H3K27ac. (D) Proposed mechanism of direct regulation by NIC at the proximal promoter regions of HeyL, Hes1, and Mybl2. Right panels represent genomic regions of regulated genes from Integrative Genomics Viewer (version 2.7.2) with peaks called from α-RBP-J ChIP-seq in CTRL and NIC, then α -H3K27ac ChIP-seq and ATAC-seq. Gene structure is shown below the tracks. (E) Proposed mechanism of indirect regulation by NIC at the proximal promoter region of cell-cycle gene Ccnb2 (left). Center panel represents genomic region of regulated gene from IGV with peaks called from α-RBP-J ChIP-seq in CTRL and NIC, then α-H3K27ac ChIP-seq and ATAC-seq. Gene structure is shown below the tracks. Gene expression from RNA-seq analysis represented as transcript per kilobase million (TPM) in CTRL (n = 7) and NIC (n = 6) is shown on the right. P value was calculated using unpaired Student t test: **P < .01. (F) Schematic depicts superphysiological NIC indirectly suppressing Foxp2 promoter by epigenetic mechanisms resulting in loss of Cdk1 repression. Bottom left panel represents IGV tracks of epigenetically regulated Foxp2 promoter, with peaks called in α-RBP-J ChIP-seq, α-H3K27ac ChIP-seq, and ATAC-seq shown for CTRL and NIC. Centered panel depicts a zoomed view of ATAC-seq footprinting analysis (TOBIAS version 11) upstream from Cdk1 promoter (Cdk1 gene structure is schematically indicated on the top left of the zoomed footprint). Tracks at the Foxp2 binding motif show the corrected ATAC-seq signal for CTRL and NIC, translated by TOBIAS into CTRL and NIC footprint score (CTRL bound site with score 1.6, NIC unbound site with score 0.8). Right panels show gene expression from RNA-seq for Foxp2 and Cdk1 expression between CTRL (n = 6) and NIC (n = 7) CLL cells. Total Cdk1 protein level was assessed by western blot analysis on ex vivo CLL cells from IgH.TEμ:control (n = 4) and IgH.TEμ;RNICΔ/+ mb1-Cre (n = 4) mice with antibodies α-Cdk1 (35 kDa) and α-β-Actin (42 kDa). P values were calculated using paired Student t test: **P < .01; ****P < .0001.
Genome-wide ATAC-seq analysis enabled us to identify a potential indirect regulation of Cdk1 by Notch via the transcriptional repressor FoxP2. Overexpression of NIC in the CLL context epigenetically suppresses the expression of Foxp2 (Figure 6F), revealing loss of chromatin accessibility together with loss of H3K27ac marks at the promoter. This in turn exposed the loss of a FoxP2 ATAC-seq footprint within the Cdk1 promoter in NIC-expressing CLL cells still visible in CLL cells. We correlated this with reduction in Foxp2 transcripts (3.9-fold) and concomitant increase in Cdk1 transcripts (4.7-fold). The repressive role of Notch on the Foxp2 promoter and thus the de-repression of Cdk1 could contribute to an overall increase of Cdk1 protein in NIC-expressing CLL cells (Figure 6F) and thereby to enhanced proliferation.
To assess increased proliferation in vivo, we evaluated NIC-expressing vs control CLL cells. We performed in vivo 5-bromo-2′-deoxyuridine (BrdU)-labeling experiments comparing CLL bearing IgH.TEμ, IgH.TEμ;RNICΔ/+ mb1-Cre, and IgH.TEμ;RNICΔ/+ CD19-Cre mice. Indeed, the relative number of CLL cells in S-phase derived from IgH.TEμ;RNICΔ/+ mb1-Cre and IgH.TEμ;RNICΔ/+ CD19-Cre mice was increased three- and twofold, respectively, compared with controls (Figure 7A-D). In addition, using p-histone H3 immunostaining to identify cycling M-phase CLL-like cells derived from spleen and LN of WT, IgH.TEμ, and IgH.TEμ;RNICΔ/+ mb1-Cre mice further confirmed this observation. These results suggest that NIC-mediated promotion of proliferation is regulated by epigenetic control of cell cycle–related genes.
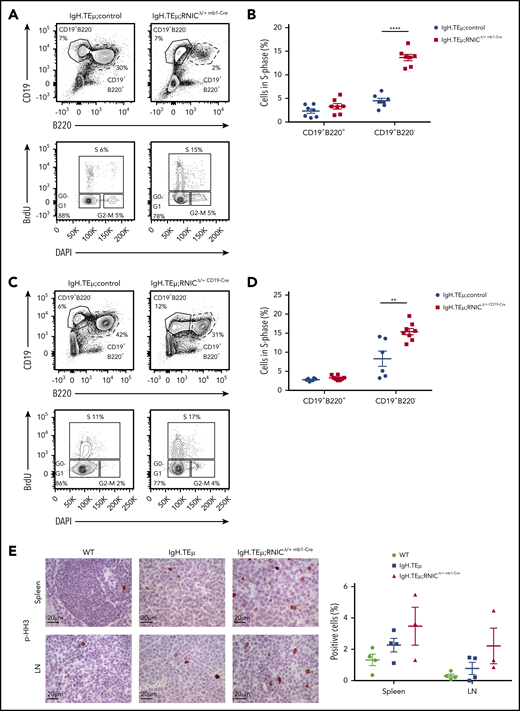
Notch1 hyperactivation promotes proliferation of CLL cells. (A) Representative flow cytometric profiles are shown of a BrdU incorporation assay performed on splenocytes isolated from IgH.TEμ;control and IgH.TEμ;RNICΔ/+ mb1-Cre mice. BrdU was injected intraperitoneally 48 hours before analysis. Upper contour plots show CD19 vs B220 expression gated on live cells. Lower panels depict BrdU vs DAPI expression gated on CD19+B220− cells from the upper panels. S, S-phase; G0-G1, G0- or G1-phase; G2-M, G2- or M-phase. (B) Quantification of relative percentages of CLL cells (CD19+B220−) and B cells (CD19+B220+) in S-phase isolated from IgH.TEμ;control (IgH.TEμ;RNIClox/+ n = 4 and IgH.TEμmb1-Cre n = 3; pooled n = 7, blue circles) and IgH.TEμ;RNICΔ/+ mb1-Cre mice (n = 7, red filled squares) are plotted. The graph represents data pooled from 2 independent experiments. P values were calculated using unpaired Student t test: ****P < .0001. (C) Representative flow cytometric profiles of a BrdU incorporation assay performed on splenocytes isolated from IgH.TEμ;control (IgH.TEμ;RNIClox/+ n = 4 and IgH.TEμCD19-Cre n = 2, pooled) and IgH.TEμ;RNICΔ/+ CD19-Cre mice (n = 8) are shown. BrdU was injected intraperitoneally 48 hours prior to analysis. Upper panels show CD19 vs B220 expression gated on live cells. Lower panels depict BrdU vs DAPI expression gated on CD19+B220− cells from the upper panels. (D) Relative percentages of CLL cells (CD19+B220−) and B cells (CD19+B220+) in S-phase from the IgH.TEμ;controls (n = 6, blue filled circles) and IgH.TEμ;RNICΔ/+ mb1-Cre mice (n = 8, red filled squares) are plotted. The graph represents data pooled from 2 independent experiments. P values were calculated using unpaired Student t test: **P = .0036. (E) Representative immunohistochemical staining for p-histone H3 (p-HH3) of spleen (top) and LN (bottom) sections from 7-month-old WT control, IgH.TEμ, and IgH.TEμ;RNICΔ/+ mb1-Cre mice is shown. Quantification of p-HH3+ stained cells in WT (n = 4), IgH.TEμ (n = 4), and IgH.TEμ;RNICΔ/+ mb1-Cre (n = 3) is depicted on the right.
Notch1 hyperactivation promotes proliferation of CLL cells. (A) Representative flow cytometric profiles are shown of a BrdU incorporation assay performed on splenocytes isolated from IgH.TEμ;control and IgH.TEμ;RNICΔ/+ mb1-Cre mice. BrdU was injected intraperitoneally 48 hours before analysis. Upper contour plots show CD19 vs B220 expression gated on live cells. Lower panels depict BrdU vs DAPI expression gated on CD19+B220− cells from the upper panels. S, S-phase; G0-G1, G0- or G1-phase; G2-M, G2- or M-phase. (B) Quantification of relative percentages of CLL cells (CD19+B220−) and B cells (CD19+B220+) in S-phase isolated from IgH.TEμ;control (IgH.TEμ;RNIClox/+ n = 4 and IgH.TEμmb1-Cre n = 3; pooled n = 7, blue circles) and IgH.TEμ;RNICΔ/+ mb1-Cre mice (n = 7, red filled squares) are plotted. The graph represents data pooled from 2 independent experiments. P values were calculated using unpaired Student t test: ****P < .0001. (C) Representative flow cytometric profiles of a BrdU incorporation assay performed on splenocytes isolated from IgH.TEμ;control (IgH.TEμ;RNIClox/+ n = 4 and IgH.TEμCD19-Cre n = 2, pooled) and IgH.TEμ;RNICΔ/+ CD19-Cre mice (n = 8) are shown. BrdU was injected intraperitoneally 48 hours prior to analysis. Upper panels show CD19 vs B220 expression gated on live cells. Lower panels depict BrdU vs DAPI expression gated on CD19+B220− cells from the upper panels. (D) Relative percentages of CLL cells (CD19+B220−) and B cells (CD19+B220+) in S-phase from the IgH.TEμ;controls (n = 6, blue filled circles) and IgH.TEμ;RNICΔ/+ mb1-Cre mice (n = 8, red filled squares) are plotted. The graph represents data pooled from 2 independent experiments. P values were calculated using unpaired Student t test: **P = .0036. (E) Representative immunohistochemical staining for p-histone H3 (p-HH3) of spleen (top) and LN (bottom) sections from 7-month-old WT control, IgH.TEμ, and IgH.TEμ;RNICΔ/+ mb1-Cre mice is shown. Quantification of p-HH3+ stained cells in WT (n = 4), IgH.TEμ (n = 4), and IgH.TEμ;RNICΔ/+ mb1-Cre (n = 3) is depicted on the right.
Discussion
NOTCH1 gain-of-function mutations are among the most frequent single-gene alterations in CLL patients. They are associated with poor prognosis, worse outcome, and reduced probability of treatment-free and overall survival.15,17-19 These correlations suggest that NOTCH mutations are likely to be acquired during and propel disease progression. Multiple mechanisms explaining how aberrant NOTCH1 signaling may protect survival of CLL cells have been suggested. These include increased survival through sustained expression of the anti-apoptotic protein MCL1 and activity of eIF4E.41 Moreover, cross talk with nuclear factor-κB (NF-κB) signaling directly regulating expression of antiapoptotic genes and the surface molecule CD49d facilitating interactions with the microenvironment has been shown.42 Other reports suggest that a NOTCH-MYC axis promotes cell growth and proliferation in part through upregulating genes involved in ribosome biogenesis and through supporting a glycolytic switch.38,43,44 Finally, a reciprocal cross talk between B-cell receptor (BCR) signaling and NOTCH1 has been proposed, where NOTCH1 activation enhances BCR signaling responses.39,45,46 All these mechanisms were established with primary CLL samples and/or Epstein-Barr virus-transformed CLL-like cell lines. The limitations working with primary CLL samples in vitro lie in their restricted long-term culture properties and that Notch signaling components are downregulated as soon as they are grown ex vivo.
We thus opted to assess the effects of Notch signaling in the IgH.TEμ CLL model,26 recapitulating many aspects of the human pathology. Importantly, these CLL cells express Notch1 and Notch2 and, interestingly, Notch1 surface expression is significantly increased compared with physiological (CD19+B220+CD5−) B cells (Figure 2). Whether increased surface expression of Notch1 is due to a cross talk with BCR signaling45 is currently unknown. Nevertheless, this implies that increased Notch1 expression might be of functional relevance during the transformation process and disease progression. This is supported through our genetic Notch loss-of-function results, in which inactivated RBP-J. IgH.TEμ RBP-JΔ/Δ Mx1-Cre chimeras did not and IgH.TEμ RBP-JΔ/Δ mb1-Cre chimeras, only in 1 case, succumbed to CLL, whereas all controls developed disease. In IgH.TEμ RBP-JΔ/Δ mb1-Cre and IgH.TEμ RBP-JΔ/Δ CD-19-Cre aging cohorts, 70% of mice remained disease free within the investigated time frame (Figure 3; supplemental Figure 4). Thirty percent of mice developed disease with complete RBP-J inactivation, indicating that RBP-J-mediated signaling is not essential for disease induction, but its presence seems important to facilitate disease development.
The identification of Notch-activating mutations in B-cell malignancies including CLL was counterintuitive because of earlier studies showing that overexpression of NIC antagonizes B-cell development in the BM33 and induces growth arrest and apoptosis in both murine and human B-cell lines as well as multiple B-cell neoplasms.47 Our results, however, confirm these studies because Notch hyperactivation in RNICΔ/+ mb1-Cre mice indeed interfered with B-cell development, causing an immense loss of B cells in BM and spleen (supplemental Figure 6). Although NIC expression interferes with early B-cell development and may render NIC-expressing CLL cells more fragile, the percentage of IgH.TEμ;RNICΔ/+ mb1-Cre and IgH.TEμ;RNICΔ/+ CD19-Cre mice developing CLL early was increased compared with controls indicating that NIC promotes disease onset (Figure 4; supplemental Figure 5).
It is possible that murine CLL cells only tolerate a certain level of Notch hyperactivation and in our genetic mouse model the amount of NIC expression might be too high to cause increased proliferation without concomitant apoptosis induction. Fundamentally, it is interesting to note that mutations within the NOTCH1 gene in CLL and other B-cell neoplasms have been found to cluster predominantly to the PEST sequence, whereas in T-cell acute lymphoblastic leukemia mutations are found in both the HD domain as well as in the PEST domain.14,16,17,48 This has largely been interpreted that transformed B cells are not subjected to the selective pressure to acquire mutations that render them receptor ligand independent. They receive ligand-mediated signals naturally via cells located in secondary lymphoid organs. An alternative interpretation is that transformed B cells are selectively pressured not to acquire HD domain mutations because this would cause ligand-independent and possible superphysiological levels of Notch signaling being detrimental for B-cell malignancies.
Because RBP-J inactivation or NIC expression was targeted to HSCs or early B-cell progenitors, our findings indicate that absence or presence of canonical Notch signaling influence CLL disease onset. Although NOTCH1 mutations in CLL patients can certainly be acquired during disease progression, more recent reports applying deep sequencing technologies identified the presence of subclonal NOTCH1 mutations in CD34+CD38− HSCs derived from NOTCH1-mutated CLL patients.49-51 It was therefore suggested that CLL develops from preleukemic multipotent hematopoietic progenitors carrying somatic NOTCH1 mutations, which either facilitates disease onset or tumor cell expansion at different stages of B-cell differentiation. Our Notch loss- and gain-of-function results are in line with and support this interpretation.
To determine how enforced Notch signaling in CLL cells might cause faster onset or more aggressive disease, we performed global gene expression analysis combined with ATAC-seq and ChIP-seq analysis for RBP-J and H3K27ac. The most significantly upregulated genes in Notch gain-of-function samples were associated with pathways of Hallmark gene sets including E2F-targets, G2M-checkpoint, Mitotic spindle, and Myc-targets. This indicates that forced Notch signaling enhances proliferation of CLL cells. This was confirmed in vivo using BrdU incorporation assays revealing a two- to threefold increase in NIC-expressing CLL cells in S phase, as well as by the M phase–specific p-histone H3 staining on spleen and LN sections of the CLL Notch gain-of-function animals showing a similar trend (Figure 7). Although the upregulation of E2F and Myc target genes in NIC-expressing murine CLL, cells would have been compatible with Notch regulating c-Myc expression, we did not observe differential expression of c-Myc at the protein, RNA, or chromatin level. In contrast, chromatin accessibility studies combined with ChIP-seq analysis for RBP-J and H3K27ac indicate that increased expression of cell-cycle and proliferation-associated genes can be either regulated directly through canonical Notch signaling at their corresponding promoters or indirectly. Our data are in agreement with NIC driving proliferation of murine CLL cells through multiple mechanisms and genes, and not necessarily through 1 major oncogenic driver such as c-Myc in T-cell acute lymphoblastic leukemia.52,53
The publication costs of this article were defrayed in part by page charge payment. Therefore, and solely to indicate this fact, this article is hereby marked “advertisement” in accordance with 18 USC section 1734.
Additional information about data sets not publicly available can be obtained from freddy.radtke@epfl.ch.
The online version of this article contains a data supplement.
Acknowledgments
The authors acknowledge Frédéric Freundler, Christelle Dubey, Pasqualina Magliano, and Joao Lourenco for technical assistance; the UNIL and EPFL Flow Cytometry Core Facilities for cell sorting and the EPFL Gene Expression Core Facility for library preparation, sequencing, and technical analysis; the staff from the EPFL Histology core facility, in particular Agnès Hautier, Nathalie Müller, and Gian-Filippo Mancini, for their expert technical assistance; the staff from the EPFL Bio Imaging and Optics Core Facility, in particular Romain Guiet and Olivier Burri, for their expert technical assistance; and Marjolein de Bruijn (Erasmus MC, Rotterdam, The Netherlands) who has been crucial in maintaining, genotyping, and backcrossing the IgH.TEμ mouse line in its originating facility.
This work was in part supported by the Swiss National Science Foundation and the Swiss Cancer League (F.R.).
Authorship
Contribution: D.T. and M.A. performed experiments, analyzed data, and wrote the manuscript; N.Z. analyzed data; M.N. and J.S.-D. performed experiments; R.H. provided the IgH.TEμ CLL mouse model; U.K. performed experiments, analyzed data, and wrote the manuscript; and F.R. conceived the study, analyzed data, and wrote the manuscript.
Conflict-of-interest disclosure: The authors declare no competing financial interests.
Correspondence: Freddy Radtke, Ecole Polytechnique Fédérale de Lausanne (EPFL), Swiss Institute for Experimental Cancer Research (ISREC), Station 19, CH-1015 Lausanne, Switzerland; e-mail: freddy.radtke@epfl.ch; or Ute Koch, Ecole Polytechnique Fédérale de Lausanne (EPFL), Swiss Institute for Experimental Cancer Research (ISREC), Station 19, CH-1015 Lausanne, Switzerland; e-mail: ute.koch@epfl.ch.

This feature is available to Subscribers Only
Sign In or Create an Account Close Modal