

Key Points
TLR9 expression and its agonist, cell-free DNA, correlate with increased migration and poor prognosis in CLL.
Dual targeting of TLR9 and BTK synergistically inhibits CLL cell migration and blocks p65 NF-κB and pSTAT3 activation.

Abstract
Chronic lymphocytic leukemia (CLL) remains incurable despite B-cell receptor–targeted inhibitors revolutionizing treatment. This suggests that other signaling molecules are involved in disease escape mechanisms and resistance. Toll-like receptor 9 (TLR9) is a promising candidate that is activated by unmethylated cytosine guanine dinucleotide–DNA. Here, we show that plasma from patients with CLL contains significantly more unmethylated DNA than plasma from healthy control subjects (P < .0001) and that cell-free DNA levels correlate with the prognostic markers CD38, β2-microglobulin, and lymphocyte doubling time. Furthermore, elevated cell-free DNA was associated with shorter time to first treatment (hazard ratio, 4.0; P = .003). We also show that TLR9 expression was associated with in vitro CLL cell migration (P < .001), and intracellular endosomal TLR9 strongly correlated with aberrant surface expression (sTLR9; r = 0.9). In addition, lymph node–derived CLL cells exhibited increased sTLR9 (P = .016), and RNA-sequencing of paired sTLR9hi and sTLR9lo CLL cells revealed differential transcription of genes involved in TLR signaling, adhesion, motility, and inflammation in sTLR9hi cells. Mechanistically, a TLR9 agonist, ODN2006, promoted CLL cell migration (P < .001) that was mediated by p65 NF-κB and STAT3 transcription factor activation. Importantly, autologous plasma induced the same effects, which were reversed by a TLR9 antagonist. Furthermore, high TLR9 expression promoted engraftment and rapid disease progression in a NOD/Shi-scid/IL-2Rγnull mouse xenograft model. Finally, we showed that dual targeting of TLR9 and Bruton’s tyrosine kinase (BTK) was strongly synergistic (median combination index, 0.2 at half maximal effective dose), which highlights the distinct role for TLR9 signaling in CLL and the potential for combined targeting of TLR9 and BTK as a more effective treatment strategy in this incurable disease.
Introduction
Chronic lymphocytic leukemia (CLL) is a common B-cell malignancy with a remarkably diverse clinical course. It is characterized by the accumulation of mature B-lymphocytes in the peripheral blood (PB), bone marrow, and secondary lymphoid organs such as the lymph nodes (LNs). Until recently, therapeutic options for patients with CLL were limited and poorly tolerated, but the introduction of Bruton’s tyrosine kinase (BTK) inhibitors1 and drugs targeting phosphoinositide kinases (PI3Ks)2 and Bcl-23 have revolutionized treatment. However, these agents are not curative, and some patients have short-term responses, develop resistance, or have to stop treatment because of side effects.4
CLL has been described as a 2-compartment disease because LN and PB CLL cells express distinct phenotypic and transcriptional features.5,6 PB CLL cells are largely quiescent,7 whereas in the LN microenvironment, disease-promoting interactions occur.5,6 It seems that the pathology of CLL is influenced by the ability of tumor cells to traffic between these 2 compartments,8 and recent LN emigrants can be identified by a CXCR4dimCD5bright phenotype.9 An important goal of CLL therapy is to eradicate tissue-resident CLL cells; “trapping” them in the PB deprives them of the proliferation and survival signals afforded by protective microenvironmental niches.10 Indeed, BTK and PI3Kδ inhibitors cause tumor cell tissue redistribution,11-13 but heterogeneity in responses and lack of curative effect indicate that inhibition of these individual kinases alone is not sufficient to eliminate disease. The identification of novel targets and therapeutic combinations is therefore crucial for future cures; one such potential target is Toll-like receptor 9 (TLR9).
The TLR family of pattern recognition receptors is an integral component of the innate immune system and important mediators of the adaptive immune response. After B-cell receptor (BCR) activation and costimulatory T-cell interactions, TLR signaling has been coined the third essential B-cell activation signal following recognition of unmethylated cytosine guanine dinucleotide (CpG)-DNA.14,15 Each TLR exhibits unique ligand specificity, but most signal via the myeloid differentiation primary response 88 (MyD88) adaptor protein and interleukin-1 receptor kinase family (IRAK1/2/4). This culminates in the activation of the transcription factors NF-κB16 and signal transducer and activator of transcription 3 (STAT3),17 which in turn induce a pro-inflammatory immune response and cellular expansion.
Activating mutations in MYD88 occur in ∼3% of patients with CLL,18 and TLR signaling has been associated with CLL cell proliferation, survival, immunogenicity, and resistance to chemotherapy.7,19-23 Murine knockout experiments of the TLR decoy and inhibitory receptor (TIR8) showed an increased rate of CLL cell accumulation within the secondary lymphoid tissues,24 and targeting IRAK4, a downstream target of MyD88, delayed CLL tumor development.25 In contrast, Wang et al26 showed that inhibition of TLR9 had a growth-promoting effect on splenic B cells in vivo on an MyD88 mutant background. These different findings support the rationale for further investigation of TLR9 signaling in CLL.
TLR9 is known to play a role in tumor cell trafficking, as evidenced by its association with metastasis in solid tumors.27 Furthermore, CLL cells exhibit higher levels of endosomal TLR9 (eTLR9) compared with healthy B cells,28 and several studies have shown that CpG-DNA can activate primary CLL cells.7,21-23 It is noteworthy that the phenotype of TLR9-stimulated healthy B cells is similar to that of CLL cells29 ; increased expression of CD5, CD23, CD25, and the T-cell–associated ZAP70 kinase, which is characteristically expressed in poor prognosis disease. Wagner et al30 suggested that, in addition to BCR-independent effects, TLR9 signaling integrates into the adaptive immune response in ZAP70-positive CLL. All of these findings implicate TLR9 signaling in the pathology of CLL.
The aims of this study were threefold. First was to investigate the role of TLR9 stimulation in the activation and migration of CLL cells and whether patient plasma contains levels of unmethylated cell-free DNA (cfDNA), which could trigger this. Second, as aberrant surface expression of TLR9 has been shown in some poor prognosis solid tumors,25 we investigated the expression and function of surface TLR9 (sTLR9) in CLL. Finally, we explored whether dual targeting of BTK and TLR9 has the potential to eliminate CLL cell trafficking and induce more sustained clinical responses.
Materials and methods
More detailed methods are provided in the supplemental Materials and methods (available on the Blood Web site).
Patient samples
PB samples were obtained from CLL patients with informed consent in accordance with the Declaration of Helsinki. Matched LN fine needle aspirate sampling was undertaken simultaneously on patients with a palpable lymphadenopathy as previously described.6
Plasma cfDNA quantification
Plasma cfDNA quantification was performed by using real-time polymerase chain reaction to amplify the CCR5 gene and determining the cycle threshold (Ct) value. An assay to detect unmethylated mitochondrial DNA (mtDNA) was designed, based on digesting DNA with the FspEI restriction endonuclease.
TLR9 activation and inhibition of CLL cells
CLL PB mononuclear cells (PBMCs) were seeded at 3 × 10⁵ cells/150 μL of complete media (RPMI, 10% fetal calf serum, penicillin/streptomycin, l-glutamine [Sigma-Aldrich], and 5 μg/mL interleukin-4 [RayBiotech]). Cells were cultured ±1 μM ODN2006 (TLR9 agonist; InvivoGen) or 20 μL autologous plasma in duplicate and incubated for 24 hours (or 4 hours for phospho-STAT3/5 [p-STAT3/5] and phospho-p65 [p-p65] NF-κB) at 37°C/5% carbon dioxide. For the TLR9 blocking experiments, CLL cells were preincubated for 30 minutes with the TLR9 antagonist (5 μM ODN INH-18 [InvivoGen] or anti-TLR9 [eB72-1665; eBioscience]) at 5 μM/106 PBMCs. For synergy, 2 μM ODN INH-18 and 1 μM ibrutinib (Selleck Chemicals) were used. Cells were harvested for migration or phenotyping assays as described in the following 2 sections.
Surface and intracellular immunophenotyping
Cells were labeled as described in the supplemental Materials and methods using antibody panels detailed in supplemental Table 1.
Transwell migration assays
Transwell migration assays were performed by using 5-μm pore polycarbonate transwell inserts in 24-well plates. A total of 600 μL complete media + 100 ng/mL CXCL12 (BioLegend) were added to the basolateral chambers, and PBMCs were then transferred into the apical chambers and incubated for 4 hours at 37°C/5% carbon dioxide. Migrated and nonmigrated CLL cells were identified by CD19+CD5+ labeling and counted by using a BD Accuri flow cytometer.
Circulation system
A hollow fiber bioreactor system (FiberCell Systems, Inc) was previously adapted by our group to generate an in vitro model of circulating CLL.6,8 PB-CLL cells were introduced into the model through the access ports in the circulating compartment and were allowed to circulate for 48 hours before samples were removed from port D (circulating) and port C (migrated). CLL cells were immunophenotyped as described in the "Surface and intracellular immunophenotyping" section.
Cell sorting and RNA-sequencing analysis
PBMCs from 5 patients with CLL were antibody labeled (supplemental Table 1). Viable, single CLL cells were identified by CD19+CD5+ labeling, and both sTLR9hi and sTLR9lo populations were sorted by using a BD FACSMelody. RNA was extracted by using the RNeasy Micro Kit (Qiagen) as per the manufacturer’s instructions and immediately frozen at −80°C. mRNA TruSeq library generation and sequencing were performed by Qiagen.
Quantitative polymerase chain reaction of TLR9
For quantitative polymerase chain reaction, the TLR9 (Hs00370913_s1) and β-actin (Hs99999903_m1) TaqMan (Applied Biosystems) gene expression assays were used.
Xenotransplantation
CLL cells from 7 different patients were xenotransplanted into NOD/Shi-scid/IL-2Rγnull mice as previously described.31-33 Details are given in the supplemental Materials and methods.
Statistical analysis
Statistical analyses were performed by using GraphPad Prism 7.0 (GraphPad Software). Data were assessed for normality, and the appropriate descriptive statistics and tests were used. Unless otherwise stated, results are presented as mean ± standard deviation, paired Student t test, or Wilcoxon matched-pairs signed-rank, and Pearson’s or Spearman correlation coefficient depending on whether the data were Gaussian.
Results
Levels of cfDNA correlate with CD38, B2M, lymphocyte doubling time, and time to first treatment
We initially investigated whether plasma from patients with CLL contains cfDNA that could potentially trigger TLR9 signaling and, if so, whether these levels correlated with established prognostic markers. To test this theory, we measured the cfDNA levels in plasma from 37 patients for whom prognostic data were available. cfDNA levels varied between patient samples but showed a positive correlation with CD38 expression (r = 0.67; P < .001) (Figure 1A). In addition, patients with a lymphocyte doubling time (LDT) <12 months had a mean 8-fold higher cfDNA than those with longer LDT (P = .030) (Figure 1B), and those with β2-microglobulin (B2M) >3.5 mg/L had a mean 3.5-fold higher cfDNA than those with B2M <3.5 mg/L (P = .002) (supplemental Figure 2A). There was a trend for raised cfDNA in immunoglobulin heavy chain variable region (IGHV) unmutated cases (poor prognosis) compared with mutated cases (P = .080) (supplemental Figure 2B) but no difference between ZAP70-positive and ZAP70-negative cases (supplemental Figure 2C). Notably, it was dynamic prognostic markers such as CD3834 and LDT that exhibited the strongest relationship with cfDNA levels. It is therefore possible that high leukemic burden generates raised cfDNA, which in turn induces CLL proliferation via an autostimulation loop. In support of this, we found a positive correlation between cfDNA and white blood cell count (r = 0.71; P < .0001) (Figure 1C) and a strong association between raised cfDNA and a shorter time to first treatment (hazard ratio, 4.0; P = .003) (Figure 1D).
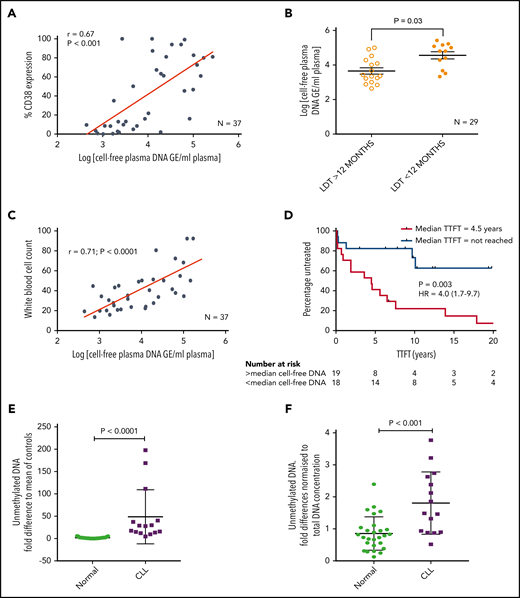
Patients with CLL have raised levels of both total and unmethylated cfDNA, which correlate with high CD38, short LDT, high leukemic burden, and reduced time to first treatment (TTFT). Levels of cfDNA were measured in the plasma of 37 patients with a confirmed diagnosis of CLL. (A) There was a positive correlation between the levels of cfDNA and percent CD38+ CLL cells. (B) Using a cutoff of 12 months, patients with an LDT <12 months had higher plasma cfDNA than those with an LDT >12 months. (C) There was also a strong positive correlation between the levels of cfDNA and leukemic burden (white blood cell count × 109/L). (D) Patients were segregated into high (red) or low (blue) plasma DNA depending on whether their levels were higher or lower than the median. Those with higher levels of plasma cfDNA had a much shorter TTFT. (E) Unmethylated DNA was quantified in the plasma of patients with CLL (n = 15) and healthy age-matched control subjects (n = 27) and presented here as the fold difference compared with the mean of the control subjects. Patients with CLL had a mean 28.1-fold higher unmethylated DNA. (F) The fold difference in unmethylated DNA was normalized to the total DNA concentration and was still 2.1-fold higher in plasma of patients with CLL compared with that from healthy control subjects. GE, genome equivalents; HR, hazard ratio.
Patients with CLL have raised levels of both total and unmethylated cfDNA, which correlate with high CD38, short LDT, high leukemic burden, and reduced time to first treatment (TTFT). Levels of cfDNA were measured in the plasma of 37 patients with a confirmed diagnosis of CLL. (A) There was a positive correlation between the levels of cfDNA and percent CD38+ CLL cells. (B) Using a cutoff of 12 months, patients with an LDT <12 months had higher plasma cfDNA than those with an LDT >12 months. (C) There was also a strong positive correlation between the levels of cfDNA and leukemic burden (white blood cell count × 109/L). (D) Patients were segregated into high (red) or low (blue) plasma DNA depending on whether their levels were higher or lower than the median. Those with higher levels of plasma cfDNA had a much shorter TTFT. (E) Unmethylated DNA was quantified in the plasma of patients with CLL (n = 15) and healthy age-matched control subjects (n = 27) and presented here as the fold difference compared with the mean of the control subjects. Patients with CLL had a mean 28.1-fold higher unmethylated DNA. (F) The fold difference in unmethylated DNA was normalized to the total DNA concentration and was still 2.1-fold higher in plasma of patients with CLL compared with that from healthy control subjects. GE, genome equivalents; HR, hazard ratio.
Because only unmethylated DNA, present in eukaryotic cell mitochondria (mtDNA), can trigger TLR9 signaling, we quantified this in the plasma of patients with CLL and age-matched healthy control subjects. Total mtDNA was 12.9-fold higher in plasma from patients with CLL (P = .001) (supplemental Figure 2D), and unmethylated mtDNA was 28.1-fold higher (P < .0001) (Figure 1E). Even when normalized to total mtDNA, the unmethylated mtDNA was 2.1-fold greater in CLL plasma (P < .001) (Figure 1F). It is well established that CLL cells proliferate when stimulated through their TLRs, but this is the first time, to the best of our knowledge, that a link between clinical CLL proliferation and the TLR9 trigger, unmethylated DNA, has been reported. We next investigated whether TLR signaling could induce a more activated and migratory phenotype in CLL cells.
Stimulation of CLL TLR9 causes upregulation of CD38, CD49d, CD69, p-STAT3, and p-p65 NF-κB, and increases migration
We initially stimulated CLL cells using a TLR9-specific oligonucleotide, B-CpG ODN2006. After a 24-hour stimulation period, primary CLL cells were assessed for markers associated with poor prognosis and cell adhesion/migration. All 15 CLL samples exhibited a marked increase in the expression of CD38 (mean, 2.7-fold; P = .020), CD49d (mean, 1.9-fold; P = .05), and CD69 (mean, 2.1-fold; P = .005) (Figure 2A) after ODN2006 stimulation. Because phosphorylation of p65 NF-κB and tyrosine 705 on STAT3 are associated with migration and poor prognosis in lymphoma35 and CLL,36,37 and STAT5 mutations are associated with aggressive lymphoma,38 we investigated phosphorylation of these transcription factors after TLR9 stimulation. Both p-STAT3 and p-p65 NF-κB were upregulated in all 24 samples studied (mean, 2.1- and 1.7-fold, respectively) (Figure 2B). In contrast, p-STAT5 exhibited a mean-fold increase of just 1.1, with 7 of 24 samples showing no change or reduced phosphorylation.
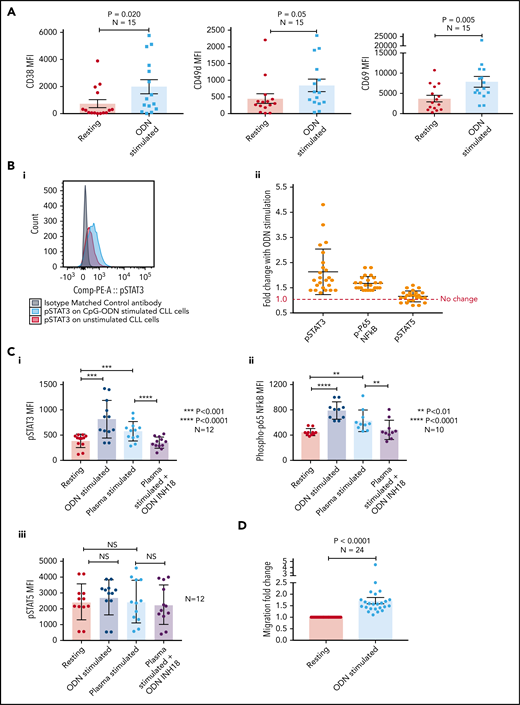
Stimulating CLL cells through TLR9 causes an increase in CD38, CD49d, CD69, p-STAT3, p-p65 NF-κB, and migration. (A) PBMCs from 15 different patients with CLL were incubated alone or in the presence of ODN2006 for 24 hours. Cells were then harvested and labeled with antibodies against CD5, CD19, CD38, CD49d, CD69, and a viability dye. Fluorescence minus one control tubes using stimulated CLL cells defined the thresholds for positivity. The MFI of CD38, CD49d, and CD69 were assessed by using flow cytometry; all were significantly increased in viable CD5+CD19+ CLL cells after activation with ODN2006. (B) Primary PBMCs were incubated for 4 hours with or without ODN2006. Cells were harvested and labeled for CD5, CD19, and intracellular p-STAT3, p-p65 NF-κB, p-STAT5, or an isotype matched control and then assessed by flow cytometry. (i) Representative overlaid histograms showing that gated CD5+CD19+ cells have some constitutive p-STAT3 (red histogram), which is increased after stimulation with ODN2006 (light blue histogram). (ii) Figure shows the MFI fold change compared with resting cells. There is an increase in both p-STAT3 and p-p65 NF-κB for all 24 cases after ODN2006 stimulation but no increase in p-STAT5. (C) Primary PBMCs were incubated for 4 hours with or without ODN2006, autologous plasma, or autologous plasma with the TLR9 inhibitor ODN-INH-18. Cells were harvested and stained for CD5, CD19, and intracellular p-STAT3, p-p65 NF-κB, or p-STAT5 and then assessed by using flow cytometry. Autologous plasma increased both p-STAT3 (i) and p-p65 NF-κB (ii), but not p-STAT5 (iii), and this was abrogated in the presence of a TLR9 inhibitor. (D) Primary PBMCs from 24 different patients were incubated alone or in the presence of ODN2006 for 24 hours. Cells were then harvested and then transferred into 5 μm pore polycarbonate transwell migration chambers and incubated for 4 hours; cells migrated toward a CXCL12 (100 ng/mL) gradient. The migrated and nonmigrated cells were collected, stained with CD5 and CD19 for CLL cell identification, and then quantitated volumetrically. The ODN2006 prestimulated CLL cells had greater levels of migration compared with the unstimulated fraction. Due to between-patient variance in levels of migration, the results are normalized to the unstimulated. NS, not significant.
Stimulating CLL cells through TLR9 causes an increase in CD38, CD49d, CD69, p-STAT3, p-p65 NF-κB, and migration. (A) PBMCs from 15 different patients with CLL were incubated alone or in the presence of ODN2006 for 24 hours. Cells were then harvested and labeled with antibodies against CD5, CD19, CD38, CD49d, CD69, and a viability dye. Fluorescence minus one control tubes using stimulated CLL cells defined the thresholds for positivity. The MFI of CD38, CD49d, and CD69 were assessed by using flow cytometry; all were significantly increased in viable CD5+CD19+ CLL cells after activation with ODN2006. (B) Primary PBMCs were incubated for 4 hours with or without ODN2006. Cells were harvested and labeled for CD5, CD19, and intracellular p-STAT3, p-p65 NF-κB, p-STAT5, or an isotype matched control and then assessed by flow cytometry. (i) Representative overlaid histograms showing that gated CD5+CD19+ cells have some constitutive p-STAT3 (red histogram), which is increased after stimulation with ODN2006 (light blue histogram). (ii) Figure shows the MFI fold change compared with resting cells. There is an increase in both p-STAT3 and p-p65 NF-κB for all 24 cases after ODN2006 stimulation but no increase in p-STAT5. (C) Primary PBMCs were incubated for 4 hours with or without ODN2006, autologous plasma, or autologous plasma with the TLR9 inhibitor ODN-INH-18. Cells were harvested and stained for CD5, CD19, and intracellular p-STAT3, p-p65 NF-κB, or p-STAT5 and then assessed by using flow cytometry. Autologous plasma increased both p-STAT3 (i) and p-p65 NF-κB (ii), but not p-STAT5 (iii), and this was abrogated in the presence of a TLR9 inhibitor. (D) Primary PBMCs from 24 different patients were incubated alone or in the presence of ODN2006 for 24 hours. Cells were then harvested and then transferred into 5 μm pore polycarbonate transwell migration chambers and incubated for 4 hours; cells migrated toward a CXCL12 (100 ng/mL) gradient. The migrated and nonmigrated cells were collected, stained with CD5 and CD19 for CLL cell identification, and then quantitated volumetrically. The ODN2006 prestimulated CLL cells had greater levels of migration compared with the unstimulated fraction. Due to between-patient variance in levels of migration, the results are normalized to the unstimulated. NS, not significant.
Because patients with CLL have elevated levels of the physiological TLR9 ligand unmethylated DNA (Figure 1), we next stimulated CLL cells with autologous plasma, with or without the TLR9 antagonist ODN INH-18. CLL cells were split into 4 fractions: untreated, ODN2006 activated, plasma activated, and plasma activated after preincubation with ODN INH-18. Autologous plasma increased both p-STAT3 and p-p65 NF-κB in all cases (1.5-fold [P < .001] and 1.4-fold [P < .01], respectively), which was abrogated in the presence of the TLR9 inhibitor (P < .0001 and P < .01) (Figure 2C). Again, there was no increase in p-STAT5. These data show that CLL cfDNA can induce the activation of both STAT3 and p65 NF-κB via a TLR9-specific autostimulation loop.
We and others previously reported a link between CLL cell migration and expression of CD38, CD49d, and STAT3.8,36,39 We therefore investigated whether TLR9 stimulation increased migration. Up to 2-fold greater migration was seen in TLR9-stimulated CLL cells compared with unstimulated controls (P < .001) (Figure 2D). We have previously shown that distinct CLL subpopulations have a greater propensity to migrate,6 and thus we investigated whether there was a link between levels of TLR9 and migration.
Intracellular TLR9 levels in CLL cells correlate with CD38, CD49d, p-STAT3, p-p65 NF-κB, and migration
Basal levels of endosomal TLR9 (eTLR) were quantified in permeabilized unstimulated CLL cells and correlated to the expression of known CLL adhesion/migration markers; mean fluorescence intensity (MFI) values of TLR9, CD38, and CD49d were obtained by gating the viable singlet CD19+CD5+ CLL cells of 27 patients (gating strategy shown in supplemental Figure 3A). We found no significant correlation between the expression of eTLR9 and CD49d and only a weak correlation with CD38 (supplemental Figure 3B). However, this analysis revealed that within each patient sample, CLL cells with the highest CD38 and CD49d expression had a much greater proportion of TLR9bright cells (Figure 3A). We therefore gated on the CD19+CD5+CD38+ or CD19+CD5+CD49d+ CLL cells and found striking correlations between the MFI of CD38 (r = 0.93; P < .001) and CD49d (r = 0.73; P = .011) with eTLR9 (Figure 3B). Furthermore, we showed that constitutive expression of p-STAT3 (Tyr 705) and p-p65 NF-κB was elevated in CD38hiCD49dhiTLR9bright CLL cells (Figure 3C). In addition, there was a correlation between CLL cell migration and basal levels of eTLR9 (r = 0.72; P < .001) (Figure 3D), suggesting that, along with the BCR, TLR9 signaling plays an important role in modulating CLL cell migration. Although synergy between the 2 signaling pathways has long been established in normal B cells,40,41 and suggested in CLL,30 this is the first time that a link between TLR9 levels and CLL migration has been made.
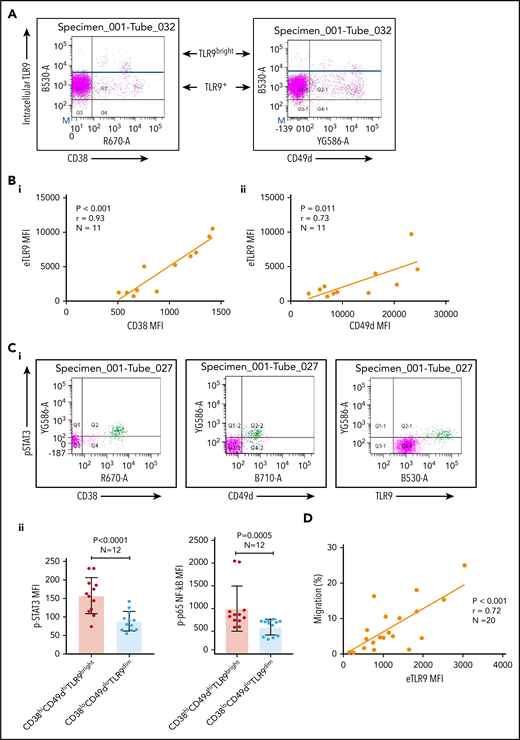
CLL TLR9 levels correlate with CD38, CD49d, p-STAT3, and p-p65 NF-κB and ability to migrate. Unstimulated primary PBMCs from 11 patients with CLL were stained with antibodies to CD5, CD19, CD38, CD49d, and a viability dye and then permeabilized and stained for eTLR9 or an isotype matched control. Cells were assessed by using flow cytometry and positivity determined by fluorescence minus one for surface antigens or an isotype matched control for eTLR9. (A) Representative figure showing that all viable CD5+CD19+ gated CLL cells have eTLR9, but within a patient, a much larger proportion of the CD38+ and CD49d+ populations have exceptionally high TLR9 (TLR9bright) compared with their negative counterparts. (B) CD5+CD19+CD38+ (i) and CD5+CD19+CD49d+ (ii) CLL cells from 11 different patients were gated on and the MFI of CD38, CD49d, and TLR9 established. There is a clear positive correlation between the MFIs of both CD38 and CD49d with TLR9. (C) Basal intranuclear p-STAT3 (Tyr 705) and p-p65 NF-κB levels were established on CLL cells from 12 patients using the same panel as above and including an anti–p-STAT3 or p-p65 NF-κB antibody. (i) Representative figure shows higher expression of p-STAT3 in CLL cells in a small population of CLL cells (shaded green), which also have higher expression of CD38, CD49d, and TLR9. (ii) The MFIs for both p-STAT3 and p-p65 NF-κB were quantified on both the CD38hi CD49dhi TLR9bright and the CD38lo CD49dlo TLR9dim population. The MFI of both p-STAT3 and p-p65 NF-κB was significantly higher in the CD38hi CD49dhi TLR9bright CLL cells. (D) Basal eTLR9 levels of CLL cells from 20 patients were compared with their level of migration (as described in Figure 2C, but in the absence of any stimulation). There is a clear correlation between the percentage of CLL cells that migrate and the MFI of their eTLR9.
CLL TLR9 levels correlate with CD38, CD49d, p-STAT3, and p-p65 NF-κB and ability to migrate. Unstimulated primary PBMCs from 11 patients with CLL were stained with antibodies to CD5, CD19, CD38, CD49d, and a viability dye and then permeabilized and stained for eTLR9 or an isotype matched control. Cells were assessed by using flow cytometry and positivity determined by fluorescence minus one for surface antigens or an isotype matched control for eTLR9. (A) Representative figure showing that all viable CD5+CD19+ gated CLL cells have eTLR9, but within a patient, a much larger proportion of the CD38+ and CD49d+ populations have exceptionally high TLR9 (TLR9bright) compared with their negative counterparts. (B) CD5+CD19+CD38+ (i) and CD5+CD19+CD49d+ (ii) CLL cells from 11 different patients were gated on and the MFI of CD38, CD49d, and TLR9 established. There is a clear positive correlation between the MFIs of both CD38 and CD49d with TLR9. (C) Basal intranuclear p-STAT3 (Tyr 705) and p-p65 NF-κB levels were established on CLL cells from 12 patients using the same panel as above and including an anti–p-STAT3 or p-p65 NF-κB antibody. (i) Representative figure shows higher expression of p-STAT3 in CLL cells in a small population of CLL cells (shaded green), which also have higher expression of CD38, CD49d, and TLR9. (ii) The MFIs for both p-STAT3 and p-p65 NF-κB were quantified on both the CD38hi CD49dhi TLR9bright and the CD38lo CD49dlo TLR9dim population. The MFI of both p-STAT3 and p-p65 NF-κB was significantly higher in the CD38hi CD49dhi TLR9bright CLL cells. (D) Basal eTLR9 levels of CLL cells from 20 patients were compared with their level of migration (as described in Figure 2C, but in the absence of any stimulation). There is a clear correlation between the percentage of CLL cells that migrate and the MFI of their eTLR9.
A small proportion of CLL cells express sTLR9
Sustained surface expression of TLR9 (sTLR9) has been previously reported and was linked to tumorigenesis and cancer progression.25,42 Because we previously identified that many patients with CLL include a small subpopulation with a more migratory phenotype (CD38hi and CD49dhi), we gated on these cells and quantified sTLR9. sTLR9 was detected on this subpopulation in all 29 CLL samples tested and, as with eTLR9, there was a strong correlation with CD38 (r = 0.77; P = .001) and CD49d (r = 0.91; P < .001) (Figure 4A-B). For confirmation, we performed intra-patient analysis to compare CD38 and CD49d expression in the gated sTLR9hi and sTLR9lo subpopulations. sTLR9hi CLL cells had 2.5-fold and 3.6-fold higher expression of CD38 and CD49d, respectively, compared with their matched sTLR9lo cells (P < .001) (Figure 4C). In addition, sTLR9hi cells exhibited a CXCR4dimCD5bright phenotype, which is a phenotype associated with LN trafficking9 (supplemental Figure 4).
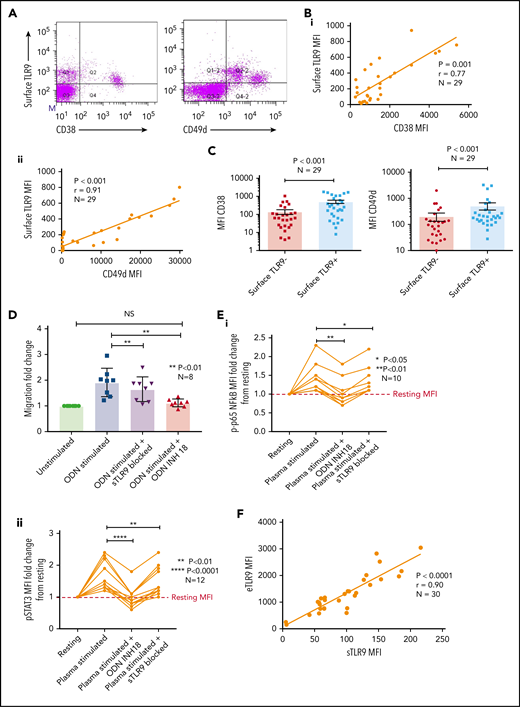
A small proportion of CLL cells with an aggressive phenotype and high levels of eTLR9 express functional sTLR9. Unstimulated primary PBMCs from 29 patients with CLL were stained with antibodies to CD5, CD19, CD38, CD49d, sTLR9, and a viability dye. Cell were assessed by using flow cytometry and positivity determined by fluorescence minus one. (A) Representative figure showing CLL cells from a patient with very high levels of sTLR9 expression. Viable CD5+CD19+ CLL cells were gated on and sTLR9 plotted against either CD38 or CD49d. The majority of sTLR9-positive CLL cells are positive for CD49d and many for CD38 as well. (B) CD5+CD19+CD38+ (i) and CD5+CD19+CD49d+ (ii) CLL cells from all 29 patients were gated on and the MFI of CD38, CD49d, and sTLR9 established. There is a clear positive correlation between the MFIs of both CD38 and CD49d with that of sTLR9. (C) Using a different 29 patient cohort, viable CD5+CD19+CLL cells were gated on and the sTLR9-positive and sTLR9-negative populations were further gated on. The MFI of CD38 and CD49d was established on both sTLR9-positive and sTLR9-negative populations, and within every patient, both CD38 and CD49d are much more highly expressed in the sTLR-positive population compared with their negative counterparts. (D) PBMCs from 8 different patients with CLL were split into 4 fractions. One fraction was preincubated with an antibody to block sTLR9 and one with ODN INH-18 to block tTLR9. Both these fractions of cells, and an untreated fraction, were then stimulated with ODN2006 overnight. The fourth fraction remained unstimulated. After overnight incubation, cells were harvested and then transferred into transwell migration chambers and incubated for 4 hours; cells migrated toward a CXCL12 (100 ng/mL) gradient. The migrated and nonmigrated cells were collected, stained with CD5 and CD19 for CLL cell identification, and then quantitated volumetrically. The fold change compared with the normalized unstimulated fraction was then assessed. The ODN2006 prestimulated CLL cells had greater levels of migration compared with the unstimulated fraction. This was marginally reduced after the blocking of sTLR9 but abrogated to the resting level in the presence of tTLR9 inhibition. (E) The same experiment was repeated by using autologous plasma stimulation for a 4-hour period and then cells collected, stained with CD5, CD19, and either an isotype matched control or p-p65 NF-κB (i) or p-STAT3 (ii). p-p65 NF-κB and p-STAT3 MFIs were quantified and the fold change compared with the normalized unstimulated fraction assessed. Both were upregulated in the presence of plasma, and this was very marginally reduced with sTLR9 blocking but much more with tTLR9 blockade. (F) eTLR9 and sTLR9 levels were compared on CLL cells from 30 different patients. Samples were split into 2 fractions; one was stained with CD5, CD19, and permeabilized for eTLR9 staining and the other with CD5, CD19, and sTLR9. For each, the CD5+CD19+ CLL cells were gated on and the MFI of the TLR9 quantified. There is a very strong correlation between the levels of eTLR9 and expression of sTLR9. NS, not significant.
A small proportion of CLL cells with an aggressive phenotype and high levels of eTLR9 express functional sTLR9. Unstimulated primary PBMCs from 29 patients with CLL were stained with antibodies to CD5, CD19, CD38, CD49d, sTLR9, and a viability dye. Cell were assessed by using flow cytometry and positivity determined by fluorescence minus one. (A) Representative figure showing CLL cells from a patient with very high levels of sTLR9 expression. Viable CD5+CD19+ CLL cells were gated on and sTLR9 plotted against either CD38 or CD49d. The majority of sTLR9-positive CLL cells are positive for CD49d and many for CD38 as well. (B) CD5+CD19+CD38+ (i) and CD5+CD19+CD49d+ (ii) CLL cells from all 29 patients were gated on and the MFI of CD38, CD49d, and sTLR9 established. There is a clear positive correlation between the MFIs of both CD38 and CD49d with that of sTLR9. (C) Using a different 29 patient cohort, viable CD5+CD19+CLL cells were gated on and the sTLR9-positive and sTLR9-negative populations were further gated on. The MFI of CD38 and CD49d was established on both sTLR9-positive and sTLR9-negative populations, and within every patient, both CD38 and CD49d are much more highly expressed in the sTLR-positive population compared with their negative counterparts. (D) PBMCs from 8 different patients with CLL were split into 4 fractions. One fraction was preincubated with an antibody to block sTLR9 and one with ODN INH-18 to block tTLR9. Both these fractions of cells, and an untreated fraction, were then stimulated with ODN2006 overnight. The fourth fraction remained unstimulated. After overnight incubation, cells were harvested and then transferred into transwell migration chambers and incubated for 4 hours; cells migrated toward a CXCL12 (100 ng/mL) gradient. The migrated and nonmigrated cells were collected, stained with CD5 and CD19 for CLL cell identification, and then quantitated volumetrically. The fold change compared with the normalized unstimulated fraction was then assessed. The ODN2006 prestimulated CLL cells had greater levels of migration compared with the unstimulated fraction. This was marginally reduced after the blocking of sTLR9 but abrogated to the resting level in the presence of tTLR9 inhibition. (E) The same experiment was repeated by using autologous plasma stimulation for a 4-hour period and then cells collected, stained with CD5, CD19, and either an isotype matched control or p-p65 NF-κB (i) or p-STAT3 (ii). p-p65 NF-κB and p-STAT3 MFIs were quantified and the fold change compared with the normalized unstimulated fraction assessed. Both were upregulated in the presence of plasma, and this was very marginally reduced with sTLR9 blocking but much more with tTLR9 blockade. (F) eTLR9 and sTLR9 levels were compared on CLL cells from 30 different patients. Samples were split into 2 fractions; one was stained with CD5, CD19, and permeabilized for eTLR9 staining and the other with CD5, CD19, and sTLR9. For each, the CD5+CD19+ CLL cells were gated on and the MFI of the TLR9 quantified. There is a very strong correlation between the levels of eTLR9 and expression of sTLR9. NS, not significant.
To establish whether sTLR9 is functional, we split CLL patient samples into 2 fractions; one was untreated, and one was preincubated with an anti-TLR9 antibody to block sTLR9. Both fractions were then stimulated with ODN2006, enabling eTLR9 to be activated as normal but not sTLR9 in the blocked fraction. As expected, both fractions showed evidence of activation, including increased CD49d, CD38, and CD69. However, in the blocked fraction, the expression of these antigens was lower: 63%, 77%, and 67% of the unblocked fraction, respectively (supplemental Figure 5A). Migration assays comparing ODN2006-stimulated CLL cells, with or without sTLR9, or total TLR9 (tTLR9) blockade, showed that blocking sTLR9 resulted in a 14% reduction in migration (P < .01). However, these CLL cells exhibited significantly more migration than unstimulated CLL cells, indicating that sTLR9 blockade alone cannot prevent TLR9 signaling (Figure 4D). In contrast, tTLR9 blockade caused almost total abrogation of ODN2006-induced migration (P < .01) back to that of the unstimulated fraction.
We proceeded to show that sTLR blockade reduced p-p65 NF-κB by 22% and p-STAT3 by 18%, but tTLR9 blockade reduced both to levels below that of the unstimulated cells (supplemental Figure 5B). Importantly, these findings were mirrored using autologous plasma stimulation; tTLR9 and sTLR9 blockade reduced p-p65 NF-κB in all samples but tTLR9 blockade to the resting levels or below in 7 of 10 and sTLR9 blockade in none of the 10. Similarly, p-STAT3 was reduced by both and to the resting level or below in 8 of 12 samples by tTLR9 blockade but in only 1 of 12 after sTLR9 blockade (Figure 4E). Finally, a striking correlation was noted between levels of eTLR9 and sTLR9, implicating sTLR9 as an extracellular marker of extensive eTLR9 signaling (r = 0.9; P < .0001) (Figure 4F).
Comparative RNA-sequencing shows a link between sTLR9hi and gene set enrichment for TLR signaling, lymphocyte activation, adhesion, and migration
We next investigated whether sTLR9hi and sTLR9lo CLL cells had different transcriptional signatures. We sorted paired fractions from 5 different patients and performed RNA-sequencing. After false discovery rate correction, 653 differentially expressed genes retained significance (q < 0.05): https://www.ncbi.nlm.nih.gov/geo/query/acc.cgi?acc=GSE147561. Gene ontology and gene set enrichment analysis, using WebGestalt (WEB-based GEne SeT AnaLysis Toolkit),43 confirmed that sTLR9hi CLL cells showed increased expression of genes associated with raised metabolic activity (glycolysis), lymphocyte activation, adhesion/migration (Rho GTPase cytoskeleton regulation and IGTB1; part of the CD49d complex), and inflammation mediated by chemokines and cytokines (Figure 5). Most importantly, in the sTLR9hi fraction, components of the TLR signaling pathway were highly overrepresented, with a normalization enrichment score of 2.08; the overexpressed gene list included the obligate TLR signaling molecule IRAK4.44 Furthermore, there was a striking overrepresentation of NF-κB (eg, NFKBIA, NFKBIE, RelA, NFKB2, IKBKB, TRAF6) and STAT3-regulated genes (JAK2 and JUNB). Finally, as shown by Wagner et al,30 there was a link between TLR9 and BCR signaling as the sTLR9hi population overexpressed the BCR signaling gene PLCγ2.
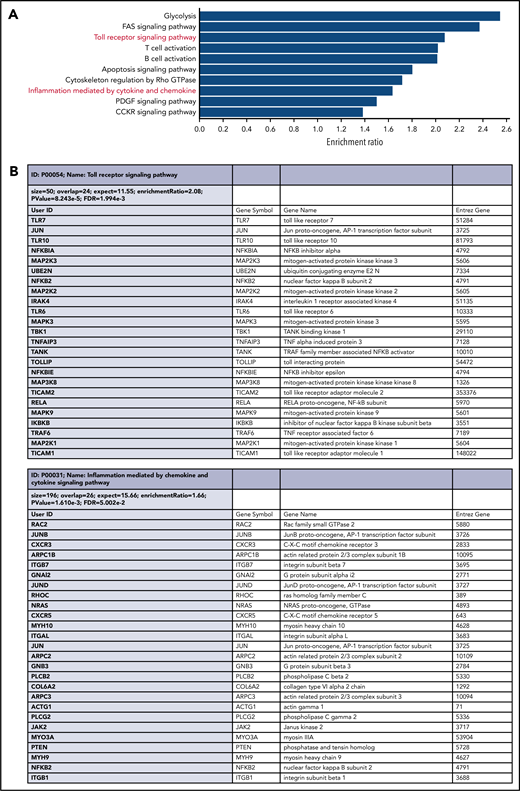
RNA-sequencing of paired sTLR9-positive and sTLR9-negative samples revealed a striking gene set enrichment for lymphocyte activation, adhesion/migration, TLR signaling, and inflammation. (A) The top 10 overrepresented pathways in the differentially expressed gene list between the sTLR9-positive and sTLR9-negative samples. (B) Shows the differentially expressed genes in the TLR signaling pathway and the inflammation mediated by cytokine and chemokine signaling pathway. FDR, false discovery rate.
RNA-sequencing of paired sTLR9-positive and sTLR9-negative samples revealed a striking gene set enrichment for lymphocyte activation, adhesion/migration, TLR signaling, and inflammation. (A) The top 10 overrepresented pathways in the differentially expressed gene list between the sTLR9-positive and sTLR9-negative samples. (B) Shows the differentially expressed genes in the TLR signaling pathway and the inflammation mediated by cytokine and chemokine signaling pathway. FDR, false discovery rate.
Surface TLR9 expression is higher in LN and migrated CLL cells
The RNA-sequencing data suggest that sTLR9hi expression represents CLL cells undergoing enhanced TLR signaling with a pro-inflammatory and promigratory transcriptional signature. We therefore investigated whether migrated CLL cells showed enrichment for a sTLR9hi phenotype. CLL cells from 10 patients were put through our circulation model for 48 hours,8 and the sTLR9 expression was compared between those that migrated vs those that remained circulating. sTLR9 was higher in the migrated cells from 9 of 10 patients tested (P = .004) (Figure 6A; supplemental Table 2). Importantly, we were also able to show that LN-derived CLL cells were enriched for the sTLR9hi phenotype in matched fine needle aspirates and PB from CLL patients with palpable LNs. CLL cells from all 7 patients tested had higher expression of sTLR9 in the LNs compared with their PB (P = .016) (Figure 6B-C).
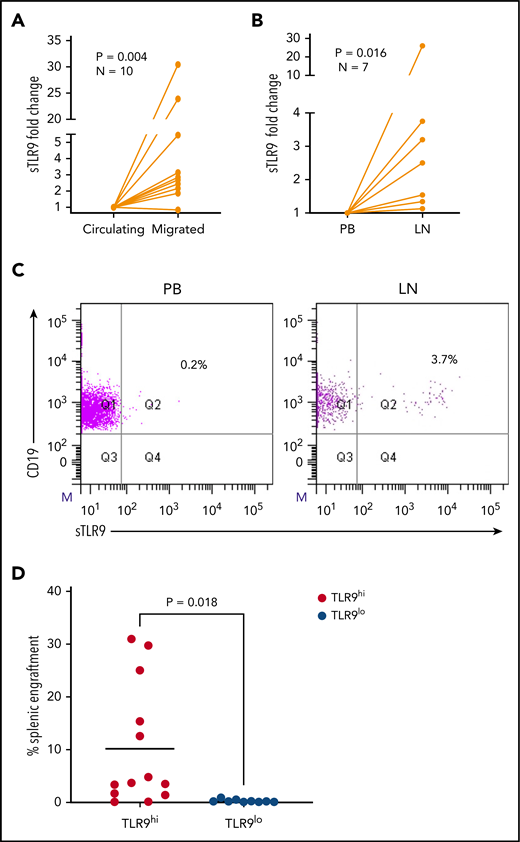
Higher TLR9 expression is seen in LNs and migrated CLL cells and is associated with preferential engraftment in a CLL xenograft model. (A) Primary PBMCs from 10 different patients with CLL were pumped through the circulating system for 48 hours; those that had migrated out of the circulating compartment were then harvested. CLL cells that remained circulating were harvested at the same time and both stained for expression of sTLR9 along with CD5 and CD19 for CLL cell identification. CD5+CD19+ CLL cells were gated on and the sTLR9 MFI positivity determined by fluorescence minus one. Due to the variation in MFIs, the circulating compartment results were normalized to 1 and the migrated results presented as fold difference. Migrated CLL cells from 9 of the 10 cases had higher sTLR9 MFI compared with those that remained circulating. (B) Fine needle aspirate and matching PB samples were taken from 7 CLL patients with palpable LNs. PBMCs were stained as above and CD5+CD19+ CLL cells gated on. Due to the variation in MFIs, the PB results were normalized to 1, and the LN results presented as fold difference. For all 7 cases, sTLR9 MFI was higher in the LN-derived CLL cells compared with those from the PB. (C) The scatter plots are representative examples showing matched PB and LN-derived gated CLL cells from the same patient. (D) CLL cells from 4 patients with raised TLR9 and 3 patients with low TLR9 (relative transcription normalized to β-actin) were xenotransplanted into NOD/Shi-scid/IL-2Rγnull mice. Mice were euthanized according to the criteria described in the supplemental Materials and methods, and the percentage of CLL cells in the spleen were determined by using flow cytometry (supplemental Table 1). Mice engrafted with TLR9hi CLL cells had considerably higher numbers in their spleen compared with those engrafted with TLR9lo CLL cells. Q, quartile.
Higher TLR9 expression is seen in LNs and migrated CLL cells and is associated with preferential engraftment in a CLL xenograft model. (A) Primary PBMCs from 10 different patients with CLL were pumped through the circulating system for 48 hours; those that had migrated out of the circulating compartment were then harvested. CLL cells that remained circulating were harvested at the same time and both stained for expression of sTLR9 along with CD5 and CD19 for CLL cell identification. CD5+CD19+ CLL cells were gated on and the sTLR9 MFI positivity determined by fluorescence minus one. Due to the variation in MFIs, the circulating compartment results were normalized to 1 and the migrated results presented as fold difference. Migrated CLL cells from 9 of the 10 cases had higher sTLR9 MFI compared with those that remained circulating. (B) Fine needle aspirate and matching PB samples were taken from 7 CLL patients with palpable LNs. PBMCs were stained as above and CD5+CD19+ CLL cells gated on. Due to the variation in MFIs, the PB results were normalized to 1, and the LN results presented as fold difference. For all 7 cases, sTLR9 MFI was higher in the LN-derived CLL cells compared with those from the PB. (C) The scatter plots are representative examples showing matched PB and LN-derived gated CLL cells from the same patient. (D) CLL cells from 4 patients with raised TLR9 and 3 patients with low TLR9 (relative transcription normalized to β-actin) were xenotransplanted into NOD/Shi-scid/IL-2Rγnull mice. Mice were euthanized according to the criteria described in the supplemental Materials and methods, and the percentage of CLL cells in the spleen were determined by using flow cytometry (supplemental Table 1). Mice engrafted with TLR9hi CLL cells had considerably higher numbers in their spleen compared with those engrafted with TLR9lo CLL cells. Q, quartile.
To investigate the role of TLR9 in CLL cells in vivo, we established CLL murine xenografts TLR9hi and TLR9lo CLL cells into NOD/Shi-scid/IL-2Rγnull mice. Of the 7 different patient samples transplanted, 4 were TLR9hi and 3 were TLR9lo. CLL cells from the TLR9hi samples exhibited considerably higher levels of splenic engraftment (mean, 10.2 ± 11.5%) and more rapid disease progression compared with the TLR9lo samples, which all exhibited engraftment levels <1% (mean, 0.3 ± 0.3%; P = .018) (Figure 6D; supplemental Figure 6). Furthermore, a positive correlation (r2 = 0.23; P = .01) was seen between TLR9 expression and the extent of splenic engraftment (supplemental Figure 7). These data support the notion that TLR9 contributes to CLL migration and engraftment in vivo.
Blocking TLR9 reduces CLL cell migration and synergizes with ibrutinib
The data presented above provide compelling evidence to support inhibition of TLR9 as a potential therapeutic strategy to reduce the activation of STAT3 and NF-κB and prevent CLL cell migration. Although we have shown that sTLR9 is functional in CLL, its blockade is not sufficient to prevent TLR9 signaling. We therefore investigated whether inhibition of tTLR9 synergizes with ibrutinib to reduce migration. To test this theory, an experimentally determined fixed molar ratio of 2:1 (ODN INH-18:ibrutinib) was used. In this model, a clinically relevant dose of 1 μM of ibrutinib45 was found to reduce migration of activated CLL cells in 5 of 6 patients when used as a single agent; the addition of ODN INH-18 (2 μM) had a marked synergistic effect. In all 6 patients, migration was reduced to a level significantly below that seen with either drug alone; median combination index at the half maximal effective dose for the combination of the 2 drugs was 0.2, indicating a strong synergistic effect (Figure 7A-B). The combination also synergistically reduced p-p65 NF-κB and p-STAT3 but not p-STAT5 (Figure 7C-F; supplemental Figure 8). These data clearly support our hypothesis that inhibition of the TLR9 pathway, along with BCR signaling, is a potential therapeutic strategy, especially given a report that TLR9 signaling provides a common escape mechanism for CLL cells after treatment with ibrutinib and venetoclax.46
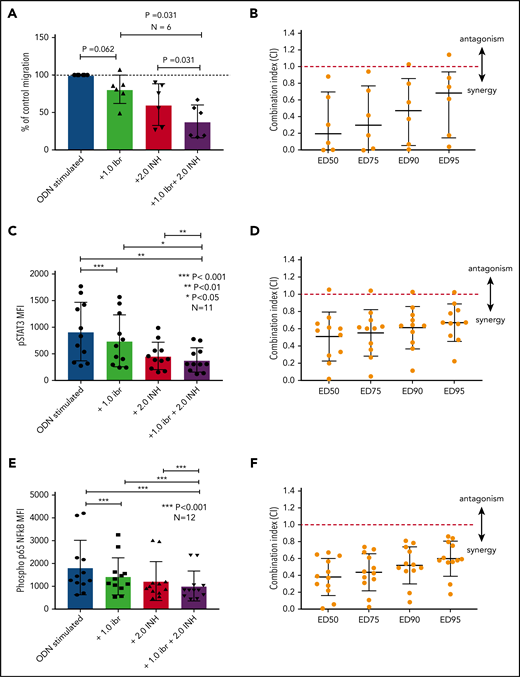
Blocking TLR9 reduces CLL cell migration and is synergistic with ibrutinib. (A) PBMCs from 6 different patients were split into 4 fractions. One fraction was stimulated with ODN2006 alone, 1 fraction stimulated in the presence of ibrutinib, one fraction stimulated in the presence of the TLR9 inhibitor ODN INH-18, and 1 fraction stimulated in the presence of both (2:1 fixed molar ratio of ODN INH-18 to ibrutinib). After overnight incubation, cells were harvested and then transferred into transwell migration chambers and incubated under the conditions described above. The migrated and nonmigrated cells were collected, stained with CD5 and CD19 for CLL cell identification, and then quantitated volumetrically. The percent change compared with the normalized stimulated fraction was then assessed. The combination of ODN INH-18 and ibrutinib gave maximum CLL cell migration inhibition. (B) Combination index (CI) analysis showed that the 2 drugs were synergistic in all 6 samples using 1 μM ibrutinib + 2 μM ODN INH-18 (ie, CI <1). The mean CI at the half maximal effective dose (ED50) for the combination of the 2 drugs was 0.2, indicating a strong synergistic effect. (C,E) CLL cells from 11 or 12 different patients were split and treated as above, but stimulated for 4 hours. After activation, cells were harvested and stained for CD5, CD19, and intracellular p-STAT3, p-p65 NF-κB, or an isotype matched control and then assessed by using flow cytometry and the MFI recorded. The combination of ODN INH-18 and ibrutinib gave the maximum inhibition of both p-STAT3 and p-p65 NF-κB. CI analysis showed that the 2 drugs were synergistic at reducing p-STAT3 in 10 of 11 patients (D) and p-p65 NF-κB in all 12 patients (F) using 1 μM ibrutinib + 2 μM ODN INH-18 (ie, CI <1). The mean CI at the ED50 for the combination of the 2 drugs was 0.5 for p-STAT3 and 0.4 for p-p65 NF-κB, indicating a strong synergistic effect.
Blocking TLR9 reduces CLL cell migration and is synergistic with ibrutinib. (A) PBMCs from 6 different patients were split into 4 fractions. One fraction was stimulated with ODN2006 alone, 1 fraction stimulated in the presence of ibrutinib, one fraction stimulated in the presence of the TLR9 inhibitor ODN INH-18, and 1 fraction stimulated in the presence of both (2:1 fixed molar ratio of ODN INH-18 to ibrutinib). After overnight incubation, cells were harvested and then transferred into transwell migration chambers and incubated under the conditions described above. The migrated and nonmigrated cells were collected, stained with CD5 and CD19 for CLL cell identification, and then quantitated volumetrically. The percent change compared with the normalized stimulated fraction was then assessed. The combination of ODN INH-18 and ibrutinib gave maximum CLL cell migration inhibition. (B) Combination index (CI) analysis showed that the 2 drugs were synergistic in all 6 samples using 1 μM ibrutinib + 2 μM ODN INH-18 (ie, CI <1). The mean CI at the half maximal effective dose (ED50) for the combination of the 2 drugs was 0.2, indicating a strong synergistic effect. (C,E) CLL cells from 11 or 12 different patients were split and treated as above, but stimulated for 4 hours. After activation, cells were harvested and stained for CD5, CD19, and intracellular p-STAT3, p-p65 NF-κB, or an isotype matched control and then assessed by using flow cytometry and the MFI recorded. The combination of ODN INH-18 and ibrutinib gave the maximum inhibition of both p-STAT3 and p-p65 NF-κB. CI analysis showed that the 2 drugs were synergistic at reducing p-STAT3 in 10 of 11 patients (D) and p-p65 NF-κB in all 12 patients (F) using 1 μM ibrutinib + 2 μM ODN INH-18 (ie, CI <1). The mean CI at the ED50 for the combination of the 2 drugs was 0.5 for p-STAT3 and 0.4 for p-p65 NF-κB, indicating a strong synergistic effect.
Discussion
Over the last decade, targeting BCR-related signaling pathways has led to improved therapies for CLL. However, despite these advances, CLL remains incurable. The identification of MyD88-activating mutations in ∼3% of CLL cases,18 supported by the potential for TLR9 to be triggered by autoantigens/DNA,47 has prompted new research into the role of TLR signaling in CLL.48
Here, we show for the first time that autologous plasma from patients with CLL contains a disproportionately high level of unmethylated mtDNA, which can trigger TLR9 signaling, resulting in downstream phosphorylation of STAT3 and NF-κB. Importantly, all of these effects can be reversed by TLR9 inhibition. Furthermore, we found that patients with aggressive disease have increased levels of cfDNA, which correlate strongly with the dynamic prognostic markers CD38, B2M, net proliferation (LDT), tumor burden, and shorter time to first treatment. These strong correlations suggest that cfDNA may promote tumor proliferation. There was also a trend toward higher cfDNA and unmutated IGHV status; although mutational status itself is not dynamic, it is recognized that an unmutated IGHV correlates with raised CD38,49 which in turn is regulated by CLL cell interactions in the lymphoid tissue microenvironment.34 It is therefore possible that raised cfDNA promotes CLL cell activation and trafficking to pro-proliferative lymphoid tissues. Although raised levels of cfDNA did not correlate with ZAP70 expression, it remains possible that the adapter molecule function of ZAP7050,51 may enable ZAP70-positive CLL cells to signal via TLR9, regardless of cfDNA levels.
CD38 and CD49d are associated with each other52,53 and CLL cell homing,54 where it is known that the malignant clone differs from normal B cells in that α4β1 (CD49d) engagement is essential for transendothelial migration.39 Here, we show that TLR9 stimulation increases CD38, CD49d, and migration. Within a patient’s CLL clone, eTLR9bright cells exhibited higher expression of CD38, CD49d, p-STAT3, and p-p65 NF-κB. Furthermore, in contrast to TLR9lo CLL cells, TLR9hi CLL cells exhibited good engraftment in NOD/Shi-scid/IL-2Rγnull mice. Taken together, these findings both support and expand on our previous study6 and suggest an important role for TLR9 in vivo.
TLR9 is usually triggered by pathogenic DNA, which is structurally identical to self-DNA except for the presence of unmethylated CG dinucleotides. CG motifs are underrepresented within the mammalian genome, and the majority exist within the heavily methylated gene promoter regions.55 However, mtDNA is almost entirely unmethylated55,56 and given that exposed mtDNA is a natural and extracellular-residing product of cell death, it is vital that it does not come into contact with functional TLR9. Therefore, in normal resting conditions, TLR9 is sequestered within the endoplasmic reticulum and transported to the endosomal membrane in its inactive pre-receptor form after the endocytosis of CpG DNA.50,57,58 TLR9 is then transported via the Golgi-dependent secretory pathway and is temporarily expressed at the cell surface before re-internalization. TLR9 functionality is not believed to be enabled until it is successfully integrated and cleaved within the endosomal membrane.59 Such tight regulation of TLR9 is fundamental to the distinction of self/non–self-DNA and ensures that functional TLR9 only encounters pathogen-derived nucleic acids. However, a hallmark of CLL is the large tumor turnover,60 and it is possible that extensive apoptosis, and the generation of excessive cfDNA, could overwhelm this regulatory system and trigger autologous TLR9 activation.
Surface TLR9 has been described in solid tumors and linked to tumorigenesis and cancer progression.25 We hypothesize that the high cell turnover seen in malignancies such as CLL could trigger dysregulation of the distinction of self/non–self-DNA and thus result in sustained surface expression of TLR9. In support of this hypothesis, we described sTLR9, on a small population of CLL cells within patients, which is notably higher on those that migrate or reside within the LNs. Importantly, we also showed that blocking of sTLR9 marginally reduces CLL activation and migration, indicating some functional properties. However, its strong correlation with eTLR9 indicates that expression is likely a consequence of sustained eTLR9 signaling in the most aggressive CLL cell subpopulation, and this theory is supported by the striking TLR gene set enrichment seen in sorted sTLR9hi cells. Importantly, raised sTLR9 could potentially represent a biomarker for patients who would particularly benefit from TLR9 inhibition. Finally, we showed that total blockade of TLR9 is highly synergistic with ibrutinib and reduces p-p65 NF-κB– and p-STAT3–driven migration down below that which either drug alone can achieve.
These findings strongly support the rationale for further investigations into the role of TLR9 in CLL. It is clear that blockade of BTK or PI3K alone is not curative, and these tumor cells have mechanisms for escape and clonal evolution that involve TLR9 signaling.46 Therefore, simultaneous targeting of multiple signaling pathways could provide an opportunity for total tumor eradication. In this regard, we have shown that there is a strong biological rationale for dual targeting of BTK and TLR9.
The publication costs of this article were defrayed in part by page charge payment. Therefore, and solely to indicate this fact, this article is hereby marked “advertisement” in accordance with 18 USC section 1734.
mRNA sequencing is available at GEO under accession number GSE147561.
The online version of this article contains a data supplement.
Acknowledgments
This work was funded by a Blood Cancer UK Programme Continuity grant (18005), the Sussex Cancer Fund, the Crawley Leukaemia Research, and the Michael Chowen Research Fund, all awarded to C.P. and A.G.S.P.
Authorship
Contribution: E.K., E.C., E.H., N.P.-P., E.W., B.C., E.H.P., T.A.B., S.M., R.S., M.S., A.A., C.O., N.D., T.S., T.L., and C.I.J. performed experiments, analyzed data, and revised the manuscript; S.D., R.J., and T.C. provided vital reagents and revised the manuscript; and A.G.S.P., C.D.F., and C.P. conceived the study, analyzed data, and drafted the manuscript.
Conflict-of-interest disclosure: The authors declare no competing financial interests.
Correspondence: Andrea G. S. Pepper, Department of Clinical and Experimental Medicine, Brighton and Sussex Medical School, Medical Research Building, Biology Rd, Falmer, BN1 9PS United Kingdom; e-mail: a.pepper@bsms.ac.uk.

This feature is available to Subscribers Only
Sign In or Create an Account Close Modal