

Key Points
Pathologic production of soluble BAFF and presence of alloantigen synergistically promote a BCR-activated B-cell compartment in cGVHD.
BAFF increases B-cell surface NOTCH2 expression and maintains SYK protein, augmenting BCR responsiveness in cGVHD.
Visual Abstract

Working model for the role of soluble BAFF in promotion of and BCR-activation of pathogenic B cells in chronic GVHD. In our paper, we now demonstrate a mechanistic role for BAFF in chronic GVHD (cGVHD) using a mouse model. Our data afford the working model depicted here. BAFF levels and BAFF production are significantly increased in cGVHD mice. Recipient Fibroblastic Reticular Cells (FRCs) and Donor T Follicular Helper (TFH) Cells are likely cellular sources of this pathologic BAFF. Excess BAFF in cGVHD promotes survival of subsets of activated B cells. In turn, BAFF and alloantigen work together to augment B Cell Receptor (BCR) activation, in part, by increasing co-stimulatory NOTCH2 on B cells in mice that go on to develop cGVHD manifestations. At the molecular level, these B cells exposed to a high BAFF, NOTCH ligand and alloantigen environment are able to maintain SYK protein even after BCR re-engagement, perpetuating a BCR-responsive B cell compartment in cGVHD.
Working model for the role of soluble BAFF in promotion of and BCR-activation of pathogenic B cells in chronic GVHD. In our paper, we now demonstrate a mechanistic role for BAFF in chronic GVHD (cGVHD) using a mouse model. Our data afford the working model depicted here. BAFF levels and BAFF production are significantly increased in cGVHD mice. Recipient Fibroblastic Reticular Cells (FRCs) and Donor T Follicular Helper (TFH) Cells are likely cellular sources of this pathologic BAFF. Excess BAFF in cGVHD promotes survival of subsets of activated B cells. In turn, BAFF and alloantigen work together to augment B Cell Receptor (BCR) activation, in part, by increasing co-stimulatory NOTCH2 on B cells in mice that go on to develop cGVHD manifestations. At the molecular level, these B cells exposed to a high BAFF, NOTCH ligand and alloantigen environment are able to maintain SYK protein even after BCR re-engagement, perpetuating a BCR-responsive B cell compartment in cGVHD.
Abstract
Patients with chronic graft-versus-host disease (cGVHD) have increased B cell–activating factor (BAFF) levels, but whether BAFF promotes disease after allogeneic bone marrow transplantation (allo-BMT) remains unknown. In a major histocompatibility complex–mismatched model with cGVHD-like manifestations, we first examined B-lymphopenic μMT allo-BMT recipients and found that increased BAFF levels in cGVHD mice were not merely a reflection of B-cell number. Mice that later developed cGVHD had significantly increased numbers of recipient fibroblastic reticular cells with higher BAFF transcript levels. Increased BAFF production by donor cells also likely contributed to cGVHD, because BAFF transcript in CD4+ T cells from diseased mice and patients was increased. cGVHD manifestations in mice were associated with high BAFF/B-cell ratios and persistence of B-cell receptor (BCR)–activated B cells in peripheral blood and lesional tissue. By employing BAFF transgenic (Tg) mice donor cells, we addressed whether high BAFF contributed to BCR activation in cGVHD. BAFF increased NOTCH2 expression on B cells, augmenting BCR responsiveness to surrogate antigen and NOTCH ligand. BAFF Tg B cells had significantly increased protein levels of the proximal BCR signaling molecule SYK, and high SYK protein was maintained by BAFF after in vitro BCR activation or when alloantigen was present in vivo. Using T cell–depleted (BM only) BAFF Tg donors, we found that BAFF promoted cGVHD manifestations, circulating GL7+ B cells, and alloantibody production. We demonstrate that pathologic production of BAFF promotes an altered B-cell compartment and augments BCR responsiveness. Our findings compel studies of therapeutic targeting of BAFF and BCR pathways in patients with cGVHD.
Introduction
Chronic graft-versus-host disease (cGVHD) remains a life-altering, potentially fatal immune toxicity in patients otherwise cured of hematolymphoid cancers through allogeneic hematopoietic stem cell or bone marrow transplantation (allo-BMT).1 Studies of patients and mice suggest that the underlying pathophysiology of cGVHD occurs along a spectrum that starts early after allo-BMT,2 well before the clinical signs and symptoms manifest. Alloreactive T cells are known to incite acute and cGVHD, but T-cell elimination to prevent GVHD compromises antitumor effects.3 Clinically active cGVHD relies on a coordinated T- and B-cell response,4,5 and antibody production is required for development and perpetuation of cGVHD.6-11 Therefore, B-cell targeting to treat or avert cGVHD is an area of active investigation.
Unfortunately, elimination of CD20+ B cells with rituximab is only sporadically effective, likely related to an inability to achieve B-cell homeostasis.12,13 This hypothesis is supported by the observation that CD27+ memory B cells persist14 and are capable of constitutively producing immunoglobulin G (IgG).12,14 B cells from patients with clinically active cGVHD display increased B-cell receptor (BCR) responsiveness and are preferentially killed after BCR inhibition.14,15 Importantly, constitutive BCR signaling is critical for survival of both CD27+ and CD27− B-cell subsets in both patients with cGVHD and mice, an effect autoamplified by enhanced NOTCH inputs.16,17 Blocking BCR-activated B cells with SYK or BTK inhibitors attenuated disease in mouse models,7,18,19 and subsequent clinical trials documented clinical benefit and led to US Food and Drug Administration approval of the BTK inhibitor ibrutinib for cGVHD.20
Targeting B cells does not address the extrinsic factor B-cell activating factor (BAFF), known to determine B-cell homeostasis21,22 and BCR responsiveness.23 Intriguingly, B cells from patients with cGVHD are activated and primed for survival via BAFF-associated pathways.24 Increased plasma BAFF levels are associated with disease severity, treatment response, and outcome in patients with cGVHD.12,25-29 Evidence supporting a pathologic role for BAFF in cGVHD is lacking,30 because high plasma BAFF levels after allo-BMT are potentially a consequence of low B-cell number related to poor B-cell production.31-35 Without peripheral B cells, cGVHD might not develop,5,6,8,9 but without BAFF, naïve/mature B-cell recovery after BMT does not occur, and B-cell homeostasis cannot be achieved.36 Thus, studying and potentially targeting BAFF after BMT are not straightforward, given the concentration-dependent dual role played by BAFF in conferring B-cell immune homeostatic vs pathologic effects.37,38
To address whether BAFF plays a pathologic role in cGVHD, we employed BAFF knockout (KO) and BAFF transgenic (Tg) donor mice in allo- and syngeneic BMT (Syn-BMT). We found posttransplantation increases in BAFF production occurred in mice that developed cGVHD manifestations. Elevated BAFF promoted NOTCH2 expression on B cells and maintained SYK protein after BCR engagement. Further corroborating a pathologic role for BAFF, we demonstrate that excess BAFF and alloantigen operate together to promote a circulating BCR-responsive B-cell pool and alloantibody production. Thus, we demonstrate that BAFF is a pivotal extrinsic regulator of B-cell pathology in cGVHD.
Materials and methods
BMT mouse model
C57BL/6, µMT, and BALB/c mice were obtained from The Jackson Laboratory. G.K.M. (University of North Carolina) provided BAFF KO mouse splenocytes and BM cells, and J.C.R. (Duke University) provided BAFF Tg mice. Female 10- to 12-week-old age-matched C57BL/6 (H-2Kb), BAFF Tg (C57BL/6 background; H-2Kb),39 BAFF KO (H-2Kb),40 or μMT (H-2Kb) donor mice and BALB/c (H-2Kd) recipient mice were used in allo-BMT experiments. T cell–depleted BM was used as previously described.41 Mice were housed at the Duke Cancer Center Isolation Facility. All animal experiments were approved by the Institutional Animal Care and Use Committee of Duke University. Eye pathology was scored using a Stemi 2000-C stereo microscope (Zeiss) with camera (Nikon Coolpix P5100) as described.41 Lung and liver fibrosis was assessed by Masson’s trichrome staining and quantitated by ImageJ software (National Institutes of Health).
Detailed material and methods can be found in the data supplement, which includes the following: BAFF measurements, flow cytometric analyses with antibodies used to examine B-cell subsets, BAFF receptor (BAFF-R) occupancy determination, BCR stimulation assay with B-cell phosphoflow and intracellular staining, carboxyfluorescein diacetate succinimidyl ester (CFSE) dilution assay, immunohistochemical staining, quantitation of images by ImageJ, stromal cell isolation and cell sorting, conjunctiva tissue cell preparation, quantitative polymerase chain reaction of BAFF transcript measurement, in vitro NOTCH2 stimulation assay, analysis of SYK protein stability and degradation, western blot, autoantibody detection, and statistical analyses.
Results
Pathologic BAFF production occurs after allo-BMT in mice that develop cGVHD
In patients, before and at the time of clinically apparent cGVHD, plasma BAFF levels are significantly increased.25,28 High BAFF is associated with an altered and activated peripheral B-cell compartment in these patients.14,25,42 We first examined whether our mouse model recapitulated these patient findings. We substantiated cGVHD manifestations,43 including ocular GVHD and weight loss, starting a median of 30 days after allo-BMT.41 These cGVHD manifestations were associated with collagen deposition and lymphocyte infiltration in tissues (supplemental Figure 1, available on the Blood Web site).41 As shown in Figure 1A, mice receiving BM and splenocytes (BM + Sp) had persistent and significantly increased plasma BAFF levels compared with mice that did not develop disease (BM only) and with B6 Syn-BMT mice early after allo-BMT, starting on day 8 after transplantation. Because high BAFF is found when B-cell numbers are low after allo-BMT,44 we used μMT donors to ensure equally low B-cell numbers after allo-BMT before measuring BAFF levels (Figure 1B). We found that BAFF levels in µMT donor cell recipients were further and significantly increased if they also received T cells (Figure 1C), suggesting high BAFF levels in BM + Sp mice were not merely due to a paucity of B cells wielding BAFF-R, which removes soluble BAFF from plasma.
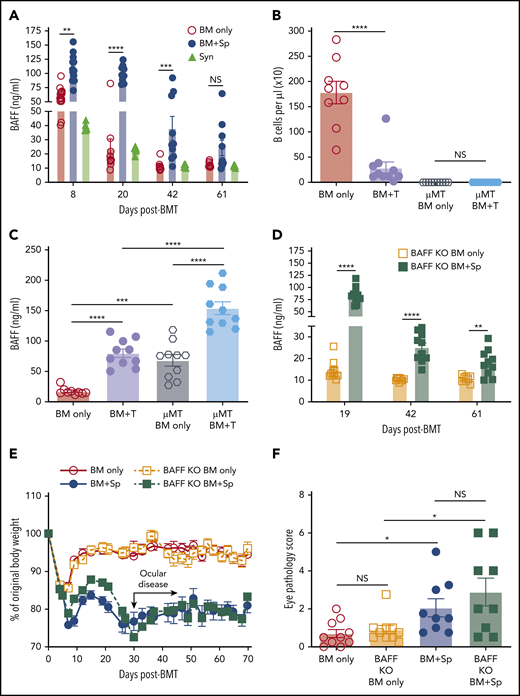
BAFF production is significantly increased after BMT in mice that develop cGVHD. (A) Plasma BAFF levels measured by enzyme-linked immunosorbent assay (ELISA) over time after BMT in cGVHD mice (BM + Sp), nondisease control mice (BM only), and C57BL/6 recipients of C57BL/6 BM + Sp Syn-BMT mice. Data shown are representative of 3 repeats; n = 15 (BM only group at day 8), n = 13 (BM + Sp at day 8), n = 10 (BM + Sp and BM only for other time points), and n = 5 (Syn). (B) Peripheral donor-derived B-cell numbers at day 20 post-BMT in recipients of μMT or WT donor cells. (C) BAFF levels measured by ELISA in plasma at day 20 after allo-BMT in recipients receiving donor cells from μMT or WT mice. In panels B and C, n = 10 in each group vs n = 9 in WT BM only group. (D) Soluble BAFF levels measured by ELISA at 3 time points (days 19, 42, and 61) after transplantation in recipients receiving BAFF KO BM only vs recipients receiving BAFF KO BM plus BAFF KO splenocytes; n = 10 in each group. (E) Body weight over time after allo-BMT in recipients of BAFF KO BM only or BM + Sp vs WT BM only or BM + Sp. Arrow indicates the median time of onset of ocular GVHD manifestations (day 30 post-BMT)41 ; n = 10 in each group. In panels D and E, we show 1 representative experiment of 3 performed. (F) Eye pathology score in recipients of BAFF KO BM only or BM + Sp vs WT BM only or BM + Sp. Total eye score shown includes combined scores for chemosis, mucoid discharge, and corneal opacity as determined in a masked fashion by Zeiss Stemi 2000-C stereo microscope examination at day 79 after allo-BMT; n = 10 (BM only) and n = 9 (BM + Sp). Bars of all data shown are mean ± standard error of the mean. Statistical analysis was performed by Kruskal-Wallis test (A,F), ordinary 1-way analysis of variance with Tukey’s multiple comparisons test (B-C), or unpaired Student t test with Welch’s correction (D) using GraphPad Prism 8 software. *P < .05, **P < .01, ***P < .001, ****P < .0001. NS, not significant (P > .05); T, T cells.
BAFF production is significantly increased after BMT in mice that develop cGVHD. (A) Plasma BAFF levels measured by enzyme-linked immunosorbent assay (ELISA) over time after BMT in cGVHD mice (BM + Sp), nondisease control mice (BM only), and C57BL/6 recipients of C57BL/6 BM + Sp Syn-BMT mice. Data shown are representative of 3 repeats; n = 15 (BM only group at day 8), n = 13 (BM + Sp at day 8), n = 10 (BM + Sp and BM only for other time points), and n = 5 (Syn). (B) Peripheral donor-derived B-cell numbers at day 20 post-BMT in recipients of μMT or WT donor cells. (C) BAFF levels measured by ELISA in plasma at day 20 after allo-BMT in recipients receiving donor cells from μMT or WT mice. In panels B and C, n = 10 in each group vs n = 9 in WT BM only group. (D) Soluble BAFF levels measured by ELISA at 3 time points (days 19, 42, and 61) after transplantation in recipients receiving BAFF KO BM only vs recipients receiving BAFF KO BM plus BAFF KO splenocytes; n = 10 in each group. (E) Body weight over time after allo-BMT in recipients of BAFF KO BM only or BM + Sp vs WT BM only or BM + Sp. Arrow indicates the median time of onset of ocular GVHD manifestations (day 30 post-BMT)41 ; n = 10 in each group. In panels D and E, we show 1 representative experiment of 3 performed. (F) Eye pathology score in recipients of BAFF KO BM only or BM + Sp vs WT BM only or BM + Sp. Total eye score shown includes combined scores for chemosis, mucoid discharge, and corneal opacity as determined in a masked fashion by Zeiss Stemi 2000-C stereo microscope examination at day 79 after allo-BMT; n = 10 (BM only) and n = 9 (BM + Sp). Bars of all data shown are mean ± standard error of the mean. Statistical analysis was performed by Kruskal-Wallis test (A,F), ordinary 1-way analysis of variance with Tukey’s multiple comparisons test (B-C), or unpaired Student t test with Welch’s correction (D) using GraphPad Prism 8 software. *P < .05, **P < .01, ***P < .001, ****P < .0001. NS, not significant (P > .05); T, T cells.
After Syn-BMT, BAFF is required for B-cell recovery and is derived from recipient stromal cells.36 To determine whether BAFF production by recipient stromal cells is required for cGVHD development, we used BAFF KO mice as donors. We found that in the absence of donor-derived BAFF, BAFF levels remained significantly higher in cGVHD mice (Figure 1D). Despite high BAFF levels after allo-BMT, profound B-cell lymphopenia was observed in recipients of BAFF KO BM + Sp (supplemental Figure 2A), resulting in significantly higher BAFF/B-cell ratios (supplemental Figure 2B). Recipients of BAFF KO BM + Sp developed measurable weight loss and eye manifestations indistinguishable from wild-type (WT) BM + Sp recipients (Figure 1E-F), suggesting that recipient-derived BAFF was sufficient to promote cGVHD development. Consistent with a previous report,45 we found that the secondary lymphoid organs (SLOs) were significantly enlarged early after allo-BMT in mice that went on to develop cGVHD compared with controls (Figure 2A). We examined nonhematopoietic stromal cells by gating on CD45− cells and then PDPN+ and CD31− cells as previously described (Figure 2B).46 Among stromal subsets, PDPN+CD31−MadCaM− FRCs, previously established as major BAFF producers,47 were significantly proportionally and numerically increased in BM + Sp recipients that later developed cGVHD (Figure 2C-D). Importantly, FRCs from cGVHD mice had significantly more BAFF transcripts (Figure 2E), suggesting an increased capacity to produce more BAFF. By contrast, no BAFF transcripts could be detected in CD31+ stromal cells (data not shown). Thus, recipient FRCs are a potential early source of soluble BAFF in mice that develop cGVHD.
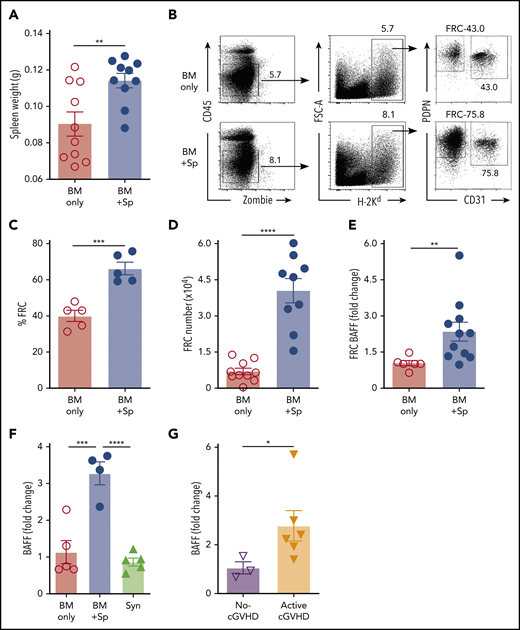
Recipient FRCs and donor CD4+ T cells are potential sources of increased production of soluble BAFF in mice that develop cGVHD. (A) Spleen weights in BM + Sp group mice vs BM only control group mice on day 8 after allo-BMT; n = 10 in each group. (B) Representative flow cytometry of podoplanin/gp38+ (PDPN+) CD31− fibroblastic reticular cells (FRCs) after pregating on Zombie−CD45−H-2Kd+ (recipient) cells. FRCs were isolated from spleen and lymph nodes (LNs) at day 8 post-BMT using an established enzyme digestion strategy as previously described.46 Numbers shown on the flow cytometric plots are cell percentages within each gate. (C) The proportion (%) of FRCs in BM + Sp group vs BM only group at day 8 post-BMT (n = 5 each). Data shown are representative of 3 repeats. (D) Total numbers of PDPN+CD31−MadCaM− FRCs acquired from pooled spleen and identical LNs harvested from within each group. BM + Sp cGVHD group was compared with BM only control group at day 8 post-BMT, as assessed by flow cytometry. Pooled data from 2 independent experiments are shown; n = 10 (BM only) and n = 9 (BM + Sp). (E) BAFF transcript levels in FRCs on day 8 after transplantation isolated from BM + Sp mice or BM only controls. Quantitative polymerase chain reaction (qPCR) data were analyzed using a ΔΔCT method and normalized to BM only group data (set to mean of 1). Fold change, 2−ΔΔCT; n = 6 (BM only) and n = 11 (BM + Sp). (F) BAFF transcript levels as measured by qPCR in CD4+ T cells taken from mice without cGVHD (BM only) vs mice with cGVHD (BM + Sp) or syngeneic BMT recipients (Syn). CD4+ T cells were sorted by flow cytometry from recipient splenocytes at day 50 post-BMT (>95% purity). BAFF transcript was measured by qPCR, analyzed using the ΔΔCT method, and normalized to BM only group data (set to mean of 1). Fold change, 2−ΔΔCT; n = 5 (BM only), n = 4 (BM + Sp), and n = 5 (Syn). (G) BAFF transcripts measured in flow cytometric purified (>98%) CD4+CXCR5+ double-positive T cells, classical TFH cells, taken from peripheral blood mononuclear cells of patients without vs with clinically active cGVHD. BAFF transcripts were assessed by qPCR and analyzed by ΔΔCT method. Fold change, 2−ΔΔCT. Results were normalized to no-cGVHD patient data; n = 3 (no-cGVHD) and n = 6 (active-cGVHD). Statistical analysis was performed by unpaired Student t test with Welch’s correction (A-E,G) or ordinary 1-way analysis of variance with Tukey’s multiple comparisons test (F) using GraphPad Prism 8 software. *P < .05, **P < .01, ***P < .001, ****P < .0001. NS, not significant (P > .05).
Recipient FRCs and donor CD4+ T cells are potential sources of increased production of soluble BAFF in mice that develop cGVHD. (A) Spleen weights in BM + Sp group mice vs BM only control group mice on day 8 after allo-BMT; n = 10 in each group. (B) Representative flow cytometry of podoplanin/gp38+ (PDPN+) CD31− fibroblastic reticular cells (FRCs) after pregating on Zombie−CD45−H-2Kd+ (recipient) cells. FRCs were isolated from spleen and lymph nodes (LNs) at day 8 post-BMT using an established enzyme digestion strategy as previously described.46 Numbers shown on the flow cytometric plots are cell percentages within each gate. (C) The proportion (%) of FRCs in BM + Sp group vs BM only group at day 8 post-BMT (n = 5 each). Data shown are representative of 3 repeats. (D) Total numbers of PDPN+CD31−MadCaM− FRCs acquired from pooled spleen and identical LNs harvested from within each group. BM + Sp cGVHD group was compared with BM only control group at day 8 post-BMT, as assessed by flow cytometry. Pooled data from 2 independent experiments are shown; n = 10 (BM only) and n = 9 (BM + Sp). (E) BAFF transcript levels in FRCs on day 8 after transplantation isolated from BM + Sp mice or BM only controls. Quantitative polymerase chain reaction (qPCR) data were analyzed using a ΔΔCT method and normalized to BM only group data (set to mean of 1). Fold change, 2−ΔΔCT; n = 6 (BM only) and n = 11 (BM + Sp). (F) BAFF transcript levels as measured by qPCR in CD4+ T cells taken from mice without cGVHD (BM only) vs mice with cGVHD (BM + Sp) or syngeneic BMT recipients (Syn). CD4+ T cells were sorted by flow cytometry from recipient splenocytes at day 50 post-BMT (>95% purity). BAFF transcript was measured by qPCR, analyzed using the ΔΔCT method, and normalized to BM only group data (set to mean of 1). Fold change, 2−ΔΔCT; n = 5 (BM only), n = 4 (BM + Sp), and n = 5 (Syn). (G) BAFF transcripts measured in flow cytometric purified (>98%) CD4+CXCR5+ double-positive T cells, classical TFH cells, taken from peripheral blood mononuclear cells of patients without vs with clinically active cGVHD. BAFF transcripts were assessed by qPCR and analyzed by ΔΔCT method. Fold change, 2−ΔΔCT. Results were normalized to no-cGVHD patient data; n = 3 (no-cGVHD) and n = 6 (active-cGVHD). Statistical analysis was performed by unpaired Student t test with Welch’s correction (A-E,G) or ordinary 1-way analysis of variance with Tukey’s multiple comparisons test (F) using GraphPad Prism 8 software. *P < .05, **P < .01, ***P < .001, ****P < .0001. NS, not significant (P > .05).
Just before disease manifested, BAFF levels in WT BM + Sp recipients trended higher than in BAFF KO BM + Sp recipients (mean, 96.7 ng/mL [Figure 1A] vs 83.3 ng/mL [Figure 1D], respectively), suggesting donor cells may also be sources of BAFF in cGVHD. Therefore, we examined BAFF transcript levels in SLOs and donor-derived blood cells. Because follicular helper T cells (TFH) from healthy mice are known to produce BAFF in the germinal center (GC) niche postimmunization and insufficient CD4+CXCR5+ TFH cells were found in SLOs in our diseased mice on day 37,48 we examined total CD4+ T cells from the spleens of cGVHD vs control mice. In cGVHD mice, we found increased BAFF messenger RNA in cGVHD CD4+ T cells (Figure 2F). Interestingly, TFH from patients with clinically active cGVHD also had significantly increased BAFF transcripts compared with those from patients who never had cGVHD (Figure 2G). By contrast, BAFF transcript results in diseased and nondiseased neutrophils, CD8+ T cells, B cells, and macrophages/monocytes from mice (supplemental Figure 2C) and patients were similar (data not shown). Together our data indicate that excess BAFF protein levels are not merely a reflection of low peripheral B-cell counts and that alloreactive T cells also account for lesional tissue increases in BAFF production.
High BAFF occupies BAFF-R and promotes an altered peripheral B-cell compartment in cGVHD mice
Although steady B-cell recovery occurred after BM only or Syn-BMT,36 cGVHD mice maintained relatively low total blood and splenic B-cell numbers despite high BAFF levels (supplemental Figure 3A-C). Thus, BAFF concentration per B cell (BAFF/B-cell ratio) after allo-BMT in mice with cGVHD manifestations was significantly increased compared with mice without cGVHD (BM only) or control Syn-BMT mice (Figure 3A). In the absence of alloantigen, BAFF promotes late CD93+ T2 to T3 populations.49-51 After allo-BMT, we found that cGVHD mice had significant proportional increases in transitional CD19+CD93+ B cells and a significant enrichment of T3 B cells (supplemental Figure 3D; Figure 3B-C). T3 cells are generally anergic and unable to mature.51-53 Therefore, our data suggest that BAFF promotes B-cell anergy after allo-BMT in cGVHD mice.
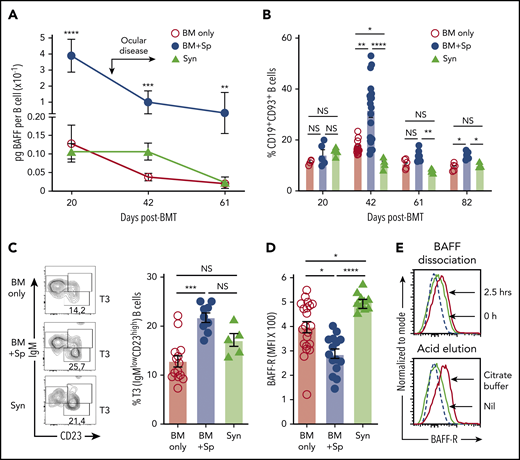
High soluble BAFF levels are associated with an altered peripheral B-cell compartment and low BAFF-R detectability on B cells in mice with cGVHD manifestations. (A) Calculated BAFF/B-cell ratios over time after BMT in mice that develop (BM + Sp) vs do not develop cGVHD manifestations (BM only and Syn). BAFF levels shown in Figure 1A and peripheral blood B-cell numbers (supplemental Figure 3A) were used to calculate BAFF per B-cell ratios as shown. Data are representative of 3 repeats; n = 10 (BM + Sp and BM only) and n = 5 (Syn). Arrow indicates the median time of onset of ocular GVHD manifestations day 30 post-BMT.41 (B) Relative proportion of transitional B cells in peripheral blood from mice that develop (BM + Sp) vs those that do not develop cGVHD (BM only and Syn). Total CD19+CD93+ transitional B cells in peripheral blood were assessed by flow cytometry after allo-BMT. Day 42 data shown are combined from 4 independent experiments; n = 5 of each group at days 20, 61, and 82; n = 20 (BM only), n = 18 (BM + Sp), and n = 5 (Syn) at day 42. (C) Representative contour plot of flow cytometric data of pregated CD93+ B cells examined for IgM and CD23 staining. Frequency of transitional 3 (T3) B cells from the blood of cGVHD mice (BM + Sp) compared with controls (BM only and Syn) is shown on day 42 post-BMT. T3 cells were identified by gating on CD19+CD93+IgMlowCD23high cells (shown on left panels as contour plots); numbers are percentage of T3 cells. Data shown are combined data from 3 separate experiments; n = 13 (BM only), n = 9 (BM + Sp), and n = 5 (Syn). (D) BAFF-R on the surface of B cells from the blood of mice with (BM + Sp) or without cGVHD (BM only and Syn) on days 34 to 36 after allo-BMT. BAFF-R staining using anti–BAFF-R antibody (clone 7H22-E16; Biolegend) of whole blood was performed using flow cytometry by pregating on 7-AAD−CD19+ live B cells before median fluorescence intensity of BAFF-R was determined. Data shown were pooled from 2 separate experiments; n = 21 (BM only), n = 15 (BM + Sp), and n = 10 (Syn includes both Syn BM only, n = 5 and Syn BM + Sp, n = 5 combined). (E) Examination of BAFF-R on BAFF Tg B cells for BAFF occupancy using BAFF dissociation and acid elution methods. Top panel shows the BAFF dissociation assay that was performed as follows. Splenocytes of BAFF Tg mice were incubated for 2.5 hours in 4 mL of RPMI complete medium at 37°C and pipetted every 30 minutes. Bottom panel shows the acid elusion assay that was performed as follows. Peripheral blood cells from BAFF Tg mice were pelleted after red blood cells were lysed, quickly suspended in citrate buffer (pH, 2.4) for 1 minute at room temperature, and then immediately diluted in PBS to stop the reaction. BAFF-R expression was assessed by flow cytometric analysis, with pregating on CD19+Zombie− live cells. Dashed line represents the isotype control histogram. Solid lines indicate BAFF-R–stained cells. Statistical analysis was performed by Kruskal-Wallis test (A-D) using GraphPad Prism 8 software. *P < .05, **P < .01, ***P < .001, ****P < .0001. NS, not significant (P > .05).
High soluble BAFF levels are associated with an altered peripheral B-cell compartment and low BAFF-R detectability on B cells in mice with cGVHD manifestations. (A) Calculated BAFF/B-cell ratios over time after BMT in mice that develop (BM + Sp) vs do not develop cGVHD manifestations (BM only and Syn). BAFF levels shown in Figure 1A and peripheral blood B-cell numbers (supplemental Figure 3A) were used to calculate BAFF per B-cell ratios as shown. Data are representative of 3 repeats; n = 10 (BM + Sp and BM only) and n = 5 (Syn). Arrow indicates the median time of onset of ocular GVHD manifestations day 30 post-BMT.41 (B) Relative proportion of transitional B cells in peripheral blood from mice that develop (BM + Sp) vs those that do not develop cGVHD (BM only and Syn). Total CD19+CD93+ transitional B cells in peripheral blood were assessed by flow cytometry after allo-BMT. Day 42 data shown are combined from 4 independent experiments; n = 5 of each group at days 20, 61, and 82; n = 20 (BM only), n = 18 (BM + Sp), and n = 5 (Syn) at day 42. (C) Representative contour plot of flow cytometric data of pregated CD93+ B cells examined for IgM and CD23 staining. Frequency of transitional 3 (T3) B cells from the blood of cGVHD mice (BM + Sp) compared with controls (BM only and Syn) is shown on day 42 post-BMT. T3 cells were identified by gating on CD19+CD93+IgMlowCD23high cells (shown on left panels as contour plots); numbers are percentage of T3 cells. Data shown are combined data from 3 separate experiments; n = 13 (BM only), n = 9 (BM + Sp), and n = 5 (Syn). (D) BAFF-R on the surface of B cells from the blood of mice with (BM + Sp) or without cGVHD (BM only and Syn) on days 34 to 36 after allo-BMT. BAFF-R staining using anti–BAFF-R antibody (clone 7H22-E16; Biolegend) of whole blood was performed using flow cytometry by pregating on 7-AAD−CD19+ live B cells before median fluorescence intensity of BAFF-R was determined. Data shown were pooled from 2 separate experiments; n = 21 (BM only), n = 15 (BM + Sp), and n = 10 (Syn includes both Syn BM only, n = 5 and Syn BM + Sp, n = 5 combined). (E) Examination of BAFF-R on BAFF Tg B cells for BAFF occupancy using BAFF dissociation and acid elution methods. Top panel shows the BAFF dissociation assay that was performed as follows. Splenocytes of BAFF Tg mice were incubated for 2.5 hours in 4 mL of RPMI complete medium at 37°C and pipetted every 30 minutes. Bottom panel shows the acid elusion assay that was performed as follows. Peripheral blood cells from BAFF Tg mice were pelleted after red blood cells were lysed, quickly suspended in citrate buffer (pH, 2.4) for 1 minute at room temperature, and then immediately diluted in PBS to stop the reaction. BAFF-R expression was assessed by flow cytometric analysis, with pregating on CD19+Zombie− live cells. Dashed line represents the isotype control histogram. Solid lines indicate BAFF-R–stained cells. Statistical analysis was performed by Kruskal-Wallis test (A-D) using GraphPad Prism 8 software. *P < .05, **P < .01, ***P < .001, ****P < .0001. NS, not significant (P > .05).
To examine if BAFF affected BAFF receptors on B cells in cGVHD, we capitalized on the known decrease in BAFF-R detection after occupancy by soluble BAFF.12,54 Significantly lower BAFF-R was detected on B cells from cGVHD mice (Figure 3D). To determine whether BAFF-R was occupied by BAFF, we performed dissociation and acid elution assays. As shown in Figure 3E, BAFF was readily removed from BAFF-R under both conditions, affirming that low BAFF-R detectability in cGVHD mice reflected receptor occupation by BAFF.54 Additionally, we found that the BAFF receptor with known negative regulatory capacity, transmembrane activator and CAML interactor, was decreased,55 whereas B-cell maturation antigen trended higher but did not reach statistical significance (P = .41; supplemental Figure 4A-B). These data suggest that BAFF promotes activation rather than survival of most B cells in cGVHD.
BAFF and alloantigen synergistically promote circulating and lesional tissue BCR-responsive GL7+ B cells
Given the known role of BAFF in BCR activation56 and that of the proximal BCR signaling molecule SYK in cGVHD development,15,18,41 we examined relative B-cell responses to surrogate BCR agonist. We found that a subset of B cells from mice with cGVHD manifestations had increased responsiveness to BCR stimulation (Figure 4A). Total blood B cells from cGVHD mice had increased SYK and BLNK activation after ex vivo stimulation through the BCR (supplemental Figure 5A-B). We previously found that mice treated with SYK inhibitors had decreased peripheral blood GL7+ B cells.18,41,57,58 Therefore, we examined whether GL7+ cells had increased SYK phosphorylation and found significantly increased phosphorylated SYK in GL7+ B cells, which was further significantly increased in the cGVHD setting (Figure 4B). Differential IgM expression alone did not account for differences in BCR response, because most IgMhigh B cells were also GL7+ (Figure 4C; supplemental Figure 5C-D). Recombinant BAFF promoted BCR activation–driven GL7+ B cells and GL7 expression on healthy mouse B cells (Figure 4D; supplemental Figure 5E). Consistent with this, we found the percentage of circulating GL7+ B cells in cGVHD mice relative to control mice was significantly and persistently increased (Figure 4E) when BAFF was high in vivo (Figure 1A). Likewise, cGVHD mice with significantly increased clinical eye scores (Figure 4F) had a significant proportional increase in conjunctival GL7+ B cells59 (Figure 4G). Circulating GL7+ B cells are not GC B cells, because they do not express CD95 (supplemental Figure 6A-B). The frequency of GL7+ B cells was increased in spleen by day 30 post-BMT (supplemental Figure 6C). Together, these data suggest that BAFF acts synergistically with alloantigen to promote circulating GL7+ BCR-activated B cells in cGVHD.
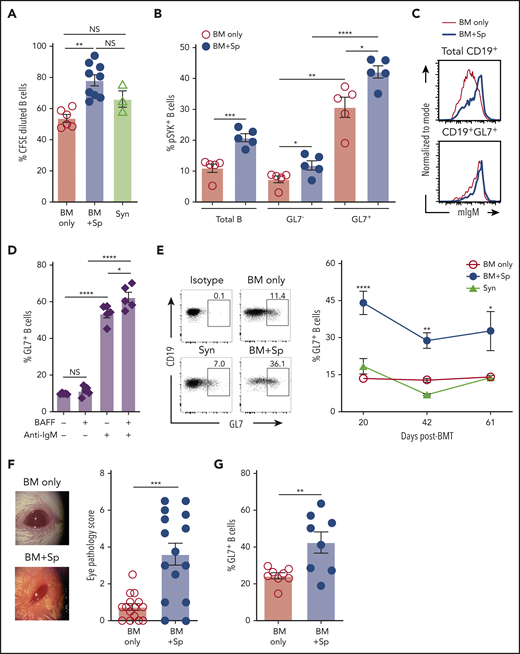
Excess BAFF after allo-BMT is associated with increased BCR-activated circulating and lesional tissue GL7+ B cells in cGVHD. (A) Relative response to BCR agonist by B cells from mice with (BM + Sp) vs without cGVHD manifestations (BM only and Syn). Five days after ex vivo BCR stimulation with anti-IgM (10 µg/mL), BCR activation was measured by pregating on live 7-AAD−CD19+ splenic B cells in CFSE dilution assay. Activated dividing cells dilute CFSE as they proliferate. Data were pooled from 3 separate experiments performed on splenocytes from mice euthanized at the end of BMT experiments (on days 83, 88, and 98 post-BMT); n = 6 (BM only), n = 9 (BM + Sp), and n = 3 (Syn). (B) Proportion of phosphorylated SYK (pSYK) in B cells from cGVHD mice compared with control mice after ex vivo BCR stimulation. Shown are the relative frequencies of pSYK+ B cells after pregating on total B cells or pSYK+ B cells of the GL7− vs GL7+ B-cell subsets. Peripheral blood was taken from mice on day 54 after allo-BMT, red blood cells were lysed, and peripheral blood mononuclear cells were stimulated with anti-IgM (10 µg/mL) for 5 minutes before fixation and phosphoflow staining for flow cytometric analysis; n = 5 of each group. (C) Relative cell surface expression of IgM on total CD19+ B cells and GL7+ B cells. Representative flow cytometric histograms are shown after staining for cell surface membrane–bound IgM on total B cells (top panel) or on the GL7+ B-cell subset (bottom panel) in peripheral blood of cGVHD (BM + Sp) mice vs no cGVHD (BM only) mice at day 42 post-BMT. Cells were pregated on Zombie−CD19+ cells (top panel) or pregated on Zombie−CD19+GL7+ cells (bottom panel). (D) BAFF together with BCR stimulation promotes GL7 expression. Proportion of GL7+ B cells after treatment with surrogate antigen with or without exogenous recombinant BAFF was evaluated. B cells isolated from the blood of naïve mice were treated with 5 µg/mL of anti-IgM or vehicle control overnight (18 hours) with or without additional BAFF (5 ng/mL) before the frequency of Zombie−CD19+GL7+ B cells was measured by flow cytometry; n = 5. (E) Circulating GL7+ B-cell frequencies over time after allo-BMT in cGVHD (BM + Sp) mice compared with no cGVHD control allo-BMT (BM only) mice and Syn control mice. Representative flow cytometric profiles were from analysis of peripheral blood on day 42 post-BMT. Numbers represent the percentages of GL7+ B cells after pregating on Zombie−CD19+ live cells. Data were pooled from 2 experiments; n = 15 (BM only), n = 9 (BM + Sp), and n = 5 (Syn). (F) Eye scores in diseased (BM + Sp) vs nondiseased (BM only) mice at day 35 after allo-BMT, assessed in a masked fashion. Representative photographs taken under ×3.2 magnification using a Zeiss Stemi 2000-C stereo microscope with Nikon Coolpix P5100 camera. Eye scores were calculated by adding scores for the following related manifestations: chemosis, mucoid discharge, and corneal opacity; n = 15 of each group. (G) Proportion of GL7+ cells in parent gate of CD19+ B cells by flow cytometric analysis of cells isolated from conjunctival tissue samples from mice with or without cGVHD at day 42 or 43 after allo-BMT. This result was combined from 2 experiments; n = 8 of each group. Statistical analysis was performed by Kruskal-Wallis test (A,E), unpaired Student t test with Welch’s correction (B,G), ordinary 1-way analysis of variance with Tukey’s multiple comparisons test (D), or Mann-Whitney test (F) using GraphPad Prism 8 software. *P < .05, **P < .01, ***P < .001, ****P < .0001. NS, not significant (P > .05).
Excess BAFF after allo-BMT is associated with increased BCR-activated circulating and lesional tissue GL7+ B cells in cGVHD. (A) Relative response to BCR agonist by B cells from mice with (BM + Sp) vs without cGVHD manifestations (BM only and Syn). Five days after ex vivo BCR stimulation with anti-IgM (10 µg/mL), BCR activation was measured by pregating on live 7-AAD−CD19+ splenic B cells in CFSE dilution assay. Activated dividing cells dilute CFSE as they proliferate. Data were pooled from 3 separate experiments performed on splenocytes from mice euthanized at the end of BMT experiments (on days 83, 88, and 98 post-BMT); n = 6 (BM only), n = 9 (BM + Sp), and n = 3 (Syn). (B) Proportion of phosphorylated SYK (pSYK) in B cells from cGVHD mice compared with control mice after ex vivo BCR stimulation. Shown are the relative frequencies of pSYK+ B cells after pregating on total B cells or pSYK+ B cells of the GL7− vs GL7+ B-cell subsets. Peripheral blood was taken from mice on day 54 after allo-BMT, red blood cells were lysed, and peripheral blood mononuclear cells were stimulated with anti-IgM (10 µg/mL) for 5 minutes before fixation and phosphoflow staining for flow cytometric analysis; n = 5 of each group. (C) Relative cell surface expression of IgM on total CD19+ B cells and GL7+ B cells. Representative flow cytometric histograms are shown after staining for cell surface membrane–bound IgM on total B cells (top panel) or on the GL7+ B-cell subset (bottom panel) in peripheral blood of cGVHD (BM + Sp) mice vs no cGVHD (BM only) mice at day 42 post-BMT. Cells were pregated on Zombie−CD19+ cells (top panel) or pregated on Zombie−CD19+GL7+ cells (bottom panel). (D) BAFF together with BCR stimulation promotes GL7 expression. Proportion of GL7+ B cells after treatment with surrogate antigen with or without exogenous recombinant BAFF was evaluated. B cells isolated from the blood of naïve mice were treated with 5 µg/mL of anti-IgM or vehicle control overnight (18 hours) with or without additional BAFF (5 ng/mL) before the frequency of Zombie−CD19+GL7+ B cells was measured by flow cytometry; n = 5. (E) Circulating GL7+ B-cell frequencies over time after allo-BMT in cGVHD (BM + Sp) mice compared with no cGVHD control allo-BMT (BM only) mice and Syn control mice. Representative flow cytometric profiles were from analysis of peripheral blood on day 42 post-BMT. Numbers represent the percentages of GL7+ B cells after pregating on Zombie−CD19+ live cells. Data were pooled from 2 experiments; n = 15 (BM only), n = 9 (BM + Sp), and n = 5 (Syn). (F) Eye scores in diseased (BM + Sp) vs nondiseased (BM only) mice at day 35 after allo-BMT, assessed in a masked fashion. Representative photographs taken under ×3.2 magnification using a Zeiss Stemi 2000-C stereo microscope with Nikon Coolpix P5100 camera. Eye scores were calculated by adding scores for the following related manifestations: chemosis, mucoid discharge, and corneal opacity; n = 15 of each group. (G) Proportion of GL7+ cells in parent gate of CD19+ B cells by flow cytometric analysis of cells isolated from conjunctival tissue samples from mice with or without cGVHD at day 42 or 43 after allo-BMT. This result was combined from 2 experiments; n = 8 of each group. Statistical analysis was performed by Kruskal-Wallis test (A,E), unpaired Student t test with Welch’s correction (B,G), ordinary 1-way analysis of variance with Tukey’s multiple comparisons test (D), or Mann-Whitney test (F) using GraphPad Prism 8 software. *P < .05, **P < .01, ***P < .001, ****P < .0001. NS, not significant (P > .05).
BAFF promotes BCR responsiveness by increasing NOTCH2 expression on aberrant circulating cGVHD B cells
To determine if BAFF after T cell–depleted allo-BMT affected BCR responses, we examined cells from mice undergoing allo-BMT and recipients of BAFF Tg BM only. B cells from recipients of BAFF Tg BM only were more BCR responsive compared with B cells from WT BM only controls (Figure 5A). This increased BCR responsiveness was not related to differences in surface IgM density, which was similar between groups (supplemental Figure 7A). Because anti-NOTCH2 (NRR2) antibody blocked GL7+ B cells in another mouse model of cGVHD,17 we examined NOTCH2 expression on GL7+ B cells. We found that diseased mice had a significant increase in a NOTCH2 and GL7 double-positive (NOTCH2+GL7+) B-cell subset after onset of disease manifestations compared with control allogeneic or syngeneic recipients (Figure 5B-C). B cells from active cGVHD patients maintain higher NOTCH2 expression after ex vivo stimulation and are highly responsive to NOTCH ligand plus BCR stimulation,16 suggesting that BAFF may promote BCR hyperresponsiveness in part through increases in NOTCH2 expression and activation.
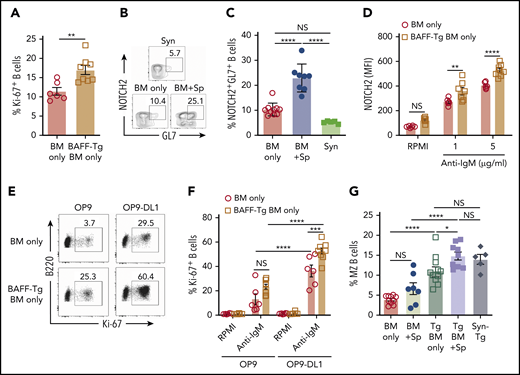
NOTCH2 is increased and inducible after in vivo exposure to high BAFF and alloantigen and associated with increased responsiveness to surrogate antigen and Notch ligand. (A) BCR activation assay comparing B cells from BAFF Tg BM only mice vs WT BM only recipients. Peripheral blood was collected at day 42 post-BMT, and B cells were stimulated with anti-IgM (10 µg/mL) for 4 days; frequency of 7-AAD−B220+Ki-67+ cells was analyzed by intracellular staining and flow cytometry; n = 6 (BM only) and n = 8 (BAFF Tg BM only). (B) Representative flow cytometric plot showing coexpression of the activation marker GL7 and NOTCH2 on a subset of B cells. Pregating was on 7-AAD−CD19+ cells. (C) Proportion of NOTCH2+GL7+ B cells in mice with cGVHD manifestations. Blood samples were obtained on day 36 after allo-BMT. GL7 and NOTCH2 expression was assessed by flow cytometry, and B cells were pregated on 7-AAD−CD19+ cells; n = 10 (BM only), n = 8 (BM + Sp), and n = 5 (Syn). (D) NOTCH2 expression by flow cytometric analysis of gated 7-AAD−CD19+ B cells after BCR stimulation. Blood samples were obtained on day 80 after allo-BMT. After lysis of red blood cells, the cells were stimulated with anti-IgM (1 or 5 µg/mL) overnight (for 18 hours). Expression of NOTCH2 was analyzed by flow cytometry, and median fluorescence intensity was used to indicate the level of NOTCH2 expression; n = 6 (WT BM only) and n = 8 (BAFF Tg BM only). (E-F) B-cell response to the NOTCH ligand Delta-like 1 (DL1) after exposure to soluble BAFF with or without BCR stimulation. Blood samples were obtained on day 105 after allo-BMT, red blood cells were lysed, and cells were added to a cell culture plate that had been seeded with OP9 cells lacking or expressing DL1 before culturing for 48 hours in the presence or absence of anti-IgM (10 μg/mL). Intracellular staining for Ki-67 was used to assess response to stimulation. Representative flow cytometric profiles are shown in panel E, with the results summarized in panel F. Numbers in panel E are frequencies of 7-AAD−B220+Ki-67+ cells; n = 6 (WT BM only) and n = 8 (BAFF Tg BM only). (G) Frequency of marginal zone (MZ) B cells as assessed by flow cytometry. Cells were pregated on Zombie−CD19+CD93− cells, with additional gating on CD21highCD23low cells to identify MZ B cells. Syn BAFF Tg transplant recipients only received BAFF Tg BM cells. Data were combined from 3 individual experiments. Splenocytes were analyzed at day 84 or 92 post-BMT; n = 10 (BM only), n = 8 (BM + Sp), n = 12 (BAFF Tg BM only), n = 9 (BAFF Tg BM + Sp), and n = 5 (Syn BAFF Tg). Statistical analysis was performed by unpaired Student t test with Welch’s correction (A), ordinary 1-way analysis of variance (ANOVA) with Tukey’s multiple comparisons test (C,G), or ordinary 2-way ANOVA (D,F) using GraphPad Prism 8 software. *P < .05, **P < .01, ***P < .001, ****P < .0001. NS, not significant (P > .05).
NOTCH2 is increased and inducible after in vivo exposure to high BAFF and alloantigen and associated with increased responsiveness to surrogate antigen and Notch ligand. (A) BCR activation assay comparing B cells from BAFF Tg BM only mice vs WT BM only recipients. Peripheral blood was collected at day 42 post-BMT, and B cells were stimulated with anti-IgM (10 µg/mL) for 4 days; frequency of 7-AAD−B220+Ki-67+ cells was analyzed by intracellular staining and flow cytometry; n = 6 (BM only) and n = 8 (BAFF Tg BM only). (B) Representative flow cytometric plot showing coexpression of the activation marker GL7 and NOTCH2 on a subset of B cells. Pregating was on 7-AAD−CD19+ cells. (C) Proportion of NOTCH2+GL7+ B cells in mice with cGVHD manifestations. Blood samples were obtained on day 36 after allo-BMT. GL7 and NOTCH2 expression was assessed by flow cytometry, and B cells were pregated on 7-AAD−CD19+ cells; n = 10 (BM only), n = 8 (BM + Sp), and n = 5 (Syn). (D) NOTCH2 expression by flow cytometric analysis of gated 7-AAD−CD19+ B cells after BCR stimulation. Blood samples were obtained on day 80 after allo-BMT. After lysis of red blood cells, the cells were stimulated with anti-IgM (1 or 5 µg/mL) overnight (for 18 hours). Expression of NOTCH2 was analyzed by flow cytometry, and median fluorescence intensity was used to indicate the level of NOTCH2 expression; n = 6 (WT BM only) and n = 8 (BAFF Tg BM only). (E-F) B-cell response to the NOTCH ligand Delta-like 1 (DL1) after exposure to soluble BAFF with or without BCR stimulation. Blood samples were obtained on day 105 after allo-BMT, red blood cells were lysed, and cells were added to a cell culture plate that had been seeded with OP9 cells lacking or expressing DL1 before culturing for 48 hours in the presence or absence of anti-IgM (10 μg/mL). Intracellular staining for Ki-67 was used to assess response to stimulation. Representative flow cytometric profiles are shown in panel E, with the results summarized in panel F. Numbers in panel E are frequencies of 7-AAD−B220+Ki-67+ cells; n = 6 (WT BM only) and n = 8 (BAFF Tg BM only). (G) Frequency of marginal zone (MZ) B cells as assessed by flow cytometry. Cells were pregated on Zombie−CD19+CD93− cells, with additional gating on CD21highCD23low cells to identify MZ B cells. Syn BAFF Tg transplant recipients only received BAFF Tg BM cells. Data were combined from 3 individual experiments. Splenocytes were analyzed at day 84 or 92 post-BMT; n = 10 (BM only), n = 8 (BM + Sp), n = 12 (BAFF Tg BM only), n = 9 (BAFF Tg BM + Sp), and n = 5 (Syn BAFF Tg). Statistical analysis was performed by unpaired Student t test with Welch’s correction (A), ordinary 1-way analysis of variance (ANOVA) with Tukey’s multiple comparisons test (C,G), or ordinary 2-way ANOVA (D,F) using GraphPad Prism 8 software. *P < .05, **P < .01, ***P < .001, ****P < .0001. NS, not significant (P > .05).
To test whether NOTCH2 expression after BCR NOTCH activation16 was influenced by BAFF, we examined NOTCH2 expression on B cells after allo-BMT either with or without in vivo exposure to excess BAFF. Strikingly, we found that B cells maintained in an alloantigen-rich, excess BAFF (BAFF Tg) environment had significantly higher NOTCH2 expression after ex vivo engagement of BCR (Figure 5D; supplemental Figure 7B). To determine if BAFF influenced the BCR-NOTCH2 signaling axis in our cGVHD model, we stimulated B cells from BAFF Tg allo-BMT mice with NOTCH ligand and surrogate antigen. B cells were significantly more responsive to BCR agonist when Delta-like 1 was also present (Figure 5E-F). MZ B cells rely on NOTCH2 expression and have a decreased BCR signaling threshold. Extensive analyses of blood and spleen for CD93−CD21highCD23low MZ B cells revealed that typical MZ B cells were not increased in cGVHD mice, and MZ B cells were not generally detectable in the blood of any BMT mice, including those with BAFF Tg donors (supplemental Figure 8A-B). Only in the spleen when BAFF was overexpressed after BMT, even in the absence of alloantigen (Syn BAFF Tg), were MZ B cells proportionally increased (supplemental Figure 8B; Figure 5G). Thus, although increased BAFF did not promote classical MZ B cells, we found that circulating B cells exposed to high levels of BAFF in vivo were MZ-like, with significantly higher responsiveness to BCR and NOTCH agonists.
High BAFF environments afford SYK protein maintenance even after antigen encounter
To determine if BAFF affected SYK protein, we analyzed B cells from BAFF Tg vs WT mice and found that B cells with high SYK and BLNK levels were maintained after in vitro BCR engagement after high BAFF exposure in vivo (Figure 6A; supplemental Figure 9A). Like cGVHD patient B cells,15 B cells from cGVHD mice had increased intracellular SYK and BLNK (Figure 6B; supplemental Figure 9B-D). To dampen aberrant BCR responsiveness, SYK protein is typically degraded after BCR engagement.60,61 Strikingly, B cells from a high BAFF environment maintained higher SYK protein levels 18 hours after in vitro BCR engagement (Figure 6C). These findings in the BAFF Tg B cells were not related to differences in IgM expression (supplemental Figure 9E). We then examined whether SYK protein half-life was prolonged in B cells from high BAFF environments, comparing SYK levels in BAFF Tg and WT B cells after stopping protein synthesis in a classical cycloheximide chase assay. As shown in Figure 6D-E, SYK levels remained significantly higher both before and after ex vivo BCR stimulation if B cells were from BAFF Tg mice, further suggesting that BAFF promotes the proximal BCR signalosome before and after antigen engagement.
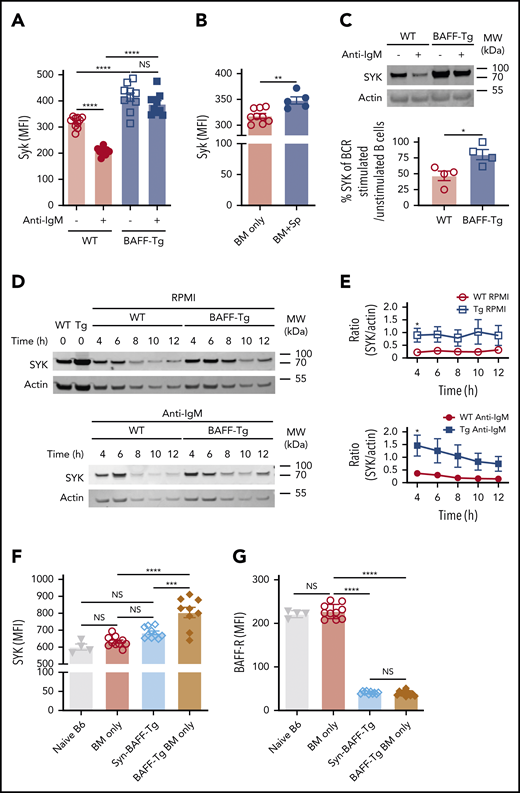
B cells from mice with cGVHD manifestations maintain high levels of the proximal BCR signaling protein SYK after ex vivo BCR engagement. (A) SYK protein expression level after BCR engagement. Blood B cells from WT or BAFF Tg mice were left as resting or stimulated with anti-IgM (10 µg/mL) overnight (18 hours). Expression of SYK was assessed by intracellular staining and flow cytometric analysis, with pregating on Zombie−B220+ cells; n = 10 of each group. (B) Intracellular staining for SYK protein levels in blood B cells of BM only and BM + Sp mice determined at day 66 post-BMT using flow cytometry. We pregated on Zombie−B220+ live B cells, and median fluorescence intensity (MFI) was used to determine relative expression of SYK protein. Results shown are a representative of 3 repeats; n = 9 (BM only) and n = 5 (BM + Sp). (C) Percentage of normalized BCR-stimulated SYK to unstimulated SYK. Representative SYK protein by western blot before and after BCR stimulation with anti-IgM (10 µg/mL) in purified splenic B cells from a WT mouse compared with a BAFF Tg mouse (upper panels). Western blot was repeated 4 times. Intensity of SYK and actin bands on the western blots was analyzed using Image Studio Lite software. Intensity of SYK was normalized to intensity of actin. Percentage of normalized BCR-stimulated SYK to unstimulated SYK is shown in the graph (bottom panel); n = 4 of each group. (D) Cycloheximide chase assay to assess SYK protein stability in B cells from WT vs BAFF Tg mice. Purified splenic B cells from WT or BAFF Tg mice were first treated with cycloheximide (10 µg/mL) overnight (18 hours) to stop protein synthesis. B cells were then left as resting (top panels) or stimulated with anti-IgM (10 µg/mL, bottom panels) for different time points before SYK and actin were assessed by western blot. Western blot result is a representative experiment from 5 repeats. (E) SYK protein over time without (top) or after (bottom) BCR stimulation in B cells taken from WT vs BAFF-overexpressing (Tg) mice. Intensity of SYK and actin from western blot data was determined using Image Studio Lite software for unstimulated cells (top panel) and anti-IgM stimulated cells (bottom panel) over time. SYK/actin ratio was calculated and is shown in panel E; n = 5 of each group. (F) Intracellular SYK protein levels in peripheral blood B cells from nontransplanted naïve mice or recipients of T cell–depleted WT allo-BMT (BM only), Syn BAFF Tg BM only vs BAFF Tg BM only at day 159 after allo-BMT. Fixed and permeabilized peripheral blood mononuclear cells were stained intracellularly and analyzed by flow cytometry, with pregating on Zombie−B220+ B cells, and MFI was used to represent the relative amounts of SYK protein; n = 9 (BAFF Tg BM only), n = 10 (WT BM only or Syn group), and n = 4 (naïve B6 mice). (G) Comparison of cell surface BAFF-R expression on blood B cells taken from WT BM only, BAFF Tg BM only, or BAFF Tg Syn BMT mice on day 137. BAFF-R staining of B cells from nontransplanted naïve B6 mice is shown on the far left for reference. MFI of BAFF-R was determined after gating on live Zombie−CD19+ B cells; n = 10 each group (WT BM only, BAFF Tg BM only, or BAFF Tg Syn) and n = 4 (naïve B6). Statistical analysis was performed by ordinary 1-way analysis of variance with Tukey’s multiple comparisons test (A,F-G), unpaired Student t test with Welch’s correction (B), Mann-Whitney test (C), or multiple Student t tests with few assumptions (E) using GraphPad Prism 8 software. *P < .05, **P < .01, ***P < .001, ****P < .0001. MW, molecular weight; NS, not significant (P > .05).
B cells from mice with cGVHD manifestations maintain high levels of the proximal BCR signaling protein SYK after ex vivo BCR engagement. (A) SYK protein expression level after BCR engagement. Blood B cells from WT or BAFF Tg mice were left as resting or stimulated with anti-IgM (10 µg/mL) overnight (18 hours). Expression of SYK was assessed by intracellular staining and flow cytometric analysis, with pregating on Zombie−B220+ cells; n = 10 of each group. (B) Intracellular staining for SYK protein levels in blood B cells of BM only and BM + Sp mice determined at day 66 post-BMT using flow cytometry. We pregated on Zombie−B220+ live B cells, and median fluorescence intensity (MFI) was used to determine relative expression of SYK protein. Results shown are a representative of 3 repeats; n = 9 (BM only) and n = 5 (BM + Sp). (C) Percentage of normalized BCR-stimulated SYK to unstimulated SYK. Representative SYK protein by western blot before and after BCR stimulation with anti-IgM (10 µg/mL) in purified splenic B cells from a WT mouse compared with a BAFF Tg mouse (upper panels). Western blot was repeated 4 times. Intensity of SYK and actin bands on the western blots was analyzed using Image Studio Lite software. Intensity of SYK was normalized to intensity of actin. Percentage of normalized BCR-stimulated SYK to unstimulated SYK is shown in the graph (bottom panel); n = 4 of each group. (D) Cycloheximide chase assay to assess SYK protein stability in B cells from WT vs BAFF Tg mice. Purified splenic B cells from WT or BAFF Tg mice were first treated with cycloheximide (10 µg/mL) overnight (18 hours) to stop protein synthesis. B cells were then left as resting (top panels) or stimulated with anti-IgM (10 µg/mL, bottom panels) for different time points before SYK and actin were assessed by western blot. Western blot result is a representative experiment from 5 repeats. (E) SYK protein over time without (top) or after (bottom) BCR stimulation in B cells taken from WT vs BAFF-overexpressing (Tg) mice. Intensity of SYK and actin from western blot data was determined using Image Studio Lite software for unstimulated cells (top panel) and anti-IgM stimulated cells (bottom panel) over time. SYK/actin ratio was calculated and is shown in panel E; n = 5 of each group. (F) Intracellular SYK protein levels in peripheral blood B cells from nontransplanted naïve mice or recipients of T cell–depleted WT allo-BMT (BM only), Syn BAFF Tg BM only vs BAFF Tg BM only at day 159 after allo-BMT. Fixed and permeabilized peripheral blood mononuclear cells were stained intracellularly and analyzed by flow cytometry, with pregating on Zombie−B220+ B cells, and MFI was used to represent the relative amounts of SYK protein; n = 9 (BAFF Tg BM only), n = 10 (WT BM only or Syn group), and n = 4 (naïve B6 mice). (G) Comparison of cell surface BAFF-R expression on blood B cells taken from WT BM only, BAFF Tg BM only, or BAFF Tg Syn BMT mice on day 137. BAFF-R staining of B cells from nontransplanted naïve B6 mice is shown on the far left for reference. MFI of BAFF-R was determined after gating on live Zombie−CD19+ B cells; n = 10 each group (WT BM only, BAFF Tg BM only, or BAFF Tg Syn) and n = 4 (naïve B6). Statistical analysis was performed by ordinary 1-way analysis of variance with Tukey’s multiple comparisons test (A,F-G), unpaired Student t test with Welch’s correction (B), Mann-Whitney test (C), or multiple Student t tests with few assumptions (E) using GraphPad Prism 8 software. *P < .05, **P < .01, ***P < .001, ****P < .0001. MW, molecular weight; NS, not significant (P > .05).
To determine if BAFF and alloantigen operate together to promote BCR activation in cGVHD in vivo, we examined B cells from syngeneic vs allogeneic recipients of T cell–depleted (BM only) BAFF Tg. We found that SYK was significantly increased in BAFF Tg allo-BMT mice (Figure 6F; supplemental Figure 9F). Although elevated BAFF in vivo alone did not affect BLNK levels, BLNK was also significantly increased when BAFF and alloantigen were both present (supplemental Figure 9G-H). This increased SYK was not associated with BAFF-R occupancy by BAFF. As shown in Figure 6G, BAFF-R occupancy by BAFF was the same in Syn BAFF Tg and BAFF Tg BM B cells after BMT. Thus, B cells require both BAFF and alloantigen for SYK maintenance and BCR activation.
BAFF and alloantigen promote cGVHD manifestations, GL7+ BCR-activated B cells, and alloantibody production
Finally, we assessed whether excess BAFF and alloantigen promoted cGVHD manifestations. Allo-BMT mice with BAFF Tg donors were compared with Syn-BMT mice with BAFF Tg donors. We found that T cell–depleted BAFF Tg (BM only) recipients had significantly more severe cGVHD manifestations, including ocular disease and weight loss (Figure 7A-B). To also determine whether high BAFF and alloantigen promoted increased GL7+ B cells in circulation and cGVHD development, we used T cell–depleted donor cells from BAFF Tg mice in T cell–depleted allo- vs Syn-BMT. BAFF Tg BM + Sp values are included for reference. Importantly, circulating GL7+ BCR-activated B cells were significantly proportionately increased in allogeneic BAFF Tg BM only recipients (Figure 7C). As expected, BAFF Tg recipient mice had significantly higher BAFF levels compared with WT recipients (supplemental Figure 10A). Despite high BAFF levels, B-cell numbers remained notably low (supplemental Figure 10B). After ex vivo BCR reengagement, we found increased dead cells in BAFF Tg BM only cultures, suggesting enhanced activation-induced death of B cells in cGVHD mice (supplemental Figure 10C). This is consistent with a proportional increase in T3 cells, which are considered the death niche for anergic B cells that are increased in BAFF Tg recipient cGVHD mice (supplemental Figure 10D-E), possibly explaining low B-cell numbers and persistence of high BAFF/B-cell ratios in mice with cGVHD. Overexpression of soluble BAFF and persistent total B lymphopenia seemed to preferentially promote GL7+ B cells (Figure 7C). In parallel with the increase in GL7+ B cells, we found increased antibody to recipient antigens in BAFF Tg recipient mice compared with controls, particularly in the context of allo-BMT (Figure 7D-E). Persistent excess BAFF after allo-BMT promoted GL7+ B-cell survival, antirecipient antibody production, and cGVHD manifestations. Additionally, even without the addition of splenocytes or T cells, high BAFF and presence of alloantigen significantly increased cGVHD manifestations.
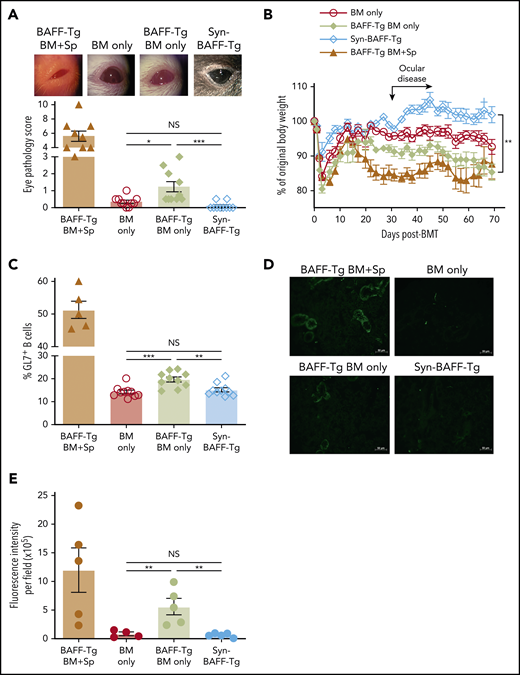
Persistent excess BAFF after allo-BMT promotes cGVHD manifestations, GL7+ B cells, and antirecipient antibody production. (A) Ocular cGVHD manifestations in recipients of T cell–depleted WT BM, BAFF Tg BM, or Syn-BMT. Representative photographic examples of eye pathology via Zeiss Stemi 2000-C stereo microscope with Nikon Coolpix P5100 camera (×3.2 magnification) are shown above the graph of the compiled cGVHD eye pathology scores. Eye scores include chemosis, mucoid discharge, and corneal opacity as assessed by biomicroscopic examination by a masked investigator at day 35 after allo-BMT. Data shown are from 1 representative experiment of 3 independent repeats; n = 10 each group (BM only and Syn groups). For reference, scores for the T cell–replete BAFF Tg BM + Sp are shown in the column on the far left; n = 9 (BAFF Tg BM + Sp). (B) Relative body weights in recipients of BM only T cell–depleted BAFF-Tg vs WT donor cells vs Syn BAFF Tg BM only cells; n = 5 (Syn-BMT) and n = 10 for other groups. This experiment was repeated, and data shown are representative of 2 experiments. (C) Frequency of GL7+ peripheral blood B cells in recipients of T cell–depleted WT BM, BAFF Tg BM, or Syn-BMT as assessed by flow cytometry on day 61 after allo-BMT. We quantified the proportion of GL7+ cells after pre-gating on Zomibie−CD19+ live cells in blood from allo-BMT mice using T cell–depleted BAFF Tg BM only vs WT BM only cells or Syn BAFF Tg BM only. This experiment was repeated 3 times, with each producing similar results; n = 5 (BAFF Tg BM + Sp) and n = 10 for all other groups. Similar results (data not shown) were also found on day 137 after allo-BMT in the above experiment. (D) Representative immunofluorescent images showing the relative amounts of plasma IgG taken after BMT bound to salivary gland tissue sections from BALB/c RAG−/− mice. Donor-derived antirecipient IgG after allo-BMT from recipient of T cell–depleted BAFF Tg BM ± Sp vs T cell–depleted WT BM only transplants and Syn BAFF Tg BM only is detected with an anti-mouse IgG- Alexa Fluor 488 secondary antibody. Images were taken by Zeiss Axiovert 200M fluorescence microscope with ApoTome using 200× lenses. (E) Relative fluorescence intensity of the plasma IgG-stained BALB/c RAG−/− salivary gland tissue sections shown in panel D quantitated using ImageJ software. The integrated intensity value measured by ImageJ per image field is shown as mean fluorescence intensity. Plasma from 2 mice of each group was assessed, with 2 to 3 images taken from each slide. Each symbol represents fluorescence intensity of a single image. This quantification strategy was repeated twice. Statistical analysis was performed by Kruskal-Wallis test (A), repeated measures analysis of variance (ANOVA) of body weight data from day 20 to 70 (B), or ordinary 1-way ANOVA with Tukey’s multiple comparisons test (C-E) using GraphPad Prism 8 software. *P < .05, **P < .01, ***P < .001. NS, not significant (P > .05).
Persistent excess BAFF after allo-BMT promotes cGVHD manifestations, GL7+ B cells, and antirecipient antibody production. (A) Ocular cGVHD manifestations in recipients of T cell–depleted WT BM, BAFF Tg BM, or Syn-BMT. Representative photographic examples of eye pathology via Zeiss Stemi 2000-C stereo microscope with Nikon Coolpix P5100 camera (×3.2 magnification) are shown above the graph of the compiled cGVHD eye pathology scores. Eye scores include chemosis, mucoid discharge, and corneal opacity as assessed by biomicroscopic examination by a masked investigator at day 35 after allo-BMT. Data shown are from 1 representative experiment of 3 independent repeats; n = 10 each group (BM only and Syn groups). For reference, scores for the T cell–replete BAFF Tg BM + Sp are shown in the column on the far left; n = 9 (BAFF Tg BM + Sp). (B) Relative body weights in recipients of BM only T cell–depleted BAFF-Tg vs WT donor cells vs Syn BAFF Tg BM only cells; n = 5 (Syn-BMT) and n = 10 for other groups. This experiment was repeated, and data shown are representative of 2 experiments. (C) Frequency of GL7+ peripheral blood B cells in recipients of T cell–depleted WT BM, BAFF Tg BM, or Syn-BMT as assessed by flow cytometry on day 61 after allo-BMT. We quantified the proportion of GL7+ cells after pre-gating on Zomibie−CD19+ live cells in blood from allo-BMT mice using T cell–depleted BAFF Tg BM only vs WT BM only cells or Syn BAFF Tg BM only. This experiment was repeated 3 times, with each producing similar results; n = 5 (BAFF Tg BM + Sp) and n = 10 for all other groups. Similar results (data not shown) were also found on day 137 after allo-BMT in the above experiment. (D) Representative immunofluorescent images showing the relative amounts of plasma IgG taken after BMT bound to salivary gland tissue sections from BALB/c RAG−/− mice. Donor-derived antirecipient IgG after allo-BMT from recipient of T cell–depleted BAFF Tg BM ± Sp vs T cell–depleted WT BM only transplants and Syn BAFF Tg BM only is detected with an anti-mouse IgG- Alexa Fluor 488 secondary antibody. Images were taken by Zeiss Axiovert 200M fluorescence microscope with ApoTome using 200× lenses. (E) Relative fluorescence intensity of the plasma IgG-stained BALB/c RAG−/− salivary gland tissue sections shown in panel D quantitated using ImageJ software. The integrated intensity value measured by ImageJ per image field is shown as mean fluorescence intensity. Plasma from 2 mice of each group was assessed, with 2 to 3 images taken from each slide. Each symbol represents fluorescence intensity of a single image. This quantification strategy was repeated twice. Statistical analysis was performed by Kruskal-Wallis test (A), repeated measures analysis of variance (ANOVA) of body weight data from day 20 to 70 (B), or ordinary 1-way ANOVA with Tukey’s multiple comparisons test (C-E) using GraphPad Prism 8 software. *P < .05, **P < .01, ***P < .001. NS, not significant (P > .05).
Discussion
Because immune reconstitution occurs in the setting of ubiquitous foreign antigen, ongoing removal of B cells reactive to recipient tissues is imperative for immune tolerance. The BAFF checkpoint has been well described in de novo autoimmune diseases. Intermediate affinity autoreactive B cells are known to be promoted by excess soluble BAFF when specific antigen is present in BCR Tg models.62,63 We have long known that B cells play a pathogenic role in cGVHD, and we find high levels of soluble BAFF in patients, but a pathologic role for BAFF after allogeneic hematopoietic stem cell transplantation has remained elusive. We now find that BAFF rescues aberrant, BCR-activated B cells in vivo in mice with cGVHD manifestations.
In the current study, we used a mouse model that recapitulated the aberrant B-cell phenotype of patients and afforded measurable physical manifestations of cGVHD. We revealed the mechanistic links between BAFF and aberrant BCR signaling in the development of cGVHD. Specifically, we found that extrinsic factors, BAFF and alloantigen, operate together to drive a circulating BCR-responsive B-cell compartment in mice with cGVHD manifestations. Strikingly, BCR-activated B cells that we found in cGVHD mouse circulation and in lesional tissue expressed the activation marker GL7, further suggesting extrafollicular B cells may have been incited by GC reactions but can be found outside of the GC microenvironment in cGVHD.5 For the first time, we show that BAFF production is increased after allo-BMT in cGVHD. By employing BAFF Tg and BAFF KO donors, we also begin to define a pathologic role for BAFF in cGVHD.
In this study, we found increased BAFF production in mice that developed cGVHD manifestations. Allo-BMT mice that received T cells had increased niche production of BAFF by an increased number of FRCs in SLOs, suggesting that alloreactivity promoted FRCs and BAFF production (Figures 1 and 2). Early interactions between FRCs and T cells through DLL and NOTCH1 are the key for activation of alloreactive T cells and GVHD initiation.64 Increased BAFF production in this model in which mice develop subclinical acute GVHD suggests a pathologic role for BAFF in cGVHD genesis. Although BAFF produced by CD4+ T cells seemed dispensable for disease development, the importance of this source for later stages of cGVHD remains unknown. Donor T cells have increased BAFF transcript, and further study of these cells as BAFF-producing cells in cGVHD is warranted. Given that FRCs themselves are targets during GVHD65 and their loss is accompanied by impaired humoral immunity, it is possible that the TFH source of BAFF becomes important for perpetuation of pathologic B-cell homeostasis in established cGVHD. We found that during early phases of cGVHD development, FRC numbers were significantly increased and FRCs produced more BAFF. However, a recent acute GVHD study found no difference in FRC cell numbers between GVHD and control,66 potentially related to higher-dose T-cell administration in these model systems. Additionally, ongoing B-cell lymphopenia likely also continues to account for, and potentially drives, high soluble BAFF levels after allogeneic transplantation. We now provide novel strong evidence for pathologic BAFF production in cGVHD and characterize an extrafollicular GL7+ BCR-responsive B-cell population, circulating in cGVHD.
Importantly, we found that BAFF and alloantigen together promoted an altered peripheral B-cell compartment (Figure 3) with a propensity to immediately respond through BCR. Strikingly, BAFF promoted alloreactive GL7+ BCR-activated B-cell recovery and pathology even when GVHD-inducing T cells were not transplanted (Figure 7), although which B cells were responsible for BAFF-associated alloantibody production (Figure 7D) remains unknown. In patients with clinically active cGVHD, the peripheral B-cell pool is prone to BCR hyperresponsiveness, and a subset of CD27+ B cells is capable of constitutive IgG production.14 Low BAFF-R detectability is a hallmark of activated and IgG-producing B cells67,68 and is observed in human patients and cGVHD mice. Because BAFF is known to induce class switching, it is tempting to speculate that niche IgG production may occur in lesional tissues.14,69 Our data suggest that after allo-BMT, most B cells encounter alloantigen and become anergic and die,62,63 leading to profound B lymphopenia. We show that excess BAFF affords maintenance of B cells that become BCR activated after allo-BMT but do not die when they encounter alloantigen. CD27 does not mark a similar population in mice. Using the GC marker GL7+, we find that excess BAFF is associated with the presence of constitutively BCR-activated B cells recirculating in cGVHD and alloantibody production.
The role of BCR-activated B cells in cGVHD pathophysiology is well established,15,18,19 and novel small molecules that target BTK and SYK are approved for use and being studied in patients.18,19,70 cGVHD patient B cells have increased protein levels of SYK and BLNK.15 We extend these findings to the cGVHD environment and document a breakdown of B-cell tolerance control that is directly attributed to B-cell alloantigen exposure and BAFF. SYK has previously been implicated in BAFF-R signaling.71 We now reveal how BAFF mediates constitutive BCR signaling after allo-BMT. How BAFF mediates these effects on a molecular level had remained largely unknown. Our data suggest that in cGVHD mice, when certain B cells encounter alloantigen, they do not die, and they do not stop signaling via BCR. We also found both that NOTCH2 expression and responsiveness were increased and that SYK protein was not degraded after BCR engagement in B cells after exposure to high levels of BAFF in vivo. Thus, we now show that B cells bathed in vivo with high BAFF experience loss of this negative regulation. Consistent with loss of this negative regulatory feedback loop when challenged with surrogate antigen ex vivo, and in keeping with the previously documented pathogenic role for NOTCH in cGVHD B-cell promotion, we show that BAFF promotes increased BCR responsiveness, because even without T cells in the transplant product, high BAFF promoted activation with surrogate antigen (Figure 5).16,17
On the basis of the previously reported association between excess BAFF and cGVHD,12,14 the anti-BAFF monoclonal antibody belimumab is already being examined for safety and efficacy in allogeneic transplantation (registered at www.clinicaltrials.gov as #NCT03207958). Loss of the T3 B-cell population after use of belimumab in patients with systemic lupus erythematosus72 is consistent with our findings of BAFF regulation of this cellular subset. Although the efficacy of belimumab has been limited in systemic lupus erythematosus, our prior work identified SYK addiction of cGVHD B cells, and current data highlight the essential role of elevated BAFF in control of BCR responsiveness, potentially through SYK protein maintenance. Our data provide a novel mechanistic rationale for SYK or BAFF blockade in cGVHD and other diseases with aberrations in B-cell tolerance.
For original data, please contact the corresponding author.
The online version of this article contains a data supplement.
The publication costs of this article were defrayed in part by page charge payment. Therefore, and solely to indicate this fact, this article is hereby marked “advertisement” in accordance with 18 USC section 1734.
Acknowledgments
The authors thank Divino Deoliveira for helping establish the mouse cGVHD model, Lauren Riley for critical reading of the manuscript, Michael Cook, Bin Li, and Lynn Martinek for helping with cell sorting, and Zuowei Su for helping with immunohistochemical staining.
This work was supported by National Institutes of Health (NIH)/National Heart, Lung, and Blood Institute grants 1K08HL145116-01A1 (V.R.), R01HL129061 (S.S.), and NIH/National Cancer Institute Cancer Center support grant P30CA014236.
Authorship
Contribution: W.J., J.C.P., and S.S. designed the study; S.S., W.J., and J.C.P. wrote the paper; W.J., H.S., S.A., N.J.R., D.M.C., K.I., A.N.S., I.M.C.-C., and R.A.D. performed the experiments, acquired data, and analyzed results; Z.L. performed statistical analysis; G.K.M. provided BAFF KO mice; J.C.R. provided BAFF Tg mice; and V.R., I.M., N.J.R., D.M.C., D.R.S., B.J.C., and N.J.C. interpreted data and edited the manuscript.
Conflict-of-interest disclosure: The authors declare no competing financial interests.
Correspondence: Stefanie Sarantopoulos, Adult Blood and Marrow Transplant Program, Duke University, Box 3961, 2400 Pratt St, Suite 5000, Durham, NC 27110; e-mail: stefanie.sarantopoulos@duke.edu.

This feature is available to Subscribers Only
Sign In or Create an Account Close Modal