

Key Points
p66Shc deficiency in CLL B cells promotes IL-9 secretion, which, in turn, stimulates secretion of homing chemokines by stromal cells.
Enhanced IL-9 secretion by leukemic cells from patients with aggressive disease correlates with lymphadenopathy and liver infiltration.

Abstract
The stromal microenvironment is central to chronic lymphocytic leukemia (CLL) pathogenesis. How leukemic cells condition the stroma to enhance its chemoattractant properties remains elusive. Here, we show that mouse and human CLL cells promote the contact-independent stromal expression of homing chemokines. This function was strongly enhanced in leukemic cells from Eμ-TCL1 mice lacking the pro-oxidant p66Shc adaptor, which develop an aggressive disease with organ infiltration. We identified interleukin-9 (IL-9) as the soluble factor, negatively modulated by p66Shc, that is responsible for the chemokine-elevating activity of leukemic cells on stromal cells. IL-9 blockade in Eμ-TCL1/p66Shc−/− mice resulted in a decrease in the nodal expression of homing chemokines, which correlated with decreased leukemic cell invasiveness. IL-9 levels were found to correlate inversely with residual p66Shc in p66Shc-deficient human CLL cells (n = 52 patients). p66Shc reconstitution in CLL cells normalized IL-9 expression and neutralized their chemokine-elevating activity. Notably, high IL-9 expression in CLL cells directly correlates with lymphadenopathy, liver infiltration, disease severity, and overall survival, emerging as an independent predictor of disease outcome. Our results demonstrate that IL-9 modulates the chemokine landscape in the stroma and that p66Shc, by regulating IL-9 expression, fine tunes the ability of leukemic cells to shape the microenvironment, thereby contributing to CLL pathogenesis.
Introduction
The accumulation of long-lived mature CD5+ B cells in peripheral blood (PB), bone marrow (BM), and secondary lymphoid organs (SLOs) is the hallmark of chronic lymphocytic leukemia (CLL).1,2 In patients with the worst disease presentation, abnormalities in tissue homing and egress receptor expression cooperate to retain leukemic cells in lymphoid and nonlymphoid niches,3-6 where contact-dependent and -independent interactions with stromal cells extend their survival.7,8 How CLL cells shape the stromal environment to accumulate and further attract leukemic cells therein remains largely elusive.
The pro-oxidant adaptor p66Shc9 negatively regulates B-cell survival by modulating Bcl-2 family protein expression10 and controlling the surface levels of SLO-homing and egress receptors, thereby affecting B-cell trafficking to, and retention, in prosurvival niches.3,4,6 CLL cells have a p66Shc expression defect that is causal to their extended survival.10-12 p66Shc expression is also impaired in leukemic cells from Eμ-TCL1 mice, which develop a CLL-like leukemia,13 and it correlates inversely with disease progression.6 p66Shc deletion in Eμ-TCL1 mice results in accelerated leukemogenesis and enhanced disease aggressiveness, with enhanced nodal and extranodal infiltrations and imbalanced trafficking receptor expression, underscoring the causal relationship between p66Shc deficiency and CLL pathogenesis.
Here, we show that CLL cells or their mouse Eμ-TCL1 counterparts condition the lymphoid stroma to produce homing chemokines and that this ability is enhanced by p66Shc deficiency. We identify interleukin-9 (IL-9) as the soluble factor responsible for this function and show that its expression is modulated by the pro-oxidant activity of p66Shc and is associated with lymphadenopathy and liver infiltration. Hence, p66Shc deficiency contributes to CLL pathogenesis by impinging on the cross talk between leukemic cells and the lymphoid stroma.
Methods
Mice
Eμ-TCL1 and Eμ-TCL1/p66Shc−/− mice,6,13 as well as and parental C57BL/6J (WT) and p66Shc−/− mice, were used in this study. Disease development and overt leukemia achievement were assessed as reported.6 Splenic CD5+CD19+ cells from leukemic mice or splenic B cells from WT or p66Shc−/− mice were immunomagnetically sorted.6 Cell viability was consistently >65% at 48 hours vs ∼85% immediately after purification (supplemental Figure 1, available on the Blood Web site). Eμ-TCL1/p66Shc−/− mice with overt leukemia were injected twice a week, for 4 weeks, with 100 μg of anti–IL-9 or isotype-control antibodies (R&D Systems), euthanized, and analyzed as detailed in supplemental Methods.6 Short-term IL-9 blockade for in vivo homing experiments was carried out as described in supplemental Methods.
CLL patients, healthy donors, and cell lines
CLL was diagnosed and treated according to 2008 International Workshop on Chronic Lymphocytic Leukemia criteria.14 Mutational IGHV status and organ infiltration were assessed as reported.6,15 PB samples were collected from 58 treatment-naive CLL patients (>95% leukemic CD5+CD19+/CD19+ cells). Healthy control B cells were purified from 17 buffy coats, as described.16 CLL cells were cotransfected with 1 μg of GFP reporter per sample and 5 μg of pcDNA3, either empty or encoding human p66Shc or the p66ShcQQ mutant,3 as described.6 MEC117 B-cell transfectants expressing p66Shc or p66ShcQQ,3 as well as murine OP9 or human HS-5 BM-derived stromal cells,18,19 were used.
Stromal cell culture, ELISAs, multiplex assays, pseudo-emperipolesis, and chemotaxis
Conditioned supernatants were prepared by culturing 50 × 106 murine or human B cells in 15 mL of high-glucose Dulbecco’s modified Eagle medium or RPMI 1640 7.5% bovine calf serum 37°C for 48 hours. Samples were centrifuged, and supernatants were stored at −80°C. IL-9 was quantified by enzyme-linked immunosorbent assay (ELISA; RayBiotech).
OP9 and HS-5 cells were seeded on 6-well plates (1.5 × 10⁵ cells per well) and incubated for 48 hours with 2 mL of supernatant conditioned by leukemic or WT B cells or with 15 × 106 leukemic or WT B cells in 2 mL of culture medium. IL-9 (0.5 ng/mL) and control or anti–IL-9 monoclonal antibody (mAb) (0.1 ng/mL) was added to the culture media (concentrations determined as in supplemental Figure 2). Stromal cell layers were trypsinized or washed and incubated at 37°C for an additional 48 hours in fresh culture medium. Supernatants were recovered and used in chemotaxis assays6,20 or stored at −80°C for quantification of mouse chemokines using a Bio-Plex Chemokine Panel (Bio-Rad). Data were acquired and analyzed using Luminex-MAGPIX (Bio-Rad). For pseudo-emperipolesis assays, 2 × 10⁵ B cells per well were added to stromal cell cultures that had been conditioned for 96 hours and allowed to migrate beneath the cell layer for 40 minutes at 37°C. Cells from trypsinized layers were stained with anti-CD19 antibodies and counted by flow cytometry.21 In coculture experiments, Eμ-TCL1 or Eμ-TCL1/p66Shc−/− leukemic cells were stained with DiO or DiL tracers (Invitrogen), respectively, mixed, and added to stromal cell–coated wells.
Organotypic culture and immunofluorescence microscopy of spleen slices
Vibratome-generated 230-μm spleen slices, obtained as described,22 were cultured at 37°C for 48 hours in high-glucose Dulbecco’s modified Eagle medium 7.5% bovine calf serum or in 100 μl leukemic cell supernatant. For immunofluorescence microscopy, spleen slices were transferred to 10-well diagnostic microscope slides, fixed and permeabilized, washed, and stained with anti-CCL2 in combination with anti–ER-TR7, anti-podoplanin, anti-CD3, or anti-CD19 antibodies and fluorochrome-conjugated secondary antibodies (antibodies are provided in supplemental Table 1).
RNA purification, gene expression profiling, and qRT-PCR
RNA was extracted and retrotranscribed as described.3 RNA extraction from 5-spleen slice pools was performed by homogenization with a mortar and pestle in Buffer RLT from an RNeasy Mini kit (Qiagen). Quantitative reverse transcription polymerase chain reactions (qRT-PCRs; primers are shown in supplemental Table 1) were performed as described.3 Data were analyzed using the delta threshold cycle (dCt) method and expressed as 2 -dCt. RNA (500 ng) from Eμ-TCL1 or Eμ-TCL1/p66Shc−/− leukemic cells was subjected to gene array profile analysis using Affymetrix Mouse Clariom S arrays (Cogentech). Data analysis was performed using Partek Genomics Suite Software 6.6.
Flow cytometry and immunoblotting
Mouse leukemic cell immunophenotyping was performed as described.6 For CCL2 intracellular staining, spleen slices were disgregated on 70-μm cell strainers (Biosigma). Cells were fixed and permeabilized using a FIX & PERM kit, stained with anti-CCL2 in combination with anti-ER-TR7, anti-podoplanin, anti-CD45, anti-CD3, or anti-CD19 antibodies, and subjected to flow cytometry (Guava easyCyte flow cytometer; Millipore).
Immunoblotting was performed as described (antibodies and reagents are shown in supplemental Table 1).21
Study approval
Written informed consent was received from CLL patients and healthy donors according to the Declaration of Helsinki. Experiments were approved by the local ethics committee. Animal procedures were carried out in agreement with the “Guiding Principles for Research Involving Animals Beings” and approved by the local ethics committee and the Italian Health Ministry.
Methods and statistical analyses are described in-depth in supplemental Methods.
Results
p66Shc deficiency enhances the ability of leukemic Eμ-TCL1 cells to promote the contact-independent expression of homing chemokines in stromal cells
Lymphoid tissue-homing receptor overexpression is exploited by CLL cells to accumulate in the protective lymphoid niche.2,7 We asked whether CLL cells modify the lymphoid stroma to enhance production of the respective ligands, thereby generating a feed-forward mechanism to support their accumulation therein. We used leukemic cells from Eμ-TCL1 and Eμ-TCL1/p66Shc−/− mice, the latter of which develop a disease that is characterized by increased invasiveness associated with upregulation of lymphoid and nonlymphoid tissue-homing receptors.6 Mouse OP9 stromal cells were cocultured with splenic leukemic cells (CD19+CD5+) purified from Eμ-TCL1 and Eμ-TCL1/p66Shc−/− mice with overt disease. Controls included OP9 cells kept in culture medium or cocultured with splenic B cells from WT mice. After 48 hours, OP9 cells were recovered, and homing chemokine messenger RNA (mRNA) was quantified. Chemokines included the CXCR3 ligands CXCL9/CXCL10/CXCL11, the CCR2 ligand CCL2, the CXCR5 ligand CXCL13, the CCR7 ligand CCL19, and the CXCR4 ligand CXCL12. Expression was not affected by coculture with WT B lymphocytes, with the exception of CXCL12 (Figure 1; supplemental Figure 3A). By contrast, all chemokines were upregulated following coculture with leukemic Eμ-TCL1 cells, and expression of all but CXCL12 was further enhanced following coculture with leukemic Eμ-TCL1/p66Shc−/− cells (Figure 1). Hence, leukemic cells condition stromal cells to enhance their attraction potential by reinforcing specific chemokine/chemokine receptor axes, a property that is further enhanced by p66Shc deficiency. Interestingly, when coculture experiments were carried out using p66Shc−/− B cells, a strong upregulation of chemokine mRNA was observed (Figures 1 and 2; supplemental Figure 3), indicating that the enhancement of chemokine expression elicited by leukemic Eμ-TCL1/p66Shc−/− cells was caused by p66Shc deficiency, independently of TCL1.
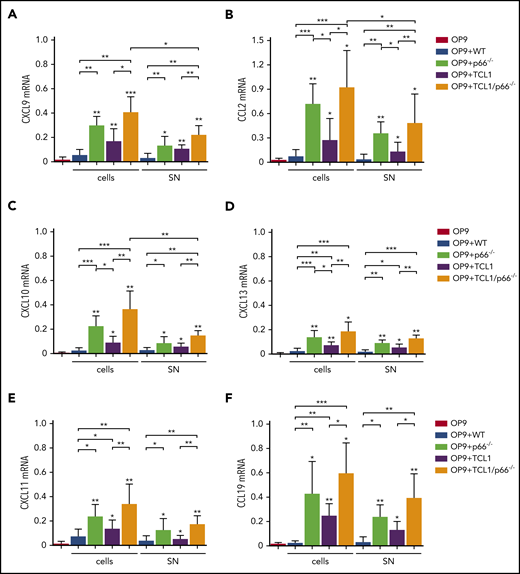
p66Shc deficiency enhances the ability of leukemic Eμ-TCL1 cells to promote the contact-independent expression of homing chemokines in stromal cells. qRT-PCR analysis of CXCL9 (A), CXCL10 (B), CXCL11 (C), CCL2 (D), CXCL13 (E), and CCL19 (F) mRNA in OP9 murine stromal cells kept in culture medium (OP9; n ≥ 6), cocultured with B cells purified from spleens of WT mice (OP9+WT; n = 3) or p66Shc−/− (OP9+p66−/−, n = 3) mice, cocultured with leukemic B cells purified from spleens of Eμ-TCL1 mice (OP9+TCL1; n ≥ 5) or Eμ-TCL1/p66Shc−/− mice (OP9+TCL1/p66−/−; n ≥ 6) with overt disease (cells), or with the respective conditioned media (SN). The relative gene transcript abundance was determined on triplicate samples using the dCt method and normalized to GAPDH. Data are mean ± standard deviation. ***P ≤ .001, **P ≤ .01, *P ≤ .05, 1-way analysis of variance, multiple comparison.
p66Shc deficiency enhances the ability of leukemic Eμ-TCL1 cells to promote the contact-independent expression of homing chemokines in stromal cells. qRT-PCR analysis of CXCL9 (A), CXCL10 (B), CXCL11 (C), CCL2 (D), CXCL13 (E), and CCL19 (F) mRNA in OP9 murine stromal cells kept in culture medium (OP9; n ≥ 6), cocultured with B cells purified from spleens of WT mice (OP9+WT; n = 3) or p66Shc−/− (OP9+p66−/−, n = 3) mice, cocultured with leukemic B cells purified from spleens of Eμ-TCL1 mice (OP9+TCL1; n ≥ 5) or Eμ-TCL1/p66Shc−/− mice (OP9+TCL1/p66−/−; n ≥ 6) with overt disease (cells), or with the respective conditioned media (SN). The relative gene transcript abundance was determined on triplicate samples using the dCt method and normalized to GAPDH. Data are mean ± standard deviation. ***P ≤ .001, **P ≤ .01, *P ≤ .05, 1-way analysis of variance, multiple comparison.
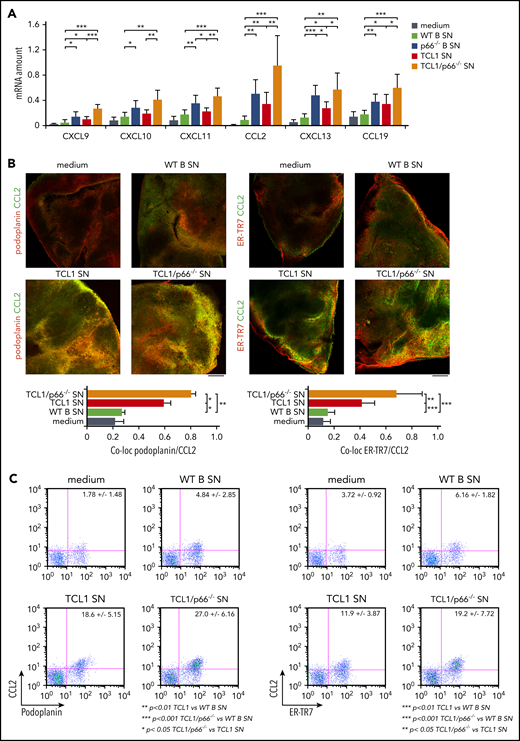
p66Shc deficiency enhances the ability of leukemic Eμ-TCL1 cells to promote homing chemokine expression in organotypic spleen cultures. (A) qRT-PCR analysis of the levels of CXCL9, CXCL10, CXCL11, CCL2, CXCL13, and CCL19 mRNA in spleen slices from WT mice kept in culture medium (n ≥ 6) or cocultured with conditioned supernatants (SN) from WT B cells (WT; n = 6) or p66Shc−/− B cells (p66−/−; n = 3) or leukemic B cells purified from spleens of Eμ-TCL1 mice (TCL1; n = 6) or Eμ-TCL1/p66Shc−/− mice (TCL1/p66−/−; n ≥ 6) with overt disease. The relative gene transcript abundance was determined on triplicate samples using the dCt method and normalized to GAPDH. Immunofluorescence (B) and flow cytometric (C) analysis of the percentage of CCL2+/podoplanin+ and CCL2+/ER-TR7+ cells in noncontiguous spleen slices from WT mice (n = 5) kept in culture medium (n ≥ 6) or cocultured with conditioned supernatants (SN) from WT B cells (WT; n = 6), or leukemic B cells purified from spleens of Eμ-TCL1 mice (TCL1; n ≥ 6) or Eμ-TCL1/p66Shc−/− mice (TCL1/p66−/−; n ≥ 6) with overt disease, and stained with anti-podoplanin and anti-CCL2 antibodies or with anti–ER-TR7 and anti-CCL2 antibodies. Immunofluorescence images were acquired on a confocal microscope using a 10× objective. Representative immunofluorescence images and flow cytometric plots are shown. Scale bars, 100 μm. Bar graphs in (A) and (B) show mean ± standard deviation. ***P ≤ .001, **P ≤ .01, *P ≤ .05, Student t test. co-loc, co-localization.
p66Shc deficiency enhances the ability of leukemic Eμ-TCL1 cells to promote homing chemokine expression in organotypic spleen cultures. (A) qRT-PCR analysis of the levels of CXCL9, CXCL10, CXCL11, CCL2, CXCL13, and CCL19 mRNA in spleen slices from WT mice kept in culture medium (n ≥ 6) or cocultured with conditioned supernatants (SN) from WT B cells (WT; n = 6) or p66Shc−/− B cells (p66−/−; n = 3) or leukemic B cells purified from spleens of Eμ-TCL1 mice (TCL1; n = 6) or Eμ-TCL1/p66Shc−/− mice (TCL1/p66−/−; n ≥ 6) with overt disease. The relative gene transcript abundance was determined on triplicate samples using the dCt method and normalized to GAPDH. Immunofluorescence (B) and flow cytometric (C) analysis of the percentage of CCL2+/podoplanin+ and CCL2+/ER-TR7+ cells in noncontiguous spleen slices from WT mice (n = 5) kept in culture medium (n ≥ 6) or cocultured with conditioned supernatants (SN) from WT B cells (WT; n = 6), or leukemic B cells purified from spleens of Eμ-TCL1 mice (TCL1; n ≥ 6) or Eμ-TCL1/p66Shc−/− mice (TCL1/p66−/−; n ≥ 6) with overt disease, and stained with anti-podoplanin and anti-CCL2 antibodies or with anti–ER-TR7 and anti-CCL2 antibodies. Immunofluorescence images were acquired on a confocal microscope using a 10× objective. Representative immunofluorescence images and flow cytometric plots are shown. Scale bars, 100 μm. Bar graphs in (A) and (B) show mean ± standard deviation. ***P ≤ .001, **P ≤ .01, *P ≤ .05, Student t test. co-loc, co-localization.
To assess the contribution of molecules secreted by leukemic cells to their ability to modulate stromal chemokine expression, OP9 cells were cultured for 48 hours in conditioned media from WT B cells or leukemic cells from Eμ-TCL1 or Eμ-TCL1/p66Shc−/− mice. This treatment recapitulated the effects observed in the coculture experiments (Figure 1; supplemental Figure 3A), indicating that the ability of leukemic cells to modulate chemokine expression in stromal cells is largely mediated by leukemic cell–derived soluble factors, whose production is enhanced by p66Shc deficiency.
The findings were validated by multiplex ELISA using the culture media of OP9 cells conditioned with WT or leukemic B-cell supernatants. To exclude the contribution of B-cell–derived chemokines, after incubation with conditioned media, OP9 cells were washed and cultured in fresh medium for an additional 48 hours. Consistent with the qRT-PCR analysis (Figure 1), supernatants from WT B cells did not affect chemokine production (supplemental Figure 4), with the exception of CXCL12 (supplemental Figure 3B). By contrast, all chemokines were upregulated in the supernatants of OP9 cells cultured in conditioned media from leukemic Eμ-TCL1 cells, with further upregulation (with the exception of CXCL12; supplemental Figure 3B) by conditioned media from leukemic Eμ-TCL1/p66Shc−/− cells (supplemental Figure 4).
p66Shc deficiency enhances the ability of leukemic Eμ-TCL1 cells to promote the contact-independent expression of homing chemokines in organotypic spleen cultures
The results were translated to organotypic cultures of vibratome-generated 230-μm spleen slices, where stromal cells remain in their 3-dimensional context and maintain their architecture for >48 hours without significant viability loss (supplemental Figure 5A).22 Homing chemokine mRNAs were quantified in slices cultured for 48 hours with conditioned media from WT B cells or leukemic cells from Eμ-TCL1 or Eμ-TCL1/p66Shc−/− mice. Consistent with the results obtained using OP9 cells, conditioned media from WT B cells affected chemokine expression in organotypic cultures to a minor extent (Figure 2A), with upregulation by conditioned media from leukemic Eμ-TCL1 cells (Figure 2A; supplemental Figure 3C) that was further enhanced by leukemic Eμ-TCL1/p66Shc−/− cell–derived supernatants (Figure 2A) (with the exception of CXCL12; supplemental Figure 3C). This property was intrinsic to p66Shc deficiency, as assessed by testing conditioned media from p66Shc−/− B cells (Figure 2A; supplemental Figure 3).
To verify that stromal cells are the source of the chemokines upregulated in conditioned organotypic cultures, we selected CCL2, a chemokine produced by ER-TR7+podoplanin+ splenic reticular fibroblasts.23 Strong CCL2 staining colocalizing with ER-TR7 or podoplanin was observed in spleen slices cultured with conditioned media from leukemic Eμ-TCL1 cells, which robustly increased with media conditioned by leukemic Eμ-TCL1/p66Shc−/− cells (Figure 2B). Conversely, T lymphocytes (CD3+) and B lymphocytes (CD19+) showed weak CCL2 staining (supplemental Figure 5B). These results were confirmed by flow cytometry (Figure 2C; supplemental Figure 5C). Hence, leukemic cells condition stromal cells to produce homing chemokines in a contact-independent manner, a process that is enhanced by p66Shc deficiency.
Supernatants from stromal cells conditioned by leukemic p66Shc-deficient Eμ-TCL1 cells enhance B-cell migration
To address the outcome of homing chemokine production by leukemic cell–conditioned stromal cells, we analyzed the ability of WT B cells to migrate when exposed to 48-hour supernatants from OP9 cells conditioned by WT, leukemic Eμ-TCL1, or leukemic Eμ-TCL1/p66Shc−/− B-cell supernatants. Consistent with the chemokine production by conditioned OP9 cells, B-cell chemotaxis was significantly higher in the presence of supernatants from OP9 cells conditioned by leukemic Eμ-TCL1 cell culture media compared with WT B-cell media, as assessed in Transwell assays (Figure 3A-B). Chemotaxis was further enhanced in the presence of supernatants from OP9 cells conditioned by leukemic Eμ-TCL1/p66Shc−/− cell culture media, an effect related to p66Shc deficiency, as shown by comparing p66Shc−/− and WT B-cell supernatants (Figure 3B). Supernatants from conditioned OP9 cells were also assessed for their ability to promote pseudo-emperipolesis (ie, B-cell migration beneath cocultured stromal cells).21 WT splenocytes were plated on conditioned OP9 cells; cells were collected 1 hour later and stained for CD19 to identify B cells. The results recapitulated those obtained in the chemotaxis experiments (Figure 3C).
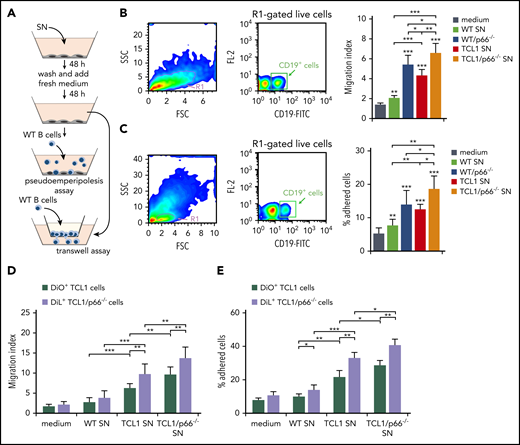
Supernatants of OP9 stromal cells cultured with supernatants of p66Shc-deficient leukemic Eμ-TCL1 cells enhance B-cell adhesion and migration. (A) Scheme of the experimental strategy for the pseudo-emperipolesis and Transwell assays. (B) Migration of R1-gated live splenic CD19+ cells from WT (n = 3) mice measured after a 3-hour treatment with supernatants of OP9 stromal cells kept either in culture medium or conditioned for 48 hours with the culture supernatants (SN) from WT or p66Shc−/− (p66−/−) cells or leukemic B cells purified from Eμ-TCL1 (TCL1) or Eμ-TCL1/p66Shc−/− (TCL1/p66−/−) mice with overt disease, washed, and cultured in fresh medium for an additional 48 hours. The data, obtained from triplicate samples from each mouse, are presented as mean migration index (ratio of migrated cells in chemokine-treated/untreated samples) ± standard deviation. (C) Quantification by flow cytometry of the percentage of splenic CD19+ cells (gated on live lymphocytes) from WT (n = 3) mice that remained adherent to OP9 stromal cells (pseudo-emperipolesis assay) grown on 48-well plates in culture medium or conditioned for 48 hours with the supernatants from WT B cells (n = 3) or p66Shc−/− B cells (p66−/−) or leukemic B cells purified from Eμ-TCL1 mice (TCL1; n = 3) or Eμ-TCL1/p66Shc−/− (TCL1/p66−/−; n = 3) mice with overt disease, washed, and cultured in fresh medium for an additional 48 hours. Before counting, splenocytes were labeled with anti–CD19-FITC antibodies. The data, which refer to quadruplicate samples from 3 independent experiments, are presented as the percentage of total input cells that remained attached to each well. Migration (D) and adhesion (E) of leukemic Eμ-TCL1 cells (TCL1; n = 3) or Eμ-TCL1/p66Shc−/− cells (TCL1/p66−/−; n = 3), stained with DiO and DiL fluorescent dyes, respectively, and mixed prior to the assays. Data in bar graphs are mean ± standard deviation. ***P ≤ .001, **P ≤ .01, *P ≤ .05, 1-way ANOVA, multiple comparisons. FSC, forward scatter; SSC, side scatter; SN, supernatant.
Supernatants of OP9 stromal cells cultured with supernatants of p66Shc-deficient leukemic Eμ-TCL1 cells enhance B-cell adhesion and migration. (A) Scheme of the experimental strategy for the pseudo-emperipolesis and Transwell assays. (B) Migration of R1-gated live splenic CD19+ cells from WT (n = 3) mice measured after a 3-hour treatment with supernatants of OP9 stromal cells kept either in culture medium or conditioned for 48 hours with the culture supernatants (SN) from WT or p66Shc−/− (p66−/−) cells or leukemic B cells purified from Eμ-TCL1 (TCL1) or Eμ-TCL1/p66Shc−/− (TCL1/p66−/−) mice with overt disease, washed, and cultured in fresh medium for an additional 48 hours. The data, obtained from triplicate samples from each mouse, are presented as mean migration index (ratio of migrated cells in chemokine-treated/untreated samples) ± standard deviation. (C) Quantification by flow cytometry of the percentage of splenic CD19+ cells (gated on live lymphocytes) from WT (n = 3) mice that remained adherent to OP9 stromal cells (pseudo-emperipolesis assay) grown on 48-well plates in culture medium or conditioned for 48 hours with the supernatants from WT B cells (n = 3) or p66Shc−/− B cells (p66−/−) or leukemic B cells purified from Eμ-TCL1 mice (TCL1; n = 3) or Eμ-TCL1/p66Shc−/− (TCL1/p66−/−; n = 3) mice with overt disease, washed, and cultured in fresh medium for an additional 48 hours. Before counting, splenocytes were labeled with anti–CD19-FITC antibodies. The data, which refer to quadruplicate samples from 3 independent experiments, are presented as the percentage of total input cells that remained attached to each well. Migration (D) and adhesion (E) of leukemic Eμ-TCL1 cells (TCL1; n = 3) or Eμ-TCL1/p66Shc−/− cells (TCL1/p66−/−; n = 3), stained with DiO and DiL fluorescent dyes, respectively, and mixed prior to the assays. Data in bar graphs are mean ± standard deviation. ***P ≤ .001, **P ≤ .01, *P ≤ .05, 1-way ANOVA, multiple comparisons. FSC, forward scatter; SSC, side scatter; SN, supernatant.
Similar experiments were carried out using leukemic cells. To directly compare leukemic Eμ-TCL1 and Eμ-TCL1/p66Shc−/− cells, they were stained with the fluorescent dyes DiO and DiL, respectively, and mixed prior to the assays. As expected from the homing receptor upregulation in leukemic cells, which was enhanced in the absence of p66Shc,6 migration (Figure 3D) and pseudo-emperipolesis (Figure 3E) of leukemic Eμ-TCL1 cells exposed to conditioned OP9 cells or the respective culture supernatants were increased compared with WT B cells, with a further increase for leukemic Eμ-TCL1/p66Shc−/− cells (Figure 3D-E). Hence, the increased homing chemokine production by conditioned stromal cells contributes to establish a promigratory environment that attracts leukemic cells toward the stromal niche. This effect is enhanced by p66Shc deficiency in leukemic cells.
Leukemic cells from Eμ-TCL1/p66Shc−/− mice secrete increased amounts of IL-9
Our results indicate that p66Shc deficiency in leukemic Eμ-TCL1 cells enhances the release of soluble factors that shape the stromal microenvironment to promote leukemic cell homing. To identify candidates for this function, we performed a DNA microarray analysis on mRNA extracted from leukemic cells from 3 Eμ-TCL1 and Eμ-TCL1/p66Shc−/− mice with overt leukemia. An analysis of variance (ANOVA) model to identify genes differentially expressed between the 2 groups was generated, and transcripts with a fold-change > 2 and a P value < .05 were identified. The hierarchical clustering of immune processes–related transcripts is shown in Figure 4A (differentially expressed genes are shown in supplemental Table 3).
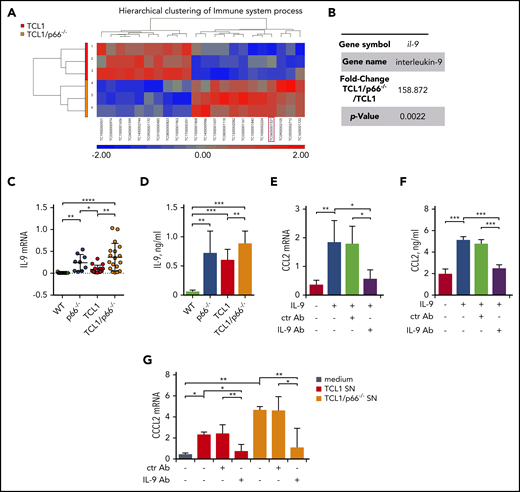
p66Shc deficiency in leukemic Eμ-TCL1 cells results in enhanced IL-9 expression. (A) Heat map and hierarchical clustering of the Immune System process transcripts from Affymetrix array analysis showing differential expression patterns between leukemic Eμ-TCL1 cells (TCL1; n = 3) and Eμ-TCL1/p66Shc−/− (TCL1/p66−/−; n = 3) cells. Differential expression criteria: P value < .05, estimated fold change > 2. Upregulated and downregulated transcripts are shown in red and blue, respectively. (B) Fold change and P value of il-9 expression extrapolated from Affymetrix array analysis in (A). (C) qRT-PCR analysis of IL-9 mRNA in WT B cells (n = 11), p66Shc−/− B cells (n = 9), or leukemic B cells purified from Eμ-TCL1 mice (n = 12) or Eμ-TCL1/p66Shc−/− mice (n = 18) mice with overt disease. (D) Quantification by ELISA of IL-9 released in the culture supernatants of WT B cells (n = 6), p66Shc−/− B cells (n = 9), or leukemic B cells purified from Eμ-TCL1 mice (n = 10) or Eμ-TCL1/p66Shc−/− mice (n = 23) with overt disease. qRT-PCR analysis of CCL2 mRNA (E) and quantification by ELISA of CCL2 released in the culture supernatants (F) from OP9 stromal cells kept in culture medium or stimulated with 0.05 ng/mL IL-9 alone or in combination with 0.1 ng/mL isotype-control antibody (ctr Ab) or 0.1 ng/mL neutralizing anti–IL-9 mAb (IL-9 Ab) for 48 hours (n = 3). (G) qRT-PCR analysis of CCL2 mRNA in OP9 stromal cells kept in culture medium or cultured for 48 hours with conditioned supernatants from leukemic B cells purified from Eμ-TCL1 mice (n = 3) or Eμ-TCL1/p66Shc−/− mice (n = 3) with overt disease and with 0.1 ng/mL isotype-control antibody (ctr Ab) or 0.1 ng/mL neutralizing anti–IL-9 antibody (IL-9 Ab). The relative gene transcript abundance was determined on triplicate samples using the dCt method and normalized to GAPDH. Data are mean ± standard deviation. ***P ≤ .001, **P ≤ .01, *P ≤ .05, 1-way ANOVA, multiple comparisons.
p66Shc deficiency in leukemic Eμ-TCL1 cells results in enhanced IL-9 expression. (A) Heat map and hierarchical clustering of the Immune System process transcripts from Affymetrix array analysis showing differential expression patterns between leukemic Eμ-TCL1 cells (TCL1; n = 3) and Eμ-TCL1/p66Shc−/− (TCL1/p66−/−; n = 3) cells. Differential expression criteria: P value < .05, estimated fold change > 2. Upregulated and downregulated transcripts are shown in red and blue, respectively. (B) Fold change and P value of il-9 expression extrapolated from Affymetrix array analysis in (A). (C) qRT-PCR analysis of IL-9 mRNA in WT B cells (n = 11), p66Shc−/− B cells (n = 9), or leukemic B cells purified from Eμ-TCL1 mice (n = 12) or Eμ-TCL1/p66Shc−/− mice (n = 18) mice with overt disease. (D) Quantification by ELISA of IL-9 released in the culture supernatants of WT B cells (n = 6), p66Shc−/− B cells (n = 9), or leukemic B cells purified from Eμ-TCL1 mice (n = 10) or Eμ-TCL1/p66Shc−/− mice (n = 23) with overt disease. qRT-PCR analysis of CCL2 mRNA (E) and quantification by ELISA of CCL2 released in the culture supernatants (F) from OP9 stromal cells kept in culture medium or stimulated with 0.05 ng/mL IL-9 alone or in combination with 0.1 ng/mL isotype-control antibody (ctr Ab) or 0.1 ng/mL neutralizing anti–IL-9 mAb (IL-9 Ab) for 48 hours (n = 3). (G) qRT-PCR analysis of CCL2 mRNA in OP9 stromal cells kept in culture medium or cultured for 48 hours with conditioned supernatants from leukemic B cells purified from Eμ-TCL1 mice (n = 3) or Eμ-TCL1/p66Shc−/− mice (n = 3) with overt disease and with 0.1 ng/mL isotype-control antibody (ctr Ab) or 0.1 ng/mL neutralizing anti–IL-9 antibody (IL-9 Ab). The relative gene transcript abundance was determined on triplicate samples using the dCt method and normalized to GAPDH. Data are mean ± standard deviation. ***P ≤ .001, **P ≤ .01, *P ≤ .05, 1-way ANOVA, multiple comparisons.
Focusing on genes encoding soluble factors significantly modulated by p66Shc (Figure 4A-B), we chose il-9 for validation based on its chemokine-elevating function in other cell types.24-26 il-9 was confirmed to be upregulated in Eμ-TCL1/p66Shc−/− leukemic cells compared with their Eμ-TCL1 counterparts (Figure 4C-D). Upregulation was also observed in p66Shc−/− B cells compared with WT B cells, in which IL-9 was barely detectable (Figure 4C-D), underscoring the importance of p66Shc deficiency in IL-9 expression.
We asked whether IL-9 affects chemokine expression in stromal cells. The levels of homing chemokines modulated by conditioned media from leukemic cells were significantly enhanced in OP9 cells treated with IL-9. This increase was neutralized by an anti–IL-9 mAb (Figure 4E-F; supplemental Figure 6). We next asked whether the enhanced chemokine expression in OP9 cells conditioned by leukemic cell supernatants could be mediated by IL-9. OP9 cells were cultured for 48 hours with conditioned media from leukemic cells, in the presence or absence of anti–IL-9 or isotype-control antibodies. The ability of leukemic cell supernatants to enhance homing chemokine expression in OP9 cells was neutralized by IL-9 blockade (Figure 4G; supplemental Figure 7). Hence, leukemic Eμ-TCL1 cells secrete IL-9, which stimulates OP9 cells to express homing chemokines, a property that is enhanced by p66Shc deficiency.
p66Shc modulates the IL-9–dependent expression of homing chemokines through its pro-oxidant activity
p66Shc modulates gene transcription through its reactive oxygen species (ROS)-elevating activity, as documented for CCR7, CCR2, and CXCR3.3,6 To address the role of the pro-oxidant function of p66Shc in the IL-9–dependent expression of homing chemokines, we compared a CLL-derived MEC16,17 B-cell transfectant expressing the ROS-defective EE132-133QQ p66Shc mutant (MEC-QQ)9 with a p66Shc-overexpressing transfectant (MEC-p66) and an empty vector control lacking p66Shc3,6 (Figure 5A). IL-9 expression decreased in the presence of p66Shc but not p66ShcQQ (Figure 5B-C), indicating that the ROS-elevating activity of p66Shc modulates IL-9 expression.
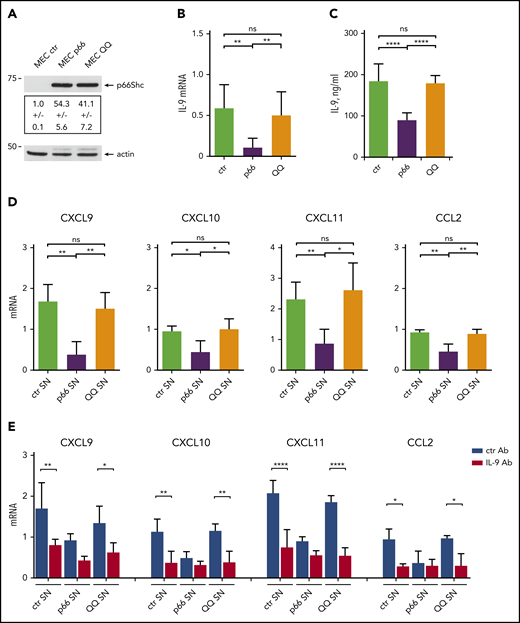
p66Shc modulates the IL-9–dependent expression of homing chemokines by stromal cells through its pro-oxidant activity. (A) Immunoblot analysis with anti-Shc antibodies of postnuclear supernatants from MEC1 B cells stably transfected with empty vector (MEC ctr) or an expression construct encoding WT p66Shc (MEC p66) or the EE132/133QQ (MEC QQ) mutant (n = 3). A control anti-actin blot of the stripped filter is shown below. The migration of molecular mass markers is indicated. (B) qRT-PCR analysis of IL-9 mRNA in MEC transfectants. The relative gene transcript abundance was determined from triplicate samples using the dCt method and normalized to HPRT1. (C) Quantification by ELISA of IL-9 released in the culture supernatants of MEC ctr (n = 5), MEC p66 (n = 5), or MEC QQ (n = 5) transfectants. (D) qRT-PCR analysis of CXCL9, CXCL10, CXCL11, and CCL2 mRNA in HS-5 human stromal cells cultured for 48 hours with conditioned supernatants (SN) from MEC transfectants (n = 4). (E) qRT-PCR analysis of CXCL9, CXCL10, CXCL11, and CCL2 mRNA in HS-5 human stromal cells cultured for 48 hours with conditioned supernatants (SN) from MEC transfectants, in the presence of 0.1 ng/mL isotype-control antibody (ctr Ab) or 0.1 ng/mL neutralizing anti–IL-9 mAb (IL-9 Ab). The relative gene transcript abundance was determined on triplicate samples using the dCt method and normalized to HPRT1. Data are mean ± standard deviation. ****P ≤ .0001, ***P ≤ .001, **P ≤ .01, *P ≤ .05, 1-way ANOVA with Tukey’s post hoc correction, multiple comparisons. ns, not significant.
p66Shc modulates the IL-9–dependent expression of homing chemokines by stromal cells through its pro-oxidant activity. (A) Immunoblot analysis with anti-Shc antibodies of postnuclear supernatants from MEC1 B cells stably transfected with empty vector (MEC ctr) or an expression construct encoding WT p66Shc (MEC p66) or the EE132/133QQ (MEC QQ) mutant (n = 3). A control anti-actin blot of the stripped filter is shown below. The migration of molecular mass markers is indicated. (B) qRT-PCR analysis of IL-9 mRNA in MEC transfectants. The relative gene transcript abundance was determined from triplicate samples using the dCt method and normalized to HPRT1. (C) Quantification by ELISA of IL-9 released in the culture supernatants of MEC ctr (n = 5), MEC p66 (n = 5), or MEC QQ (n = 5) transfectants. (D) qRT-PCR analysis of CXCL9, CXCL10, CXCL11, and CCL2 mRNA in HS-5 human stromal cells cultured for 48 hours with conditioned supernatants (SN) from MEC transfectants (n = 4). (E) qRT-PCR analysis of CXCL9, CXCL10, CXCL11, and CCL2 mRNA in HS-5 human stromal cells cultured for 48 hours with conditioned supernatants (SN) from MEC transfectants, in the presence of 0.1 ng/mL isotype-control antibody (ctr Ab) or 0.1 ng/mL neutralizing anti–IL-9 mAb (IL-9 Ab). The relative gene transcript abundance was determined on triplicate samples using the dCt method and normalized to HPRT1. Data are mean ± standard deviation. ****P ≤ .0001, ***P ≤ .001, **P ≤ .01, *P ≤ .05, 1-way ANOVA with Tukey’s post hoc correction, multiple comparisons. ns, not significant.
To validate these results in the context of human CLL, we used human BM–derived HS-5 stromal cells.18 Similar to OP9 cells, HS-5 cells upregulated homing chemokine expression in response to IL-9 (supplemental Figure 8). Treatment of HS-5 cells with conditioned media from the 3 MEC transfectants showed that CXCL9, CXCL10, CXCL11, and CCL2 expression was downregulated following culture in conditioned supernatants from the p66Shc-overexpressing transfectant compared with the empty vector control lacking p66Shc, but not when cultured in conditioned supernatants from the CLL-derived MEC1 B cell transfectant expressing the ROS-defective EE132-133QQ p66Shc mutant (Figure 5D). This activity was partially neutralized by an anti–IL-9 mAb, suggesting the contribution of other factors or incomplete IL-9 blockade (Figure 5E). These results support a role for IL-9 in the regulation of homing chemokine expression and underscore the contribution of the ROS-elevating activity of p66Shc to the modulation of IL-9 and its downstream functions.
p66Shc deficiency enhances IL-9 production and the ability of human CLL cells to promote the contact-independent expression of homing chemokines in stromal cells
CLL cells harbor a defect in p66Shc expression10 that leads to enhanced expression of the homing receptors CCR2, CCR7, and CXCR3, which contributes to their enhanced invasiveness.6 Accordingly, the levels of residual p66Shc in CLL cells correlate inversely with their ability to infiltrate nodal and extranodal districts.6 Based on the ability of leukemic Eμ-TCL1 cells to promote stromal cell production of homing chemokines through IL-9 (Figure 4G; supplemental Figure 7), we measured IL-9 expression in B cells purified from 52 CLL patients and 17 healthy donors. Significantly higher IL-9 levels were detected in CLL cells compared with healthy B cells (Figure 6A-B). Higher levels were detected in patients with unmutated IGHV, who develop aggressive disease,27 compared with patients with mutated IGHV (Figure 6A-B).
![p66Shc deficiency enhances IL-9 production in CLL cells. qRT-PCR analysis of IL-9 mRNA (A) and quantification by ELISA of IL-9 released in the culture supernatants (B) from B cells purified from healthy donors (HD; n = 17) and CLL patients (n = 52), grouped as M-CLL (n = 33) and U-CLL (n = 19), according to the mutational IGHV status (M, mutated; U, unmutated). (C) Correlation between mRNA levels of p66Shc and mRNA levels of IL-9 in B cells purified from CLL patients (n = 52). qRT-PCR analysis of IL-9 mRNA (left panels) and quantification by ELISA (right panels) of IL-9 released in the culture supernatants of B cells purified from CLL patients and transfected with empty vector (vect; n = 6) or with a vector encoding WT p66Shc (p66; n = 6) (D) or mutated p66Shc (p66QQ; n = 5) (E). (F) qRT-PCR analysis of CXCL9, CXCL10, CXCL11, and CCL2 mRNA in HS-5 human stromal cells cultured for 48 hours with conditioned supernatants from CLL B-cell transfectants (vect SN, n = 6 and p66 SN, n = 6). (G) Migration of leukemic cells from CLL patients (n = 4) measured after a 3 hour-treatment with supernatants of HS-5 stromal cells conditioned for 48 hours with culture supernatants of CLL B cell transfectants (vect, n = 5; p66, n = 5), washed, and cultured in fresh medium for additional 48 hours. The data were obtained from duplicate samples from each CLL patient (± standard deviation [SD]). (H) qRT-PCR analysis of CXCL9, CXCL10, CXCL11, and CCL2 mRNA in HS-5 stromal cells cultured for 48 hours with conditioned supernatants of CLL B cell transfectants (vect, n = 3; p66, n = 3), in the presence of 0.1 ng/mL isotype-control antibody (ctr Ab) or 0.1 ng/mL neutralizing anti–IL-9 monoclonal antibody (IL-9 Ab). The relative gene transcript abundance was determined from triplicate samples using the dCt method. Data are mean ± SD. ****P ≤ .0001, ***P ≤ .001, **P ≤ .01, *P ≤ .05. Mann-Whitney rank-sum test (A-B,F), paired t test (D-E), 2-way ANOVA with Tukey’s post hoc correction, multiple comparisons (G-H). ns, not significant.](https://ash.silverchair-cdn.com/ash/content_public/journal/blood/137/16/10.1182_blood.2020005785/1/m_bloodbld2020005785f6.png?Expires=1769112840&Signature=Mir~qyNH9rM6BMCXUZw9Eo6fCBnMdglcG40C8YdGBm5LZsi8zhMq9B~T0tp11SdRtQGCqLSct~mQYJEzRfBWd0rvWPGllXBHERZ-Aj7H8Mrb9TaVgnsq8xdxkc7LhSHCdEK9vb-Ljql3wQ6nVxlcf1Uzz8Bojx7MwrlcLigwOMfGTF0WIi3~aT0rQKWC4ZBBx7zEP0kSA7-u1jL7tqG~enHI1u4BtUf9RyClx27F~gKg01pJ42fgDfvGd9MfSC1FlegOvjCuqdI~Z50UfklFZjauR5lEPrHcgphgF2C36rCeBWwwYmbH~Jgt6-NFjDBN7AZkx7hs0ZRQx8xr8FNl~g__&Key-Pair-Id=APKAIE5G5CRDK6RD3PGA)
p66Shc deficiency enhances IL-9 production in CLL cells. qRT-PCR analysis of IL-9 mRNA (A) and quantification by ELISA of IL-9 released in the culture supernatants (B) from B cells purified from healthy donors (HD; n = 17) and CLL patients (n = 52), grouped as M-CLL (n = 33) and U-CLL (n = 19), according to the mutational IGHV status (M, mutated; U, unmutated). (C) Correlation between mRNA levels of p66Shc and mRNA levels of IL-9 in B cells purified from CLL patients (n = 52). qRT-PCR analysis of IL-9 mRNA (left panels) and quantification by ELISA (right panels) of IL-9 released in the culture supernatants of B cells purified from CLL patients and transfected with empty vector (vect; n = 6) or with a vector encoding WT p66Shc (p66; n = 6) (D) or mutated p66Shc (p66QQ; n = 5) (E). (F) qRT-PCR analysis of CXCL9, CXCL10, CXCL11, and CCL2 mRNA in HS-5 human stromal cells cultured for 48 hours with conditioned supernatants from CLL B-cell transfectants (vect SN, n = 6 and p66 SN, n = 6). (G) Migration of leukemic cells from CLL patients (n = 4) measured after a 3 hour-treatment with supernatants of HS-5 stromal cells conditioned for 48 hours with culture supernatants of CLL B cell transfectants (vect, n = 5; p66, n = 5), washed, and cultured in fresh medium for additional 48 hours. The data were obtained from duplicate samples from each CLL patient (± standard deviation [SD]). (H) qRT-PCR analysis of CXCL9, CXCL10, CXCL11, and CCL2 mRNA in HS-5 stromal cells cultured for 48 hours with conditioned supernatants of CLL B cell transfectants (vect, n = 3; p66, n = 3), in the presence of 0.1 ng/mL isotype-control antibody (ctr Ab) or 0.1 ng/mL neutralizing anti–IL-9 monoclonal antibody (IL-9 Ab). The relative gene transcript abundance was determined from triplicate samples using the dCt method. Data are mean ± SD. ****P ≤ .0001, ***P ≤ .001, **P ≤ .01, *P ≤ .05. Mann-Whitney rank-sum test (A-B,F), paired t test (D-E), 2-way ANOVA with Tukey’s post hoc correction, multiple comparisons (G-H). ns, not significant.
p66Shc deficiency enhances IL-9 production in CLL cells. qRT-PCR analysis of IL-9 mRNA (A) and quantification by ELISA of IL-9 released in the culture supernatants (B) from B cells purified from healthy donors (HD; n = 17) and CLL patients (n = 52), grouped as M-CLL (n = 33) and U-CLL (n = 19), according to the mutational IGHV status (M, mutated; U, unmutated). (C) Correlation between mRNA levels of p66Shc and mRNA levels of IL-9 in B cells purified from CLL patients (n = 52). qRT-PCR analysis of IL-9 mRNA (left panels) and quantification by ELISA (right panels) of IL-9 released in the culture supernatants of B cells purified from CLL patients and transfected with empty vector (vect; n = 6) or with a vector encoding WT p66Shc (p66; n = 6) (D) or mutated p66Shc (p66QQ; n = 5) (E). (F) qRT-PCR analysis of CXCL9, CXCL10, CXCL11, and CCL2 mRNA in HS-5 human stromal cells cultured for 48 hours with conditioned supernatants from CLL B-cell transfectants (vect SN, n = 6 and p66 SN, n = 6). (G) Migration of leukemic cells from CLL patients (n = 4) measured after a 3 hour-treatment with supernatants of HS-5 stromal cells conditioned for 48 hours with culture supernatants of CLL B cell transfectants (vect, n = 5; p66, n = 5), washed, and cultured in fresh medium for additional 48 hours. The data were obtained from duplicate samples from each CLL patient (± standard deviation [SD]). (H) qRT-PCR analysis of CXCL9, CXCL10, CXCL11, and CCL2 mRNA in HS-5 stromal cells cultured for 48 hours with conditioned supernatants of CLL B cell transfectants (vect, n = 3; p66, n = 3), in the presence of 0.1 ng/mL isotype-control antibody (ctr Ab) or 0.1 ng/mL neutralizing anti–IL-9 monoclonal antibody (IL-9 Ab). The relative gene transcript abundance was determined from triplicate samples using the dCt method. Data are mean ± SD. ****P ≤ .0001, ***P ≤ .001, **P ≤ .01, *P ≤ .05. Mann-Whitney rank-sum test (A-B,F), paired t test (D-E), 2-way ANOVA with Tukey’s post hoc correction, multiple comparisons (G-H). ns, not significant.
IL-9 mRNA levels correlated inversely with those of residual p66Shc (Figure 6C), suggesting that p66Shc negatively modulates IL-9 expression in CLL cells. Accordingly, p66Shc reconstitution in CLL cells (supplemental Figure 9) resulted in decreased IL-9 expression, an effect not reproduced by the ROS-defective p66Shc mutant (Figure 6D-E). Importantly, conditioned supernatants from p66Shc-reconstituted CLL cells impaired the ability of HS-5 cells to express homing chemokines (Figure 6F) and promote CLL cell migration (Figure 6G). These activities were neutralized by anti–IL-9 mAb (Figure 6G-H). The role of IL-9 in promoting the generation of a promigratory stromal microenvironment in CLL was supported by adoptive transfer of DiO-labeled leukemic cells to EμTCL1/p66Shc−/− mice treated with anti–IL-9 mAb for 48 hours to neutralize endogenous IL-9 and its effects on the stromal production of homing chemokines. Compared with mice pretreated with isotype control, in which a robust accumulation of transferred leukemic cells was observed in the spleen, prior IL-9 blockade resulted in decreased spleen homing (supplemental Figure 10A), concomitant with a local decrease in homing chemokine expression (supplemental Figure 10B). Taken together, these results support the notion that p66Shc deficiency in leukemic cells promotes the IL-9–dependent expression of homing chemokines by stromal cells.
Infiltration of nodal and extranodal areas, calculated as the size of infiltrated LNs and the presence of spleen and/or liver enlargement, was significantly greater in CLL patients whose leukemic cells had IL-9 mRNA levels above an arbitrarily set threshold (0.16 ± 0.38 2 -dCt, corresponding to the median relative IL-9 mRNA expression of CLL patients; Table 1). These patients had the lowest levels of residual p66Shc (Table 1). By contrast, organ infiltration was low in CLL patients with IL-9 below the threshold, who express the highest levels of residual p66Shc (Table 1). These data highlight a correlation between the amount of IL-9 expressed by p66Shc-deficient leukemic cells and their ability to infiltrate nodal and extranodal districts, supporting a role for p66Shc-dependent IL-9 expression in disease presentation. Correlation of IL-9 levels with clinical data revealed a significant association between high IL-9 and symptomatic vs asymptomatic CLL (supplemental Figure 11A), as well as a trend toward an association with autoimmune complications (supplemental Figure 11B). Importantly, high IL-9 expression correlated with shorter overall survival (median 60-month follow-up, Figure 7A), highlighting IL-9 as a predictor of disease outcome, with a hazard ratio similar to IGHV mutational status in this patient cohort (3.10; 95% confidence interval, 1.07-8.99 vs 2.59; 95% confidence interval, 0.87-7.76) (supplemental Figure 12).
Pathological features of CLL patients and IL-9 mRNA levels in the respective leukemic cells
| mRNA (threshold = 0.16 ± 0.38 2−dCt) | ||
|---|---|---|
| IL-9 below threshold | IL-9 above threshold | |
| (i) CLL patients, n | 26 | 26 |
| (ii) UM-CLL patients, % | 19.2 | 57.7 |
| IL-9 mRNA | 0.03 ± 0.05 | 0.61 ± 0.34*** |
| p66Shc mRNA | 0.27 ± 0.09 | 0.08 ± 0.07*** |
| (iii) LN > 1.5 cm, % of patients with characteristic | 65.4 | 80.8 |
| (iv) Spleen infiltration (>13 cm), % of patients with characteristic | 23.1 | 50.0 |
| (v) Liver infiltration (>1 cm under arch), % of patients with characteristic | 11.5 | 26.9 |
CLL patients were grouped as “above threshold” or “below threshold,” corresponding to the median 2−dCt IL-9 mRNA. Organ infiltration was classified according to the International Workshop on Chronic Lymphocytic Leukemia.14
P ≤ .001, Mann-Whitney rank-sum test.
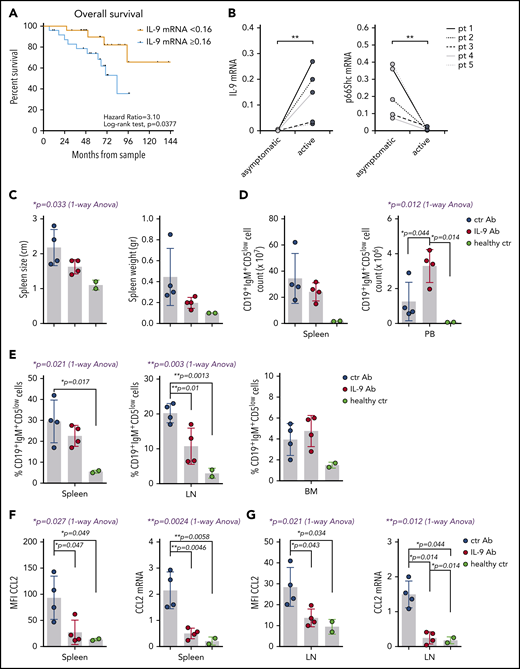
IL-9 modulates leukemic cell invasiveness in vivo by shaping the stromal chemokine landscape and predicts poor prognosis in CLL. (A) Overall survival of 52 CLL patients grouped as “<0.16” (n = 26) and “≥0.16” (n = 26) (0.16 corresponds to the median 2−dCt IL-9 mRNA expression). After a median follow-up of 60 months, the estimated median overall survival was 83 months for patients in the “≥0.16” group, and it was not reached for patients with low IL-9 mRNA levels (P = .0377, log-rank test). (B) qRT-PCR analysis of IL-9 and p66Shc mRNA in B cells purified from 5 CLL patients at the earliest asymptomatic disease stage (asymptomatic) and after progression to a stage requiring treatment (active). Spleen size and weight (C) and the absolute number (D) and percentage (E) of CD19+IgM+CD5low cells in the indicated organs of Eμ-TCL1/p66Shc−/− mice with overt disease injected intraperitoneally with 100 μg of anti–IL-9 antibody (IL-9 Ab; n = 4) or isotype-control antibody (ctr Ab; n = 4) twice a week (days 1 and 5) for 4 weeks, as well as for healthy age-matched C57BL6/J control mice (healthy ctr; n = 2). Flow cytometric analysis of surface expression (left panel) and RT-PCR analysis of mRNA expression (right panel) of CCL2 in splenocytes (F) and LN cells (G) from Eμ-TCL1/p66Shc−/− or C57BL6/J control mice treated as above. The relative gene transcript abundance was determined on triplicate samples using the dCt method and normalized to GAPDH. Data are mean ± standard deviation. ***P ≤ .001, **P ≤ .01, *P ≤ .05, Mann-Whitney rank-sum test (B), 1-way ANOVA with Tukey’s post hoc test (blue text), multiple comparisons (black text) (C-G).
IL-9 modulates leukemic cell invasiveness in vivo by shaping the stromal chemokine landscape and predicts poor prognosis in CLL. (A) Overall survival of 52 CLL patients grouped as “<0.16” (n = 26) and “≥0.16” (n = 26) (0.16 corresponds to the median 2−dCt IL-9 mRNA expression). After a median follow-up of 60 months, the estimated median overall survival was 83 months for patients in the “≥0.16” group, and it was not reached for patients with low IL-9 mRNA levels (P = .0377, log-rank test). (B) qRT-PCR analysis of IL-9 and p66Shc mRNA in B cells purified from 5 CLL patients at the earliest asymptomatic disease stage (asymptomatic) and after progression to a stage requiring treatment (active). Spleen size and weight (C) and the absolute number (D) and percentage (E) of CD19+IgM+CD5low cells in the indicated organs of Eμ-TCL1/p66Shc−/− mice with overt disease injected intraperitoneally with 100 μg of anti–IL-9 antibody (IL-9 Ab; n = 4) or isotype-control antibody (ctr Ab; n = 4) twice a week (days 1 and 5) for 4 weeks, as well as for healthy age-matched C57BL6/J control mice (healthy ctr; n = 2). Flow cytometric analysis of surface expression (left panel) and RT-PCR analysis of mRNA expression (right panel) of CCL2 in splenocytes (F) and LN cells (G) from Eμ-TCL1/p66Shc−/− or C57BL6/J control mice treated as above. The relative gene transcript abundance was determined on triplicate samples using the dCt method and normalized to GAPDH. Data are mean ± standard deviation. ***P ≤ .001, **P ≤ .01, *P ≤ .05, Mann-Whitney rank-sum test (B), 1-way ANOVA with Tukey’s post hoc test (blue text), multiple comparisons (black text) (C-G).
To understand whether p66Shc and IL-9 expression is modulated during disease progression, similar to Eμ-TCL1 mice,6 qRT-PCR analysis was carried out on samples from CLL patients at the time of diagnosis and at disease progression before starting treatment (mean time between disease diagnosis and disease progression, 62.6 ± 43.8 months) (supplemental Table 4). p66Shc expression decreased with disease progression at the single-patient level, with a concomitant increase in IL-9 expression (Figure 7B) and organ infiltration (Table 2). Hence, a low p66Shc/high IL-9 status is not an intrinsic feature of CLL cells; it develops with disease progression.
Organ infiltration in patients with progressive CLL
| Patient | Organ | Asymptomatic disease | Active disease |
|---|---|---|---|
| #1 | Spleen | (vi) − | − |
| LN | − | + | |
| #2 | Spleen | − | + |
| LN | − | + | |
| #3 | Spleen | − | + |
| LN | − | + | |
| #4 | Spleen | − | + |
| LN | + | + | |
| #5 | Spleen | − | + |
| LN | + | + |
| Patient | Organ | Asymptomatic disease | Active disease |
|---|---|---|---|
| #1 | Spleen | (vi) − | − |
| LN | − | + | |
| #2 | Spleen | − | + |
| LN | − | + | |
| #3 | Spleen | − | + |
| LN | − | + | |
| #4 | Spleen | − | + |
| LN | + | + | |
| #5 | Spleen | − | + |
| LN | + | + |
Analyses were performed on 5 CLL patients with asymptomatic disease (asymptomatic) and at a later stage (active) when disease progressed sufficiently to require treatment. Organ infiltration was assessed as reported previously.6
−, undetectable organ infiltration; +, organ infiltration.
IL-9 blockade mitigates leukemic cell invasiveness in Eμ-TCL1/p66Shc−/− mice
To directly address the role of IL-9 in leukemic cell invasiveness, we carried out IL-9–blockade experiments in the aggressive CLL Eμ-TCL1p66Shc−/− mouse model.6 Mice with overt disease were administered anti–IL-9 or isotype-control mAb, intraperitoneally, twice a week for 4 weeks. Leukemic cell accumulation in spleen, lymph nodes (LNs), BM, and PB from euthanized mice was quantified by flow cytometry. IL-9 blockade resulted in decreased leukemic cell accumulation in spleen and LNs compared with isotype control, which was paralleled by an increased accumulation in PB (Figure 7C-E). qRT-PCR analysis of spleen and LN mRNA revealed a concomitant decrease in homing chemokine expression (Figure 7F; supplemental Figure 13). Flow cytometry of CCL2-labeled splenocytes and LN cells from mice subjected to IL-9 blockade confirmed in vivo that CCL2 is produced by reticular fibroblasts in an IL-9–dependent fashion (Figure 7G; supplemental Figure 13). The results provide in vivo evidence for a role for IL-9 in leukemic cell invasiveness.
Discussion
Here, we assessed the ability of CLL cells to promote the establishment of a promigratory stromal microenvironment. Using the Eμ-TCL1 mouse model of human CLL, we show that leukemic cells condition stromal cells to express homing chemokines that enhance their migration to and accumulation in the stroma through IL-9 production. We show that p66Shc deficiency in leukemic cells upregulates IL-9 production, a function involving its pro-oxidant activity. We validated these results in human CLL, showing that the enhanced ability of p66Shc-deficient leukemic cells to infiltrate nodal and extranodal sites is associated with increased IL-9 expression that, in turn, drives the stromal expression of homing chemokines.
The stromal microenvironment plays a central role in CLL pathogenesis.8,28 The cellular components of the microenvironment, including BM stromal cells, nurse-like cells, follicular dendritic cells, and endothelial cells, contribute to generate an environment that promotes the local proliferation of leukemic cells, favors their survival, and protects them from drug-mediated killing.7,8,29 CLL cells overexpress CXCR4, CCR7, and CXCR5,3,4,30,31 which promotes their migration toward the cognate ligand-expressing BM stromal cells and nurse-like cells.8 How CLL cells cross talk with stromal cells to generate a promigratory environment for other leukemic cells has received little attention. Here, we show that CLL cells condition stromal cells to enhance the production of CCL19 and CXCL13, which, by binding to CCR7 and CXCR5, respectively, promote CLL cell migration to lymphoid tissues. Additionally, CLL-conditioned stromal cells overexpress the CCR2 (CCL2) and CXCR3 (CXCL9/CXCL10/CXCL11) ligands, which attract immune cells to the liver and spleen,32,33 where CLL cells infiltrate at advanced disease stages.34,35 Expression of the CXCR4 ligand CXCL12, which promotes CLL cell homing and survival,8 is not significantly upregulated in stromal cells, suggesting that the increase in surface CXCR4 on CLL cells4,30 is sufficient for their effective homing to SLOs.
CLL cells shape the stroma to attract T cells and monocytes by producing CCL3 and CCL4.36,37 They also promote nurse-like cell differentiation by secreting the RAGE/TLR9 activator HMGB1 and induce their M2 polarization through NAD production.38,39 Here, we provide new insights into the cross talk of leukemic cells with the stromal microenvironment by highlighting a feed-forward loop in which the production of chemokines that attract CLL cells is reinforced by CLL cells themselves. Another chemokine-centered cross talk between leukemic and stromal cells has recently been identified: CLL cells produce retinoic acid that induces retinoic acid receptor signaling in stromal cells to upregulate CXCL13.40
We found that leukemic cell–conditioned supernatants promote homing chemokine expression by stromal cells and identified IL-9 as the soluble factor principally responsible for stromal cell conditioning by CLL cells. IL-9 is a cytokine produced by T cells, mast cells, neutrophils, and natural killer T cells41 that modulates chemokine expression in other cell types.24-26 Aberrant or ectopic IL-9 expression was found in pancreatic,42 colorectal,43 and non-small cell lung cancer.44 Furthermore, IL-9 contributes to regulatory T-cell– and mast cell–mediated immunosuppression in non-Hodgkin lymphoma.45 In agreement with published data,46 we demonstrate that CLL cells express IL-9 and show that higher levels are associated with unfavorable prognosis. Interestingly, we found that p66Shc deletion in leukemic Eμ-TCL1 cells or p66Shc deficiency in human CLL cells impacts on their ability to condition stromal cells by affecting IL-9 expression. We have reported that p66Shc modulates gene expression through its ROS-elevating activity, including genes encoding trafficking receptors,3,6 which favors leukemic cell accumulation in lymphoid and nonlymphoid niches.6 Here, we show that the ROS-elevating activity of p66Shc also modulates IL-9 expression in leukemic cells. Interestingly, the activity of FOXO1, the specific Il-9 transcription factor in T helper 9 cells,47 is upregulated in p66Shc−/− mouse embryonic fibroblasts.48 Our finding that IL-9 expression is negatively regulated by the ROS-elevating activity of p66Shc provides a mechanism linking p66Shc to Il-9 transcription.
Importantly, our data indicate that the IL-9–dependent enhancement in homing chemokine expression by stromal cells impinges on disease presentation, as demonstrated by the mitigating effects of IL-9 blockade on leukemic cell invasiveness in a mouse model of aggressive CLL. Consistently, CLL patients with the highest IL-9 expression have an increased frequency of lymphadenopathy and spleno-hepatomegaly, features that are associated with advanced disease and unfavorable prognosis.49 IL-9 expression in CLL cells further correlates with unmutated IGHV. Importantly, our evidence that IL-9 expression behaves as a putative predictor of poor disease outcome warrants extending the analysis to a larger patient cohort. Finally, IL-9 expression increases with disease progression in CLL patients, indicating that IL-9 blockade should be explored as a potential new approach to CLL treatment.
In summary, our data highlight a new feature of the cross talk between leukemic and stromal cells in CLL, controlled by p66Shc, that promotes the generation of a promigratory microenvironment to support leukemic cell homing and survival and, thereby, contributing to CLL presentation.
Microarray data have been deposited in the European Molecular Biology Laboratory-European Bioinformatics Institute under accession number E-MTAB-9761.
Data sharing requests should be sent to Cosima T. Baldari (baldari@unisi.it).
The online version of this article contains a data supplement.
The publication costs of this article were defrayed in part by page charge payment. Therefore, and solely to indicate this fact, this article is hereby marked “advertisement” in accordance with 18 USC section 1734.
Acknowledgments
The authors thank Sonia Grassini for technical assistance.
This work was supported by Associazione Italiana per la Ricerca sul Cancro under IG 2017 - ID. 20148 project (Principal Investigator, C.T.B.), as well as by Associazione Italiana per la Ricerca sul Cancro grants IG-15286 (G.S.) and IG-15397 (L.T.).
Authorship
Contribution: L.P., N.M., N.C., C.U., V.T., F.L., F. Finetti, F. Frezzato, A.V., M.M.D., L.T., G.S., and C.T.B. designed research and analyzed and interpreted data; L.P., N.M., N.C., C.U., V.T., F.L., F. Finetti, F. Frezzato, and A.V. performed research; M.M.D., L.T., and G.S. contributed vital reagents; and L.P., N.C., C.U., F. Frezzato, A.V., M.M.D., L.T., G.S., and C.T.B. wrote the manuscript.
Conflict-of-interest disclosure: The authors declare no competing financial interests.
The current affiliation for F.L. is Istituto di Ricovero e Cura a Carattere Scientifico, Istituto Ortopedico Galeazzi, Milan, Italy.
Correspondence: Cosima T. Baldari, University of Siena, Via Aldo Moro 2, 53100 Siena, Italy; e-mail: baldari@unisi.it; and Laura Patrussi, Università di Siena, Via Aldo Moro 2, 53100 Siena, Italy; e-mail: patrussi2@unisi.it.

This feature is available to Subscribers Only
Sign In or Create an Account Close Modal