

Key Points
Expression of mutant JAK2 increased the proportion of megakaryocyte-biased CD41hi hematopoietic stem cells with lower long-term potential.
IFNα further increased the proportion of CD41hi HSCs and depleted JAK2-mutant HSCs in mice and patients with MPN.

Abstract
We studied a subset of hematopoietic stem cells (HSCs) that are defined by elevated expression of CD41 (CD41hi) and showed bias for differentiation toward megakaryocytes (Mks). Mouse models of myeloproliferative neoplasms (MPNs) expressing JAK2-V617F (VF) displayed increased frequencies and percentages of the CD41hi vs CD41lo HSCs compared with wild-type controls. An increase in CD41hi HSCs that correlated with JAK2-V617F mutant allele burden was also found in bone marrow from patients with MPN. CD41hi HSCs produced a higher number of Mk-colonies of HSCs in single-cell cultures in vitro, but showed reduced long-term reconstitution potential compared with CD41lo HSCs in competitive transplantations in vivo. RNA expression profiling showed an upregulated cell cycle, Myc, and oxidative phosphorylation gene signatures in CD41hi HSCs, whereas CD41lo HSCs showed higher gene expression of interferon and the JAK/STAT and TNFα/NFκB signaling pathways. Higher cell cycle activity and elevated levels of reactive oxygen species were confirmed in CD41hi HSCs by flow cytometry. Expression of Epcr, a marker for quiescent HSCs inversely correlated with expression of CD41 in mice, but did not show such reciprocal expression pattern in patients with MPN. Treatment with interferon-α further increased the frequency and percentage of CD41hi HSCs and reduced the number of JAK2-V617F+ HSCs in mice and patients with MPN. The shift toward the CD41hi subset of HSCs by interferon-α provides a possible mechanism of how interferon-α preferentially targets the JAK2 mutant clone.
Introduction
Several studies have identified subsets of stem cells in the pool of phenotypic long-term hematopoietic stem cells (HSCs) with an intrinsic megakaryocytic (Mk) bias and propensity to commit directly to the Mk lineage.1-6 These subsets of HSCs have been defined primarily by functional readouts and increased expression of endogenous cell surface proteins (eg, high CD41 [CD41hi] or high c-Kit).4,7,8 Alternatively, expression of a reporter construct (VWF-GFP) has been used to identify Mk-biased HSCs.2 Among the known HSC marker genes, increased expression of the endothelial protein C receptor (Epcr, encoded by the Procr1 gene) on HSCs has been shown to mark functional long-term repopulating HSCs in mice.9,10
Myeloproliferative neoplasms (MPNs) are clonal stem cell disorders caused by somatic gene mutations in JAK2, CALR, or MPL.11 Patients with MPNs caused by mutated JAK2 can have distinct phenotypic manifestations that are classified as polycythemia vera (PV) with significant expansion of erythropoiesis, essential thrombocythemia with increased production of megakaryocytes and platelets, or primary myelofibrosis (PMF) with extramedullary hematopoiesis in the spleen.12 The concept of Mk lineage–biased subsets of HSCs provides a possible basis for the observation that the presence of the JAK2-V617F mutation in some patients with MPN can be restricted to 1 or 2 lineages (eg, granulocytes and/or platelets).13,14 In our previous studies in which we used transplantations of single HSCs, we observed that some recipient mice displayed a pure thrombocytosis phenotype, whereas others displayed pure erythrocytosis, which appeared to be mutually exclusive.15 Interferon-α (IFN-α) is currently the only treatment, apart from stem cell transplantation, that can induce deep molecular remission in a subset of patients with MPNs.16 The mechanism of how IFN elicits these beneficial effects in MPN remains poorly understood. IFN-α was shown to promote cell cycle entry and increase the division rate of normal HSCs.17
In this study, we investigated the functional role of Mk-biased HSCs in MPN in mouse models and samples from patients with MPN. We also examined the responsiveness of HSCs that express mutant JAK2 toward IFN-α. We found that mutant JAK2 led to the expansion of a CD41hi subset of HSCs and these CD41hi HSCs were inferior to the CD41lo subset of HSCs in sustaining long-term multilineage engraftment. Prolonged treat-ment with IFN-α further increased the proportion of CD41hi HSCs in JAK2 mutant mice and patients with MPN and resulted in a reduction of quiescent CD41lo HSCs capable of long-term maintenance of MPN, thus providing a possible mechanism of how IFN-α may induce molecular remissions in MPN.
Materials and methods
Mice
Tamoxifen inducible SclCre;JAK2-V617F (VF), SclCre;mJak2-V617F knock-in (Ki), and SclCre;JAK2 Exon12 (E12) transgenic mice have been described.18-20 JAK2 mutant mice were crossed with the UBC-GFP strain,21 and bone marrow (BM) cells that coexpress green fluorescent protein (GFP) as a reporter were used for competitive transplantations. SclCre;JAK2-V617F/Ifnr1−/− mice were generated by breeding SclCre;JAK2-V617F transgenic mice with the mice lacking Ifnr1.22 Cre recombinase expression was induced by intraperitoneal injection of 2 mg tamoxifen (Sigma-Aldrich) for 5 consecutive days. All mice were of pure C57BL/6N background and were maintained in specific-pathogen–free conditions and in accordance with Swiss federal regulations.
pIpC, pegIFN-α, and thrombopoietin treatment
Polyinosinic polycytidylic acid (pIpC; P1530; Sigma-Aldrich) was injected intraperitoneally (300 μg per mouse) every third day, and pegIFN-α (50 µg per mouse) was injected subcutaneously once per week. For thrombopoietin (TPO) treatment, a single dose of recombinant mouse TPO (Peprotech) was injected intraperitoneally (200 μg/kg per mouse).
BM transplantations
For competitive transplantation assays, fluorescence-activated cell sorting (FACS)-purified CD41hi or CD41lo HSCs subsets or Epcrhi or Epcrlo HSCs (50 cells) from VF or E12 transgenic mice or wild-type (WT) mice coexpressing GFP were mixed with 1 × 10⁶ BM cells of WT competitors and injected intravenously (in 200 μL phosphate buffered saline per mouse) into lethally irradiated (12 Gy) C57BL/6 recipients. Hematopoietic reconstitution was assessed by flow cytometry in peripheral blood (PB) at specified times.
Patients
The collection of blood and BM samples and clinical data from patients with MPN was approved by the Ethik Kommission Beider Basel and the ethics boards of the Universities of Innsbruck, Bonn, and RWTH Aachen. Written informed consent was obtained from all patients in accordance with the Declaration of Helsinki. The diagnosis of MPN was established according to the revised criteria of the World Health Organization.12
Results
Increased frequency of Mk-biased HSCs in mutant JAK2-expressing mice
We determined the frequencies of CD41hi and CD41lo HSCs in 3 Cre-inducible mouse models of MPN: transgenic mice expressing human JAK2-V617F (VF),18 a knock-in model expressing mouse Jak2-V617F (Ki),19 and transgenic mice expressing human JAK2-N542-E543del (E12).20 The gating strategy for the CD41hi subset of HSCs4 is shown in supplemental Figure 1A, available on the Blood Web site. As described previously,18-20 the frequencies of HSCs in BM and spleen in all 3 JAK2 mutant strains were increased compared with WT controls (Figure 1A). VF and Ki mutant mice also showed an absolute and relative increase of CD41hi HSCs in BM and spleen (Figure 1A), as well as an increase in CD41hi hematopoietic progenitors (supplemental Figure 1B). This increase in CD41hi HSCs was not observed in E12 mutant mice.

Increased frequency of CD41 expressing Mk-biased HSCs in mutant JAK2-expressing mice. (A) Frequencies (left) and percentages (right) of CD41hi and CD41lo HSCs within the phenotypic HSC compartment in BM in the indicated genotypes (n = 7 mice per genotype). Frequencies (left) and percentages (right) of CD41hi and CD41lo HSCs in the phenotypic HSC compartment in the spleen of the indicated genotype (n = 7 mice per genotype). (B) Analysis of colonies grown from a FACS-sorted single CD41hi or CD41lo HSC in liquid culture showing the percentages of colonies containing Mk (CD41+), myeloid (CD16+), or mixed (Mk and myeloid, CD41+/CD16+) cells after 10 days of culture. We plated 48 single HSCs per mouse with 3 mice per genotype in 384-well plates (ie, a total of 144 single cells per genotype) and scored each well separately after 10 days of culture. (C) Setup of transplantations with purified CD41hi and CD41lo HSC subsets into lethally irradiated recipients (n = 6 mice per cell type and genotype). Data show peripheral blood counts in recipients of CD41hi or CD41lo HSCs (top row) and donor chimerism determined as a percentage of GFP+ cells in PB (bottom row). Spleen weights of CD41hi and CD41lo HSC transplant-recipient mice at 24 weeks after transplantation are shown (top right graph). Group size: n = 6 mice per cell type and genotype. (D) Analysis of donor chimerism (percentage of GFP+ cells) in progenitor and stem cells in BM and spleen in CD41hi and CD41lo HSC transplant recipients at 24 weeks after transplantation (n = 6 mice per cell type and genotype). (E) Analysis of recipients of CD41lo HSC transplants. Stacked bar graph shows percentages of CD41lo and CD41hi HSCs in the GFP+ subset of LT-HSCs. One- or 2-way analyses of variance followed by Tukey’s multiple-comparisons test were used for multiple-group comparisons. All data are means ± standard error of the mean. *P < .05; **P < .01; ***P < .001; ****P < .0001.
Increased frequency of CD41 expressing Mk-biased HSCs in mutant JAK2-expressing mice. (A) Frequencies (left) and percentages (right) of CD41hi and CD41lo HSCs within the phenotypic HSC compartment in BM in the indicated genotypes (n = 7 mice per genotype). Frequencies (left) and percentages (right) of CD41hi and CD41lo HSCs in the phenotypic HSC compartment in the spleen of the indicated genotype (n = 7 mice per genotype). (B) Analysis of colonies grown from a FACS-sorted single CD41hi or CD41lo HSC in liquid culture showing the percentages of colonies containing Mk (CD41+), myeloid (CD16+), or mixed (Mk and myeloid, CD41+/CD16+) cells after 10 days of culture. We plated 48 single HSCs per mouse with 3 mice per genotype in 384-well plates (ie, a total of 144 single cells per genotype) and scored each well separately after 10 days of culture. (C) Setup of transplantations with purified CD41hi and CD41lo HSC subsets into lethally irradiated recipients (n = 6 mice per cell type and genotype). Data show peripheral blood counts in recipients of CD41hi or CD41lo HSCs (top row) and donor chimerism determined as a percentage of GFP+ cells in PB (bottom row). Spleen weights of CD41hi and CD41lo HSC transplant-recipient mice at 24 weeks after transplantation are shown (top right graph). Group size: n = 6 mice per cell type and genotype. (D) Analysis of donor chimerism (percentage of GFP+ cells) in progenitor and stem cells in BM and spleen in CD41hi and CD41lo HSC transplant recipients at 24 weeks after transplantation (n = 6 mice per cell type and genotype). (E) Analysis of recipients of CD41lo HSC transplants. Stacked bar graph shows percentages of CD41lo and CD41hi HSCs in the GFP+ subset of LT-HSCs. One- or 2-way analyses of variance followed by Tukey’s multiple-comparisons test were used for multiple-group comparisons. All data are means ± standard error of the mean. *P < .05; **P < .01; ***P < .001; ****P < .0001.
To investigate whether CD41hi HSCs also showed increased Mk differentiation potential, we performed single-cell liquid cultures of FACS-sorted CD41hi or CD41lo HSCs4 (Figure 1B; supplemental Figure 1C). The purity of the sorted HSCs was confirmed by postsort flow cytometry (supplemental Figure 1D). After 10 days of culture, CD41hi HSCs generated a higher percentage of Mk colonies composed of larger CD41+ cells, whereas CD41lo HSCs generated more myeloid or mixed-lineage colonies (Figure 1B; supplemental Figure 1E-F). This shift toward more Mk-biased output was less prominent in WT and E12 mutant mice compared with VF and Ki.
To assess the lineage potential of CD41hi and CD41lo HSCs in vivo, we performed competitive transplantations of sorted HSCs into lethally irradiated recipient mice (Figure 1C). To monitor chimerism, we used donor mice that were crossed with UBC-GFP mice that express GFP in all blood lineages.21 Recipients of CD41lo HSCs from VF and E12 donors developed a PV phenotype with splenomegaly, whereas recipients of CD41hi HSCs showed normal blood counts without splenomegaly (Figure 1C). Recipients of CD41lo HSCs showed higher GFP chimerism than recipients of CD41hi HSCs in all lineages of PB (Figure 1C) and also higher contribution to HSC and progenitor compartments in BM and spleen (Figure 1D). In BM of recipients transplanted with CD41lo HSCs, we found that most GFP+ (V617F-expressing) HSCs retained the original CD41lo phenotype, but ∼20% converted to CD41hi (Figure 1E), demonstrating that CD41lo HSCs can convert to CD41hi HSCs. Because of the lack of long-term engraftment, this analysis was not feasible in recipients of CD41hi HSCs. Thus, Mk-biased (CD41hi) HSCs preferentially contributed to megakaryopoiesis in vitro, and they were impaired in their lineage output and long-term repopulation capacity in vivo.
Expression of CD41 on subsets of HSCs inversely correlated with expression of EPCR
Expression of Epcr (Procr1) was described as a marker of quiescent HSCs.9,10 We found that the expression of Epcr mRNA and protein in HSCs inversely correlated with CD41 (supplemental Figure 2A). These data suggested that Epcrhi HSCs may be phenotypically and functionally comparable with CD41lo HSCs. Indeed, we found a decrease in the percentages of Epcrhi HSCs in BM and spleen of JAK2 mutant mice (Figure 2A; supplemental Figure 2B). We also found an ∼20-fold increase of circulating LSKs and HSCs in VF mice that were mostly Epcrlo (supplemental Figure 2C-D), consistent with earlier findings in mice.10
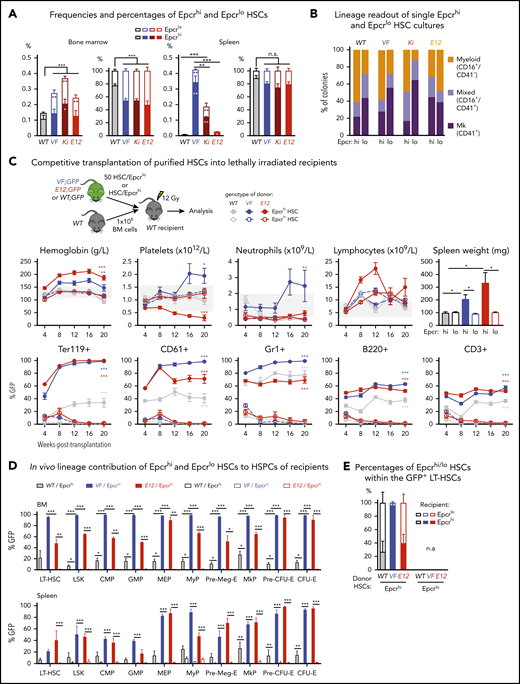
Expression analyses and functional characterization of Epcrhi and Epcrlo HSCs revealed an inverse correlation with CD41 expressing HSC subsets. (A) Frequencies (left) and percentages (right) of Epcrhi and Epcrlo HSCs within the phenotypic HSC compartment in BM and spleen of the indicated genotypes (n = 7-12 mice). (B) Analysis of colonies grown from FACS-sorted single Epcrhi and Epcrlo HSCs in liquid culture showing the percentages of colonies containing Mk (CD41+), myeloid (CD16+), or mixed (Mk and myeloid, CD41+/CD16+) cells after 10 days of culture (n = 128 cells per cell type/genotype and n = 3 mice). (C) Competitive BM transplantation. Hematopoietic lineage contributions of GFP+ Epcrhi and Epcrlo HSCs in the PB of recipients. Peripheral blood counts (top row) and donor derived (percentage of GFP+) cells (bottom row; n = 6 mice per genotype). Spleen weights of Epcrhi and Epcrlo HSC transplant recipients at 24 weeks after transplantation are shown (top right; n = 6-8 mice per cell type and genotype). (D) In vivo lineage contribution of Epcrhi and Epcrlo HSCs to HSPCs in transplant-recipient mouse BM and spleen at 24 weeks after transplantation (n = 4-6 mice cell type and genotype). (E) Percentages of Epcrhi and Epcrlo HSCs within the GFP+ subset of BM cells in transplant recipients at 24 weeks after transplantation. Note that only recipients of Epcrhi HSC transplants were analyzed, because, at 24 weeks, recipients of Epcrlo HSCs did not show GFP+ engraftment. All data are means ± standard error of the mean. *P < .05; **P < .01; ***P < .001.
Expression analyses and functional characterization of Epcrhi and Epcrlo HSCs revealed an inverse correlation with CD41 expressing HSC subsets. (A) Frequencies (left) and percentages (right) of Epcrhi and Epcrlo HSCs within the phenotypic HSC compartment in BM and spleen of the indicated genotypes (n = 7-12 mice). (B) Analysis of colonies grown from FACS-sorted single Epcrhi and Epcrlo HSCs in liquid culture showing the percentages of colonies containing Mk (CD41+), myeloid (CD16+), or mixed (Mk and myeloid, CD41+/CD16+) cells after 10 days of culture (n = 128 cells per cell type/genotype and n = 3 mice). (C) Competitive BM transplantation. Hematopoietic lineage contributions of GFP+ Epcrhi and Epcrlo HSCs in the PB of recipients. Peripheral blood counts (top row) and donor derived (percentage of GFP+) cells (bottom row; n = 6 mice per genotype). Spleen weights of Epcrhi and Epcrlo HSC transplant recipients at 24 weeks after transplantation are shown (top right; n = 6-8 mice per cell type and genotype). (D) In vivo lineage contribution of Epcrhi and Epcrlo HSCs to HSPCs in transplant-recipient mouse BM and spleen at 24 weeks after transplantation (n = 4-6 mice cell type and genotype). (E) Percentages of Epcrhi and Epcrlo HSCs within the GFP+ subset of BM cells in transplant recipients at 24 weeks after transplantation. Note that only recipients of Epcrhi HSC transplants were analyzed, because, at 24 weeks, recipients of Epcrlo HSCs did not show GFP+ engraftment. All data are means ± standard error of the mean. *P < .05; **P < .01; ***P < .001.
Liquid cultures of single-cell–sorted Epcrlo HSCs from VF, Ki, and WT (but not E12) mice produced higher percentages of Mk colonies than sorted Epcrhi HSCs produced (Figure 2B). Overall, the pattern of lineage output of Epcrlo and Epcrhi HSCs was converse to that of CD41lo and CD41hi HSCs (Figure 1B; supplemental Figure 2E). We also determined the reconstitution potential of Epcrlo and Epcrhi HSC subsets in competitive transplantations in vivo. We transplanted FACS-sorted HSCs along with 1 × 10⁶ total BM competitor cells into lethally irradiated recipient mice (Figure 2C). Recipients of Epcrhi HSCs from JAK2 mutant donor mice showed high GFP-chimerism and also developed MPN phenotype (Figure 2C). In contrast, Epcrlo HSC could not sustain long-term hematopoiesis and were outcompeted by the WT competitor cells. Only recipients of Epcrhi HSCs maintained GFP-chimerism at terminal workup 20 weeks after transplantation (Figure 2D). We determined the ratio of Epcrhi to Epcrlo in the GFP+ fraction of HSCs from BM (Figure 2E). Although in recipients of WT and E12 HSCs more than half of the originally Epcrhi HSCs converted to Epcrlo phenotype, in VF recipients almost all HSCs retained the original Epcrhi phenotype, because of the lack of long-term engraftment, this analysis was not feasible in recipients of Epcrlo HSCs. Thus, the CD41lo and Epcrhi HSCs were functionally similar in having competitive advantage and higher long-term repopulating activity.
Transcriptional profiling of CD41hi and CD41lo HSCs
To gain insights into the cellular and molecular identity and the signaling pathways active in Mk-biased HSCs, we performed RNA sequencing of total HSCs, CD41hi and CD41lo HSC subsets, bipotent megakaryocyte erythroid progenitors (MEPs), and committed megakaryocyte progenitors (MkPs; Figure 3A). Principal component analysis (PCA) revealed that CD41hi and CD41lo HSCs in WT mice clustered closer with unfractionated total HSCs than with MEPs or MkPs (Figure 3B). In VF mice, the unfractionated HSCs and the CD41hi and CD41lo subsets of HSCs each clustered farther apart, but were clearly distinct from MEPs and MkPs. CD41hi and CD41lo HSCs from WT and VF mice fell into 4 separate clusters (Figure 3C). The number of differentially expressed genes between CD41hi vs CD41lo HSCs are shown in Figure 3D. Gene Set Enrichment Analysis (GSEA) on differentially regulated genes between CD41hi and CD41lo HSCs revealed that E2F targets, G2/M checkpoint, Myc, mTORC1, and oxidative phosphorylation pathways were among the top upregulated gene pathways in CD41hi HSCs, whereas CD41lo HSCs had higher gene expression of inflammatory signaling pathways, such as IFNα, IFNγ, IL-6 JAK/STAT, and TNFα/NFκB (Figure 2E). Most of these differentially expressed gene pathways were found in both WT and VF genotypes.
![RNA sequencing profiling of CD41hi and CD41lo HSCs. (A) Stem and progenitor (HSPC) hierarchy. (B) PCA of the indicated HSPC subsets from WT and VF mice revealed transcriptional hierarchy within the HSPCs. (C) PCA of CD41hi and CD41lo HSC subsets from WT and VF mice. (D) The number of shared and differentially expressed genes in CD41hi and CD41lo HSC subsets between the WT and VF groups (false discovery rate [FDR] <.05 and fold change >1.5). (E) GSEA of differentially expressed molecular pathways from the MSigDB hallmark gene sets in CD41hi and CD41lo HSC subsets from WT and VF mice (FDR < .05). (F) Heat map of Mk/platelet lineage regulator expression in CD41hi and CD41lo HSC subsets from WT and VF mice (FDR <.05 and fold change >1.5). (G) Normalized expression levels of selected genes involved in HSC and Mk/platelet lineage regulation. The results obtained in CD41lo HSCs were set to 1 and compared with the corresponding values obtained in in CD41hi HSCs. Data are means ± standard error of the mean. *P < .05; **P < .01; ***P < .001.](https://ash.silverchair-cdn.com/ash/content_public/journal/blood/137/16/10.1182_blood.2020005563/2/m_bloodbld2020005563f3.png?Expires=1762529341&Signature=hsdkuxMbNOLzwUa9Gy0X7pUTOq-zejgYUIIopudwftJY0hCsy9anvDXRie01BB3fYDoW2fQRjlLt4usFGKLGlzv6biyxYMMtY9rni2OLaf1zOerjVB691eK~QsQvakQblMn-ZTnZ0R6kuStJYp9agehR1GsImZDBUNh9hZSntpZxKaOe3QTYJrb9zRHexHg0O57lB2otDZOMQX~SOUV7vAkcP~iahD1KoM1wcP3G10Dd35Ed8DQpUJ7PT6YKGT4spVznxcz3AyKCuWhrhK4D5mXd2fON-wfoPHiKwMTW7ZQKuBDsna6QWFi0yv719UVqzAnf5T~57WhByUdMYc7PXQ__&Key-Pair-Id=APKAIE5G5CRDK6RD3PGA)
RNA sequencing profiling of CD41hi and CD41lo HSCs. (A) Stem and progenitor (HSPC) hierarchy. (B) PCA of the indicated HSPC subsets from WT and VF mice revealed transcriptional hierarchy within the HSPCs. (C) PCA of CD41hi and CD41lo HSC subsets from WT and VF mice. (D) The number of shared and differentially expressed genes in CD41hi and CD41lo HSC subsets between the WT and VF groups (false discovery rate [FDR] <.05 and fold change >1.5). (E) GSEA of differentially expressed molecular pathways from the MSigDB hallmark gene sets in CD41hi and CD41lo HSC subsets from WT and VF mice (FDR < .05). (F) Heat map of Mk/platelet lineage regulator expression in CD41hi and CD41lo HSC subsets from WT and VF mice (FDR <.05 and fold change >1.5). (G) Normalized expression levels of selected genes involved in HSC and Mk/platelet lineage regulation. The results obtained in CD41lo HSCs were set to 1 and compared with the corresponding values obtained in in CD41hi HSCs. Data are means ± standard error of the mean. *P < .05; **P < .01; ***P < .001.
RNA sequencing profiling of CD41hi and CD41lo HSCs. (A) Stem and progenitor (HSPC) hierarchy. (B) PCA of the indicated HSPC subsets from WT and VF mice revealed transcriptional hierarchy within the HSPCs. (C) PCA of CD41hi and CD41lo HSC subsets from WT and VF mice. (D) The number of shared and differentially expressed genes in CD41hi and CD41lo HSC subsets between the WT and VF groups (false discovery rate [FDR] <.05 and fold change >1.5). (E) GSEA of differentially expressed molecular pathways from the MSigDB hallmark gene sets in CD41hi and CD41lo HSC subsets from WT and VF mice (FDR < .05). (F) Heat map of Mk/platelet lineage regulator expression in CD41hi and CD41lo HSC subsets from WT and VF mice (FDR <.05 and fold change >1.5). (G) Normalized expression levels of selected genes involved in HSC and Mk/platelet lineage regulation. The results obtained in CD41lo HSCs were set to 1 and compared with the corresponding values obtained in in CD41hi HSCs. Data are means ± standard error of the mean. *P < .05; **P < .01; ***P < .001.
Comparison of gene expression in CD41hi vs CD41lo HSCs, using a selected set of genes thought to play a role in HSC maintenance and Mk lineage regulation is shown in Figure 3F.2,4 As expected, expression levels of Itga2b (CD41) was higher in CD41hi HSCs and conversely, expression of Procr (Epcr) was higher in CD41lo HSCs (Figure 3F, red). Consistent with previous reports,2,4 CD41hi HSCs, irrespective of VF or WT genotype, also displayed elevated expression of megakaryocyte/platelet lineage regulators Clu, VWF, Gp1bb, Gp5, and Aurka than CD41lo HSCs. CD41hi HSCs also expressed Pf4 (Cxcl4), a known Mk lineage marker that was thought be exclusively expressed by later MK lineages, but recently was also detected in HSCs.23 Expression levels of Mk/platelet lineage regulator genes normalized to WT CD41lo HSCs (set as 1) are shown in Figure 3G. Together with the in vitro and in vivo functional testing, the molecular analysis suggests that CD41hi/Epcrlo HSCs are not lineage-restricted progenitors, such as MEPs or MkPs, but rather represent a subset of HSCs.
CD41hi /Epcrlo HSC subset display increased cell cycle activity and augmented oxidative phosphorylation
We used single-cell tracking of sorted HSCs and found that HSCs from VF mice entered the first and second cell divisions earlier than WT controls or E12 mice (Figure 4A). Because RNA sequencing showed prominent differences between CD41hi/Epcrlo and CD41lo/Epcrhi HSC subsets in expression of cell cycle regulators, we compared their cell cycle status by flow cytometry. In WT mice, a lower percentage of CD41hi/Epcrlo HSCs were quiescent in the G0 phase, and a higher percentage of cells were in the G1/S phases compared with CD41lo/Epcrhi HSCs. These differences were even more pronounced in mutant JAK2-expressing mice (Figures 4B-C). Consistently, CD41hi HSC subset showed higher expression of cell cycle activators Cdk1, Cdk2, Cdk4, Cdk6, and cyclin E1, and lower expression of cell cycle inhibitors Cdkn1c (p57) compared with the CD41lo HSC subset (supplemental Figure 3), suggesting that CD41hi HSCs represent an activated subset of phenotypic HSCs.
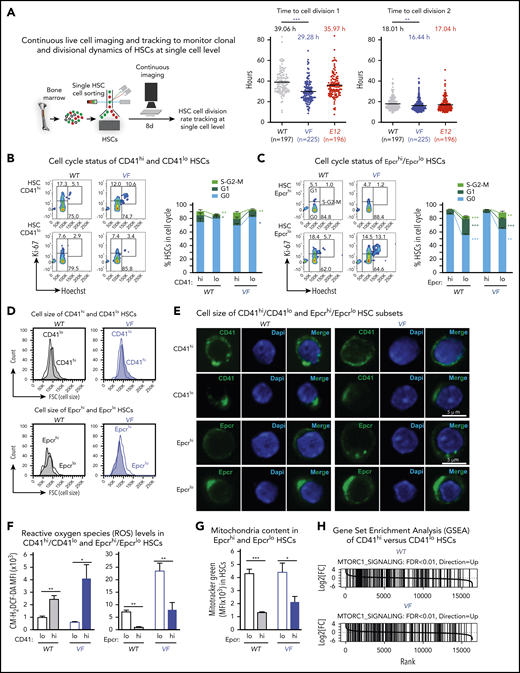
CD41hi /Epcrlo HSCs display enhanced cell cycle activity, increased mitochondrial content, and augmented mTOR signaling signature. (A) Experimental setup for measuring time to first cell division by single-cell tracking of sorted HSCs. (B,C) Dot plots show the time to the first and second cell divisions. Cell cycle status of CD41hi and CD41lo HSCs (B) and Epcrhi and Epcrlo HSCs (C). Increased percentage of Epcrlo and CD41hi HSCs reside in G1 and S phases (WT, n = 4 mice; VF, n = 7 mice). (D) Cell size of Epcrhi and Epcrlo HSCs (top) and CD41hi and CD41lo HSCs (bottom) assessed by the forward scatter parameter in flow cytometry (n = 6 mice per genotype). (E) Confocal microscopy of CD41lo and CD41hi HSCs and Epcrhi and Epcrlo HSCs revealed increased cell size of the Epcrhi and CD41lo HSC subsets. (F) ROS levels in Epcrhi/Epcrlo and CD41hi and CD41lo HSC subsets showing CM-H2DCF-DA mean fluorescence intensity (MFI; n = 6 mice per genotype). G) Mitochondria content in Epcrhi and Epcrlo HSCs detected with Mitotracker Green MFI (n = 6 mice per genotype). (H) GSEA of CD41hi and CD41lo HSCs showing increased expression of genes involved in mTOR signaling in CD41hi vs CD41lo HSCs (false discovery rate <.01). All data are means ± standard error of the mean. *P < .05; **P < .01; ***P < .001.
CD41hi /Epcrlo HSCs display enhanced cell cycle activity, increased mitochondrial content, and augmented mTOR signaling signature. (A) Experimental setup for measuring time to first cell division by single-cell tracking of sorted HSCs. (B,C) Dot plots show the time to the first and second cell divisions. Cell cycle status of CD41hi and CD41lo HSCs (B) and Epcrhi and Epcrlo HSCs (C). Increased percentage of Epcrlo and CD41hi HSCs reside in G1 and S phases (WT, n = 4 mice; VF, n = 7 mice). (D) Cell size of Epcrhi and Epcrlo HSCs (top) and CD41hi and CD41lo HSCs (bottom) assessed by the forward scatter parameter in flow cytometry (n = 6 mice per genotype). (E) Confocal microscopy of CD41lo and CD41hi HSCs and Epcrhi and Epcrlo HSCs revealed increased cell size of the Epcrhi and CD41lo HSC subsets. (F) ROS levels in Epcrhi/Epcrlo and CD41hi and CD41lo HSC subsets showing CM-H2DCF-DA mean fluorescence intensity (MFI; n = 6 mice per genotype). G) Mitochondria content in Epcrhi and Epcrlo HSCs detected with Mitotracker Green MFI (n = 6 mice per genotype). (H) GSEA of CD41hi and CD41lo HSCs showing increased expression of genes involved in mTOR signaling in CD41hi vs CD41lo HSCs (false discovery rate <.01). All data are means ± standard error of the mean. *P < .05; **P < .01; ***P < .001.
In addition, we noted that CD41hi/Epcrlo HSCs were larger than CD41lo/Epcrhi HSCs, as indicated by higher forward scatter (size) values (Figure 4D). Interestingly, the CD41 and Epcr antibody labeling appeared to be polarized and forming caps in CD41lo/Epcrhi HSCs (Figure 4E). Furthermore, as a consequence of augmented oxidative phosphorylation we found that CD41hi/Epcrlo HSCs harbored higher levels of reactive oxygen species (ROS) compared with CD41lo/Epcrhi HSCs (Figure 4F). Using the dye Mitotracker Green, we detected increased mitochondria mass in Epcrlo HSCs compared with the Epcrhi subset (Figure 4G), consistent with CD41hi/Epcrlo HSCs being the metabolically more active HSC subset. Increased cell size, enhanced activation of HSCs from quiescence, and active metabolism are some of the hallmark signatures of active mTOR signaling.24 Indeed, GSEA analysis highlighted Raptor (mTORC1), an essential component of mTOR signaling, as one of the upregulated pathways in CD41hi HSC subset (Figure 4H). Collectively, these data confirm the differences derived from RNA sequencing analysis.
Increased percentages of CD41hi of hematopoietic stem and progenitor cells in the BM of patients with MPN
To determine whether the markers for Mk-biased HSCs can also be used in human MPN, we assessed the percentages of CD41hi hematopoietic stem and progenitor cells (HSPCs) in the BM of patients with MPN and healthy controls (Figure 5A; supplemental Figure 4). Similar to our findings in mice, the human CD41hi HSPCs also displayed increased size (supplemental Figure 5A). The percentage of CD41hi HSCs in BM from healthy controls (n = 7) was very low (1.4% ± 0.45% standard error of the mean [SEM]; Figure 5A, left). Of note, HSCs derived from cord blood (n = 8) showed a substantially higher percentage of CD41hi HSCs (11.2% ± 9.5% SEM) than did BM from healthy adult controls (supplemental Figure 5B), illustrating differences between HSPCs from cord blood and BM. The percentages of CD41hi HSCs in BM of patients with MPN (n = 29) was significantly increased 20.4% ± 4.0% SEM (P = .001; Figure 5A, left). The percentages of CD41hi cells were also elevated in common myeloid progenitors (CMP), granulocyte macrophage progenitors (GMP), and MEP, and this increase was again greater in patients with MPN (35% to 40%) than in healthy controls (∼12%; Figure 5A).
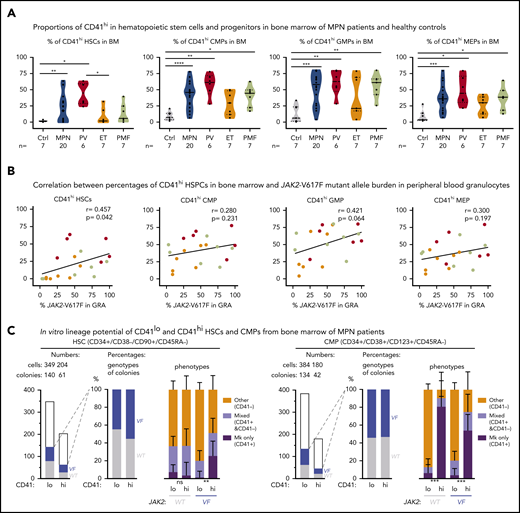
Increased abundance of CD41+ HSPCs in the BM of patients with MPN. (A) Violin plots showing percentages of CD41hi HSC, CMP, GMP, and MEP progenitor cells in the BM of controls (n = 7) and patients with MPN (n = 29). Unpaired t test with Welch’s correction. (B) Correlation (r, Pearson correlation) and significance (2-tailed Student t test) between mutant allele burden measured in PB granulocytes and percentages of CD41+ HSPCs in the BM were calculated and are shown for JAK2-V617F+ patients only. (r, Pearson correlation; P, 2-tailed Student t test). No correlation was observed in patients with the CALR mutation. (C) In vitro lineage potential of CD41lo and CD41hi HSCs and CMPs. FACS-sorted single cells were grown in 384-well plates, and, after 14 days of culture, colonies were first phenotyped inside the wells by CD41 antibody staining and live microscopy and then genotyped by allele-specific polymerase chain reaction (PCR)for JAK2-V617F. Combined data from 4 JAK2-V617F+ patients with MPN (2 PV and 2 PMF) are shown, along with the number of CD41lo and CD41hi single cells plated and the number of colonies with WT (gray) and JAK2-V617F (VF; blue) genotypes (left) and the percentages of VF vs WT colonies and the percentages of Mk colonies (all cells CD41+), mixed colonies (CD41+ and CD41− cells present in the same colony), and colonies with other phenotypes (all cells CD41− in the same colony) (right). Differences in lineage proportions between CD41lo and CD41hi populations were tested by Fisher’s exact test with the Hochberg correction for multiple testing. All data are means ± standard error of the mean; ns, not significant; *P < .05; **P < .01; ***P < .001; ****P < .0001.
Increased abundance of CD41+ HSPCs in the BM of patients with MPN. (A) Violin plots showing percentages of CD41hi HSC, CMP, GMP, and MEP progenitor cells in the BM of controls (n = 7) and patients with MPN (n = 29). Unpaired t test with Welch’s correction. (B) Correlation (r, Pearson correlation) and significance (2-tailed Student t test) between mutant allele burden measured in PB granulocytes and percentages of CD41+ HSPCs in the BM were calculated and are shown for JAK2-V617F+ patients only. (r, Pearson correlation; P, 2-tailed Student t test). No correlation was observed in patients with the CALR mutation. (C) In vitro lineage potential of CD41lo and CD41hi HSCs and CMPs. FACS-sorted single cells were grown in 384-well plates, and, after 14 days of culture, colonies were first phenotyped inside the wells by CD41 antibody staining and live microscopy and then genotyped by allele-specific polymerase chain reaction (PCR)for JAK2-V617F. Combined data from 4 JAK2-V617F+ patients with MPN (2 PV and 2 PMF) are shown, along with the number of CD41lo and CD41hi single cells plated and the number of colonies with WT (gray) and JAK2-V617F (VF; blue) genotypes (left) and the percentages of VF vs WT colonies and the percentages of Mk colonies (all cells CD41+), mixed colonies (CD41+ and CD41− cells present in the same colony), and colonies with other phenotypes (all cells CD41− in the same colony) (right). Differences in lineage proportions between CD41lo and CD41hi populations were tested by Fisher’s exact test with the Hochberg correction for multiple testing. All data are means ± standard error of the mean; ns, not significant; *P < .05; **P < .01; ***P < .001; ****P < .0001.
Within the MPN subgroups, PV patients had the highest percentage of CD41hi HSPCs, followed by PMF and essential thrombocythemia. We found a correlation between the percentages of CD41hi HSPCs in the BM of patients with MPN and the corresponding JAK2-V617F allele burden in PB granulocytes (Figure 5B). These results suggest that expression of JAK2-V617F may be primarily responsible for the expansion of CD41hi HSCs. Increased percentages of CD41hi HSPCs in the BM of patients with MPN did not correlate with increasing age (supplemental Figure 5C-D), contrary to a previous report that found an age-dependent increase in CD41hi HSCs in older WT mice.3 We performed single-cell liquid cultures of FACS-sorted CD41hi and CD41lo HSCs and CMPs from 4 patients with MPN. Approximately 50% of HSC- and CMP-derived colonies were JAK2-V617F+ by allele-specific polymerase chain reaction (PCR; Figure 5C). The JAK2-V617F+ CD41hi HSCs gave rise to a significantly higher percentage of pure Mk colonies (all CD41+ cells) compared with CD41lo HSCs, but this difference was not observed in WT CD41hi vs CD41lo HSCs (Figure 5C). Colonies derived from CD41hi CMPs were predominantly of pure Mk phenotype irrespective of the genotype. (Figure 5C, right). Overall, the Mk output of JAK2-mutant HSCs in vitro was similar as observed in the experiments using sorted mouse VF and Ki HSCs (Figure 1B). Collectively, these data indicate that changes induced by expression of mutant JAK2 cause expansion of Mk-biased HSCs in MPN mouse models and patients with MPN, and their frequency was significantly associated with the JAK2-V617F mutant allele burden.
We also examined the expression of EPCR on human BM cells. However, HSCs from healthy controls were almost exclusively EPCRlo (supplemental Figure 6). Thus, in contrast to mice, the expression of EPCR in humans did not inversely correlate with the expression of CD41 and we therefore used CD41 as a marker to further characterize human Mk-biased HSCs.
Interferon signaling induces expansion of CD41hi HSCs in mice
Type 1 interferons (IFN-α, IFN-β) and type 2 interferons (IFN-γ) were shown to promote cell cycle entry and induce differentiation of quiescent HSCs.17,25 RNA sequencing showed increased expression of IFN pathway genes in CD41lo HSCs (Figure 3E; supplemental Figure 7A-B), suggesting that CD41lo HSC subsets may be more responsive to IFN stimuli. To examine the effects of IFN on CD41 subsets of HSCs in vivo, we treated VF and WT mice with pIpC, an IFN-inducing agent.17,25,26 Injection of a single dose of pIpC significantly increased the percentage of CD41hi HSCs within 24 hours in both VF mice and WT mice (Figure 6A; supplemental Figure 8).19,27 This response to pIpC was completely abolished in VF and WT mice genetically deficient in the IFN receptor (Ifnr1; Figure 6A).22 Interestingly, loss of Ifnr1 also lowered the baseline percentages of CD41hi cells in VF;Ifnr1−/− mice to the levels found in WT mice, indicating that the increased baseline in VF mice also requires IFN signaling. Indeed, IFN-β levels were elevated in BM lavage of VF and Ki mice compared with WT (supplemental Figure 7C), suggesting that the observed JAK2-V617F-induced IFN response is indirect and mediated by increased levels of type 1 IFN family members.
![Prolonged IFN treatment induces depletion of quiescent HSCs via continuous induction of CD41hi HSC subset. (A-B) Percentages of CD41hi and Epcrhi HSCs in the BM after 24 hours of saline or pIpC treatment in mice with the indicated genotypes (2-way analysis of variance [ANOVA]). (C) Competitive BM transplantation and pegIFN-α treatment regimen, with hemoglobin levels and platelet counts in the PB of pegIFN-α– or vehicle-treated recipient mice and spleen weight in the recipient mice at 22 weeks after the treatment (n = 5 mice per group). (D) Analysis of HSC subpopulations after 22 weeks of treatment in BM and spleen of pegIFN-α– or vehicle-treated, transplant-recipient mice. Gating on GFP+ cells enabled determination of the CD41hi/lo ratios selectively in JAK2-mutant (VF) vs GFP− HSCs. Shown are the frequencies (top) and percentages (bottom) of HSC subsets (n = 5 mice per genotype). Statistical significance between pegIFN-α– and vehicle-treated mice was derived by 2-way ANOVA. (E) Frequencies and percentages of CD41hi and CD41lo HSCs in PBMCs of pegIFN-α–treated (n = 13) and control patients with MPN receiving best available therapy (BAT; n = 33). Unpaired Student t test with Welch’s correction. All data are means ± standard error of the mean. *P < .05; **P < .01; ***P < .001.](https://ash.silverchair-cdn.com/ash/content_public/journal/blood/137/16/10.1182_blood.2020005563/2/m_bloodbld2020005563f6.png?Expires=1762529341&Signature=2JUWeYSvALU0lc73RBt8g-cKAMQM0hrM6QbuOd9qakIA6rrUhl~zGX60OWvVHU0O8XdUuuP6PGV-apC5rypaK386AOQ04M4byR1WgmBtYC35WuYOmMHw-Vgd3S-DNNsv4mSQVJL5HL2l~NRqy4~NWmE1yYlPtqB7haOnUMmC8KUXpoA-5Z8AhP5icxIRrVUBXOlg7WrOgKPYKBrK2HTDIfD5FtOOpKnjyKqNS7X0O1vo-cZVMUUODpI-8WTaj-3mV2PJd3k1ySoSHBOD-5YJwEE80g3~Cdfv-0hMyvY9s5vktkCrmKpHtvto4P9dnq1bJjbX3SCYzQCfq1UqqpZkOg__&Key-Pair-Id=APKAIE5G5CRDK6RD3PGA)
Prolonged IFN treatment induces depletion of quiescent HSCs via continuous induction of CD41hi HSC subset. (A-B) Percentages of CD41hi and Epcrhi HSCs in the BM after 24 hours of saline or pIpC treatment in mice with the indicated genotypes (2-way analysis of variance [ANOVA]). (C) Competitive BM transplantation and pegIFN-α treatment regimen, with hemoglobin levels and platelet counts in the PB of pegIFN-α– or vehicle-treated recipient mice and spleen weight in the recipient mice at 22 weeks after the treatment (n = 5 mice per group). (D) Analysis of HSC subpopulations after 22 weeks of treatment in BM and spleen of pegIFN-α– or vehicle-treated, transplant-recipient mice. Gating on GFP+ cells enabled determination of the CD41hi/lo ratios selectively in JAK2-mutant (VF) vs GFP− HSCs. Shown are the frequencies (top) and percentages (bottom) of HSC subsets (n = 5 mice per genotype). Statistical significance between pegIFN-α– and vehicle-treated mice was derived by 2-way ANOVA. (E) Frequencies and percentages of CD41hi and CD41lo HSCs in PBMCs of pegIFN-α–treated (n = 13) and control patients with MPN receiving best available therapy (BAT; n = 33). Unpaired Student t test with Welch’s correction. All data are means ± standard error of the mean. *P < .05; **P < .01; ***P < .001.
Prolonged IFN treatment induces depletion of quiescent HSCs via continuous induction of CD41hi HSC subset. (A-B) Percentages of CD41hi and Epcrhi HSCs in the BM after 24 hours of saline or pIpC treatment in mice with the indicated genotypes (2-way analysis of variance [ANOVA]). (C) Competitive BM transplantation and pegIFN-α treatment regimen, with hemoglobin levels and platelet counts in the PB of pegIFN-α– or vehicle-treated recipient mice and spleen weight in the recipient mice at 22 weeks after the treatment (n = 5 mice per group). (D) Analysis of HSC subpopulations after 22 weeks of treatment in BM and spleen of pegIFN-α– or vehicle-treated, transplant-recipient mice. Gating on GFP+ cells enabled determination of the CD41hi/lo ratios selectively in JAK2-mutant (VF) vs GFP− HSCs. Shown are the frequencies (top) and percentages (bottom) of HSC subsets (n = 5 mice per genotype). Statistical significance between pegIFN-α– and vehicle-treated mice was derived by 2-way ANOVA. (E) Frequencies and percentages of CD41hi and CD41lo HSCs in PBMCs of pegIFN-α–treated (n = 13) and control patients with MPN receiving best available therapy (BAT; n = 33). Unpaired Student t test with Welch’s correction. All data are means ± standard error of the mean. *P < .05; **P < .01; ***P < .001.
Similarly, pIpC treatment also decreased the percentages of Epcrhi HSC subsets in both VF and WT mice (Figure 6B). Loss of Ifnr1 reduced the effect of pIpC, although a trend toward lower percentages of Epcrhi HSC remained, suggesting that pIpC can induce Ifnr1 independent signaling events. Thus, short-term IFN signaling in JAK2 mutant mice increased the fraction of CD41hi/Epcrlo Mk-biased HSCs. A single dose of Tpo increased the percentage of CD41hi HSCs in WT and VF mice (supplemental Figure 8C), indicating that the phenotypic shift to CD41hi is not specific to the mutant JAK2. Contrary to expectations, Tpo in the same experiment did not reduce the percentages of Epcrhi HSCs in WT or VF mice, demonstrating that CD41 and Epcr subpopulations of HSCs do not always behave reciprocally. This result was not related to alterations in the expression of IFN-dependent cell surface markers such as Sca-1,28 as demonstrated by expression of another HSC marker, Esam-1,29,30 on nearly all CD41lo and CD41hi HSC subsets (supplemental Figure 9).
Long-term IFN treatment increases the fraction of CD41hi HSCs and leads to exhaustion of HSCs
We expected that augmenting the CD41hi HSCs fraction by IFN-α will eventually lead to a decrease in the JAK2 mutant clone size. We tested this hypothesis in mice by competitive BM transplantations of BM cells from VF mice that coexpress the GFP reporter mixed with WT BM cells in a 1:1 ratio (Figure 6C). Recipient mice were allowed to engraft and reconstitute for 6 weeks and were then treated with pegylated IFN-α (pegIFN-α), which has a longer half-life in the circulation than native IFN-α31 or vehicle only (Figure 6C). Consistent with its known therapeutic effects in patients with MPN, pegIFN-α treatment significantly reduced hemoglobin levels, platelet counts, and spleen size.
At terminal workup after 22 weeks, mice treated with pegIFN-α also showed decreased JAK2-V617F mutant allele burden in HSCs, as indicated by reduced frequencies and percentages of GFP+ HSCs in BM and spleen (Figure 6D). The total frequencies of HSCs increased in the pegIFN-α–treated mice, but this was because of an increase in GFP− (WT) HSCs. In the GFP+ (JAK2-mutant) fraction of HSCs, the pegIFN-α–treated mice showed an increase in the percentages of CD41hi HSCs. Interestingly, in the BM of vehicle-treated mice, the GFP− HSCs (but not in the spleen) were almost 100% CD41hi, suggesting that the presence of the JAK2-V617F (GFP+) cells had an influence on the CD41 phenotype of the WT HSCs. The JAK2-WT HSPCs responded to pegIFN-α by increasing in total frequencies and the percentages of the CD41lo subsets, suggesting that they recover from the damaging presence of the JAK2-V617F expressing cells. This notion is supported by the histological findings of improved BM morphology in the pegIFN-α–treated group (supplemental Figure 10). These results suggest that IFN-α preferentially reduces JAK2-V617F (GFP+) HSCs by increasing the proportion of CD41hi subset of HSCs (Figure 6D). The converse changes were observed when Epcr expression was analyzed instead of CD41 (supplemental Figure 11). Similar effects of pegIFN-α as in LT-HSCs were also observed in ST-HSCs and MPPs (supplemental Figure 11D-E).
We also compared HSC numbers and CD41hi vs CD41lo phenotypes in PB of 13 patients with MPN treated by pegIFN-α with 33 patients with MPN receiving best available therapy. We observed lower frequencies of phenotypic HSCs in the pegIFN-α–treated group (Figure 6E).
Based on the data, we propose a model (Figure 7), in which short-term exposure of HSCs to IFN induces cell cycle entry and conversion from CD41lo to CD41hi Mk-biased HSCs. Prolonged chronic exposure to pegIFN-α results in depletion of JAK2-mutant HSCs via continuous conversion of CD41lo to the CD41hi HSC subset.

Model depicting the effects of mutant JAK2 and IFN-α on the proportion of megakaryocyte-biased (CD41hi) HSCs. (A) HSC homeostasis in BM of WT mice. The proportion of CD41hi HSCs is low (∼30%). (B) HSC pool in MPN mice expressing mutant JAK2. The proportion of CD41hi HSCs is increased (≤50%) because of the expression of mutant JAK2. CD41hi HSCs in mice are characterized by lower Epcr expression, active cell cycle state, increased cell size, increased ROS levels, reduced long-term reconstitution potential in vivo, and Mk-biased potential in vitro. The effect of the mutant JAK2 on CD41 subset is mediated by the VF-induced IFN response and requires the presence of Ifnr1. (C) Summary of alterations in the HSC compartment of mice or patients with MPN treated with pegIFNα.
Model depicting the effects of mutant JAK2 and IFN-α on the proportion of megakaryocyte-biased (CD41hi) HSCs. (A) HSC homeostasis in BM of WT mice. The proportion of CD41hi HSCs is low (∼30%). (B) HSC pool in MPN mice expressing mutant JAK2. The proportion of CD41hi HSCs is increased (≤50%) because of the expression of mutant JAK2. CD41hi HSCs in mice are characterized by lower Epcr expression, active cell cycle state, increased cell size, increased ROS levels, reduced long-term reconstitution potential in vivo, and Mk-biased potential in vitro. The effect of the mutant JAK2 on CD41 subset is mediated by the VF-induced IFN response and requires the presence of Ifnr1. (C) Summary of alterations in the HSC compartment of mice or patients with MPN treated with pegIFNα.
Discussion
Our study provides insights into the functional properties of Mk-biased HSCs in the context of JAK2-mutated MPN. We found that expression of mutant JAK2 increased the frequency and percentage of the CD41hi subset of HSCs in mouse models of MPN. CD41hi HSCs displayed reduced competitiveness for long-term reconstitution in competitive transplantation assays. CD41 was also a valid marker for Mk-biased HSCs in patients with JAK2-mutated MPN. In addition, we found that expression of Epcr, a marker for quiescent HSCs was inversely correlated with the CD41 expression on HSCs in mice, but not in patients with MPN. The basis for the differences in EPCR expression patterns between mice and humans is currently unknown.
CD41hi HSCs are actively proliferating, lineage-primed cells and could represent a fraction of the previously reported VWF+ HSCs,2 or G (Alert) state HSCs.24 CD41hi HSCs displayed higher ROS levels and higher mitochondrial content, in agreement with a previous report that WT HSCs with high mitochondrial activity exhibited megakaryocytic lineage differentiation in vitro32 and is consistent with our previous report on altered metabolic activity in mutant JAK2-expressing HSCs.33,34 There is no consensus in the field as to whether these cells should be called HSCs.1,4 A recent study challenged the existence and relationship of Mk-biased HSCs with phenotypic HSCs.35 Using in vitro single-cell assays the results in study indicated that Mk progenitors are not directly derived from HSCs, but rather share a similar surface marker phenotype and may represent merely an impurity of myeloid progenitors among HSCs. Our RNA sequencing data of the CD41hi subset showed features typical of HSCs and in our in vivo functional assays, the CD41hi subset gave rise to multilineage contribution, but did not sustain long-term hematopoiesis.
IFN-α treatment is the only therapy known to induce molecular remission in a subset of patients with MPN,16 but the mechanism of IFN action in MPN remains unclear. In mice, IFN-α treatment was shown to reduce the number of HSCs, suggesting that IFN-α acts by exhausting the JAK2 mutant HSCs.19,27,36,37 Our study provides further insight into the possible mechanism by showing that long-term treatment with pegIFN-α preferentially increased the frequency and percentage of CD41hi HSCs in JAK2-V617F-expressing HSCs. This leads to a model of how IFN-α, in combination with JAK2-V617F, induces HSC cycling,15 could selectively reduce the JAK2 mutant clone (Figure 7). Our study does not exclude other cellular targets by which IFN-α could mediate disease-modifying activity. It has been shown that IFN treatment can disrupt canonical TGF-β signaling and also remodels the BM microvasculature.38,39
In summary, our study showed that expression of mutant JAK2 increases the proportion of CD41hi HSCs that are less robust in maintaining long-term hematopoiesis. IFN-α further accentuated this shift toward CD41hi HSCs, suggesting that continuous conversion of CD41lo to the CD41hi HSC subset may be a mechanism of how IFN-α preferentially targets and exhausts the JAK2 mutant clone.
The RNA-sequencing data have been submitted to the Gene Expression Omnibus under accession number GSE132570 and GSE 116571.
For original data and reagents, please contact radek.skoda@unibas.ch.
The online version of this article contains a data supplement.
The publication costs of this article were defrayed in part by page charge payment. Therefore, and solely to indicate this fact, this article is hereby marked “advertisement” in accordance with 18 USC section 1734.
Acknowledgments
The authors thank members of their laboratory for helpful discussions and critical reading of the manuscript; Albert Neutzner for help with the pegylation of IFNα; Jean-Luc Villeval for providing the Jak2-V617F knock-in mice; Philippe Demougin and Katja Eschbach (D-BSSE, Genomics Facility Basel) for conducting next-generation sequencing; sciCORE (http://scicore.unibas.ch/) Scientific Computing Center at the University of Basel for performing analyses of RNASeq data; and Kristina Pannen for help with shipment of samples.
This work was supported by grants from the Swiss National Science Foundation (31003A-147016/1, 31003A_166613, and 31003A_179490), SystemsX.ch (Medical Research and Development grant 2014/266), the Swiss Cancer League (KFS-3655-02-2015 and KFS-4462-02-2018) (R.C.S.), the German Research Foundation (DFG KO 2155/6-1) (S.K.), and by the Czech Science Foundation grant 17-05988S (J.S.).
Authorship
Contribution: T.N.R. designed and performed the research, analyzed the data, and wrote the manuscript; N.H., J.S., D.L.P., J.H., M.E., N.A., L.K., M.R., H.H.-S., C.B., and S.D. performed the research and analyzed the data; F.G., M.K., T.S., T.H.B., D.W., and S.K. analyzed the data; and R.C.S. designed the research, analyzed the data, and wrote the manuscript.
Conflict-of-interest disclosure: R.C.S. has consulted for and received honoraria from Novartis, Shire, and Baxalta. S.K. reports research funding from Novartis, AOP Orphan Pharmaceuticals AG, and Bristol-Myers Squibb as well as consultancy honoraria and travel reimbursements from Novartis, AOP Orphan Pharmaceuticals AG, and Bristol-Myers Squibb. DW consulted for and received honoraria from Novartis, BMS/Celgene and Baxalta. T.H.B. has consulted for and/or received honoraria from Pfizer Novartis, Ariad and Janssen and research support from Novartis and Pfizer. The remaining authors declare no competing financial interests.
The current affiliation for T.N.R. is Department of Hematology and Central Hematology Laboratory, Inselspital, Bern University Hospital, University of Bern and Department for BioMedical Research, University of Bern, Bern, Switzerland.
Correspondence: Radek C. Skoda, Department of Biomedicine, University of Basel–University Hospital Basel, Hebelstrasse 20, 4031 Basel, Switzerland; e-mail: radek.skoda@unibas.ch; and Tata Nageswara Rao, Department of Hematology and Central Hematology Laboratory, Inselspital, Bern University Hospital, University of Bern and Department for BioMedical Research, University of Bern, Murtenstrasse 40, 3008 Bern, Switzerland; e-mail: tata.nageswararao@dbmr.unibe.ch.

This feature is available to Subscribers Only
Sign In or Create an Account Close Modal