

Key Points
After a median of 6 years of follow-up among 264 relatives of CLL patients, the age- and sex-adjusted incidence of MBL was 3.5%.
Among 139 relatives of CLL patients with low-count MBL, the estimated progression to CLL was 1.1%/y.

Abstract
Chronic lymphocytic lymphoma (CLL) has one of the highest familial risks among cancers. Monoclonal B-cell lymphocytosis (MBL), the precursor to CLL, has a higher prevalence (13%-18%) in families with 2 or more members with CLL compared with the general population (5%-12%). Although, the rate of progression to CLL for high-count MBLs (clonal B-cell count ≥500/µL) is ∼1% to 5%/y, no low-count MBLs have been reported to progress to date. We report the incidence and natural history of MBL in relatives from CLL families. In 310 CLL families, we screened 1045 relatives for MBL using highly sensitive flow cytometry and prospectively followed 449 of them. MBL incidence was directly age- and sex-adjusted to the 2010 US population. CLL cumulative incidence was estimated using Kaplan-Meier survival curves. At baseline, the prevalence of MBL was 22% (235/1045 relatives). After a median follow-up of 8.1 years among 449 relatives, 12 individuals progressed to CLL with a 5-year cumulative incidence of 1.8%. When considering just the 139 relatives with low-count MBL, the 5-year cumulative incidence increased to 5.7%. Finally, 264 had no MBL at baseline, of whom 60 individuals subsequently developed MBL (2 high-count and 58 low-count MBLs) with an age- and sex-adjusted incidence of 3.5% after a median of 6 years of follow-up. In a screening cohort of relatives from CLL families, we reported progression from normal-count to low-count MBL to high-count MBL to CLL, demonstrating that low-count MBL precedes progression to CLL. We estimated a 1.1% annual rate of progression from low-count MBL, which is in excess of that in the general population.
Medscape Continuing Medical Education online
In support of improving patient care, this activity has been planned and implemented by Medscape, LLC and the American Society of Hematology. Medscape, LLC is jointly accredited by the Accreditation Council for Continuing Medical Education (ACCME), the Accreditation Council for Pharmacy Education (ACPE), and the American Nurses Credentialing Center (ANCC), to provide continuing education for the healthcare team.
Medscape, LLC designates this Journal-based CME activity for a maximum of 1.00 AMA PRA Category 1 Credit(s)™. Physicians should claim only the credit commensurate with the extent of their participation in the activity.
Successful completion of this CME activity, which includes participation in the evaluation component, enables the participant to earn up to 1.0 MOC points in the American Board of Internal Medicine’s (ABIM) Maintenance of Certification (MOC) program. Participants will earn MOC points equivalent to the amount of CME credits claimed for the activity. It is the CME activity provider’s responsibility to submit participant completion information to ACCME for the purpose of granting ABIM MOC credit.
All other clinicians completing this activity will be issued a certificate of participation. To participate in this journal CME activity: (1) review the learning objectives and author disclosures; (2) study the education content; (3) take the post-test with a 75% minimum passing score and complete the evaluation at http://www.medscape.org/journal/blood; and (4) view/print certificate. For CME questions, see page 2127.
Disclosures
Associate Editor Michael Hallek, CME questions author Laurie Barclay, freelance writer and reviewer, Medscape, LLC, and the authors declare no competing financial interests.
Learning objectives
Upon completion of this activity, participants will be able to:
Describe the prevalence, incidence, and natural history of monoclonal B-cell lymphocytosis in chronic lymphocytic leukemia (CLL) families, according to a familial study
Determine progression from monoclonal B-cell lymphocytosis to CLL and B-cell clonal progression in CLL families, according to a familial study
Identify clinical implications of findings from this study in CLL families
Release date: April 15, 2021; Expiration date: April 15, 2022
Introduction
Chronic lymphocytic leukemia (CLL) is a neoplasm of mature B cells that is typically manifested within the peripheral blood. It is currently characterized by an absolute B-cell lymphocyte population of ≥5 × 10⁹/L with clonal cells having an immunophenotype of CD5, CD19, and CD23 coexpression along with decreased expression of CD20, CD79b, and surface immunoglobulin.1
Monoclonal B-cell lymphocytosis (MBL) is a condition that also has a circulating population of clonal B cells but with an absolute B-cell count <5 × 10⁹/L (or <5000/µL) and no evidence of lymphadenopathy, organomegaly, or cytopenias.1,2 MBL is classified by both the specific clonal B-cell immunophenotype (CLL-like MBL, non–CLL-like MBL, or atypical MBL) and the size of the B-cell clone (low-count or high-count MBL).2-5 The prevalence of MBL is about 5% to 12% in the general population,3,6-8 and MBL has been shown to be a precursor state to CLL.9 High-count MBL is defined as absolute B-cell count ≥0.5 × 10⁹/L (or ≥500/µL), makes up ∼2% of all MBLs, and is typically identified in the clinic during the workup of lymphocytosis. High-count MBL has been shown to progress to CLL requiring treatment at a rate of ∼1% to 5% per year.5,10-13 The risk of progression to overt CLL for low-count MBL, however, is unknown, and, to date, no cases of low-count MBL progressing to CLL have been reported.14,15
CLL has one of the highest familial risks of disease among cancers,16 and a family history of CLL is the strongest known risk factor for developing CLL.17 Using both cancer and family registries, it has been found that individuals with a first-degree relative with CLL have an 8.5-fold increased risk of CLL.18 Further, we and others have shown that the prevalence of MBL in first-degree relatives of CLL patients is 13% to 18%, higher than the 5% to 12% prevalence found in the general population.19-21 This familial basis strongly supports an inherited genetic contribution to CLL risk. Direct evidence of this inherited susceptibility is provided by 41 common variants discovered to date through genome wide association studies that explain ∼25% of the additive heritable risk.22-29
MBL incidence, natural history, and rates of progression to CLL among individuals who have a family history of CLL are poorly characterized. Herein, we report the prevalence of MBL in 1045 relatives from 310 families that have 2 or more members with CLL (ie, CLL families). In a subset of 449 relatives who we followed prospectively, we report on the incidence, natural history of MBL, and progression to CLL.
Methods
Study population
CLL families were obtained from the Genetic Epidemiology of CLL consortium.21 In brief, individuals (ie, the probands who typically have CLL) who reported a family history of CLL were invited to participate across 8 recruitment centers. The consented probands were asked to complete a family history questionnaire. Any relative who had CLL, as well as first-degree relatives of individuals with CLL, were then invited to participate. Consented individuals were asked to complete an exposure questionnaire, provide a peripheral blood sample, and provide an authorization to obtain corresponding medical records. Eligible individuals for flow evaluations were those relatives who were age 40 years or older and who did not report a CLL diagnosis at time of consent.
Three recruitment centers (Mayo Clinic, University of Utah, and National Cancer Institute) were able to conduct follow-up studies to prospectively assess MBL and CLL status among 449 relatives. At follow-up, participants were asked about cancer status and to provide a blood sample for MBL screening on a biennial basis. Among the 449 individuals, 349 had 2 or more follow-up MBL screening evaluations (137 having 2 MBL evaluations, 77 having 3, 71 having 4, 46 individuals having 5, and 18 having 6).
The study design and conduct were approved by the institutional review board at each center. Informed written consent was obtained from all participants in accordance with the Declaration of Helsinki.
Flow cytometry
Flow cytometry of the first sample screened for MBL (ie, baseline sample) was done at research laboratories at Duke University (40% of baseline assessments), the US Food and Drug Administration (22% of baseline assessments), and Mayo Clinic (38% of baseline assessments). Follow-up flow assessments were done primarily at Mayo Clinic (91% of all follow-up samples), with Duke University evaluating ∼9% of the samples and US Food and Drug Administration evaluating <1% of samples. As a means to ensure consistency of MBL determination across laboratories and time points, combined reviews were performed among the 3 directors of laboratories (C.A.H., G.E.M., M.C.L), and a vial of cryopreserved peripheral blood mononuclear cells (PBMCs) from 15 individuals were distributed across the sites for flow cytometry assessment with 100% concordance of MBL status.
Both fresh whole blood and cryopreserved PBMCs were used for the flow cytometry studies. For the fresh whole blood analyses, EDTA-anticoagulated whole blood underwent red blood cell lysis using ammonium chloride and a series of washes to eliminate red blood cells and unbound immunoglobulin. The remaining white blood cells were resuspended in phosphate-buffered saline with 3% bovine serum albumin for staining. Approximately 1 to 2 × 10⁶ white blood cells were stained with an appropriate amount of each antibody. Antibodies used included specificities for κ, λ, CD5, CD19, CD20, CD23, CD38, and CD45, and 8 colors were used in each panel. We then acquired 500 000 total events on the BD FacsCantos II Flow Cytometer (Mayo) and Flow Cytometry Standard 3.0 files were analyzed using Kaluza Software (Beckman Coulter). A minimum of 20 clonal cells were needed to call a positive MBL clone. Our flow cytometry approach analyzing cryopreserved PBMCs followed our previously published strategy.21
For our flow cytometry approach, we used a multiparameter gating strategy with a log side-scatter vs CD45 plot to roughly separate the 3 predominant lineages of lymphocytes, monocytes, and granulocytes. CD19 along with CD5 were then back-gated to this plot to ensure that the lymphocyte gate included all B cells. The CD19+ B cells from the lymphocyte gate were then interrogated into a CD20 vs CD5 plot. This plot was then divided into 4 quadrants using polygram gates (CD20+, CD5−), (CD20+, CD5+), (CD20dim/neg, CD5+), and (CD20dim/neg, CD5−). κ and λ expression for each of these quadrants were examined to look for possible small clonal populations among the normal B-cell population. Expression of CD23 and CD38 was also evaluated to help further classify the clonal B-cell process.
Using this flow cytometric approach, we defined three MBL immunophenotypes: (1) CLL-like MBL (CD5+ CD20dim), (2) atypical MBL (CD5+ CD20+), and (3) non–CLL-like MBL (CD5− CD20+). Individuals with none of these were classified as no MBL. CLL-like MBL with biclonal immunoglobulin expression was defined as those individuals that had cells with a CLL-like immunophenotype and expressing both κ and λ surface immunoglobulin; κ and λ immunoglobulins were not coexpressed on the same cell, however. Typically, 1 of the κ or λ immunoglobulin-positive cells was the dominant cell type in this biclonal process, and the other was the minor cell clone. However, by our definition, to be called a minor clone, we had to observe the minor clone in at least 10% of all the expressing cells. We excluded 82 flow cytometric results from 76 people because of indeterminate results.
Absolute B-cell counts were determined by calculating the percentage of B cells within the flow cytometric lymphoid gate and multiplying by the absolute lymphocyte count found on the same blood sample as determined by a routine laboratory hematology analyzer (automated blood cell counter). The absolute clonal B-cell count was determined in a similar fashion using the percentage of the clonal B cells within the flow cytometric lymphoid gate. For the cryopreserved PBMCs, no absolute lymphocyte count was available; we were only able to compute the percent clonal B-cell count out of the total B-cell counts. High-count MBL was defined as those with absolute clonal B-cell count ≥500 cells per µL.5
For those samples missing cell counts, we inferred whether the individuals were high-count MBL using the proportion of clonal B cells out of the total B-cells. Based on previously published data showing that percent clonal counts out of total B-cell counts >85% is almost always high-count MBL,30 we used a threshold ≥85% to define high-count MBL. To evaluate the quality of this threshold, we used 385 flow cytometric assessments that had both clonal B-cell counts and percent clonal B-cell counts available. We had 348 MBL assessments that were low-count MBL based on having absolute clonal B-cell count <500 cells per µL. Among these, 338 (97%) flow assessments were correctly called as low-count MBL based on percent clonal B-cell count <85. We had 37 MBL assessments that were high count based on absolute clonal B-cell count ≥500 cells per µL. Of these, 34 (92%) were correctly called as high-count MBL based on percent clonal B-cell count measure. Thus, the percent clonal B-cell count measure has a sensitivity of 92%, specificity of 97%, positive predictive value of 77%, and negative predictive value of 99%.
Statistical analyses
Summary statistics were computed using SAS version 9.4 (SAS institute, Cary, NC), and figures were created using R 3.6.2 (R Foundation for Statistical Computing, Vienna, Austria). Logistic models were used to test for differences in MBL prevalence between sexes, adjusting for age, and between laboratories adjusting for age and sex. Incidence of MBL was calculated among those relatives free of MBL at baseline. Individuals contributed person-years to the denominator up until they developed MBL or up until their last flow cytometric analysis date. Incidence rates were directly age- and sex-adjusted to the 2010 US white population. Incidence rates were reported separately by sex. To evaluate MBL progression to CLL diagnosis, we computed the cumulative incidence and 95% confidence intervals (95% CI) of CLL using Kaplan-Meier methods for all individuals who had a baseline flow cytometric result and clinical or flow cytometry follow-up. Among those individuals with more than 1 MBL evaluation, we also evaluated the change of the percent B-cell clone by estimating the slope of percent clonal B-cell count for each individual among those individuals with CLL-like MBL and available cell counts. Chi-squared tests and Mann-Whitney tests were used to test for any differences among groups.
Results
Full cohort description
A total of 1045 individuals from 310 CLL families had a screening result for MBL, with a median of 2 individuals screened per family (range, 1-19). All but 82 (8%) individuals were first-degree relatives of an individual with CLL; the remaining were second-degree relatives. The median age at first MBL screening was 58 years (range, 40-101), and 44% were male. Frequency distributions of self-reported comorbidities are shown in supplemental Table 1, available on the Blood Web site.
Baseline MBL evaluation
Of the 1045 individuals screened, 235 (22%) were identified to have prevalent MBL at baseline (Table 1). The rate of MBL was similar in males (23%) and females (22%) (age-adjusted P = .2). The median age of prevalent MBL was 65 years (range, 41-97). The prevalence of MBL among the relatives increased with age ranging from 9% among those between 40 and 49 years, 19% among those between 50 and 59 years, 27% among those between 60 and 69 years, 38% among those between 70 to 79 years, and 46% for those ≥80 years. CLL-like MBL was the most common dominant MBL subtype (n = 197, 84%), followed by 18 individuals with atypical MBL and 20 individuals with non–CLL-like MBL. Eleven individuals had more than 1 MBL type (Table 1). Of the 235 individuals with MBL, we had either absolute cell counts (n = 114, 49%) or percent clonal B-cell counts (n = 107, 46%) available from 221 (94%) individuals. Among the 114 MBLs who had absolute B-cell counts available, the median was 126.7 cells per µL (range, 7.3-4099.8). Among the individuals with any CLL-like MBL, 105 had available clonal counts with a median clonal count of 5.8 cells per µL (range, 0.3-4013.6); 9 individuals were high-count MBL (ie, ≥500 cells per µL or ≥0.5 × 10⁹/L) (Table 1). Among the 119 MBLs who did not have available B-cell counts at baseline, we were able to infer whether they were high-count MBL or low-count MBL based on the percent clonal B-cell counts for 107 individuals (see the “Methods” section). We found that 9 were high-count CLL-like MBLs, 1 was high-count atypical MBL, and 4 were high-count non–CLL-like MBLs with percent clonal B-cells ≥85%, whereas the remaining 93 were low-count CLL-like MBL. The remaining 12 individuals of the 119 did not have any available B-cell count data to determine low- or high-count MBL status.
Baseline characteristics of the relatives screened for and identified with MBL
| Categories | No. successfully screened (n = 1045) | No. of those screened with MBL (n = 235, 22%) | |
|---|---|---|---|
| Sex | Male | 461 | 108 (23%) |
| Female | 584 | 127 (22%) | |
| Flow cytometry laboratory | Mayo | 399 | 113 (28%) |
| Duke | 413 | 88 (21%) | |
| US Food and Drug Administration | 233 | 34 (15%) | |
| Age at first flow, y | Median (range) | 58 (40-101) | 65 (41-97) |
| Age categories, y | 40-49 | 267 | 24 (9%) |
| 50-59 | 291 | 56 (19%) | |
| 60-69 | 230 | 62 (27%) | |
| 70-79 | 154 | 59 (38%) | |
| ≥80 | 69 | 32 (46%) | |
| Missing | 34 | 2 | |
| Dominant MBL type | CLL-like | 197 (84%) | |
| Atypical | 18 (8%) | ||
| Non–CLL-like | 20 (8%) | ||
| Secondary MBL type (n = 11) | CLL-like | 8 | |
| Atypical | 3 | ||
| Absolute B-cell count, cells per μL (n = 114) | Median (range) | 126.7 (7.3-4099.8) | |
| Absolute clonal B-cell count, cells per μL, CLL-like (n = 105) | Median (range) | 5.8 (0.3-4013.6) | |
| Absolute clonal B-cell count, cells per μL, atypical | Median (range) | 22.5 (1.4-577.7) | |
| Absolute clonal B-cell count, cells per μL, non–CLL-like | Median (range) | 61.5 (4.1-616.9) |
Progression to CLL
We prospectively followed 449 relatives from 138 families with a median follow-up time of 8.1 years. Among these 449 relatives, 12 unrelated individuals progressed to CLL with a 5-year cumulative incidence of CLL of 1.8% (95% CI, 0.5-3.2) (Figure 1A). The number of months from first MBL identification to CLL diagnosis ranged from 3 months to 104 months (Table 2). Nine of the 12 individuals who progressed to CLL were low-count MBL (based on the percent clonal B cell of total B cells) at initial MBL assessment, 2 were high-count MBL, and 1 had no evidence of MBL at initial evaluation (Table 2). This latter individual had subsequent samples evaluated. Based on a sample collected 47 months later, this individual had low-count CLL-like MBL with 137.1 clonal B cells per µL (percent clonal B cells = 54.6%); 26 months later, this individual progressed to high-count MBL with 1713 clonal B cells per µL and then subsequently progressed to CLL ∼2 months later. Clinical characteristics at the time of CLL diagnosis from the 12 individuals who progressed CLL were available (Table 2). When we subset to the first date in which we can confirm low-count MBL, we identified 139 relatives who we prospectively followed for a median of 5.8 years. Among these individuals, 10 progressed to CLL with an estimated 5-year cumulative incidence of CLL of 5.7% (95% CI, 1.1-10.1), Figure 1B.
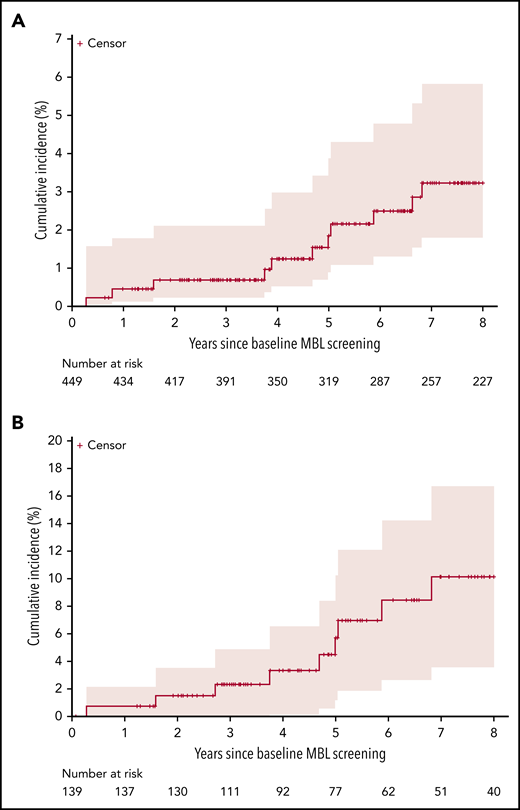
Cumulative incidence and 95% CI of progression to CLL. (A) Among 449 relatives, including both those without MBL and with MBL. (B) Among the 139 with known low-count MBL.
Cumulative incidence and 95% CI of progression to CLL. (A) Among 449 relatives, including both those without MBL and with MBL. (B) Among the 139 with known low-count MBL.
Initial MBL cell counts and CLL clinical characteristics among the 12 individuals who progressed to CLL
| ID | Major MBL type | Minor MBL type | ALC, 109/L | Absolute B-cell count, cells per μL | Major clonal absolute B-cell count, cells per μL | Minor clonal absolute B-cell count, cells per μL | Percent CLL-like MBL clonal count | Percent atypical MBL clonal count | No. of months from first MBL to date of CLL diagnosis | Rai stage | IGHV mutation status | FISH status | CLL treated |
|---|---|---|---|---|---|---|---|---|---|---|---|---|---|
| 1 | CLL-like | 45.8 | 70 | 0 | No | ||||||||
| 2 | CLL-like | 5.7 | 44 | Yes | |||||||||
| 3 | CLL-like | 44.5 | 56 | 0 | No | ||||||||
| 4 | CLL-like* | 2 | 253.6 | 137.1 | 54.6 | 28 | 0 | Yes | |||||
| 5 | CLL-like | 5 | 2267.1 | 2207.7 | 98.36 | 46 | 0 | No | |||||
| 6 | Atypical | CLL-like | 1.5 | 103.7 | 33.70 | 11.82 | 14.25 | 37.81 | 3 | Yes | |||
| 7 | CLL-like | 1.4 | 406 | 25.7 | 59 | I | Normal | No | |||||
| 8 | CLL-like | 2.7 | 579.8 | 44.2 | 104 | 0 | Normal | No | |||||
| 9 | CLL-like | 1.6 | 55 | 81 | II | 13q | Yes | ||||||
| 10 | CLL-like | 6.1 | 4099.8 | 4013.6 | 98.89 | 9 | 0 | ||||||
| 11 | Atypical | CLL-like | 8.8 | 13.15 | 84.8 | 19 | 0 | Unmutated | Tri 12 /13q | Yes | |||
| 12 | CLL-like | 2.3 | 54.5 | 60 | No |
ALC, absolute lymphocyte count; FISH, fluorescence in situ hybridization.
Baseline screening was no evidence of MBL.
Follow-up MBL evaluations
MBL incidence
Of the 449 relatives who were prospectively followed and did not develop CLL, 264 individuals had no evidence of MBL at baseline screening but who at least had 1 or more serial samples for additional MBL screening evaluation to identify incident MBL. Sixty of these 264 individuals subsequently developed MBL after a median follow-up of 6 years. The most common incident MBL type was CLL-like MBL (n = 54, 90%) (Table 3). These incident MBL cases had a median absolute B-cell count of 127.0 cells per µL (range, 21.1-1819.8) at the last flow cytometric assessment (Table 3). The median clonal B-cell count among the CLL-like MBLs was 2.3 cells per µL (range, 0.3-1712.7); 2 individuals were high-count MBLs. The age- and sex-adjusted incidence of MBL was 3.5% (95% CI, 2.6-4.5). The age-adjusted incidence was higher for males (4.3%; 95% CI, 2.8-5.9) than females (2.7%; 95% CI, 1.5-3.9). For sensitivity analyses, we assessed the incidence of MBL using results from the Mayo Clinic laboratory that performed both baseline and follow-up screening on fresh whole blood from the same individuals. We identified 22 individuals that developed MBL of 136 who were normal at baseline for an age- and sex-adjusted incidence of 3.2% (95% CI, 1.8-4.6).
Characteristics of individuals with incident MBL
| Categories | No. of individuals with no MBL at baseline screening (n = 264) | No. of those with incident MBL (n = 60) | |
|---|---|---|---|
| Sex | Male | 105 | 32 (30%) |
| Female | 159 | 23 (18%) | |
| Flow cytometry laboratory (first screening, last screening) | Mayo, Mayo | 136 | 22 (16%) |
| Duke, Mayo | 36 | 13 (36%) | |
| Duke, Duke | 43 | 0 (0%) | |
| US Food and Drug Administration, Mayo | 49 | 25 (51%) | |
| Age at last screening, y | Median (range) | 63 (43-92) | 65 (43-86) |
| Age categories at last screening, y | 40-49 | 25 | 3 (12%) |
| 50-59 | 79 | 15 (19%) | |
| 60-69 | 85 | 24 (28%) | |
| 70-79 | 42 | 12 (29%) | |
| 80+ | 33 | 6 (18%) | |
| Dominant MBL type | CLL-like | 54 (90%) | |
| Atypical | 3 (5%) | ||
| Non–CLL-like | 3 (5%) | ||
| Absolute B-cell count, cells per μL, (n = 60) | Median (range) | 127.0 (21.1-1819.8) | |
| Absolute clonal B-cell count, cells per μL, CLL-like (n = 105) | Median (range) | 2.3 (0.3-1712.7) | |
| Absolute clonal B-cell count, cells per μL, atypical | Median (range) | 0.7 (0.6-11.3) | |
| Absolute clonal B-cell count, cells per μL, non–CLL-like | Median (range) | 137.6 (13.0-232.5) |
B-cell clonal progression
We had 85 relatives who had a baseline MBL clone and who had a subsequent MBL screening evaluation. Of these, we observed that 79 (93%) maintained an MBL clone at follow-up (Table 4). The CLL-like MBL clone persisted at follow-up in 65 (92%) of 71 individuals with a CLL-like MBL clone at baseline evaluation, whereas the remaining 6 individuals had no evidence of MBL at last follow-up. The atypical MBL clone persisted in 4 (66%) of 6 individuals, and the non–CLL-like clone persisted in 7 (88%) of the 8 individuals with non–CLL-like MBLs at baseline. The median absolute B-cell count at last follow-up was 214.2 cells per µL (range, 9.2-3453) compared with a median of 126.7 cells per µL at baseline (Table 1). Among the 68 individuals who had any CLL-like MBL at last follow-up, the median clonal B-cell count was 39.7 cells per µL (range, 0.3-3392.7); 15 were high-count MBL; and another individual was inferred to be high-count MBL based on having a percent clonal B-cell count ≥85%.
MBL follow-up flow assessment results among 85 individuals with MBL at baseline
| Categories | No. of MBL individuals at baseline screen | No. of those screened with MBL at last follow-up (n = 79) | |
|---|---|---|---|
| Sex | Male | 43 | 41 (95%) |
| Female | 42 | 38 (90%) | |
| MBL persistence: first screening, last screening | CLL-like/CLL-like | 71 | 65 |
| Atypical/atypical | 4 | 4 | |
| Atypical/CLL-like | 2 | 2 | |
| Non–CLL-like/non–CLL-like | 7 | 7 | |
| Non–CLL-like/CLL-like | 1 | 1 | |
| Age at last screening, y | Median (range) | 69 (46-96) | 70 (46-96) |
| Absolute B-cell count, cells per μL, at last flow (n = 73) | Median (range) | 214.2 (9.2-3452.7) | |
| Absolute clonal B-cell count, cells per μL, CLL-like (n = 105) | Median (range) | 39.7 (0.3-3392.7) | |
| Absolute clonal B-cell count, cells per μL, atypical | Median (range) | 27.8 (6.8-116.1) | |
| Absolute clonal B-cell count, cells per μL, non–CLL-like | Median (range) | 71.9 (10.7-848.5) |
Next, we evaluated the change of percent B-cell clone over time among 131 individuals who had CLL-like MBL at any time during follow-up with available clonal counts at all MBL evaluations and had not yet progressed to CLL. As seen in Figure 2A, there are individuals with little to no evidence of any clonal count progression and individuals with clear evidence of clonal progression. To highlight this point and to identify any characteristics that distinguish progression, we grouped the individuals into 3 groups: (1) the maximum percent CLL-like MBL clone that an individual had across all MBL screening was <10% of B cells (Figure 2B, n = 72), (2) the maximum percent CLL-like MBL clone that an individual had was between 10% and 85% of B cells (Figure 2C, n = 40), (3) the maximum percent CLL-like MBL clone was ≥85% of the B-cells (ie, an individual had an MBL that was high count) (Figure 2D, n = 19). The median slope for each of these groups was significantly different (P < .001) with slope values of 0% increase in clonal B-cell count per year (range, −2.2 to 1.6), 1.5% increase in clonal B-cell count per year (range, −11.1 to 17.5), and 4.9 increase in percent clonal B-cell count per year (range, −6.3 to 14.3), respectively. In particular, among the 19 individuals in Figure 2D, 14 (74%) relatives were low-count MBL at first MBL assessment with clonal expansion to high-count MBL. Across the 3 groups, we observed no evidence of sex differences (P = .78) or number of CLL relatives (P = .89). For sensitivity analyses, we recomputed the median slope estimate within each group using only the 61 (47%) individuals who had all baseline and follow-up flow screenings performed at the Mayo Clinic laboratory. The slope estimates were, respectively, 0.0 (range, −2.2 to 1.6), 2.4 (range, −11.1 to 17.5), and 4.9 (range, 0.5 to 13.2). Supplemental Figure 1 shows clonal change over time for those with non–CLL-like MBL and atypical MBL.
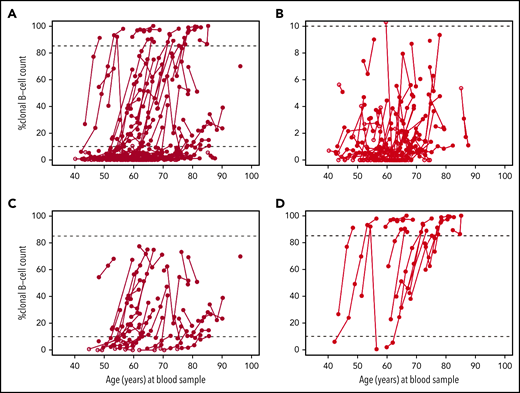
Change of percent clonal B cells of total B cells by age among the 131 relatives who had at least 1 CLL-like MBL clone documented at follow-up and have not yet progressed to CLL. Note the different y-axis scale values among figures. Dark circles represent CLL-like MBL. Open circles represent no MBL or other MBL. (A) All 131 individuals. (B) Individuals (n = 72) whose maximum percent B-cell levels were <10%. (C) Individuals (n = 40) whose maximum percent B-cell clone levels were 10% to 84%. (D) Individuals (n = 19) whose maximum percent B-cell clone levels were ≥85%.
Change of percent clonal B cells of total B cells by age among the 131 relatives who had at least 1 CLL-like MBL clone documented at follow-up and have not yet progressed to CLL. Note the different y-axis scale values among figures. Dark circles represent CLL-like MBL. Open circles represent no MBL or other MBL. (A) All 131 individuals. (B) Individuals (n = 72) whose maximum percent B-cell levels were <10%. (C) Individuals (n = 40) whose maximum percent B-cell clone levels were 10% to 84%. (D) Individuals (n = 19) whose maximum percent B-cell clone levels were ≥85%.
Discussion
In the present study, we screened for MBL at multiple time points and prospectively followed the natural history of MBL in a cohort of nonclinic individuals who have a family history of CLL. For the first time in a prospectively followed screening cohort, we provided evidence of progression from normal- to low-count MBL to high-count MBL to CLL. In particular, we observed 1 individual with no evidence of MBL at initial MBL evaluation and 9 individuals with low-count MBL who progressed to CLL with 1 instance of the low-count MBL observed >8 years before the CLL diagnosis. The rate of progression from low-count MBL to CLL among the 139 low-count MBL individuals was estimated as 1.1% per year with a median of 5.8 years of follow-up. In contrast, no evidence of progression from low-count MBL to CLL was observed in an Italian population-based screening cohort in whom 76 MBLs were followed for a median of 2.8 years.14 Similarly, no evidence of progression to CLL was observed in 65 MBLs from Salamanca, Spain, after a median 7 years of follow-up.15 Neither of the Italian nor the Spanish cohorts were ascertained from CLL families. In clinically ascertained cohorts of predominantly high-count MBLs in which the individuals have lymphocytosis, the rates of progression to CLL requiring treatment are 1% to 5% per year.10-12,31 Because all individuals in our cohort had a family history of CLL, our findings suggest an inherited genetic component to MBL progression, thus correlating the known CLL susceptibility variants with progression would be warranted.
Additionally, we observed heterogeneity across individuals in the rate of progression of clonal B-cell counts. There was a group of individuals who had CLL-like MBL but showed little to no evidence of progression with the median change of percent clonal B-cell counts essentially flat. In contrast, among the 19 relatives who were high-count MBL at last follow-up, 14 were low-count MBL at initial assessment. These individuals had a median change of percent clonal cells of 5% per year. Identifying the molecular, genetic, or biological features that distinguish those MBLs who progress from MBL to CLL compared with those who show no progression of the B-cell clone is an active area of study, especially within high-count MBLs.10,12,32-34
Consistent with prior reports, we also found that MBL persisted over time in 79 (93%) of 85 individuals. With a median follow-up of 58 months, 92% of the CLL-like (65/71), 66% of the atypical (4/6), and 88% of the non–CLL-like (7/8) MBL individuals maintained their baseline immunophenotype. These findings are similar to the findings of Fazi et al,14 who reported that 90% (54/60) of the CLL-like MBLs, 44% (4/9) atypical-CLL MBL, and 67% (6/9) of the non–CLL-like MBLs from MBL individuals unselected for CLL family status had persistent clones after a median follow-up of 34 months. Similarly, in 65 MBL individuals (54 CLL-like and 11 non–CLL-like MBL) followed for median of 84 months from Salamanca, Spain, the clonal B-cell population persisted and all had identical MBL subtype to that of the initial evaluation.15 This persistence of the clonal population implies that MBL, in most cases, is intrinsically abnormal rather than a reactive immune phenomenon.
As previously reported,19-21 we continue to show a higher prevalence of MBL (22%) in relatives from CLL families compared with that observed in the general population. The age- and sex-adjusted incidence of MBL of 3.5% indicates that MBL is a common condition, and given the persistence of MBL in most cases, the prevalence of MBL will continue to grow. Although MBL is an aging phenomenon, not all individuals are destined to have MBL, even with highly sensitive screening methods.35 We observed this in our cohort in which 37 individuals (54%) of 69 older than age 80 years were found not to have MBL. Other than age and family history of CLL, we and others have found inherited genetic factors predispose one to developing MBL.25,36,37
Although they may not only progress to CLL, individuals with high-count MBL may also have other clinical problems, including increased risk of life-threatening infections38 and increased risk of nonhematological cancers.39 Evidence of these clinical consequences in low-count MBL is emerging. Recently, it was found that low-count MBLs with unknown family history of CLL have reduced overall survival compared with normal controls.15 Moreover, we recently identified that in a screening cohort of 971 individuals from the Mayo Clinic Biobank,40 those with low-count CLL-like MBL (N = 106) had a 68% increase risk of infection compared with those with no MBL (N = 865, P = .04) after a median follow-up of 8 years.41 None of these individuals progressed to CLL, after a median of 8 years of follow-up. Given that MBL is common and persistent, understanding whether there are other clinical consequences (beyond the increased risk of CLL and now infections) of low-count MBL are particularly important.
We had limited clinical, molecular, and outcome data on the 12 individuals who progressed to CLL during our study period. Most of the CLL cases were Rai stage 0 at time of CLL diagnosis and 5 individuals have subsequently been treated for their CLL. Prior literature has evaluated these features including IgVH mutation status and prognosis between CLL cases with and without a family history of CLL, and there does not appear to be any substantial differences.18,42,43
Strengths of our study include it being a multicenter study, the large number of individuals screened, the number of prospective flow cytometric evaluations, and the extent of follow-up time. A limitation of our study was that the baseline assessment was performed across 3 flow cytometry laboratories and a mixture of fresh whole-blood or frozen cryopreserved PBMCs were used. We attempted to minimize any laboratory effect through sample sharing, harmonization of antibody panels, sharing of analysis techniques, and combined review evaluations. We also attempted to address any laboratory effect through sensitivity analyses using flow cytometric results generated from 1 laboratory (Mayo Clinic) and found comparable results. Another limitation is that not all MBL screening results had available blood cell counts at the time of screening, which precluded definitive determination of low- or high-count MBL status in some cases. We addressed this by inferring count status through using percent clonal B-cell counts out of total B-cell count with a threshold of 85% or higher as an indicator of high-count MBL. With this threshold, our data reported 97% specificity and 99% negative predictive value, both of which indicate very high confidence that an individual is low count when percent of clonal B-cell count is below the 85% threshold and high confidence of calling a high-count result with a positive predictive value of 77% and sensitivity of 92%.
In summary, both low-count and high-count MBL are established precursors of CLL that are common and persistent in a screening cohort of individuals with a family history of CLL. Not all relatives in CLL families will develop MBL. However, among those who do, a subset of low-count MBLs will have clonal expansion to overt CLL at an estimated rate of 1.1% per year, suggesting that progression of MBL in CLL families is in excess of the rate seen in the general population and that an inherited component may influence progression. Future work will be needed to identify those factors that predict both risk of MBL and risk of progression from MBL to CLL.
For original data, please contact slager.susan@mayo.edu.
The online version of this article contains a data supplement.
The publication costs of this article were defrayed in part by page charge payment. Therefore, and solely to indicate this fact, this article is hereby marked “advertisement” in accordance with 18 USC section 1734.
Acknowledgments
The authors greatly thank the family members for their contributions and continuing participation. This work would not be done without their valuable time and effort.
This material is based upon work supported by National Institutes of Health grants (National Cancer Institute U01CA118444, P50CA097274, 1K08CA134919; National Institute on Aging R01AG58266); the Intramural Program of the National Cancer Institute; the Veterans Affairs Research Service; and by the CancerCare Manitoba Foundation. The high-risk pedigrees in Utah are made possible because of the Utah Population Database (UPDB), which is supported in part by a National Institutes of Health/National Cancer Institute grant (P30 CA2014), the University of Utah, and from the University of Utah’s program in Personalized Health and Center for Clinical and Translational Science. Cancer data come from the Utah Cancer Registry, which is funded by the National Institutes of Health/National Cancer Institute's Surveillance, Epidemiology, and End Results (SEER) Program (HHSN261201800016I), the US Centers for Disease Control and Prevention's National Program of Cancer Registries (cooperative agreement no. NU58DP0063200), with additional support from the University of Utah and Huntsman Cancer Foundation.
Authorship
Contribution: S.L.S., N.E.C., C.A.H., J.B.W., G.E.M., and K.G.R. drafted the manuscript; M.C.L., G.E.M., F.A., and C.A.H. performed flow cytometry; S.J.A. and K.G.R. performed data analyses; A.D.N. performed project management; N.J.C., J.B.J., T.G.C., V.B., M.G., A.F., K.C., M.L.M., J.B.W., and N.E.C. collected and assembled data; and the manuscript was reviewed by all authors.
Conflict-of-interest disclosure: The authors declare no competing financial interests.
Correspondence: Susan Slager, Department of Health Sciences Research, Mayo Clinic, 200 First St SW, Rochester, MN 55905; e-mail: slager.susan@mayo.edu.

This feature is available to Subscribers Only
Sign In or Create an Account Close Modal