

Key Points
The ADH5/ALDH2 enzymes provide genome protection, comparable to the Fanconi anemia DNA-repair pathway, via the metabolism of formaldehyde.
Hematopoietic differentiation likely induces formaldehyde generation that requires ADH5/ALDH2 to sustain blood progenitor expansion.

Abstract
We have recently discovered Japanese children with a novel Fanconi anemia–like inherited bone marrow failure syndrome (IBMFS). This disorder is likely caused by the loss of a catabolic system directed toward endogenous formaldehyde due to biallelic variants in ADH5 combined with a heterozygous ALDH2*2 dominant-negative allele (rs671), which is associated with alcohol-induced Asian flushing. Phytohemagglutinin-stimulated lymphocytes from these patients displayed highly increased numbers of spontaneous sister chromatid exchanges (SCEs), reflecting homologous recombination repair of formaldehyde damage. Here, we report that, in contrast, patient-derived fibroblasts showed normal levels of SCEs, suggesting that different cell types or conditions generate various amounts of formaldehyde. To obtain insights about endogenous formaldehyde production and how defects in ADH5/ALDH2 affect human hematopoiesis, we constructed disease model cell lines, including induced pluripotent stem cells (iPSCs). We found that ADH5 is the primary defense against formaldehyde, and ALDH2 provides a backup. DNA repair capacity in the ADH5/ALDH2-deficient cell lines can be overwhelmed by exogenous low-dose formaldehyde, as indicated by higher levels of DNA damage than in FANCD2-deficient cells. Although ADH5/ALDH2-deficient cell lines were healthy and showed stable growth, disease model iPSCs displayed drastically defective cell expansion when stimulated into hematopoietic differentiation in vitro, displaying increased levels of DNA damage. The expansion defect was partially reversed by treatment with a new small molecule termed C1, which is an agonist of ALDH2, thus identifying a potential therapeutic strategy for the patients. We propose that hematopoiesis or lymphocyte blastogenesis may entail formaldehyde generation that necessitates elimination by ADH5/ALDH2 enzymes.
Introduction
Inherited bone marrow failure syndrome (IBMFS) encompasses a broad range of overlapping clinical features underlaid by diverse gene variants affecting telomeres, hematopoietic transcription factors, ribosome assembly, DNA damage response, and immune response, among others.1 We have recently discovered a set of Japanese children with a novel IBMFS caused by digenic gene mutations.2 One of the genetic alterations is the biallelic mutations in ADH5; the other is the heterozygous ALDH2 variant rs671. This particular syndrome, ADH5/ALDH2 deficiency, involves impaired formaldehyde catabolism; thus, it is considered the first example of IBMFS due solely to metabolic deficits. All of our ADH5/ALDH2-mutated cases were adolescent patients with aplastic anemia (AA); moreover, the patients were progressing into myelodysplasia (MDS) or leukemia that required hematopoietic stem cell transplantation (HSCT). Overall, their hematological phenotype (ie, AA and MDS/leukemia), short stature, or skin pigmentation suggested a similarity to Fanconi anemia (FA). By contrast, chromosome breakage levels induced by mitomycin C (MMC) or diepoxybutane were in the normal range, suggesting that the FA DNA-repair pathway is intact.
Extensive research on FA and IBMFS has repeatedly demonstrated that genomic stability is vital for the proper function and maintenance of hematopoietic stem cells.3,4 DNA damage caused by a DNA crosslinker, such as MMC, or formaldehyde triggers activation of the FA pathway. This leads to monoubiquitination and recruitment of the FANCD2/FANCI complex to the damage sites by the FA core E3 ligase complex (the components include FANCA/B/C/E/F/G/L/M and others), providing a platform for stepwise repair processes, such as incision and unhooking of the crosslink, translesion synthesis, and homologous recombination.3,4 Lack of these processes renders cells from FA patients exquisitely sensitive to MMC or formaldehyde treatment.5 Formaldehyde is highly reactive and can covalently modify biological molecules, including DNA and protein. Although it is an important environmental genotoxin/carcinogen, formaldehyde is also generated endogenously as a by-product of enzymatic reactions, such as histone or nucleic acid demethylation, as well as from 1C metabolism or oxidative decomposition of the essential cofactor folic acid.6 Endogenously generated formaldehyde is normally captured by glutathione to form S-hydroxymethylglutathione, which is catalyzed by ADH5 (alcohol dehydrogenase class III), and then S-formylglutathione dehydrogenase (FGH, also known as esterase D) to yield formate and reduced glutathione.6 Thus, defects in ADH5 function would be expected to result in elevated levels of formaldehyde, which could be cytotoxic if not eliminated by other scavenging pathways.
The 4 ADH5 variants reported in the patients were very rare, and they were found only among East Asians in the ExAc database or were not described previously.2 On the other hand, the ALDH2 gene variation is a c.1510G>A transition encoding a E504K amino acid substitution termed the ALDH2*2 or A allele (the normal 1510G allele is termed the ALDH2*1 or G allele).7 The ALDH2*2 allele is highly prevalent in East Asians (40% to 50% of the population carries the defective allele), reduces the enzymatic activity by ∼80% in a dominant-negative manner, causes facial flushing after the consumption of alcohol, and increases the risk of esophageal cancer. It is notable that the ALDH2*2 allele accelerates the progression of bone marrow failure in FA.8
We concluded that the ADH5/ALDH2 deficiency causes bone marrow failure, as well as MDS/leukemia, likely due to endogenously generated formaldehyde, based on several lines of evidence.2 First, ADH5 and ALDH2 eliminate formaldehyde. The novel biochemical evidence indicated that ALDH2 can catalyze formaldehyde just as well as ADH5.2 Second, ADH5/ALDH2-deficient mice display a hematological phenotype that is similar, if not identical, to the human disorder. The levels of blood formaldehyde are much higher in ADH5/ALDH2-deficient mice than in single-knockout or wild-type mice.2 Interestingly, the mouse model displays higher expression levels of DNA repair genes in bone marrow progenitors and accumulates DNA adducts in tissues such as liver, kidney, and brain. Furthermore, clonally expanded bone marrow progenitors from ADH5/ALDH2-deficient mice accumulate mutation signatures similar to aging-associated cancer mutation signatures.2 However, the interplay between ADH5/ALDH2 and the FA DNA-repair pathway, as well as how ADH5/ALDH2 deficiency affects human hematopoiesis, remains unexplored. In particular, it is noteworthy that the hematological defects in mice were largely confined to the lymphoid compartment, whereas the patients displayed no such tendency. In this study, we set out to address these questions by constructing disease model cell lines, including induced pluripotent stem cells (iPSCs) established from the patients’ fibroblasts by reprogramming, as well as iPSCs from a healthy donor created using genome editing.
Methods
Research subjects
The research plan was approved by the Ethical Committee of Kyoto University. Written informed consent was obtained from all subjects examined. The patient-derived cell cultures and information, including sister chromatid exchange (SCE) levels, were originally deposited by Masao S. Sasaki (formerly of the Radiation Biology Center, Kyoto University) to the Japanese Collection of Research Bioresources (JCRB) Cell Bank (Osaka, Japan) and were provided to us with consent. ALDH2 genotyping with TaqMan polymerase chain reaction (PCR) was described previously.8 Genome PCR and Sanger sequencing were performed according to standard protocols. DNA from each subject was extracted from the buffy coat fraction with a QIAamp DNA Blood Mini Kit (QIAGEN).
Cell culture and transfection
The patient-derived primary fibroblast (JCRB Cell Bank) and 48BR fibroblast cell lines were cultured in RPMI 1640 supplemented with 20% fetal bovine serum (FBS; Gibco). OP9 cells (obtained from the RIKEN Cell Bank) were cultured in α-MEM (Nacalai Tesque) supplemented with 20% FBS (Gibco). Diploid HAP1 (Horizon Genomics), HCT116, and K562 cells were maintained in Iscove modified Dulbecco medium (Nacalai Tesque), McCoy's 5A (Sigma-Aldrich), and RPMI 1640 (Nacalai Tesque), respectively, each supplemented with 10% FBS (Gibco). For genome editing, expression plasmids encoding CRISPR/Cas9 with single guide RNA (sgRNA), the donor vectors, and the obligate ligation-gated recombination (ObLiGaRe) vectors were transfected into HAP1 or HCT116 cells with Lipofectamine 3000 (Invitrogen), whereas a Neon Transfection System 100 μL Kit (1450 V/10 ms for 3 pulses) was used, according to the manufacturer’s instructions, for K562 cells.
SCE assay
Peripheral blood mononuclear cells were separated by density gradient centrifugation and cultured in RPMI 1640 (Nacalai Tesque) containing 5 μg/mL phytohemagglutinin (PHA; Sigma-Aldrich) supplemented with 10% FBS (Gibco). The quantification of SCEs was carried out as described.9
Plasmids for genome editing
Respective CRISPR/Cas9 vectors targeting the human ROSA26, ADH5, ALDH2, and FANCD2 loci were generated by ligating annealed oligonucleotides (supplemental Table 1, available on the Blood Web site) into pX330 (Addgene #42230; a gift from Feng Zhang), as indicated in Figure 3B and supplemental Figure 2. The donor vectors were generated by standard methods using an In-Fusion Kit (Clontech) and LR Reaction Kit (Invitrogen). The ObLiGaRe10 vectors were made by cloning respective sgRNA sequences with protospacer adjacent motifs into the pMK174 loxP-puro cassette vector. Correctly edited cells were identified by PCR-mediated analysis of genomic DNA and confirmed by reverse transcription PCR and western blotting.
Western blotting
Samples were separated by sodium dodecyl sulfate polyacrylamide gel electrophoresis, transferred to a polyvinylidene difluoride membrane, and probed using antibodies.
Generation of the disease model iPSCs
For the generation of patient-derived iPSCs, fibroblasts were harvested 2 days after passaging and transfected with a plasmid mixture consisting of pCXLE-hOCT3/4-shp53, pCXLE-hsk, pCXLE-hUL, pCXB-EBNA1 (obtained from Addgene), and pSimple-miR302/367 (gift from Sara Howden and James Thomson) using a Neon Transfection System 100 μL Kit (1650 V/10 ms for 3 pulses), as described previously.11-13 Emerging iPSC colonies were picked up and plated onto iMatrix-511 Silk–coated 24-well plates, expanded, and maintained in iMatrix-511 Silk (Nippi) culture dishes in AK02N medium (REPROCELL). The medium was replaced every 2 days, and passaging was performed according to the manufacturer’s protocol. For CRISPR/Cas9-mediated gene editing, the appropriate donor vector plus a pX330 plasmid encoding Cas9 and the sgRNA were transfected into iPSCs using a Neon Transfection System 100 μL Kit (1200 V/20 ms for 2 pulses), according to the manufacturer’s instructions. Following electroporation, cells were plated on an iMatrix-511 Silk–coated 6-well plate and maintained in StemFlex Medium (Gibco). Selection was applied on day 3 using 1 μg/mL puromycin (Sigma-Aldrich), 100 μg/mL hygromycin (Nacalai Tesque), or 10 μg/mL blasticidin S (Funakoshi).
Hematopoietic cell differentiation and clonogenic colony-forming assay
Hematopoietic cell differentiation assays were performed as reported previously.14 The cells were treated with TrypLE (Thermo Fisher Scientific) and harvested by gently scraping the culture dish. Cell sorting was performed using a Cell Sorter SH800S (SONY) after staining with antibodies, and cells were dispersed by 40-μm strainers. For colony formation, CD34+KDR+ cells were mixed at a concentration of 104 cells per mL in 35-mm petri dishes with OP9 feeder cells using 1 mL per dish of MethoCult GF+ Semisolid Medium (STEMCELL Technologies), as described.15 Colonies were counted at days 10 to 12 by in situ observation using an inverted microscope (Olympus). In another protocol (without colony formation), the cells were initially stimulated as above and further maintained in Stemline II Medium (Sigma-Aldrich) with replacement and addition of various cytokines, as described.14
Growth assays and cytotoxicity assays
Detailed information about growth and cytotoxicity assays is found in supplemental Methods.
Immunohistochemistry
The immunohistochemistry method is described in supplemental Methods.
Antibodies
Antibodies used in this study are indicated in supplemental Table 2.
Preparation of recombinant ALDH2–wild-type and ALDH2-E504K proteins for biochemical assay of compound C1
The preparation method is described in the supplemental Methods.
The ALDH2 activator C1 and its biochemical activity assay
Effects of compounds on the acetaldehyde oxidation rate by ALDH2 proteins were evaluated as described in supplemental Methods.
Statistical analysis
Prism software (GraphPad) was used to perform unpaired, 2-tailed Student t tests and 1-way analysis of variance (ANOVA) with Tukey’s multiple-comparisons test.
Results
Combined deficiency of ADH5 and ALDH2 causes increased SCEs in lymphocytes but not in fibroblasts
ADH5/ALDH2-mutant patients displayed high levels of spontaneous SCEs in phytohemagglutinin-stimulated lymphoblasts (PHA-blasts) (Figure 1A; supplemental Figure 1).2 The elevated SCE levels were nearly comparable to those found in Bloom syndrome (BS) lymphoblasts. The SCE reflects a crossover event following Holliday junction cleavage by structure-specific nucleases, such as Mus81 or GEN1, which is opposed by noncrossover resolution of the Holliday junction by BLM helicase.16 This explains the elevated level of SCEs as a hallmark of BS, which is caused by the loss of BLM helicase. Because ADH5 and ALDH2 are not directly involved in Holliday junction resolution per se, the high incidence of SCEs in ADH5/ALDH2 deficiency should be caused by completely different mechanisms (discussed in "Effects of ADH5 and/or ALDH2 deficiency on formaldehyde-induced DNA damage"). In contrast, fibroblasts from the same patients did not display high levels of SCEs (Figure 1A). Such discordance between the SCE frequency in lymphoblasts and fibroblasts was also notable in BS (Figure 1A).
![Spontaneous SCE levels in cells with mutated ADH5 and ALDH2. (A) Mean ± standard deviation (SD) of spontaneous SCEs in PHA-blasts and fibroblasts from ADH5/ALDH2-deficient patients and controls. Each point represents the mean number of SCE events per cell in a single individual. Levels of SCEs from 3 patients with ADH5/ALDH2 deficiency (P1 [AP39P], P2 [AP57P], and P3 [FA50P]),2 healthy control fibroblasts or PHA-blasts, and patients with AA (negative control) or Bloom syndrome (BS2CH, positive control) were obtained from data deposited in the JCRB Cell Bank. The data are presented in bar graphs in supplemental Figure 1. The SCE data from PHA-blasts of P1 and P2 were described previously.2 (B) Mean ± SD of SCE events per cell (n = 30) induced by ADH5 inhibitor in PHA-blasts from 6 healthy individuals with the indicated ALDH2 genotypes. The P values were calculated using 1-way ANOVA with Tukey’s multiple-comparisons test. Right panels show the representative images of SCE with or without ADH5 inhibitor. Red arrowheads indicate the sites of chromatid exchanges. The SCE data without ADH5 inhibitor in 2 G/A individuals were described previously.2 (C) Schematic diagram of the spontaneous SCE levels in lymphocytes (PHA-blasts) and fibroblasts. HCHO, formaldehyde.](https://ash.silverchair-cdn.com/ash/content_public/journal/blood/137/15/10.1182_blood.2020009111/2/m_bloodbld2020009111f1.png?Expires=1769111983&Signature=J3IZfZtcckwpkWEryTrKB-ONCVmwtzTd4KHVzjhmdWofgVoyezTl7Xrf5cm0P19sBU23Zm-aQoYXsfZTgzNXS~oQClIiubJ9WH0n1~XiM4Kuu6zTNHTKIWwQTYQL628d79rT2zegRa2Cux01Uflm310DS0YAV6FhTt~LWCl8Z7QwNsgq63VSrqyM5KLBCUm0r5P-7An4BHi0YfCPd81AqutSKKW0exxam-0eLQ0TuahdgbdoUtnFYPkEiqFoSKh0xRdbKbvbAve1w2qWJAjkuS8Rx6at~CE1BF4NBsNS3AzDhmSSKcYYRQx590XJyop6BLhSN254Im1t62qvNZGSiA__&Key-Pair-Id=APKAIE5G5CRDK6RD3PGA)
Spontaneous SCE levels in cells with mutated ADH5 and ALDH2. (A) Mean ± standard deviation (SD) of spontaneous SCEs in PHA-blasts and fibroblasts from ADH5/ALDH2-deficient patients and controls. Each point represents the mean number of SCE events per cell in a single individual. Levels of SCEs from 3 patients with ADH5/ALDH2 deficiency (P1 [AP39P], P2 [AP57P], and P3 [FA50P]),2 healthy control fibroblasts or PHA-blasts, and patients with AA (negative control) or Bloom syndrome (BS2CH, positive control) were obtained from data deposited in the JCRB Cell Bank. The data are presented in bar graphs in supplemental Figure 1. The SCE data from PHA-blasts of P1 and P2 were described previously.2 (B) Mean ± SD of SCE events per cell (n = 30) induced by ADH5 inhibitor in PHA-blasts from 6 healthy individuals with the indicated ALDH2 genotypes. The P values were calculated using 1-way ANOVA with Tukey’s multiple-comparisons test. Right panels show the representative images of SCE with or without ADH5 inhibitor. Red arrowheads indicate the sites of chromatid exchanges. The SCE data without ADH5 inhibitor in 2 G/A individuals were described previously.2 (C) Schematic diagram of the spontaneous SCE levels in lymphocytes (PHA-blasts) and fibroblasts. HCHO, formaldehyde.
Spontaneous SCE levels in cells with mutated ADH5 and ALDH2. (A) Mean ± standard deviation (SD) of spontaneous SCEs in PHA-blasts and fibroblasts from ADH5/ALDH2-deficient patients and controls. Each point represents the mean number of SCE events per cell in a single individual. Levels of SCEs from 3 patients with ADH5/ALDH2 deficiency (P1 [AP39P], P2 [AP57P], and P3 [FA50P]),2 healthy control fibroblasts or PHA-blasts, and patients with AA (negative control) or Bloom syndrome (BS2CH, positive control) were obtained from data deposited in the JCRB Cell Bank. The data are presented in bar graphs in supplemental Figure 1. The SCE data from PHA-blasts of P1 and P2 were described previously.2 (B) Mean ± SD of SCE events per cell (n = 30) induced by ADH5 inhibitor in PHA-blasts from 6 healthy individuals with the indicated ALDH2 genotypes. The P values were calculated using 1-way ANOVA with Tukey’s multiple-comparisons test. Right panels show the representative images of SCE with or without ADH5 inhibitor. Red arrowheads indicate the sites of chromatid exchanges. The SCE data without ADH5 inhibitor in 2 G/A individuals were described previously.2 (C) Schematic diagram of the spontaneous SCE levels in lymphocytes (PHA-blasts) and fibroblasts. HCHO, formaldehyde.
To elucidate the relationship between ADH5/ALDH2 genotypes and the SCE levels, we generated PHA-blasts from healthy volunteers with different ALDH2 genotypes and examined whether SCE levels were increased by treatment with the ADH5 inhibitor N6022 (Figure 1B). N6022 is a potent and highly selective first-in-class ADH5 inhibitor.17 Indeed, N6022 induced SCEs, albeit fewer than in the patients’ PHA-blasts, and the levels were higher on the ALDH2 G/A background than the G/G background (Figure 1B). The PHA-blasts with an ALDH2 A/A homozygous genotype largely stopped dividing upon treatment with N6022 and, therefore, could not be evaluated (data not shown). These results suggest that the combination of ADH5 deficiency and the ALDH2*2 heterozygous variant led to the elevated levels of SCEs in PHA-blasts from these patients.
Effects of ADH5 and/or ALDH2 deficiency on formaldehyde-induced DNA damage
It is unclear why ADH5/ALDH2-defective fibroblasts did not show increased SCE levels (Figure 1C). Aldehyde DNA damage, unlike irradiation damage, may impede replication forks by forming interstrand crosslinks or protein-DNA crosslinks,18 and the stalled forks need to be restarted by the process that involves homologous recombination repair.9 We reason that increased SCE levels in ADH5/ALDH2-deficient PHA-blasts should reflect increased DNA damage and are due to Holliday junction resolution with crossing over upon fork resumption. Thus, the different SCE levels between PHA-blasts and fibroblasts may reflect a cell type– or condition-specific difference in aldehyde generation. To examine how ADH5/ALDH2 mutations affect cell growth and SCEs in different cell types, we used CRISPR/Cas9 genome editing of diploid HAP1, HCT116, and K562 cells to generate ADH5/ALDH2-knockout (KO) cell lines (Figure 2; supplemental Figures 2-3). HAP1 is originally derived from the KBM-7 human leukemia cell line and has a characteristically near-haploid genome. However, it is easily converted to the diploid state, and we decided to use HAP1 in a diploid condition. HCT116 and K562 are commonly used human cell lines derived from colon cancer and chronic myelocytic leukemia, respectively. The spontaneous levels of SCEs were similar in single- or double-KO HAP1 cells (except for a slight increase in ADH5−/−ALDH2+/−) and were not elevated compared with the wild-type (WT) control (Figure 2C). Thus, we propose that, in contrast to the PHA-blasts, the amount of endogenously generated formaldehyde may be very low in stably cycling cells, although this needs to be substantiated in future studies. Consistent with our hypothesis, SCE levels were not increased by N6022 in HAP1 WT cells (Figure 2C); however, if as little as 0.5 μM formaldehyde was added (note that the normal blood concentration of formaldehyde is reportedly 15-87 μM6 in humans and 4 μM in mice2 ), ADH5−/−ALDH2+/− cells showed elevated levels of SCEs compared with single-KOs or the WT control, and the SCE levels were even higher when the remaining ALDH2 allele was disrupted (in ADH5−/−ALDH2−/−) (Figure 2C). Following exposure to 20-μM formaldehyde, levels of γH2AX foci, an indicator of DNA damage, showed a pattern similar to SCE data. Notably, the numbers of γH2AX foci in ADH5−/−ALDH2+/− or ADH5−/−ALDH2−/− cells were comparable to or even higher than those in FANCD2−/− cells, suggesting that formaldehyde damage can overwhelm DNA repair by the FA pathway in the absence of detoxification by ADH5/ALDH2 (Figure 2D-E). Formaldehyde sensitivity in the KO lines derived from HAP1, HCT116, and K562 cells was consistent with the γH2AX levels in HAP1-KO cells, whereas cell growth without formaldehyde treatment was comparable to the parental cells (Figure 2; supplemental Figure 3). Unlike FANCD2−/− cells, MMC sensitivity in these KO cell lines, including the ADH5−/−ALDH2−/− double-KO line, was comparable to parental HAP1 cells (Figure 2F).

Formaldehyde-induced SCE levels in cells with defective ADH5 and ALDH2 activities. (A-B) Growth curves (A) and formaldehyde (HCHO) sensitivities (B) of KO HAP1 cell lines with the indicated genotypes. Mean ± standard deviation (SD) in triplicate cultures are shown. (C) SCE levels in HAP1 cells with the indicated genotypes. The points represent the number of SCE events per metaphase, and mean ± standard error of the mean (SEM) are indicated. (D) Quantification of γH2AX foci per cell. The points represent the number of foci per nucleus. Mean ± SEM (n = 500) is shown for each condition. (E) Representative images show spontaneous and formaldehyde (HCHO)-induced formation of γH2AX foci in HAP1 cells. (F) Cell viability was quantified following formaldehyde (HCHO) or MMC treatment (48 hours). Mean ± SD in a quadruplicate experiment are shown. The P values were calculated using 1-way ANOVA with Tukey’s multiple-comparisons test. n.s., not significant.
Formaldehyde-induced SCE levels in cells with defective ADH5 and ALDH2 activities. (A-B) Growth curves (A) and formaldehyde (HCHO) sensitivities (B) of KO HAP1 cell lines with the indicated genotypes. Mean ± standard deviation (SD) in triplicate cultures are shown. (C) SCE levels in HAP1 cells with the indicated genotypes. The points represent the number of SCE events per metaphase, and mean ± standard error of the mean (SEM) are indicated. (D) Quantification of γH2AX foci per cell. The points represent the number of foci per nucleus. Mean ± SEM (n = 500) is shown for each condition. (E) Representative images show spontaneous and formaldehyde (HCHO)-induced formation of γH2AX foci in HAP1 cells. (F) Cell viability was quantified following formaldehyde (HCHO) or MMC treatment (48 hours). Mean ± SD in a quadruplicate experiment are shown. The P values were calculated using 1-way ANOVA with Tukey’s multiple-comparisons test. n.s., not significant.
Analysis of in vitro hematopoietic differentiation by ADH5/ALDH2-deficient disease model iPSCs
To examine how ADH5/ALDH2 mutations affect human hematopoiesis in vitro, we generated iPSC models from fibroblasts from 2 patients by reprogramming, using episomal plasmid vectors (Figure 3A). The first patient-derived iPSC line, P1 (AP39P), carried a splice-site mutation, c.564+1G>A: p.L188PfsX4, and a c.832G>C: p.A278P substitution. The second iPSC line, P3 (FA50P), carried biallelic ADH5 deletions c.966delG: p.W322X.2 We selected several clones showing relatively stable cellular morphology, as well as positive stage-specific embryonic antigen-4 staining, and confirmed their normal karyotype (supplemental Figure 4). To complement the mutated ADH5 gene in these patient-derived iPSC clones, we introduced a DOX-inducible ADH5-FLAG expression construct into the hROSA26 locus using CRISPR/Cas9-assisted genome editing (Figure 3A-D). In addition, we obtained iPSC 201B7 cells (established from a healthy individual) from the RIKEN Cell Bank and generated iPSCs with combinations of ADH5 and ALDH2 disruptions using CRISPR/Cas9 genome editing (Figure 3E; supplemental Figure 5).
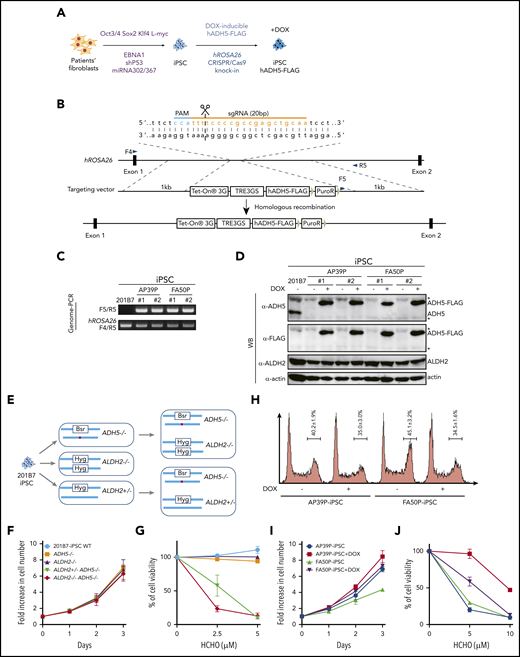
Generation and analysis of disease model iPSCs. (A-B) Schematic diagram depicting the generation of patient-derived iPSCs by reprogramming (A) followed by the introduction of the DOX-inducible hADH5 expression vector into the hROSA26 locus by genome editing (B). (C-D) Positions of the primers (F4, F5, and R5) are indicated. Genomic PCR (C) and western blotting (WB) analysis (D) of the iPSC clones knocked in with the hADH5 expression vector. *Nonspecific band. (E) Generation of iPSCs with the indicated genotypes from 201B7 iPSCs by genome editing. The red dot in ADH5 exon 5 indicates a frameshift mutation created with genome editing (supplemental Figure 5). (F-G) Cell proliferation profile (F) and formaldehyde (HCHO) sensitivity (G) of the knockout iPSCs with the indicated genotypes. Mean ± standard deviation (SD) in triplicate cultures are shown. The experiment was repeated 3 times with similar results. (H) Cell cycle distribution of the patient-derived iPSCs, with or without DOX. Fixed cells were stained with propidium iodide and analyzed by a FACSCanto flow cytometer. Mean ± SD from 3 independent experiments are shown. (I-J) Cell proliferation profile (I) and formaldehyde (HCHO) sensitivity (J) of patient-derived iPSCs were analyzed with or without DOX-induced ADH5 expression. Mean ± SD in triplicate cultures are shown. The experiment was repeated 3 times with similar results.
Generation and analysis of disease model iPSCs. (A-B) Schematic diagram depicting the generation of patient-derived iPSCs by reprogramming (A) followed by the introduction of the DOX-inducible hADH5 expression vector into the hROSA26 locus by genome editing (B). (C-D) Positions of the primers (F4, F5, and R5) are indicated. Genomic PCR (C) and western blotting (WB) analysis (D) of the iPSC clones knocked in with the hADH5 expression vector. *Nonspecific band. (E) Generation of iPSCs with the indicated genotypes from 201B7 iPSCs by genome editing. The red dot in ADH5 exon 5 indicates a frameshift mutation created with genome editing (supplemental Figure 5). (F-G) Cell proliferation profile (F) and formaldehyde (HCHO) sensitivity (G) of the knockout iPSCs with the indicated genotypes. Mean ± standard deviation (SD) in triplicate cultures are shown. The experiment was repeated 3 times with similar results. (H) Cell cycle distribution of the patient-derived iPSCs, with or without DOX. Fixed cells were stained with propidium iodide and analyzed by a FACSCanto flow cytometer. Mean ± SD from 3 independent experiments are shown. (I-J) Cell proliferation profile (I) and formaldehyde (HCHO) sensitivity (J) of patient-derived iPSCs were analyzed with or without DOX-induced ADH5 expression. Mean ± SD in triplicate cultures are shown. The experiment was repeated 3 times with similar results.
We first observed that, although cell growth of 201B7 iPSCs was not affected by the absence of ADH5 and ALDH2 (Figure 3F), the slight formaldehyde sensitivity and γH2AX foci induction in ADH5−/− cells was greatly enhanced by the heterozygous ALDH2 disruption (Figures 3G and 4A). This seems to be consistent with the HAP1 data described above (Figure 2A-B,D-E), indicating that ALDH2 is haploinsufficient in an ADH5-deficient background. In the patient-derived iPSCs (AP39P iPSCs and FA50P iPSCs), Dox-induced ADH5 expression modestly increased the proliferation rate, with fewer cells in the G2 phase (Figure 3H-I). It also rescued the formaldehyde sensitivity (Figure 3J), as well as formaldehyde-induced γH2AX foci levels (Figure 4B). These results are consistent with the notion that a small amount of endogenous formaldehyde is not readily catabolized in the patient-derived iPSCs, resulting in DNA damage and checkpoint activation with mild G2 arrest.
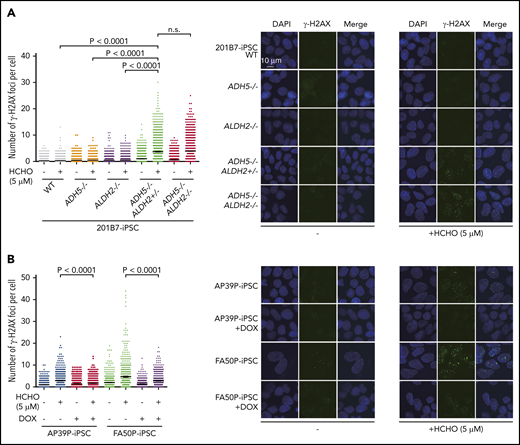
γH2AX foci levels. (A) Quantification of γH2AX foci per cell in knockout iPSCs with the indicated genotypes. (B) Patient-derived iPSCs treated or not with DOX-induced expression of ADH5. The points represent the number of foci per nucleus in a single cell. Cells were exposed to formaldehyde (HCHO; 5 μM) for 24 hours and stained with anti-γH2AX antibody. Mean ± SEM (n = 500) are shown for each condition. The experiment was repeated twice with similar results. The P values were calculated using 1-way ANOVA with Tukey’s multiple-comparisons test. Representative images are shown. n.s., not significant.
γH2AX foci levels. (A) Quantification of γH2AX foci per cell in knockout iPSCs with the indicated genotypes. (B) Patient-derived iPSCs treated or not with DOX-induced expression of ADH5. The points represent the number of foci per nucleus in a single cell. Cells were exposed to formaldehyde (HCHO; 5 μM) for 24 hours and stained with anti-γH2AX antibody. Mean ± SEM (n = 500) are shown for each condition. The experiment was repeated twice with similar results. The P values were calculated using 1-way ANOVA with Tukey’s multiple-comparisons test. Representative images are shown. n.s., not significant.
We next subjected these human iPSCs to in vitro hematopoietic differentiation according to a previously established protocol.14 Hemato-angiogenic progenitors derived from iPSCs were sorted into MethoCult media on the basis of CD34 and KDR expression at day 7 in the differentiation induction step (Figure 5A). The MethoCult plates were incubated for ∼12 days until progenitor colonies were formed (Figure 5B). We found that a single homozygous KO of ADH5 or ALDH2 only mildly decreased the number of hematopoietic colonies. Strikingly, however, iPSCs with an ADH5−/−ALDH2+/− or ADH5−/−ALDH2−/− genotype failed to form hematopoietic colonies with all 4 morphological classifications (Figure 5C-E). The loss of colony formation in the patient-derived iPSCs was reversed by DOX-induced ADH5 expression. To increase ALDH2 activity in these patient-derived iPSCs, we wanted to use an ALDH2 activator drug instead of exogenous expression of ALDH2, because ALDH2*2 is known to act in a dominant-negative manner. However, the well-known ALDH2 activator Alda-119 was found to be toxic to iPSCs (supplemental Figure 6A). Therefore, we tried a more recently developed ALDH2 stimulator compound, C1,20 that can increase the enzymatic activity of the ALDH2-E504K variant in vitro (supplemental Figure 6B-D). We added C1 to MethoCult medium and found that this treatment was well tolerated by iPSCs and modestly improved the colony formation of AP39P iPSCs, hence hematopoietic differentiation (Figure 5E). Collectively, these results clearly demonstrated that the combined defects in ADH5 and ALDH2*2, even if the latter was heterozygous, resulted in a drastically reduced potential for hematopoietic differentiation.
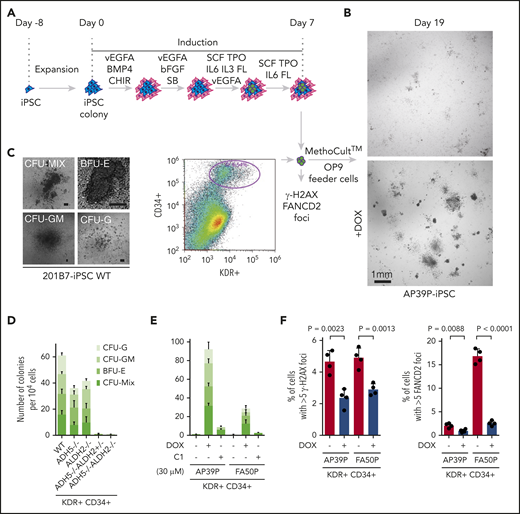
Cytokine-induced in vitro hematopoietic differentiation of disease model iPSCs. (A) Schematic protocol to induce hematopoietic differentiation in iPSCs, as described previously.14 Following the liquid culture phase, cells were sorted at day 7 based on positive staining with anti-CD34 and anti-KDR antibodies, as indicated in the FACS profile shown, and cells were seeded into MethoCult media on OP9 feeder cells.15 (B) Phase-contrast images at day 19 of colonies derived from AP39P-iPSCs, cultured or not with DOX-induced ADH5 expression. (C) Representative images of the hematopoietic progenitor colonies formed in MethoCult media following KDR+CD34+ sorting. Each colony was observed microscopically and classified as described previously.14 (D-E) Number of progenitor cell colonies in MethoCult media at around day 19 from the sorted KDR+CD34+ fraction of the knockout iPSCs with the indicated genotypes (scale bars, 100 μm) (D) and patient-derived iPSCs (E). Mean ± standard deviation (SD) from 3 biological replicates are shown. The ALDH2 activating compound C1 was added on day 0 (30 μM). The experiment in duplicate culture was repeated twice with different sets of iPSC clones. (F) Levels of γH2AX and FANCD2 foci, scored as the percentage of cells with >5 foci per cell. The KDR+CD34+ cells were sorted at day 7 following the liquid culture phase, with or without DOX-induced ADH5 expression, and stained with anti-γH2AX or anti-FANCD2 antibody. The number of foci was evaluated by an IN Cell Analyzer 2000, with ≥1500 cells for each sample. Mean ± SD in quadruplicate cultures are indicated. The P values were calculated using an unpaired, 2-tailed Student t test. Representative images of cells are shown in supplemental Figure 7.
Cytokine-induced in vitro hematopoietic differentiation of disease model iPSCs. (A) Schematic protocol to induce hematopoietic differentiation in iPSCs, as described previously.14 Following the liquid culture phase, cells were sorted at day 7 based on positive staining with anti-CD34 and anti-KDR antibodies, as indicated in the FACS profile shown, and cells were seeded into MethoCult media on OP9 feeder cells.15 (B) Phase-contrast images at day 19 of colonies derived from AP39P-iPSCs, cultured or not with DOX-induced ADH5 expression. (C) Representative images of the hematopoietic progenitor colonies formed in MethoCult media following KDR+CD34+ sorting. Each colony was observed microscopically and classified as described previously.14 (D-E) Number of progenitor cell colonies in MethoCult media at around day 19 from the sorted KDR+CD34+ fraction of the knockout iPSCs with the indicated genotypes (scale bars, 100 μm) (D) and patient-derived iPSCs (E). Mean ± standard deviation (SD) from 3 biological replicates are shown. The ALDH2 activating compound C1 was added on day 0 (30 μM). The experiment in duplicate culture was repeated twice with different sets of iPSC clones. (F) Levels of γH2AX and FANCD2 foci, scored as the percentage of cells with >5 foci per cell. The KDR+CD34+ cells were sorted at day 7 following the liquid culture phase, with or without DOX-induced ADH5 expression, and stained with anti-γH2AX or anti-FANCD2 antibody. The number of foci was evaluated by an IN Cell Analyzer 2000, with ≥1500 cells for each sample. Mean ± SD in quadruplicate cultures are indicated. The P values were calculated using an unpaired, 2-tailed Student t test. Representative images of cells are shown in supplemental Figure 7.
To test whether the loss of ADH5/ALDH2 was accompanied by increased levels of DNA damage during hematopoietic differentiation, we sorted CD34+KDR+ cells from patient-derived iPSCs, with or without DOX-induced ADH5 expression at day 7 of the aforementioned protocol (Figure 3A), and monitored γH2AX and FANCD2 foci. Formation of FANCD2 foci is a hallmark of FA pathway activation.3,4 Both of these DNA damage indicators were modestly elevated and clearly suppressed by ADH5 expression (Figure 5F; supplemental Figure 7).
ADH5 and ALDH2 protect in vitro hematopoietic differentiation of disease model iPSC lines
To determine how the loss of ADH5/ALDH2 affects cells at various stages during hematopoietic differentiation, we carried out liquid culture experiments up to day 18 based on an established protocol (Figure 6A).14 After the cell stimulation was initiated, using the same protocol described above, the cultures were maintained in Stemline II Medium with repeated cytokine stimulation. We collected all cells within the dish (adherent and floating) during the on-going differentiation process at days 6, 10, and 18, and analyzed them by flow cytometry (Figure 6B). In ADH5−/−ALDH2−/− iPSC differentiation, the percentage of cells in the CD34+CD45− fraction at day 6 (hemato-angiogenic progenitor stage) did not appear to be altered compared with WT or ADH5 or ALDH2 single-KO cells (Figure 6C). However, at day 10, there was a higher percentage of immature hematopoietic progenitor cells (CD34+CD45−), and the percentage of CD34+CD45+ and CD34−CD45+ cells, representing more mature cell fractions, decreased commensurately (Figure 6D). These data suggested the presence of a differentiation block at the transition from the immature hematopoietic progenitor stage to subsequent stages. Furthermore, at day 18, the fraction of CD34−CD45+ (mature hematopoietic) cells derived from ADH5/ALDH2-deficient iPSCs was clearly decreased relative to WT or single-KO cells (Figure 6E). In this experiment, we also looked at the percentage of FANCD2 foci–positive cells in floating cells, and found that the foci levels increased progressively from day 10 to day 18 in ADH5- or ALDH2-deficient cells but not in WT cells (Figure 6F; Supplemental Figure 8), suggesting that DNA damage due to formaldehyde is generated throughout the process and accumulates over time. We consider these floating cells to be CD45+ blood cells, as indicated by the previous study.14 The foci seem to be somehow resolved by DNA repair and did not severely affect viability and differentiation in ADH5- or ALDH2-deficient cells. By contrast, the floating ADH5−/−ALDH2−/− cells showed extensive cell death; therefore, the immunostaining was not reliable. Based on the above data, we conclude that the differentiation block by DNA damage becomes significant upon initiation of hematopoietic differentiation and persists during the process. Future experimental work should aim to further characterize the cells in this differentiation system, including transcriptomic evaluation and flow cytometric analyses on apoptosis and the cell cycle.
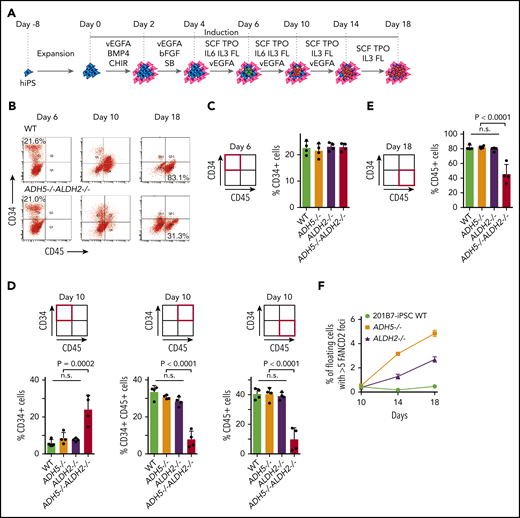
Analysis of cytokine-induced in vitro hematopoietic differentiation of disease model iPSCs. (A) A schematic protocol using a liquid medium to induce hematopoietic differentiation in iPSCs, as described previously.14 (B) The entire cellular composition from the indicated iPSCs, stained with the indicated antibodies, was analyzed by flow cytometry. (C-E) The experiments in duplicate culture were repeated twice with different sets of iPSC clones, and mean ± standard deviation (SD) are shown. The P values were calculated using 1-way ANOVA with Tukey’s multiple-comparisons test. (C) Quantification of the percentage of CD34+ hematopoietic progenitor cells on day 6. (D) Quantification of the percentages of CD34+, CD34+CD45+, and CD45+ cells on day 10. (E) Quantification of the percentage of CD45+ hematopoietic cells on day 18. (F) FANCD2 foci were scored as the percentage of cells with >5 foci per cell. Mean ± SD in quadruplicate cultures are shown. The number of foci was evaluated by an IN Cell Analyzer 2000 with ≥3000 cells for each sample. Representative images of cells are shown in supplemental Figure 8. ADH5−/−ALDH2−/− iPSCs were excluded from this analysis because of extensive cell death. n.s., not significant.
Analysis of cytokine-induced in vitro hematopoietic differentiation of disease model iPSCs. (A) A schematic protocol using a liquid medium to induce hematopoietic differentiation in iPSCs, as described previously.14 (B) The entire cellular composition from the indicated iPSCs, stained with the indicated antibodies, was analyzed by flow cytometry. (C-E) The experiments in duplicate culture were repeated twice with different sets of iPSC clones, and mean ± standard deviation (SD) are shown. The P values were calculated using 1-way ANOVA with Tukey’s multiple-comparisons test. (C) Quantification of the percentage of CD34+ hematopoietic progenitor cells on day 6. (D) Quantification of the percentages of CD34+, CD34+CD45+, and CD45+ cells on day 10. (E) Quantification of the percentage of CD45+ hematopoietic cells on day 18. (F) FANCD2 foci were scored as the percentage of cells with >5 foci per cell. Mean ± SD in quadruplicate cultures are shown. The number of foci was evaluated by an IN Cell Analyzer 2000 with ≥3000 cells for each sample. Representative images of cells are shown in supplemental Figure 8. ADH5−/−ALDH2−/− iPSCs were excluded from this analysis because of extensive cell death. n.s., not significant.
Discussion
The results presented here suggest that an inability to detoxify endogenous formaldehyde by ADH5/ALDH2 can promote cytotoxicity involving DNA damage and leading to hematopoietic stem cell failure in humans without any obvious DNA repair defects. The dual requirement for ADH5 and ALDH2 in the in vitro hematopoietic differentiation/expansion of the iPSCs was validated by genetic complementation of ADH5 and by chemically stimulating ALDH2 activity. Furthermore, using genome editing we generated human iPSCs mimicking the defects in 2 IBMFS patients and observed similar hematopoietic differentiation defects in vitro. These defects may include changes in the expression of genes such as those regulating apoptosis or the cell cycle, as detected in ADH5/ALDH2-KO mice2 or in an FA iPSC model.21
The combined ADH5/ALDH2 system utilizes cytoplasmic ADH5 as the primary defense against formaldehyde damage, as well as mitochondrial ALDH2 as a backup. In the absence of this system, the DNA repair capacity is easily overwhelmed by low-dose formaldehyde, as indicated by the higher levels of DNA damage than in FANCD2-deficient cells. Our results may also may aid our understanding of FA pathophysiology. Together with previous studies indicating that there is a genetic interaction between FA and ALDH2 or ADH5,18,22,23 and the overlapping clinical phenotypes in FA and ADH5/ALDH2 deficiency, our results support the notion that the relevant endogenous genotoxin during FA pathogenesis is likely formaldehyde. However, there are notable differences in clinical phenotypes (eg, absence of malformations, such as radial ray defects, and the presence of mild mental retardation in ADH5/ALDH2 deficiency). Additional basic and clinical studies would be required to provide a full picture of the pathophysiology of the condition.
A recent report provided evidence supporting the clinical utility of aldehyde-sequestering compounds, such as metformin or aminoguanidine, in FA.24 Our results are compatible and suggest that the novel ALDH2 stimulator C1 could be a promising seed compound for developing treatments for FA and ADH5/ALDH2 deficiency. Importantly, C1 did not appear to be toxic to iPSCs and showed a higher activity toward the variant ALDH2 enzyme than Alda-1. An ADH5-activating drug, if it becomes available, might be also useful for FA. The phenotypes in ADH5/ALDH2 deficiency indicate that ADH5-inhibitor drugs, if used in clinical settings,25 should be administered with caution among east Asian populations.
We note that the growth rate and cell cycle profile were not strongly affected in our model cell lines lacking the ADH5/ALDH2 module, whereas FANCD2-deficient cells displayed obvious growth defects. Thus, the endogenous formaldehyde levels during stable cell culture conditions may be low and do not require removal by ADH5/ALDH2 to sustain cell growth. This notion fits well with the lower SCE levels in fibroblasts. Strikingly, ADH5/ALDH2-deficient iPSCs cease cell expansion and display pronounced indicators of DNA damage when they are forced into hematopoietic differentiation in vitro, consistent with abundant formaldehyde generation. FA and the ADH5/ALDH2 deficiency show bone marrow failure as the most prominent clinical manifestation, suggesting that the hematopoietic system might be the dominant organ to generate formaldehyde in our body. Notably, hepatic and renal phenotypes in ADH5/FANCD2-deficient mice are reversed following HSCT with a WT donor.23 With the current technology available to us, we could not provide definitive proof of increased levels of formaldehyde (in cells or culture media) or DNA adducts in the genome, which is a limitation of the current study. In the future, it will be important to test whether the correction of ADH5/ALDH2 status by HSCT in the patients can reduce blood formaldehyde levels. This is a critical issue for patients and clinicians when considering the long-term prognosis after HSCT. Finally, we propose that the source of genotoxic formaldehyde is the extensive histone demethylation that is intrinsic to epigenetic changes occurring in chromatin during differentiation.26 We also suggest that phytohemagglutinin-stimulated blastogenesis in lymphocytes may induce demethylation events and generate formaldehyde. Epigenetic changes are significant during development,27 and this may explain why mice deficient in both ADH5 and ALDH2 displayed perinatal sublethality.2,28
Data sharing requests should be sent to Minoru Takata (takata.minoru.8s@kyoto-u.ac.jp).
The online version of this article contains a data supplement.
The publication costs of this article were defrayed in part by page charge payment. Therefore, and solely to indicate this fact, this article is hereby marked “advertisement” in accordance with 18 USC section 1734.
Acknowledgments
The authors thank Masao S. Sasaki for deposition of samples and data to JCRB; Noriko Hirayama and Arihiro Kohara (JCRB Cell Bank) for cooperation and help with SCE experiments; James Hejna for critical reading and English editing; Ashok Venkitaraman and Andres Canela for critical reading of the manuscript; K. J. Patel and Jun Nakamura for sharing unpublished results; Feng Zhang, Sara Howden, and James Thomson for plasmids; the Medical Research Support Center (Graduate School of Medicine, Kyoto University) for use of the cell sorting facility; and Hiroshi Harada (Radiation Biology Center) for use of the FACSCanto.
This work was supported by Japan Society for the Promotion of Science (JSPS) Grants-in-Aid for Scientific Research (KAKENHI) (JP23114010, JP26550026, and JP15H01738 [M.T.] and 16K15243 [A.H.]), the Japan Leukemia Research Fund (A.H.), the Takeda Science Foundation (A.H.), the Uehara Memorial Foundation (M.T.), the Astellas Foundation for Research on Metabolic Disorders (M.T.), The Kyoto University Research Fund (Core Stage Back-Up) (M.T.), and The Ministry of Health, Labour and Welfare (S.K.). This work was also supported by the Core Center for iPS Cell Research of The Research Center Network for Realization of Regenerative Medicine, Japan Agency for Medical Research and Development (AMED) (M.K.S.), and The Program for Intractable Diseases Research utilizing Disease-specific iPS Cells, AMED (grants 17935423 and 17935400) (M.K.S. and M.O.). The Radiation Biology Center, Graduate School of Biostudies, Kyoto University, is a joint usage research center certified by the Ministry of Education, Culture, Sports, Science and Technology (MEXT) and is also supported by the JSPS Core-to-Core Program (grant JPJSCCA20200009).
Authorship
Contribution: M.T. and M.K.S. planned the study with help from K.M., E.I., S.K., S.O., and T.N.; M.T.K. provided critical plasmids; A.M. and A.H. carried out most of the experiments and analyzed data with help from A.N., M.O., M.M., Y.O., K.Y., and T.M.; K.T. and K.I. provided C1 with the biochemical data; K.K. provided ALDH2-WT and ALDH2-E504K proteins; and M.T. and A.M. wrote the manuscript.
Conflict-of-interest disclosure: The authors declare no competing financial interests.
Correspondence: Minoru Takata, Radiation Biology Center, Graduate School of Biostudies, Kyoto University, Yoshidakonoe-cho, Sakyo-ku, Kyoto 606-8501, Japan; e-mail: takata.minoru.8s@kyoto-u.ac.jp.

This feature is available to Subscribers Only
Sign In or Create an Account Close Modal