

Key Points
TCZ did not significantly reduce the incidence of grade 2-4 aGVHD, although trends were seen in VUD recipients.
Addition of TCZ to standard GVHD prophylaxis did not improve long-term survival.

Abstract
We determined the efficacy of tocilizumab (TCZ) in preventing grade 2-4 acute graft-versus-host disease (aGVHD) in patients with acute leukemia or myelodysplasia undergoing matched sibling donor (MSD) or volunteer unrelated donor (VUD) allogeneic stem cell transplantation after myeloablative or reduced-intensity conditioning across 5 Australian centers. A total of 145 patients (50 MSD, 95 VUD) were randomly assigned to placebo or TCZ on day −1. All patients received T-cell–replete peripheral blood stem cell grafts and graft-versus-host disease (GVHD) prophylaxis with cyclosporin/methotrexate. A planned substudy analyzed the VUD cohort. With a median follow-up of 746 days, the incidence of grade 2-4 aGVHD at day 100 for the entire cohort was 36% for placebo vs 27% for TCZ (hazard ratio [HR], 0.69; 95% confidence interval [CI], 0.38-1.26; P = .23) and 45% vs 32% (HR, 0.61; 95% CI, 0.31-1.22; P = .16) for the VUD subgroup. The incidence of grade 2-4 aGVHD at day 180 for the entire cohort was 40% for placebo vs 29% for TCZ (HR, 0.68; 95% CI, 0.38-1.22; P = .19) and 48% vs 32% (HR, 0.59; 95% CI, 0.30-1.16; P = .13) for the VUD subgroup. Reductions in aGVHD were predominantly in grade 2 disease. For the entire cohort, transplant-related mortality occurred in 8% vs 11% of placebo-treated vs TCZ-treated patients, respectively (P = .56), and overall survival was 79% vs 71% (P = .27). Median day to neutrophil and platelet engraftment was delayed by 2 to 3 days in TCZ-treated patients, whereas liver toxicity and infectious complications were similar between groups. In this phase 3 randomized double-blind trial, TCZ showed nonsignificant trends toward reduced incidence of grade 2-4 aGVHD in recipients from HLA-matched VUDs but no improvements in long term-survival.
Introduction
Acute graft-versus-host disease (aGVHD) remains a major cause of morbidity and mortality within the first 100 to 180 days after allogeneic stem cell transplantation (SCT).1 The disease affects the gastrointestinal tract, skin, and liver, manifesting as diarrhea, a maculopapular rash, and jaundice and occurs in 40% to 70% of SCT recipients.1 Current approaches to prevent disease focus on T-cell–directed immune suppression, typically with a calcineurin inhibitor and methotrexate or mycophenolate mofetil. More recent approaches have included naive T-cell depletion2 and posttransplant cyclophosphamide,3 which appear to reduce the incidence of chronic graft-versus-host disease (cGVHD) more dramatically than aGVHD. Thus, new approaches to prevent aGVHD represent an ongoing unmet clinical need.
The pathophysiology of aGVHD involves the induction of inflammation by chemoradiotherapy during conditioning that enhances alloantigen presentation by recipient antigen-presenting cells (APCs), which, in turn, stimulate donor T cells. Thereafter, alloreactive donor T cells differentiate along pathogenic T helper 1 (Th1) and Th17 paradigms under the direction of interleukin-12 (IL-12) and IL-6, respectively. In the final effector phase, target tissue apoptosis is mediated by inflammatory cytokines, including IL-6, tumor necrosis factor, and IL-1, together with T-cell–intrinsic cytolytic pathways (eg, perforin/granzyme).4,5 Given this disease pathophysiology, IL-6 has been recognized as a critical pathogenic cytokine and, thus, represents a logical therapeutic target.
Previous studies have demonstrated that IL-6 is predominantly generated after bone marrow transplantation (BMT) in response to conditioning6,7 and cognate interactions between recipient dendritic cells (DCs) and alloreactive donor T cells.8 In this setting, IL-6 derived from recipient DC signals to donor T cells via the classical pathway to drive Th17 and Th22 cell differentiation while inhibiting regulatory T-cell differentiation in tissue.8,9 Th17 cells and T cytotoxic 17 (Tc17) cells are typically polyfunctional and secrete large amounts of inflammatory cytokines, including interferon-γ (IFN-γ), tumor necrosis factor, granulocyte-macrophage colony-stimulating factor (GM-CSF), IL-17A, and IL-22.10,11 These cytokines are directly pathogenic in the gastrointestinal (GI) tract and skin,10-12 and GM-CSF further expands donor APCs in the GI tract.13 Donor APCs expanded by GM-CSF, predominantly DCs, secrete IL-12 and IL-6 to further amplify donor T-cell expansion and differentiation while imprinting gut-homing integrins (eg, α4β7) to amplify GVHD severity, particularly in the GI tract.5,14
Phase 1/2 clinical studies of tocilizumab (TCZ) in GVHD can be grouped broadly into treatment and prophylaxis studies. To date, treatment studies have been small retrospective or prospective single-arm studies and have suggested improvements in steroid-refractory aGVHD when treated with TCZ, usually in combination with other agents.15-17 Two 2-phase 1/2 single-arm prospective studies added TCZ to standard GVHD prophylaxis.7,18 In the first single-center study (n = 48), TCZ was administered at day −1 (8 mg/kg to a maximum of 800 mg) in addition to standard GVHD prophylaxis with cyclosporin and methotrexate. Patients received myeloablative conditioning (MAC) with cyclophosphamide and fractionated total body irradiation (TBI) or reduced intensity conditioning (RIC) with fludarabine and melphalan. Patients received 10/10 HLA (-A, -B, -C, -DR, -DQ)–matched peripheral blood (PB) stem cell grafts from matched sibling donors (MSDs) or matched volunteer unrelated donors (VUDs). Day 100 rates of grade 2-4 aGVHD were low (12%) compared with historical rates expected to be >40%.7 TCZ was well tolerated and blocked IL-6 for 30 days after transplant, as determined by inhibition of STAT3 phosphorylation in PB T cells and monocytes in response to IL-6. In a second study involving 2 centers (N = 35),18 TCZ was used at the same dosing schedule and added to tacrolimus and methotrexate–based immune suppression after busulfan-based MAC or RIC conditioning, again using predominantly PB stem cell grafts from MSDs and VUDs. Rates of day-100 and day-180 grade 2-4 aGVHD were low (14% and 17%, respectively), and TCZ was well tolerated. The rate of grade 2-4 aGVHD-free survival at 6 months was improved relative to a historical matched cohort (69% vs 42%; P < .001).18 Given these encouraging preclinical and early-phase clinical data, we undertook a multicenter randomized double-blind study within Australia using the same dosing schedule in an extended group of transplant patients.
Research design and methods
Study design and participants
This was a 1:1 randomized placebo-controlled phase 3 double-blind study to determine the efficiency of TCZ in preventing the development of grade 2-4 graft-versus-host disease (GVHD) in patients undergoing matched allogeneic hematopoietic SCT after MAC or RIC preparative regimens at major Australian transplant centers in Melbourne, Sydney, Perth, and Brisbane.
The trial was approved by the Royal Brisbane and Women’s Hospital Human Ethics Committees (HREC: /14/QRBW/35; ERM: 23619) and QIMR Berghofer Medical Research Institute; written informed consent was obtained from all patients. The trial was registered at the Australian and New Zealand Clinical Trials Registry (ACTRN12614000266662).
Eligibility criteria were patients aged 18 to 70 years with acute leukemia (acute myeloid leukemia or acute lymphoblastic leukemia) in morphological remission, myelodysplasia (World Health Organization classification) or chronic myelomonocytic leukemia (CMML) undergoing T-cell–replete HLA-matched allogeneic hematopoietic progenitor cell transplantation (HPCT) with MAC or RIC from MSDs or matched VUDs, Eastern Cooperative Oncology Group performance status ≤2, total bilirubin ≤30 μmol/L, serum transaminases ≤3.0 times the upper limit of normal (3×ULN), creatinine clearance ≥50 mL/min per 1.73 m2, left ventricular ejection fraction ≥40% normal, and pulmonary diffusion capacity ≥40% predicted. Sibling donors were matched at HLA-A, -B, and -C loci using intermediate-resolution sequence-specific primers, and at the HLA-DRB1 locus using high-resolution sequence-based typing methods (8/8 match); VUDs were matched at HLA-A, -B, -C, and -DRB1 loci using high-resolution sequence-based typing methods (8/8 match).
Procedures
MAC was with cyclophosphamide/TBI (cyclophosphamide: 60 mg/kg per day on days −5 and −4 plus TBI: 12 Gy total on days −3 to −1) or busulfan/cyclophosphamide (busulfan: 16 mg/kg per day oral equivalent on days −7 to −4 plus cyclophosphamide: 60 mg/kg per day on days −3 and −2). RIC was with fludarabine/melphalan (fludarabine 25 mg/m2 per day on days −7 to −3 plus melphalan: 120 mg/m2 administered on day −2) or with fludarabine/busulfan (fludarabine: 40 mg/m2 per day on days −6 to −3 plus busulfan: 130 mg/m2 per day on days −6 to −3).
Granulocyte colony-stimulating factor (G-CSF)–mobilized stem cells were transplanted in all patients without anti-thymocyte globulin, campath-1H, or ex vivo T-cell depletion. GVHD prophylaxis was cyclosporin (5 mg/kg per day from day −1 through day +1 and then 3 mg/kg per day to maintain therapeutic levels [trough levels of 140-300 ng/mL] for a recommended minimum of 100 days, with weaning thereafter at clinical discretion) plus methotrexate (15 mg/m2 on day +1 and then 10 mg/m2 on days +3, +6, and +11).
In addition to standard care, the only active study intervention was a single dose of TCZ vs placebo at day −1 of transplantation. Patients were randomized on a 1:1 basis after study consent and prior to commencing conditioning. Patients randomized to TCZ received 8 mg/kg (maximum 800 mg) as an IV infusion over 60 minutes, whereas patients randomized to placebo received an IV infusion of normal saline at an identical volume and rate. Identical premedications were administered to all patients 15 to 30 minutes pre-TCZ/normal saline administration (paracetamol, 1 g by mouth, and promethazine, 12.5 mg IV). All medical, nursing, and laboratory staff were blinded to randomization.
All patients received infection prophylaxis for Pneumocystis carinii and cytomegalovirus (CMV)/herpes simplex virus infections (cotrimoxazole and acyclovir/valaciclovir, respectively), for 1 year posttransplantation. Letermovir was not used in this study. Antifungal prophylaxis was with fluconazole or an alternative systemic agent when required until day 75 post-HPCT.
Chimerism studies were determined via short tandem repeat analysis of fluorescence-activated cell sorting or magnetic-sorted populations in PB on days 30, 90, and 365 posttransplant.
Outcomes
The primary end point was the incidence of moderate (grade 2-4) aGVHD at day 100 posttransplantation, which was assessed and graded as per revised Seattle criteria.19 Secondary end points included time to engraftment (neutrophil engraftment was defined as the first day with neutrophil count >0.5 × 10⁹/L on 3 consecutive days postnadir, and platelet engraftment was defined as the first day with platelet count >20 × 109/L [unsupported] for 5 consecutive days postnadir), infection grade ≥2 (as per the Common Terminology Criteria for Adverse Events criteria, version 4), grade ≥3 liver toxicity (liver enzymes >5×ULN or bilirubin >3×ULN), grade 2-4 GVHD-free survival (GVHD-FS) at day 180, transplant-related mortality (TRM), progression-free survival (PFS), and overall survival (OS). GVHD-FS was defined as survival at day 180 in the absence of classical or late-onset grade 2-4 GVHD, as defined by Seattle19 or National Institutes of Health20 GVHD criteria, respectively. cGVHD was defined by National Institutes of Health criteria.20 TRM was defined as any death not attributable to relapse or progression of underlying malignant disease. PFS was measured from commencement of TCZ/placebo at day −1 until relapse and/or progression of underlying disease or death from any cause, and OS was measured from commencement of TCZ/placebo at day −1 until death from any cause.
Power analysis and randomization
Analysis of a historical T-cell–replete HPCT patient cohort of patients receiving cyclosporine and methotrexate as GVHD prophylaxis at Royal Brisbane & Women’s Hospital defined baseline incidence of grade 2-4 aGVHD as ∼50% to 55%. Using a stratified design (based on 2 donor classes), to detect a 50% reduction in the incidence of grade 2-4 GVHD, with 80% power and a 2-sided significance level of 5%, a sample size of 145 patients was required (ie, 73 patients per arm). For GVHD-FS analysis in VUD HPCT, assuming a GVHD-FS of 35% to 40% in the control arm, to detect a 25% to 30% increase in GVHD-FS with 80% power and a 1-sided α level <0.05, a minimum of 95 URD transplants was required.
Subjects were randomly allocated 1:1 into 2 treatment arms ensuring adequate patient representation based on stratification by study center and conditioning protocol. The study recruitment period was from July 2014 to September 2017.
Study data management
A regulatory complaint and validated study database was developed and managed in OpenClinica at the Melbourne EpiCentre, University of Melbourne. All data queries and corrections were jointly conducted by the Melbourne EpiCentre and the TCZ Ph III study team prior to database lock.
Statistical analysis
All safety and efficacy analyses were conducted on an intention-to-treat population. To compare the risk of grade 2-4 aGVHD at 100 and 180 days between the treatment groups, competing-risk regression models were used. Relapse and TRM were treated as competing risks for each other, whereas relapse and death were treated as competing risks for aGVHD. Time (in days) to event was measured from the day of transplantation or censored at the end of follow-up. Hazard ratios (HRs) with robust standard error–based 95% confidence intervals (CIs) and corresponding P values were estimated. As an additional analysis, the donor group was used as a covariate in the regression models. The nonparametric Kaplan-Meier method was used to compare TRM, PFS, and overall mortality between the treatment groups.
Logistic regression was used to compare the incidence of engraftment by day 30 and liver toxicity between the treatment groups. The infection rates between the treatment groups were compared using zero-inflated negative binomial models, and the incidence rate ratios (IRRs) along with 95% CIs were estimated. P values <.05 were considered statistically significant.
Results
Donor and recipient characteristics
Of 154 patients who underwent screening between June 2014 and September 2017, 145 (94%) were enrolled into the study: 73 were randomly assigned to placebo, and 72 were randomly assigned to TCZ. Overall, 9 patients (6%) failed screening and did not undergo randomization (Figure 1). All patients randomized at study baseline received their allocated treatment.

Clinical and transplantation characteristics are detailed in Table 1. There were no statistically significant differences in study variables at baseline between groups. Median follow-up for survivors was 24.5 months (range, 12.1 to 50.2).
Baseline characteristics for all patients and for the donor subgroups at the time of study initiation
| Control | Intervention | |||||
|---|---|---|---|---|---|---|
| All (n = 73) | VUD (n = 45) | MSD (n = 28) | All (n = 72) | VUD (n = 50) | MSD (n = 22) | |
| Males, n (%) | 43 (59) | 22 (49) | 21 (75) | 38 (53) | 25 (50) | 13 (59) |
| Age, mean (SD), y | 49 (12) | 51 (12) | 45 (12) | 49 (14) | 49 (15) | 49 (10) |
| Disease | ||||||
| AML | 39 (54) | 23 (51) | 16 (58) | 44 (61) | 32 (64) | 12 (55) |
| ALL | 19 (26) | 12 (27) | 7 (25) | 10 (14) | 7 (14) | 3 (14) |
| MDS | 14 (19) | 10 (22) | 4 (14) | 13 (18) | 8 (16) | 5 (23) |
| CMML | 1 (1) | 0 (0) | 1 (4) | 5 (7) | 3 (6) | 2 (9) |
| Disease status | ||||||
| CR1 | 64 (88) | 37 (82) | 27 (96) | 63 (88) | 45 (90) | 18 (82) |
| >CR1 | 4 (5.5) | 4 (9) | 0 (0) | 7 (10) | 3 (6) | 4 (18) |
| Untreated MDS | 1 (1) | 1 (2) | 0 (0) | 1 (1) | 1 (2) | 0 (0) |
| Unknown | 4 (5.5) | 3 (7) | 1 (4) | 1 (1) | 1 (2) | 0 (0) |
| MAC | 33 (45) | 18 (40) | 15 (54) | 31 (43) | 21 (42) | 10 (45) |
| Cyclophosphamide/TBI | 24 (33) | 13 (29) | 11 (39) | 22 (31) | 17 (34) | 5 (23) |
| Busulfan/cyclophosphamide | 9 (12) | 5 (11) | 4 (14) | 9 (13) | 4 (8) | 5 (23) |
| RIC | 40 (55) | 27 (60) | 13 (46) | 41 (57) | 29 (58) | 12 (55) |
| Fludarabine/melphalan | 40 (55) | 27 (60) | 13 (46) | 41 (57) | 29 (58) | 12 (55) |
| CMV status | ||||||
| D+R+ | 30 (41) | 14 (31) | 16 (57) | 25 (35) | 10 (20) | 15 (68) |
| D+R− | 10 (14) | 8 (18) | 2 (7) | 12 (17) | 9 (18) | 3 (14) |
| D−R+ | 19 (26) | 15 (33) | 4 (14) | 18 (25) | 15 (30) | 3 (14) |
| D−R− | 14 (19) | 8 (18) | 6 (21) | 17 (24) | 16 (32) | 1 (5) |
| ABO disparity | ||||||
| Matched | 50 (68) | 26 (58) | 24 (86) | 38 (53) | 23 (46) | 15 (68) |
| Minor mismatch | 10 (14) | 8 (18) | 2 (7) | 16 (22) | 14 (28) | 2 (9) |
| Major mismatch | 11 (15) | 10 (22) | 1 (4) | 11 (15) | 10 (20) | 1 (5) |
| Major and minor mismatch | 2 (3) | 1 (2) | 1 (4) | 7 (10) | 3 (6) | 4 (18) |
Unless otherwise noted, data are n (%).
ALL, acute lymphoblastic leukemia; AML, acute myeloid leukemia; CR1, first complete remission; MDS. myelodysplastic syndrome; SD, standard deviation.
GVHD outcomes
Although there was a trend toward a reduced risk for moderate-severe GVHD in TCZ-treated patients, especially in the VUD subgroup, this did not reach statistical significance (Figure 2; Table 2). The overall incidence of grade 2-4 GVHD at day 100 for the entire cohort was 36% for placebo vs 27% for TCZ (HR, 0.69; 95% CI: 0.38-1.26; P = .23), and for the VUD subgroup, it was 45% vs 32% for placebo vs TCZ, respectively (HR, 0.61; 95% CI, 0.31-1.22; P = .16). The incidence of grade 2-4 GVHD at day 180 for the entire cohort was 40% for placebo vs 29% for TCZ (HR, 0.68; 95% CI, 0.38-1.22; P = .19), and it was 48% vs 32% for the VUD subgroup (HR, 0.59; 95% CI, 0.30-1.16; P = .13) (Figure 2; Table 2). There was no apparent protection with regard to grade 2-4 aGVHD within any single organ in placebo- vs TCZ-treated recipients with lower incidence of stage III-IV skin events (11 vs 8), stage I-IV GI tract events (13 vs 9), and stage I-IV liver events (8 vs 3) in TCZ recipients. The overall incidence of severe (grade 3-4) GVHD was similar between groups; it was 13% vs 14% for placebo vs TCZ, respectively, at day 100 for the entire cohort (HR 1.04; 95% CI 0.42-2.61; P = .93), whereas it was 10% vs 14%, respectively, for the VUD subgroup (HR, 1.42; 95% CI, 0.41-4.95; P = .59) (Table 2). By day 180, grade 2-4 GVHD-FS in the entire cohort was 60% for the placebo-treated group vs 71% for the TCZ-treated group (HR, 1.47; 95% CI, 0.82-2.63; P = .19), with a trend toward improvement also noted in the TCZ-treated VUD subgroup (52% vs 68%, respectively; HR, 1.70; 95% CI, 0.86-3.37; P = .13) (Figure 3). Forty-nine patients developed moderate to severe cGVHD during the follow-up; 20 patients developed it within 180 days of transplantation. cGVHD occurred in 27 and 22 of the placebo- and TCZ-treated patients, respectively (P = .41, χ2 test).

Impact of tocilizumab on acute GVHD. For moderate-severe aGVHD (II-IV), cumulative hazard plots for all patients over +100 days (A), for VUD patients over +100 days (B), for all patients over +180 days (C), and for VUD patients for +180 days (D).
Impact of tocilizumab on acute GVHD. For moderate-severe aGVHD (II-IV), cumulative hazard plots for all patients over +100 days (A), for VUD patients over +100 days (B), for all patients over +180 days (C), and for VUD patients for +180 days (D).
Primary and secondary outcomes for all patients and for the VUD subgroup
| Control | Intervention | P | ||||
|---|---|---|---|---|---|---|
| All (n = 73) | VUD (n = 45) | All (n = 72) | VUD (n = 50) | All | VUD | |
| GVHD (2-4) at 100 d | ||||||
| n (%) | 25 (36) | 19 (45) | 18 (27) | 14 (32) | ||
| HR (95% CI) | — | — | 0.69 (0.38-1.26) | 0.61 (0.31-1.22) | .231 | .161 |
| GVHD (2-4) at 180 d | ||||||
| n (%) | 27 (40) | 20 (48) | 19 (29) | 14 (32) | ||
| HR (95% CI) | — | — | 0.68 (0.38-1.22) | 0.59 (0.30-1.16) | .192 | .125 |
| GVHD (3-4) at 100 d | ||||||
| n (%) | 9 (13) | 4 (10) | 9 (14) | 6 (14) | ||
| HR (95% CI) | — | — | 1.04 (0.42-2.61) | 1.42 (0.41-4.95) | .930 | .585 |
| GVHD (3-4) at 180 d | ||||||
| n (%) | 9 (14) | 4 (10) | 9 (14) | 6 (14) | ||
| HR (95% CI) | — | — | 1.04 (0.42-2.61) | 1.42 (0.41-4.95) | .930 | .585 |
| TRM | ||||||
| n (%) | 6 (8) | 5 (11) | 8 (11) | 5 (10) | ||
| HR (95% CI) | — | — | 1.37 (0.48-3.96) | 0.94 (0.27-3.23) | .558 | .919 |
| Disease-related mortality | ||||||
| n (%) | 8 (11) | 5 (11) | 11 (15) | 8 (16) | ||
| HR (95% CI) | — | — | 1.42 (0.57-3.53) | 1.48 (0.49-4.51) | .454 | .488 |
| PFS | ||||||
| n (%) | 55 (75) | 34 (76) | 48 (67) | 33 (66) | ||
| HR (95% CI) | — | — | 0.69 (0.38-1.28) | 0.64 (0.30-1.33) | .240 | .235 |
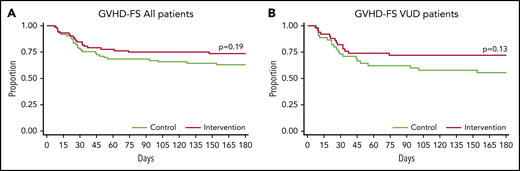
Acute GVHD free survival. Day-180 grade 2-4 GVHD-FS for the entire cohort (A) and the VUD subgroup (B).
Acute GVHD free survival. Day-180 grade 2-4 GVHD-FS for the entire cohort (A) and the VUD subgroup (B).
Survival, progression, and TRM
With a median follow-up of ∼2 years posttransplant, OS was 79% vs 71% in the control vs TCZ groups (HR, 0.69; 95% CI, 0.35-1.34; P = .27) (Figure 4). TRM was also similar between groups, occurring in 8% and 11% of patients, respectively (HR, 1.37; 95% CI, 0.48-3.96; P = .56) (Figure 4; Table 2). PFS was similar at 75% vs 67%, respectively (HR, 0.69; 95% CI, 0.38-1.28; P = .24) (Table 2). No statistically significant difference in OS, PFS, or TRM was observed between the treatment groups in the entire cohort or in the VUD subgroup (Figure 4; Table 2).

Survival and nonrelapse mortality. Kaplan-Maier plots comparing the risks between treatment groups for the entire cohort: OS (A), PFS (B), and TRM (C). Kaplan-Maier plots comparing the risks between treatment groups for the VUD cohort: OS (D), PFS (E), and TRM (F).
Survival and nonrelapse mortality. Kaplan-Maier plots comparing the risks between treatment groups for the entire cohort: OS (A), PFS (B), and TRM (C). Kaplan-Maier plots comparing the risks between treatment groups for the VUD cohort: OS (D), PFS (E), and TRM (F).
Engraftment and donor chimerism
In the entire cohort surviving for ≥30 days, 100% of placebo-treated patients vs 94% of TCZ-treated patients achieved neutrophil engraftment by day 30 (P = .041). Two patients receiving TCZ died beyond day 30 (days 31 and 32) with incomplete neutrophil recovery that was associated with veno-occlusive disease and multiorgan failure, respectively. Overall, in the entire cohort, the time to neutrophil engraftment was delayed slightly in TCZ-treated patients, with a median time of 15 days (range, 11-24) vs 18 days (range, 9-35) for placebo- vs TCZ-treated patients, respectively (Table 3). Slower neutrophil engraftment was also observed in the VUD subgroup, with a median time to neutrophil engraftment of 15 days (range, 11-22) vs 17 days (range, 9-35), respectively (Table 3). For the entire cohort, 96% of placebo-treated patients vs 76% of TCZ-treated patients achieved platelet engraftment by day 30 (P = .001). Overall, in the entire cohort, the time to platelet engraftment was also delayed slightly in TCZ-treated patients, with a median time of 16 days (range, 9-36) vs 19 days (range, 11-389) for placebo-treated patients vs TCZ-treated patients, respectively (Table 3). A statistically significant delay in platelet engraftment was not observed in the VUD subgroup, with a median time to platelet engraftment of 17 days (range, 12-32) vs 19 days (range, 12-61) for placebo-treated patients vs TCZ-treated patients, respectively (Table 3).
Secondary outcomes for all patients and for the VUD subgroup
| Control | Intervention | P | ||||
|---|---|---|---|---|---|---|
| All (n = 73) | VUD (n = 45) | All (n = 72) | VUD (n = 50) | All | VUD | |
| Engraftment | ||||||
| Incomplete neutrophil recovery by 30 d, n (%) | 0 (0) | 0 (0) | 4 (6) | 4 (8) | ||
| Neutrophil recovery, d | ||||||
| Median (range) | 15 (11-24) | 15 (11, 22) | 18 (9-35) | 17 (9-35) | ||
| Difference, median (95% CI) | 3 (1.0-5.0) | 2 (0.2-3.8) | .004 | .031 | ||
| Platelet recovery, d | ||||||
| Median (range) | 16 (9-36) | 17 (12-32) | 19 (11-389) | 19 (12-61) | ||
| Difference, median (95% CI) | 3 (0.1-5.9) | 2 (1.1-5.1) | .043 | .197 | ||
| Liver toxicity | ||||||
| Patients with ≥1 grade ≥3 liver AE | ||||||
| n (%) | 10 (14) | 6 (13) | 11 (15) | 9 (18) | ||
| OR (95% CI) | — | — | 1.14 (0.45-2.88) | 1.43 (0.46-4.41) | .788 | .537 |
| No. of grade ≥3 liver AEs, n (%) | ||||||
| 1 | 7 (10) | 5 (11) | 7 (10) | 5 (10) | ||
| 2 | 2 (3) | 0 (0) | 3 (4) | 3 (6) | ||
| 3 | 0 (0) | 0 (0) | 0 (0) | 0 (0) | ||
| 4 | 1 (1) | 1 (2) | 1 (1) | 1 (2) | ||
| IRR (95% CI) | — | — | 1.15 (0.45-2.94) | 1.5 (0.46-4.92) | .776 | .504 |
| No. of grade ≥3 liver AEs within 60 d, n (%) | ||||||
| 1 | 6 (8) | 4 (9) | 5 (7) | 5 (10) | ||
| 2 | 2 (3) | 0 (0) | 4(6) | 4 (8) | ||
| 3 | 0 (0) | 0 (0) | 0 (0) | 0 (0) | ||
| 4 | 1 (1) | 1 (2) | 0 (0) | 0 (0) | ||
| IRR (95% CI) | — | — | 0.91 (0.37-2.24) | 1.38 (0.41-4.58) | .832 | .604 |
| Possibly TCZ-related grade ≥3 liver AEs | ||||||
| n (%) | 3 (4) | 2 (4) | 2 (3) | 2 (4) | ||
| OR (95% CI) | 0.67 (0.11-4.14) | 0.90 (0.12-6.71) | .663 | .915 | ||
| Infection | ||||||
| Patients with ≥1 grade ≥2 infection AE | ||||||
| n (%) | 47 (64) | 28 (62) | 51 (71) | 36 (72) | ||
| OR (95% CI) | — | — | 1.34 (0.67-2.71) | 1.56 (0.66-3.72) | .409 | .314 |
| No. of infection AEs, n (%) | ||||||
| 1 | 25 (34) | 17 (38) | 19 (26) | 14 (28) | ||
| 2 | 10 (14) | 4 (9) | 16 (22) | 8 (16) | ||
| 3 | 7 (10) | 3 (7) | 10 (14) | 8 (16) | ||
| 4+ | 5 (7) | 4 (9) | 6 (8) | 6 (12) | ||
| IRR (95% CI) | — | — | 1.06 (0.74-1.54) | 1.13 (0.68-1.88) | .740 | .631 |
| No. of grade ≥2 infection AEs within 60 d, n (%) | ||||||
| 1 | 31 (42) | 19 (42) | 21 (29) | 15 (30) | ||
| 2 | 7 (10) | 2 (4) | 14 (19) | 8 (16) | ||
| 3 | 5 (7) | 3 (7) | 11 (15) | 11 (22) | ||
| 4+ | 2 (3) | 2 (4) | 0 (0) | 0 (0) | ||
| IRR (95% CI) | — | — | 1.17 (0.82-1.67) | 1.34 (0.83-2.15) | .380 | .226 |
| Possibly TCZ-related infection AEs | ||||||
| n (%) | 12 (16) | 6 (13) | 9 (13) | 6 (12) | ||
| OR (95% CI) | 0.73 (0.28-1.85) | 0.89 (0.26-2.99) | .503 | .846 | ||
| CMV reactivation | ||||||
| n (%) | 17 (32) | 13 (43) | 11 (22) | 6 (16) | ||
| OR (95% CI) | 0.60 (0.25-1.45) | 0.25 (0.08-0.77) | .255 | .016 | ||
| Ganciclovir therapy | ||||||
| n (%) | 15 (28) | 12 (40) | 10 (20) | 6 (16) | ||
| OR (95% CI) | 0.63 (0.25-1.59) | 0.28 (0.09-0.88) | .330 | .030 | ||
AE, adverse event.
Chimerism results were very similar between the groups. For the entire cohort, 30 of 59 assessable patients (51%) in the placebo group achieved full donor T-cell chimerism at day 30, with donor CD3 T-cell chimerism ranging from 75% to 100%. By day 90, 37 of 55 surviving patients (67%) within the placebo group had achieved full donor T-cell chimerism. For the entire cohort, 32 of 60 assessable patients (53%) in the TCZ group achieved full donor T-cell chimerism at day 30 (donor CD3 chimerism: range, 58-100). By day 90, 37 of 53 surviving patients (70%) within the TCZ group had achieved full donor T-cell chimerism. At 12 months, 23 of 26 surviving placebo-treated patients (88%) in remission and 17 of 21 surviving TCZ-treated patients (81%) in remission were 100% donor chimeric with regard to whole blood leukocytes.
Toxicity and infectious events
No significant TCZ-related infusion reaction was noted. For the entire cohort, the incidence of grade 3 or greater liver adverse events was similar between the groups, occurring in 14% of placebo-treated patients vs 15% of TCZ-treated patients (odds ratio [OR], 1.14; 95% CI 0.45-2.88; P = .79) (Table 3). The incidence of liver adverse events within the VUD subgroup was similar, occurring in 13% of placebo-treated patients vs 18% of TCZ-treated patients (OR, 1.43; 95% CI, 0.46-4.41; P = .54). The total number of liver adverse events and the number within 60 days of BMT (ie, the period of potential TCZ exposure) were also similar between groups. Finally, the number of liver adverse events possibly related to TCZ was similar in both groups (Table 3). The incidence of infectious events was also similar between groups (Table 3). For the entire cohort, grade 2 or greater infection adverse events occurred in 64% of placebo-treated patients vs 71% of TCZ-treated patients (P = .41). The incidence of infectious adverse events within the VUD subgroup was also similar, occurring in 62% of placebo-treated patients vs 72% of TCZ-treated patients (P = .31). The total number of infection adverse events and the number occurring within 60 days of BMT were also similar between groups. Finally, the number of infectious adverse events possibly related to TCZ were not different between groups (Table 3). Interestingly, the rates of CMV reactivation were similar in the placebo and TCZ groups (32% vs 22%, respectively; P = .26; data on 103 [71%] patients) of the entire cohort but were lower in the VUD cohort treated with TCZ vs placebo (16% vs 43%, respectively; P = .016; available data on 68 [72%] patients). The decreases in CMV reactivation were associated with reduced ganciclovir therapy in TCZ-treated patients vs placebo-treated patients in the VUD subgroup (16% vs 40%, respectively; P = .030; data on 68 [72%] patients) (Table 3). In a subsequent extended analysis of all 95 VUD patients, this held true with 40% vs 20% reactivation in placebo-treated patients vs TCZ-treated patients, respectively (P = .03). We noted similar rates of non-CMV viral infections in the 2 groups: 24 patients in the placebo group (11 adenovirus, 6 BK virus, 4 human herpesvirus 6, 3 parainfluenza 3, 2 human metapneumovirus, and 1 each of norovirus, rotavirus, and rhinovirus) and 24 patients in the TCZ group (11 adenovirus, 5 BK virus, 4 rotavirus, 2 parainfluenza, 2 influenza, 1 herpes simplex virus 1, 1 respiratory syncytial virus, and 2 undefined upper respiratory tract infections). With regard to invasive fungal infections, there were 4 in the placebo group (1 proven, 2 probable, and 1 possible) and 7 in the TCZ group (4 proven, 2 probable, and 1 possible). Bacterial adverse events were noted in similar proportions of patients: 41 (56%) in placebo-treated patients vs 49 (68%) in TCZ-treated patients (P = .14). Of note, there were more bacteremia events in TCZ-treated patients (n = 61) vs placebo-treated patients (n = 32), with more gram-negative isolates (28 vs 10). In contrast, gram-positive cocci isolates were found in similar numbers in TCZ-treated patients vs placebo-treated patients (24 vs 22). There were 24 bacterial adverse events not associated with bacteremia (eg, cellulitis, urosepsis, pneumonia, diarrhea) in placebo-treated patients vs 16 in TCZ-treated patients.
Biological responses to IL-6R inhibition
Biological responses were evaluated as exploratory end points. Systemic IL-6 levels typically peaked between days 7 and 14 in placebo-treated patients and were significantly elevated over those at baseline (supplemental Figure 1, available on the Blood Web site). IL-6 levels in plasma were significantly elevated in the first 30 days after IL-6 receptor (IL-6R) inhibition but returned to baseline by day 60. Soluble IL-6R levels followed a similar pattern, increasing in patients receiving TCZ, before returning to baseline by day 60 (supplemental Figure 1). In contrast, gp130 levels in sera tended to increase in the first 2 months after BMT, independently of TCZ (supplemental Figure 1). We analyzed functional inhibition of IL-6 in vivo using a whole blood assay that quantifies STAT3 phosphorylation in PB CD4 T cells, CD8 T cells, and CD14 monocytes in response to relevant cytokine (IL-6, G-CSF, and IFN-α) stimulation. IL-6 signaling was specifically and completely blocked in CD4 T cells, CD8 T cells, and CD14 monocytes at days 21 and 30 (supplemental Figure 2A-B) but was fully restored by day 60 (supplemental Figure 2C), consistent with TCZ elimination beyond day 30. Blockade of IL-6 with TCZ did not modify T-cell numbers in PB at these time points (supplemental Figure 3A) or Th1 differentiation, as determined by T-bet expression (supplemental Figure 3B). A reduction in RORγt was seen in mucosal-associated invariant T cells in patients receiving TCZ, but this could not be demonstrated in other T-cell subsets in which RORγt expression was much lower (supplemental Figure 3C). Alterations in the proportions (supplemental Figure 4A) or numbers (supplemental Figure 4B) of T-cell subsets expressing IFN-γ and IL-17A after restimulation with PMA/ionomycin in vitro were not seen.
Discussion
This is the first randomized phase 3 double-blind study of IL-6 inhibition with TCZ in transplantation. We describe modest reductions in HRs (on the order of 30%) for grade 2-4 aGVHD that were most apparent in VUD cohorts but did not reach statistical significance. Similarly, day-180 grade 2-4 aGVHD-free survival was improved by 16% in the unrelated donor cohort, which did not reach significance. Disappointingly, reductions in aGVHD after TCZ administration were predominantly in moderate grade 2 disease rather than in the most clinically important severe (grade 3/4) disease. The effect sizes seen were smaller than those expected from single-arm phase 1/2 studies, whereas lower rates of aGVHD in the placebo cohort than expected (36% compared with predicted rates of 50% to 55%) also compromised study power. For these reasons, the effects of TCZ on aGVHD were clearer in the recipients from unrelated donors. Importantly, any effects on aGVHD did not translate to improvements in longer-term outcomes, with largely identical OS and PFS.
Potential differences between this study and previous early-phase studies7,18 relate to the multicenter nature and randomization/blinding of the current study, together with subtle differences in eligibility criteria. This study required only 8/8 HLA matching for unrelated donors (rather than 10/10 in previous studies), and patients were recruited up to 70 years of age (rather than up to 65 years of age in ≥1 prior study7 ). The transplant-eligible underlying diseases were more restricted in the current study (to myelodysplastic syndrome/CMML and acute leukemia) and excluded myeloproliferative disease and lymphoma, which had been included previously. In both of these prior studies, the incidence of aGVHD grade 2-4 at days 100 and 180 was <20%. The day-180 aGVHD-free survival of 69% in the Drobyski et al study18 was similar to the 71% seen here, but the control groups also fared better in this randomized study (60% vs 42%). We have not analyzed the effects of TCZ on cGVHD in detail, because this will require longer follow-up, but preliminary data did not suggest significant effects, consistent with previous phase 2 studies.7,18
The single dose of TCZ prior to BMT was well tolerated without infusion reactions. The median day of neutrophil engraftment in TCZ-treated patients (day 18) was similar to that seen in the phase 1/2 studies (days 16-18), but it was 2 to 3 days slower than that seen in the randomized placebo group. The median day to platelet count recovery (day 19) in recipients of TCZ was also similar to previous studies (days 17-18), but again it was 2 to 3 days slower than in the placebo group. These differences did not impact TRM and likely reflect the fact that hematopoietic stem cells respond to IL-6, although they lose this capacity during granulocyte maturation.21 There was no difference in liver toxicity (hyperbilirubinemia or transaminitis), and the incidence of grade 2 or higher infectious events was similar. When considering pathogen subtypes, we did note more gram-negative bacteremias, but less CMV reactivation, in TCZ-treated patients (the latter only in the VUD subgroups). Given the incidence of gram-negative bacteremia, in the future, appropriate antibiotic prophylaxis and G-CSF support might be considered in the neutropenic period in these patients.
At this point, it is unclear whether this apparent lower rate of CMV reactivation reflects lower rates of aGVHD and steroid use. Alternatively, IL-6 has been shown to promote CMV replication directly, and it drives Tc17 differentiation,12 and these CD8 T cells are noncytolytic, likely conferring impaired antiviral function. Thus, this apparent impact of IL-6 on CMV reactivation after BMT is interesting and is being explored in additional mechanistic studies.
IL-6 has been demonstrated to be a major pathogenic cytokine in aGVHD in multiple preclinical studies, and systemic IL-6 dysregulation after clinical BMT follows a very similar pattern to that in mice,6,7,18 with induction dependent on conditioning intensity (particularly myeloablative TBI) and allogeneic disparity. We again demonstrated the previously noted increase in systemic IL-6 between days 7 and 14 in placebo-treated patients in this study and increases in IL-6 for 30 days after BMT in TCZ-treated patients, consistent with complete blockade of IL-6R and the inhibition of receptor-mediated clearance over this time.7 Similarly, systemic levels of soluble IL-6R, which is bound in the circulation by TCZ (and, thus, is unable to undergo renal clearance) are increased for the first 30 days after BMT, and the levels of IL-6 and soluble IL-6R return to normal by day 60, as previously described.7 In contrast, soluble gp130 levels increase after transplant, independent of TCZ. We confirmed the functional blockade of IL-6R by TCZ in the first month after BMT, as determined by inhibition of STAT3 phosphorylation in response to IL-6 in PB T cells and monocytes. Responses to IL-6 returned to normal by day 60 after BMT, consistent with the elimination of the monoclonal antibody between days 30 and 60.7
The mechanism by which IL-6 invokes GVHD in preclinical systems has been shown to be primarily via STAT3 phosphorylation and subsequent RORγt-dependent Th17 and Th22 cell differentiation,8 together with regulatory T-cell expansion within tissue.9,22 With the exception of mucosal-associated invariant T cells, we were unable to see clear differences in Th17 cell differentiation in patients receiving TCZ; this may reflect inadequate sensitivity of the flow cytometry analyses used and/or the confounding impact of pharmacological immune suppression. More sensitive single-cell RNA-sequencing approaches are in progress to examine this in more detail. Importantly, the inability of IL-6 inhibition to prevent severe grade 3/4 aGVHD may reflect the relative inability of TCZ to inhibit Th1 cell differentiation8 (an IL-12–dominant differentiation pattern23 ), which is likely dominant in severe aGVHD.
In conclusion, in this phase 3 double-blind randomized study, we demonstrated that TCZ, administered as a single dose at day −1, inhibited IL-6 for the first month after BMT and was associated with trends toward reductions in grade 2-4 GVHD and improvements in GVHD-FS. Although these did not reach statistical significance, and we failed to observe improvements in long-term survival, the sample size in this trial may have impeded detection of a significant benefit, because the effect size in GVHD-FS was 10% to 20%. A follow-up would require >150 patients per arm to confirm an improvement in day-180 GVHD-FS with 80% power and a 2-sided significance of 0.05. However, the fact that we did not see any reductions in the incidence of severe aGVHD suggests that alternative strategies should be prioritized to prevent aGVHD in the future.
Data sharing requests should be sent to Geoffrey R. Hill (grhill@fredhutch.org).
The online version of this article contains a data supplement.
The publication costs of this article were defrayed in part by page charge payment. Therefore, and solely to indicate this fact, this article is hereby marked “advertisement” in accordance with 18 USC section 1734.
Acknowledgments
This study was supported by the National Health and Medical Research Council (NHMRC) Centre for Blood Transplant and Cell Therapy. The clinical study was supported, in part, by Roche Pharmaceuticals but was an investigator-initiated trial. G.R.H. was a recipient of an NHMRC Australia Fellowship and a QLD Health Senior Research Fellowship. Melbourne EpiCentre gratefully acknowledges support from the NHMRC and the Australian government’s National Collaborative Research Infrastructure Strategy initiative through Therapeutic Innovation Australia.
Roche was not involved in reporting or interpretation of study data.
Authorship
Contribution: G.R.H., G.A.K., and S.K.P. designed the study and wrote the manuscript; L.B. extracted data; L.B. and S.K.P. compiled all clinical data and conducted statistical analyses; S.D.O. and A.V. generated immune data; A.V., S.D.O., K.H.G., and K.C. analyzed immune data; G.A.K., S.-K.T., C.C., J.P.B., A.M., E.S., A.J.M., S.D., A.S.H., J.M., D.R., D.G., J.C., and G.R.H. enrolled patients and provided patient care; and all authors contributed to the finalization of the manuscript.
Conflict-of-interest disclosure: S.K.P. has acted as a consultant and/or speaker for GI Dynamics, Roche, AstraZeneca, Sanofi, and Amylin Pharmaceuticals LLC and has received research grants from Merck, Novo Nordisk, AstraZeneca, Hospira, Amylin Pharmaceuticals, Sanofi-Aventis, and Pfizer. G.R.H. has acted as a consultant for Generon Corporation and NapaJen Pharma and has received research funding from Compass Therapeutics, Syndax Pharmaceuticals, Applied Molecular Transport, and iTeos Therapeutics. The remaining authors declare no competing financial interests.
The current affiliation for G.R.H. is Fred Hutchinson Cancer Research Center, Seattle, WA.
Correspondence: Geoffrey R. Hill, Fred Hutchinson Cancer Research Center, 1100 Fairview Ave N, Seattle, WA 98109; e-mail: grhill@fredhutch.org.

This feature is available to Subscribers Only
Sign In or Create an Account Close Modal