

Key Points
Conditional expression of HGAL in mice leads to lymphoma that resembles human GC B-type DLBCL.
Irrespective of the differential stage at which HGAL is expressed, it leads to a block in B-cell differentiation at the GC reaction.

Abstract
Diffuse large B-cell lymphomas (DLBCLs) are clinically and genetically heterogeneous tumors. Deregulation of diverse biological processes specific to B cells, such as B-cell receptor (BCR) signaling and motility regulation, contribute to lymphomagenesis. Human germinal center associated lymphoma (HGAL) is a B-cell–specific adaptor protein controlling BCR signaling and B lymphocyte motility. In normal B cells, it is expressed in germinal center (GC) B lymphocytes and promptly downregulated upon further differentiation. The majority of DLBCL tumors, primarily GC B-cell types, but also activated types, express HGAL. To investigate the consequences of constitutive expression of HGAL in vivo, we generated mice that conditionally express human HGAL at different stages of hematopoietic development using 3 restricted Cre-mediated approaches to initiate expression of HGAL in hematopoietic stem cells, pro-B cells, or GC B cells. Following immune stimulation, we observed larger GCs in mice in which HGAL expression was initiated in GC B cells. All 3 mouse strains developed DLBCL at a frequency of 12% to 30% starting at age 13 months, leading to shorter survival. Immunohistochemical studies showed that all analyzed tumors were of the GC B-cell type. Exon sequencing revealed mutations reported in human DLBCL. Our data demonstrate that constitutive enforced expression of HGAL leads to DLBCL development.
Introduction
Diffuse large B-cell lymphomas (DLBCLs), the most common form of non-Hodgkin lymphoma, are phenotypically and genetically heterogeneous. Although DLBCLs are curable with a standard combination therapy regimen of rituximab, cyclophosphamide, doxorubicin, vincristine, and prednisone in 50% to 70% of patients, the remaining patients with primary refractory or relapsed disease usually succumb to this malignancy.1 Elucidating the biology of DLBCLs is essential for developing better therapeutic approaches to improve DLBCL patient survival.
Marked advances in the understanding of DLBCL pathobiology have been made by the application of gene expression arrays, comparative genomic hybridization arrays, and next-generation sequencing.2-6 Gene expression profiling (GEP) studies led to the cell-of-origin classification identifying germinal center (GC) B-cell (GCB) type and activated B-cell (ABC) type DLBCL.2 They showed that DLBCLs can adapt regulatory biological features of normal B cells from which they originate in malignant states. Therefore, the biological functions of normal B-cell differentiation can be reprogrammed during transformation and propagation of DLBCLs.
High-throughput sequencing and copy number alteration studies identified an increasing number of driver genes deregula-ting diverse biological functions that lead or contribute to lymphomagenesis.7,8 Pathways affected by these genetic aberrations include those specific to B-cell lymphomas (eg, B-cell differentiation, B-cell receptor [BCR] signaling, and GCB motility regulation), as well as those contributing to the development of all types of cancers (eg, regulation of proliferation and apoptosis).9,10 Some of these genetic aberrations predominantly or exclusively occur in only 1 of the GEP-defined DLBCL subtype, whereas other genetic aberrations occur in >1 subtype. Aberrations involving components of the BCR signaling pathway that lead to chronic active signaling (eg, mutations in CD79B, CD79A, CARD11, MYD88, and amplification of MALT1) are predominantly or almost exclusively detected in the ABC type. In mice, B-cell–specific conditional expression of Myd88L252P led to ABC-type DLBCL,11 whereas conditional expression of the human DLBCL-derived CARD11L225LI mutant led to high-grade lymphoma.12 In contrast, mutations in genes controlling GC B lymphocyte migration and confinement (eg, loss-of-function mutations in SIRP2, GNA13, ARHGEF1, and P2RY8 genes) are almost exclusively reported in the GCB type, and this type of DLBCL was observed in Gna13-deficient mice.13,14
Human germinal center associated lymphoma (HGAL; also known as germinal center-expressed transcript 2 or germinal center-associated signaling and motility) is an adaptor protein that controls GC B lymphocyte motility.15,16 The HGAL gene encodes a 178-aa protein with 51% identity and 62% similarity to murine GC-specific protein M17.15 Studies in M17-knockout mice revealed that this protein is dispensable for GC formation, class-switch recombination, immunoglobulin somatic hypermutation, and mounting of T-cell–dependent antibody responses.17 We have shown that HGAL regulates spontaneous and cytokine-induced cell motility. A decrease in cell motility mediated by HGAL is achieved by (1) direct and independent binding of HGAL to cellular actin and myosin II proteins, increasing the binding of myosin to F-actin and inhibiting the ability of myosin to translocate F-actin16,18 and by (2) direct HGAL interaction with the RhoA-specific guanine nucleotide exchange factors PDZ-RhoGEF and LARG, stimulating the guanosine diphosphate–guanosine triphosphate exchange rate.19 The latter activates RhoA and its downstream effectors, further contributing to inhibition of cell motility. HGAL also regulates chronic active and tonic BCR signaling by binding to and enhancing Syk kinase activity.20-22 Further, by interaction with Grb2, HGAL controls the dynamics and architecture of BCR synapse formation.20 Although HGAL is not altered by genetic aberrations, it is expressed in 60% of DLBCLs, including 90% of the GCB type and 53% of the non-GCB type.23 We have demonstrated that HGAL expression in DLBCL is associated with improved survival,15,23-25 independent of GEP-defined subtype. Because HGAL regulates 2 critical biological processes implicated in DLBCL pathogenesis (BCR signaling and B lymphocyte migration and confinement) and is constitutively expressed in a large number of DLBCL tumors, we hypothesized that HGAL may contribute to DLBCL pathogenesis. Herein, we report that mouse models expressing HGAL in a conditional fashion develop DLBCL.
Methods
Generation of mouse strains
All animal work was conducted in accordance with national and international guidelines on animal care and was approved by the Bioethics Committee of University of Salamanca and by the Bioethics Subcommittee of Consejo Superior de Investigaciones Cientificas. The Rosa26-HGAL vector was generated as follows: the human HGAL complementary DNA (cDNA) clone was subcloned into the Rosa26UA plasmid using AscI site. This plasmid contained the LoxP-pgk-Neo-tPA-LoxP-AscI-FheI-internal ribosome entry site (IRES)-eGFP within the Rosa26 homology arms, and the final targeting construct contained LoxP-pgk-Neo-tPA-LoxP-HGAL-IRES-eGFP.
The G4 mouse embryonic stem cell line,26 a generous gift of Andras Nagy and Marina Gertsenstein, was used to modify the Rosa26 locus by homologous recombination at the Servicio de Transgénesis Centro Nacional de Biotecnología–Centro de Biología Molecular Severo Ochoa (CNB-CBMSO) Consejo Superior de Investigaciones Científicas–Universidad Autónoma de Madrid (CSIC-UAM)/Consejo Superior de Investigaciones Cientificas (Madrid, Spain), where chimeric mice were also generated. Heterozygous Rosa26-HGAL animals were obtained after mating chimera with C57BL/6J females. Rosa26-HGAL mice were bred to Sca1-Cre mice,27 Mb1-Cre mice,28 or Aid-Cre mice29 to generate Rosa26-HGAL/Sca1-Cre, Rosa26-HGAL/Mb1-Cre, or Rosa26-HGAL/Aid-Cre mice, respectively. Upon clinical manifestations of disease, mice were euthanized and subjected to standard necropsy procedures. All major organs were examined under the dissecting microscope. Tissue samples were taken from homogenous portions of the resected organ and fixed immediately after excision. All transgenic animals were euthanized at 24 months of age. Differences in survival between transgenic and control wild-type (WT) mice were analyzed via Kaplan-Meier survival curves using the log-rank (Mantel-Cox) test.
Immunohistochemistry
Immunohistochemistry (IHC) was performed as previously described.22 Briefly, transgenic mice samples were sectioned, dewaxed, and subjected to IHC using the following primary antibodies and conditions: anti-human HGAL (clone MRQ-49; Cell Marque, Rocklin, CA), anti-human PAX5 (clone 24/PAX5, dilution 1:100; BD Biosciences, San Jose, CA), B220 (clone RA3-6B2, dilution 1:50; Santa Cruz Biotechnology, Santa Cruz, CA), biotinylated peanut agglutinin (PNA), dilution 1:1000; VECTOR Laboratories, Burlingame, CA), IRF4 (clone M-17, dilution 1:60; Santa Cruz Biotechnology), BCL6 (clone D-8, dilution 1:5; Santa Cruz Biotechnology), and CD3 (clone SP7, dilution 1:50; Abcam, Cambridge, MA). The anti-HGAL antibody does not cross-react with M17 in IHC staining. Staining kits from VECTOR Laboratories and Santa Cruz Biotechnology were used for IHC and detection of mouse antibodies, whereas an automated immunostainer was used for anti-human antibodies (Ventana XT; Ventana Medical Systems, Tucson, AZ). Samples were diagnosed using uniform criteria based on clinical, histological, immunophenotypical, and molecular characteristics. For comparative studies, age-matched mice were used.
Gene expression microarray analysis of murine tumors
Tumor-bearing spleens were harvested from transgenic mice, and healthy spleens were harvested from control mice; cells were not sorted prior to RNA extraction for this analysis. Total RNA was isolated in 2 steps using TRIzol Reagent (Life Technologies), followed by RNeasy Mini Kit (QIAGEN) purification following the manufacturer’s RNA Clean-up protocol with the optional On-column DNase treatment. The integrity and the quality of the RNA were verified by electrophoresis, and its concentration was measured. Samples were analyzed using Affymetrix Mouse Genome 430 2.0 arrays. Briefly, the robust microarray analysis algorithm was used for background correction, intra- and inter-microarray normalization, and expression signal calculation.30-32 Once the absolute expression signal for each gene (ie, the signal value for each probe set) was calculated in each microarray, significance analysis of microarray33 method was used to calculate significant differential expression and to find gene probe sets that characterized the B-cell lymphomas from transgenic mice compared with normal spleen from WT mice. A cutoff false discovery rate (FDR) <0.05 was used for the differential expression calculations.34 All analyses were performed using R35 and Bioconductor.36 Raw array microarray data files were submitted to the Gene Expression Omnibus database37 under accession number GSE142368.
Gene set enrichment analyses (GSEAs) were performed using GSEA v2.2.238,39 and hallmark collection of gene sets.40 Gene expression signatures that are specifically upregulated or downregulated in human DLBCL41 and gene sets of B-cell identity42 were also tested for enrichment within tumor specimens using GSEA.
Western blot
For western blotting, 20 μg of whole-cell lysates was separated using 12% sodium dodecyl sulfate polyacrylamide gel electrophoresis, transferred to polyvinylidene difluoride membranes (Bio-Rad Laboratories, Hercules, CA), blocked with 5% nonfat milk in phosphate-buffered saline with 0.1% Tween 20 for 1 hour, and immunoblotted with the specified primary antibodies for 1 hour at room temperature or at 4°C overnight. The membranes were washed 3 times in phosphate-buffered saline with 0.1% Tween 20 for 5 minutes and then immunoblotted with appropriate secondary antibodies conjugated with horseradish peroxidase and visualized by SuperSignal Western Pico Chemiluminescent Substrate or SuperSignal Western Femto chemiluminescent substrate (Pierce Biotech, Rockford, IL). The following primary antibodies were used: HGAL23 (1:1000 dilution), BCL6 (clone D-8, dilution 1:5; Santa Cruz Biotechnology), and actin (I-19; sc-1616; Santa Cruz Biotechnology) (1:7500 dilution). The secondary antibodies were Goat Anti-Mouse IgG (H+L)-HRP Conjugate (170-6516; Bio-Rad) (1:5000 dilution) and Donkey Anti-Goat IgG HRP (sc-2033; Santa Cruz Biotechnology) (1:7500 dilution).
Immunoglobulin rearrangements
Immunoglobulin rearrangements were amplified by polymerase chain reaction (PCR) using the primers shown in supplemental Methods (available on the Blood Web site). Cycling conditions consisted of initial heat activation at 95°C, followed by 31 to 37 cycles of denaturation for 1 minute at 95°C, annealing for 1 minute at 65°C, and elongation for 1 minute and 45 seconds at 72°C. This was followed by a final elongation for 10 minutes at 72°C. The primers used to determine the DNA sequences of individual V(D)J rearrangements by PCR are listed in supplemental Table 1. The PCR fragments were isolated from the agarose gel and cloned into the pGEM-T Easy Vector System(Promega); the DNA inserts of ≥2 clones corresponding to the same PCR fragment were sequenced with T3 and T7 primers.
Statistical analysis
Differences in survival between transgenic and control WT mice were analyzed using the log-rank (Mantel-Cox) test. Values of P < .05 were considered statistically significant. Statistical analysis was performed and data representation was created using GraphPad Prism 5.00 software (La Jolla, CA).
Sequence analysis
Briefly, raw fastq files for tumor and normal samples were aligned to the mouse reference genome (version GRCm38) using BWA-kit version 0.7.12 with default parameters. Deduplication and realignment around indels was performed using MarkDuplicates and IndelRealigner in GATK v4.0.4.0. Single nucleotide variants, indels, and their potential functional impact were called using Manta v1.4.0 and Strelka v2.9.4 with default parameters. Varscan version 2.4.3 was used to generate copy number calls using mpileup files generated from the BAM files with samtools. Regions of copy number change were determined using the CAN, smooth.CNA, and segment functions of the DNAcopy package v1.46 in R. Significant recurrent copy number variants across samples were evaluated using GISTIC2.0. The occurrence of mutations within AID motifs (WRCY or RGYW) was determined as described by Sander et al.43
Results
Generation of a targeted mouse line conditionally expressing HGAL
HGAL is primarily expressed in GC lymphocytes; however, animal studies have also shown its expression in multipotent progenitor cells, granulocyte/macrophage/lymphoid cells, and common lymphoid progenitors (supplemental Figure 1).44 In our previous studies, we demonstrated that HGAL enhances BCR signaling and decreases lymphocyte motility, likely constraining GC lymphocytes to the GC microenvironment.16,19,21,22 Because these effects of HGAL may predispose to lymphomagenesis and deregulate immune function, we developed mouse models expressing HGAL in a conditional fashion in hematopoietic stem cells (HSCs), peripheral blood B cells, and GC B cells (CGBs) (Figure 1). To this end, an HGAL cDNA linked via an IRES to a sequence encoding an enhanced green fluorescent protein (eGFP) was targeted to the ubiquitously expressed Rosa26 locus. To prevent transcription of HGAL and eGFP from the Rosa26 promoter, a neomycin resistance cassette and polyadenylation STOP signal flanked by loxP sites were inserted between the promoter and the HGAL-IRES-eGFP sequences (Figure 1A). In the absence of Cre, the HGAL gene product and eGFP are not expressed. Mouse embryonic stem cells harboring the targeted allele (Figure 1B) were injected into blastocysts to generate chimeras that were bred to generate progeny with a germline-transmissible conditional allele of HGAL (designated Rosa26HGAL) (Figure 1). Temporal, spatial, and tissue-specific control of Cre expression was achieved through the use of specific promoters. To express HGAL specifically in GC lymphocytes and to evaluate its unique role in these cells compared with B cells at other differentiation stages, we bred mice bearing the Rosa26HGAL allele to mice bearing Aid-Cre to initiate expression of HGAL in GC cells.29 To investigate the potential effects of HGAL at an early stage of hematopoietic differentiation, we crossed Rosa26HGAL mice with Sca1-Cre mice27 (an experimental approach to initiate expression of HGAL in HSCs and explore whether HGAL may contribute to lymphomagenesis at a stage of development prior to B-cell commitment) or Mb1-Cre mice28 (an experimental approach to initiate expression of HGAL in B-lineage cells beginning at the early pro-B cell stage and study whether HGAL may contribute to lymphomagenesis at a stage of development prior to B cells reaching full maturity). Upon Cre-mediated excision of the Neo-STOP cassette, the CAG promoter drives the production of HGAL and eGFP. Using a flow cytometric analysis of the coexpressed eGFP marker, eGFP expression is not detected in any hematopoietic cell in the peripheral blood of Rosa26HGAL mice or Rosa26HGAL/Aid-Cre mice (Figure 2A; supplemental Figure 2A). This was expected because induction of HGAL and GFP expression in Aid-Cre mice requires initiation of an immune response and GC formation (Figure 2B). However, Rosa26HGAL/Mb1-Cre mice show B-cell–specific expression of GFP in peripheral blood cells (Figure 2A), and Rosa26HGAL/Sca1-Cre mice express GFP in all hematopoietic cells (Figure 2A; supplemental Figure 2A-B).

Conditional expression of the HGAL oncogene. (A) Schematic diagram showing the HGAL cDNA cloned into a vector designed for targeting into the mouse Rosa26 locus. Cre-mediated recombination excises the STOP sequence and initiates expression of the fusion oncogene and eGFP. To prevent transcription of the fusion gene and eGFP from the Rosa26 promoter, a neomycin resistance cassette and polyadenylation STOP signal flanked by loxP sites were inserted between the promoter and the HGAL-IRES-eGFP sequence. In the absence of Cre, HGAL and eGFP are not expressed, due to a STOP cassette in front of HGAL that must be removed by Cre recombinase action to allow for their expression. Neo, neomycin resistance cassette; pA, polyadenylation STOP sequence. (B) Mouse embryonic stem (ES) cells confirmed to harbor the targeted allele were injected into blastocysts to generate chimeras that were then bred to generate progeny with a germline-transmissible conditional allele of HGAL (designated Rosa26HGAL). Identification of Rosa26HGAL mice by Southern blot analysis of tail snip DNA after EcoRI digestion is shown. DT, refers to the SA-PGK-neo-LacZ(DTA)-bpA fragment inserted into Rosa26 genomic locus; ex1, exon1; ex2, exon2; ex3, exon 3; frt, frt site of the FLP/FRT site-specific recombination system.
Conditional expression of the HGAL oncogene. (A) Schematic diagram showing the HGAL cDNA cloned into a vector designed for targeting into the mouse Rosa26 locus. Cre-mediated recombination excises the STOP sequence and initiates expression of the fusion oncogene and eGFP. To prevent transcription of the fusion gene and eGFP from the Rosa26 promoter, a neomycin resistance cassette and polyadenylation STOP signal flanked by loxP sites were inserted between the promoter and the HGAL-IRES-eGFP sequence. In the absence of Cre, HGAL and eGFP are not expressed, due to a STOP cassette in front of HGAL that must be removed by Cre recombinase action to allow for their expression. Neo, neomycin resistance cassette; pA, polyadenylation STOP sequence. (B) Mouse embryonic stem (ES) cells confirmed to harbor the targeted allele were injected into blastocysts to generate chimeras that were then bred to generate progeny with a germline-transmissible conditional allele of HGAL (designated Rosa26HGAL). Identification of Rosa26HGAL mice by Southern blot analysis of tail snip DNA after EcoRI digestion is shown. DT, refers to the SA-PGK-neo-LacZ(DTA)-bpA fragment inserted into Rosa26 genomic locus; ex1, exon1; ex2, exon2; ex3, exon 3; frt, frt site of the FLP/FRT site-specific recombination system.
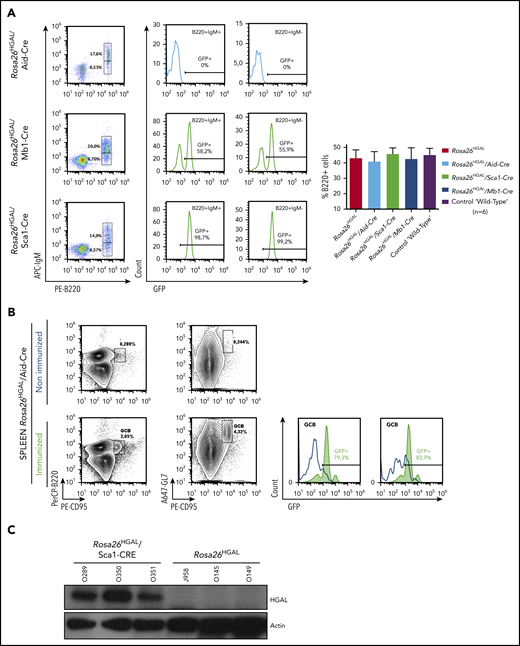
GFP and HGAL expression in Rosa26HGAL mice. (A) Fluorescence-activated cell sorting analysis of GFP (HGAL) expression in peripheral blood B-cell populations in nonimmunized Rosa26HGAL/Aid-Cre mice (n = 6), Rosa26HGAL/Mb1-Cre mice (n = 6), and Rosa26HGAL/Sca1-Cre mice (n = 6) (left panels). GFP expression in B220+IgM+ and B220+IgM− B cells (middle panels). Bar graph showing the percentages of B220+ lymphocytes in peripheral blood from Rosa26HGAL, Rosa26HGAL/Aid-Cre, Rosa26HGAL/Sca1-Cre, Rosa26HGAL/Mb1-Cre, and control WT mice (n = 6 each) (right panel). There were no statistically significant differences among the animals. (B) GFP expression in the spleen of Rosa26HGAL/Aid-Cre mice before and after immunization (left panels). Expression of HGAL and GFP in Aid-Cre mice requires initiation of an immune response and GC formation. Graphs show GFP expression in GCB cells before and after immunization (right panels). (C) Western blot analysis using extracts from Rosa26HGAL/Sca1-Cre (n = 3) and Rosa26HGAL (n = 3) splenic B cells and the indicated antibodies.
GFP and HGAL expression in Rosa26HGAL mice. (A) Fluorescence-activated cell sorting analysis of GFP (HGAL) expression in peripheral blood B-cell populations in nonimmunized Rosa26HGAL/Aid-Cre mice (n = 6), Rosa26HGAL/Mb1-Cre mice (n = 6), and Rosa26HGAL/Sca1-Cre mice (n = 6) (left panels). GFP expression in B220+IgM+ and B220+IgM− B cells (middle panels). Bar graph showing the percentages of B220+ lymphocytes in peripheral blood from Rosa26HGAL, Rosa26HGAL/Aid-Cre, Rosa26HGAL/Sca1-Cre, Rosa26HGAL/Mb1-Cre, and control WT mice (n = 6 each) (right panel). There were no statistically significant differences among the animals. (B) GFP expression in the spleen of Rosa26HGAL/Aid-Cre mice before and after immunization (left panels). Expression of HGAL and GFP in Aid-Cre mice requires initiation of an immune response and GC formation. Graphs show GFP expression in GCB cells before and after immunization (right panels). (C) Western blot analysis using extracts from Rosa26HGAL/Sca1-Cre (n = 3) and Rosa26HGAL (n = 3) splenic B cells and the indicated antibodies.
All animals were viable, and no in utero deaths were observed. In comparison with age-matched controls, HGAL gain-of-function mice did not show any visible changes within the major hematopoietic compartments (bone marrow, spleen, thymus, peripheral blood, and lymph nodes) by flow cytometry and histological examination. The animals had normal development and morphology of lymphoid organs and maturation of B and T lymphocytes, myeloid cells, and erythroid cells (supplemental Figure 2C). We confirmed HGAL protein expression in the B cells from these animals by western blotting (shown for Rosa26HGAL/Sca1-Cre mice in Figure 2C). HGAL expression was not detected in mature myeloid, monocyte, or T-cell lineages or in the WT controls.
To elucidate the role of HGAL in GC responses, we immunized Rosa26HGAL/Aid-Cre mice, Rosa26HGAL/Sca1-Cre mice, and Rosa26HGAL/Mb1-Cre mice (n = 6 each) with sheep red blood cells (SRBCs) that initiate a GC response. Flow cytometry analysis at day 10 after immunization showed a significantly increased number of splenic GC lymphocytes in Rosa26HGAL/Aid-Cre mice compared with Rosa26HGAL/Sca1-Cre mice, Rosa26HGAL/Mb1-Cre mice, and WT control mice (Figure 3; supplemental Table 2). HGAL expression in the GC lymphocytes was confirmed by IHC (Figure 4A). Immunohistochemical analysis using PNA (a GCB marker) revealed an increase in the number and size of GCs in Rosa26HGAL/Aid-Cre mice compared with WT control mice, whereas there was no significant change in GCs in Rosa26HGAL/Sca1-Cre mice or Rosa26HGAL/Mb1-Cre mice (Figure 4B).
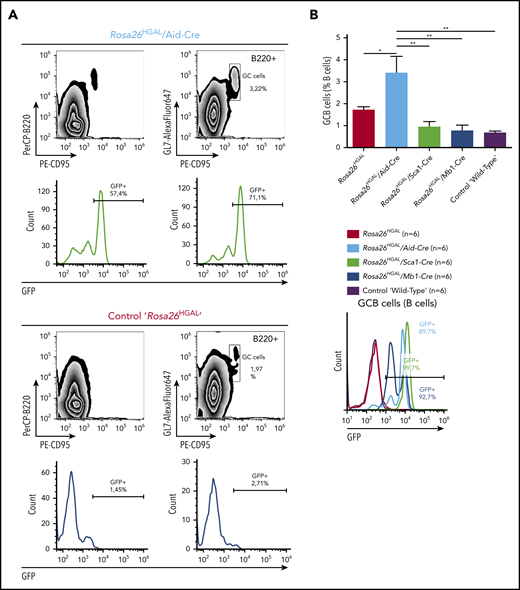
Quantification of GC lymphocytes at day 10 after immunization with SRBCs. (A) Representative fluorescence-activated cell sorting analysis of splenic lymphocytes stained for CD95 and GL7 from a representative Rosa26HGAL/Aid-Cre mouse (upper panels) and a control Rosa26HGAL mouse (lower panels). (B) Bar graph showing the percentage of GC lymphocytes in the gated B220+ population from Rosa26HGAL mice, Rosa26HGAL/Aid-Cre mice, Rosa26HGAL/Mb1-Cre mice, Rosa26HGAL/Sca1-Cre mice, and control WT mice (n = 6 each) (left panel). Line graph showing GFP intensity in GC lymphocytes in each genotype (right panel). *P < .05; **P < .01, Bonferroni multiple-comparison test (1-way analysis of variance).
Quantification of GC lymphocytes at day 10 after immunization with SRBCs. (A) Representative fluorescence-activated cell sorting analysis of splenic lymphocytes stained for CD95 and GL7 from a representative Rosa26HGAL/Aid-Cre mouse (upper panels) and a control Rosa26HGAL mouse (lower panels). (B) Bar graph showing the percentage of GC lymphocytes in the gated B220+ population from Rosa26HGAL mice, Rosa26HGAL/Aid-Cre mice, Rosa26HGAL/Mb1-Cre mice, Rosa26HGAL/Sca1-Cre mice, and control WT mice (n = 6 each) (left panel). Line graph showing GFP intensity in GC lymphocytes in each genotype (right panel). *P < .05; **P < .01, Bonferroni multiple-comparison test (1-way analysis of variance).
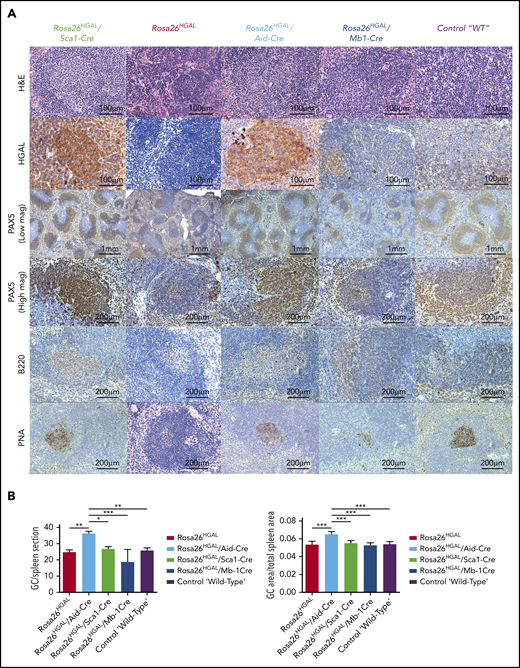
Immunohistochemical analysis of spleens at day 10 after immunization with SRBCs. (A) Representative hematoxylin and eosin (H&E), HGAL, PAX5, B220, and PNA staining of serial sections of spleens from Rosa26HGAL/Aid-Cre, Rosa26HGAL/Sca1-Cre, Rosa26HGAL, Rosa26HGAL/Mb1-Cre, and WT mice. HGAL is strongly expressed in the GC lymphocytes of Rosa26HGAL/Aid-Cre and Rosa26HGAL/Sca1-Cre animals, with weaker expression in Rosa26HGAL/Mb1-Cre animals because of the smaller size of GCs. (B) Quantification of the number (left panel) and area (right panel) of PNA-stained GC centers in Rosa26HGAL/Aid-Cre, Rosa26HGAL/Sca1-Cre, Rosa26HGAL, Rosa26HGAL/Mb1-Cre, and wild type-mice (n = 6 each). Data are mean ± standard deviation. *P < .05; **P < .01; ***P < .001, Bonferroni multiple-comparison test (1-way analysis of variance).
Immunohistochemical analysis of spleens at day 10 after immunization with SRBCs. (A) Representative hematoxylin and eosin (H&E), HGAL, PAX5, B220, and PNA staining of serial sections of spleens from Rosa26HGAL/Aid-Cre, Rosa26HGAL/Sca1-Cre, Rosa26HGAL, Rosa26HGAL/Mb1-Cre, and WT mice. HGAL is strongly expressed in the GC lymphocytes of Rosa26HGAL/Aid-Cre and Rosa26HGAL/Sca1-Cre animals, with weaker expression in Rosa26HGAL/Mb1-Cre animals because of the smaller size of GCs. (B) Quantification of the number (left panel) and area (right panel) of PNA-stained GC centers in Rosa26HGAL/Aid-Cre, Rosa26HGAL/Sca1-Cre, Rosa26HGAL, Rosa26HGAL/Mb1-Cre, and wild type-mice (n = 6 each). Data are mean ± standard deviation. *P < .05; **P < .01; ***P < .001, Bonferroni multiple-comparison test (1-way analysis of variance).
HGAL gain-of-function mice develop B-cell lymphomas
Rosa26HGAL/Sca1-Cre mice (n = 27), Rosa26HGAL/Mb1-Cre mice (n = 25), and Rosa26HGAL/Aid-Cre mice (n = 11) were analyzed for long-term survival and lymphoma development. HGAL gain-of-function mice had statistically significantly shorter overall survival compared with WT controls (Figure 5A). Eight Rosa26HGAL/Sca1-Cre (30%) mice, 3 Rosa26HGAL/Mb1-Cre (12%) mice, and 2 Rosa26HGAL/Aid-Cre (18%) mice developed lymphoma starting at the age of 13 months (Figure 5B) and exhibited statistically significant shorter overall survival. Lymphoma-specific survival was significantly shorter in Rosa26HGAL/Sca1-Cre mice compared with WT animals (P = .0088), but it was not different in other mouse strains, likely because of the small number of animals with lymphoma. Macroscopic examination of these animals revealed splenomegaly caused by large tumors in all animals, irrespective of the promoter controlling HGAL expression. In addition, lymphoma tumors were detected in the liver and lymph nodes of Rosa26HGAL/Sca1-Cre mice, in the kidney and pancreas in Rosa26HGAL/Mb1-Cre mice, and in the kidney and liver in Rosa26HGAL/Aid-Cre mice (supplemental Figures 3-5). Histologically, the tumors exhibited nodular and diffuse infiltration of the involved organs by large pleomorphic lymphoid cells that stained positive for B220, PAX5, HGAL, PNA, and IRF4, but lacked BCL6 and CD3 staining, consistent with large B-cell lymphomas of GCB cell origin (PNA+) (Figure 5C; supplemental Figure 6). There are human GCB DLBCL tumors that express HGAL and CD10 without BCL6 expression.45 Therefore, HGAL and BCL6 coexpression is not observed in all GCB DLBCL tumors. By RNA sequencing, all of the analyzed mice tumors expressed BCL6 (data not shown). The absence of BCL6 expression in some tumors expressing HGAL may result from HGAL-enhanced BCR stimulation in these tumors, which was reported to decrease BCL6 protein expression.46 Indeed, re-expression of HGAL in lymphoma cells in which its expression was knocked out by clustered regularly interspaced short palindromic repeats-Cas9 methodology led to a decrease in BCL6 protein expression that was further decreased following BCR stimulation (supplemental Figure 7), suggesting that continuous BCR stimulation in vivo in DLBCL tumors may lead to decreased BCL6 protein expression.
![B-cell lymphoma development in Rosa26HGAL mice. (A) Overall survival of Rosa26HGAL/Sca1-Cre mice, Rosa26HGAL/Mb1-Cre mice, and Rosa26HGAL/Aid-Cre mice. All had a significantly shortened lifespan compared with control littermate WT mice. Rosa26HGAL/Sca1-Cre vs WT, P < .0001; Rosa26HGAL/Mb1-Cre vs WT, P = .00248; Rosa26HGAL/Aid1-Cre vs WT, P = .0062; log-rank test). Live animals from all experimental genotypes were censored at 24 months, because they were euthanized at this point based on the experimental design (see"Methods"). (B) B-cell lymphoma–specific survival of Rosa26HGAL/Sca1-Cre mice, Rosa26HGAL/Mb1-Cre mice, and Rosa26HGAL/Aid-Cre mice showing a significantly shortened lifespan for Rosa26HGAL/Sca1-Cre mice compared with control littermate WT mice (P = .0088, log-rank test). (C) Representative images of large B-cell lymphoma in the spleen from Rosa26HGAL/Sca1-Cre transgenic mice. Multiple splenic nodules of large pleomorphic cells expressing B220, PAX5 (B-cell marker), HGAL, PNA (GCB marker), and IRF4 (late GC or post-GC marker) but not BCL6 (GCB marker) and CD3 (T-cell marker) (hematoxylin and eosin [HE]; original magnification ×400). (D) B-cell lymphomas were clonal, as confirmed by immunoglobulin heavy chain PCR analysis. PCR analysis of BCR gene rearrangements in infiltrated spleens of diseased Rosa26HGAL/Sca1-Cre mice and Rosa26HGAL/Aid-Cre mice. Sorted B cells from the spleens of healthy mice served as a control for polyclonal BCR rearrangements. Lymphoma spleens show an increased clonality within their BCR repertoire (indicated by the code number of each mouse analyzed). Colored boxes denote clonal bands of immunoglobulin genes in different mice.](https://ash.silverchair-cdn.com/ash/content_public/journal/blood/137/13/10.1182_blood.2020004996/2/m_bloodbld2020004996f5.png?Expires=1763480961&Signature=hksnsgpTbud1555LfEw2u-ouHvKIEWjZ6tdGmPf3MsrI~6qSI5~NKxZAttGBRXiVPwKkFibCwuRXuy5hzVYxtwF9tzn8apEKB-oS76Ct9fW0h-Lp62huv0IUvXcHoQnNSNJhWhygjNIcc8nLP-9LnKnG7LHKaLbVIs2J8nBDj0VTiY6GzpkpPPB7BdzIjWjB37xFRrWw~X1Flc8csUK3pOs07MuVeBezQS~ugq9KD1EsCI-IkL2LrD8NE4KX72NLl7W~QfRjuqPNTVXrknm5SPsRuQSJJvMeRRlaX0bWcT9GZDhxwgessRAWndeOPDjbwtvu4wxKLx8pcC9XRJYJwA__&Key-Pair-Id=APKAIE5G5CRDK6RD3PGA)
B-cell lymphoma development in Rosa26HGAL mice. (A) Overall survival of Rosa26HGAL/Sca1-Cre mice, Rosa26HGAL/Mb1-Cre mice, and Rosa26HGAL/Aid-Cre mice. All had a significantly shortened lifespan compared with control littermate WT mice. Rosa26HGAL/Sca1-Cre vs WT, P < .0001; Rosa26HGAL/Mb1-Cre vs WT, P = .00248; Rosa26HGAL/Aid1-Cre vs WT, P = .0062; log-rank test). Live animals from all experimental genotypes were censored at 24 months, because they were euthanized at this point based on the experimental design (see"Methods"). (B) B-cell lymphoma–specific survival of Rosa26HGAL/Sca1-Cre mice, Rosa26HGAL/Mb1-Cre mice, and Rosa26HGAL/Aid-Cre mice showing a significantly shortened lifespan for Rosa26HGAL/Sca1-Cre mice compared with control littermate WT mice (P = .0088, log-rank test). (C) Representative images of large B-cell lymphoma in the spleen from Rosa26HGAL/Sca1-Cre transgenic mice. Multiple splenic nodules of large pleomorphic cells expressing B220, PAX5 (B-cell marker), HGAL, PNA (GCB marker), and IRF4 (late GC or post-GC marker) but not BCL6 (GCB marker) and CD3 (T-cell marker) (hematoxylin and eosin [HE]; original magnification ×400). (D) B-cell lymphomas were clonal, as confirmed by immunoglobulin heavy chain PCR analysis. PCR analysis of BCR gene rearrangements in infiltrated spleens of diseased Rosa26HGAL/Sca1-Cre mice and Rosa26HGAL/Aid-Cre mice. Sorted B cells from the spleens of healthy mice served as a control for polyclonal BCR rearrangements. Lymphoma spleens show an increased clonality within their BCR repertoire (indicated by the code number of each mouse analyzed). Colored boxes denote clonal bands of immunoglobulin genes in different mice.
B-cell lymphoma development in Rosa26HGAL mice. (A) Overall survival of Rosa26HGAL/Sca1-Cre mice, Rosa26HGAL/Mb1-Cre mice, and Rosa26HGAL/Aid-Cre mice. All had a significantly shortened lifespan compared with control littermate WT mice. Rosa26HGAL/Sca1-Cre vs WT, P < .0001; Rosa26HGAL/Mb1-Cre vs WT, P = .00248; Rosa26HGAL/Aid1-Cre vs WT, P = .0062; log-rank test). Live animals from all experimental genotypes were censored at 24 months, because they were euthanized at this point based on the experimental design (see"Methods"). (B) B-cell lymphoma–specific survival of Rosa26HGAL/Sca1-Cre mice, Rosa26HGAL/Mb1-Cre mice, and Rosa26HGAL/Aid-Cre mice showing a significantly shortened lifespan for Rosa26HGAL/Sca1-Cre mice compared with control littermate WT mice (P = .0088, log-rank test). (C) Representative images of large B-cell lymphoma in the spleen from Rosa26HGAL/Sca1-Cre transgenic mice. Multiple splenic nodules of large pleomorphic cells expressing B220, PAX5 (B-cell marker), HGAL, PNA (GCB marker), and IRF4 (late GC or post-GC marker) but not BCL6 (GCB marker) and CD3 (T-cell marker) (hematoxylin and eosin [HE]; original magnification ×400). (D) B-cell lymphomas were clonal, as confirmed by immunoglobulin heavy chain PCR analysis. PCR analysis of BCR gene rearrangements in infiltrated spleens of diseased Rosa26HGAL/Sca1-Cre mice and Rosa26HGAL/Aid-Cre mice. Sorted B cells from the spleens of healthy mice served as a control for polyclonal BCR rearrangements. Lymphoma spleens show an increased clonality within their BCR repertoire (indicated by the code number of each mouse analyzed). Colored boxes denote clonal bands of immunoglobulin genes in different mice.
PCR analyses for rearranged immunoglobulin heavy chains confirmed that all B-cell tumors were clonal (Figure 5D) and harbored somatic mutations with a predominance of transitions (especially C to T exchange), irrespective of the promoter driving the HGAL expression in mice (supplemental Figure 8). These findings indicate that tumors originated from lymphocytes that experienced GC reaction with AID activity.
Molecular characterization of HGAL gain-of-function–associated DLBCLs
To comprehensively analyze the transcriptome effect of HGAL in nonmalignant lymphocytes and lymphomas, we performed gene expression analysis using spleens from adult WT littermates (n = 4), nontumorous spleens from Rosa26HGAL/Sca1-Cre mice (n = 3), Rosa26HGAL/Mb1-Cre mice (n = 5), and Rosa26HGAL/Aid-Cre mice (n = 4), and DLBCLs from Rosa26HGAL/Sca1-Cre mice (n = 4).
In supervised analyses using significance analysis of microarray at a 10% FDR, we identified 226 genes with significantly different expression in B splenocytes between lymphomatous Rosa26HGAL/Sca1-Cre mice and WT littermates (Figure 6A). Of note, GSEA demonstrated significant enrichment in genes upregulated in DLBCL lymphomas described by Shipp et al41 (GSEA FDR q = 0.000; Figure 6B), as well as MYC target genes (GSEA FDR q = 0.000; Figure 6C). Furthermore, in Rosa26HGAL/Sca1-Cre tumors, GSEA demonstrated a significant enrichment of the expression of genes that are highly expressed in normal GCBs (Figure 6D), further indicating their GC origin. Among the genes that were differentially expressed between lymphoma and normal B splenocytes, we observed upregulation of regulator of G-protein signaling 1 (RGS1) and RAB10, a member RAS oncogene family. Rgs1 encodes a member of the regulator of G-protein signaling family that is expressed in B lymphocytes, including GC B lymphocytes. It attenuates the signaling activity of G-proteins by binding to activated GTP-bound G α subunits and acting as a GTPase-activating protein.47 Like HGAL, RGS1 inhibits chemoattractant-induced lymphocyte migration48,49 and was shown to be expressed in human lymphomas, including DLBCL.50 RAB10 is a GTPase that regulates intracellular membrane trafficking.51 Like HGAL, elevated expression of RAB10 was associated with longer survival of DLBCL patients.52
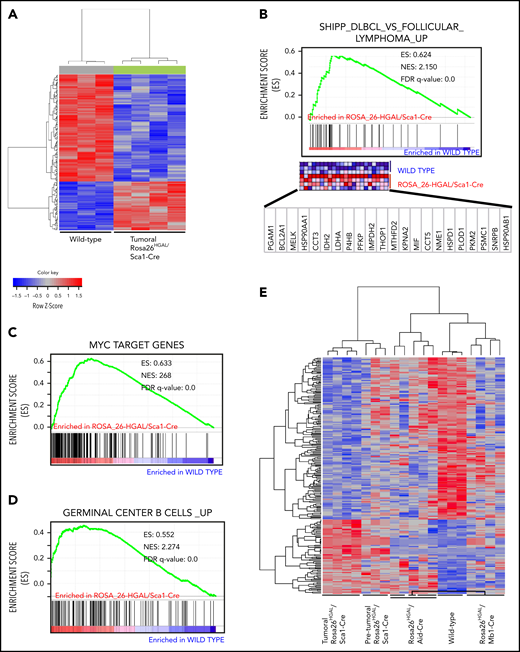
Molecular identity of tumor cells in Rosa26HGAL/Sca1-Cre mice. (A) Heat map of genes significantly induced or repressed in Rosa26-HGAL/Sca1-Cre splenic tumors (n = 4) and WT spleens (n = 3) classified by 226 genes/probe sets (FDR = 0.101) that are differentially expressed between tumor and WT spleens. Each row represents a separate gene, and each column denotes a separate messenger RNA (mRNA) sample. The level of expression of each gene in each sample is represented using a red–blue color scale (upregulated genes are displayed in red, and downregulated genes are in blue). (B-D) GSEA of the transcriptional signatures within splenic tumors compared with control spleen from WT littermates. Gene expression data from Rosa26-HGAL/Sca1-Cre tumors showed significant enrichment in genes upregulated in follicular lymphomas described by Shipp et al41 (GSEA FDR q value = 0.000) (B), enrichment in MYC target genes (GSEA FDR q value = 0.000) (C), and significant enrichment in genes expressed in normal GCBs (GSEA FDR q value = 0.000) (D). (E) Heat map of genes significantly induced or repressed within Rosa26-HGAL/Sca1-Cre splenic tumors (n = 4), Rosa26-HGAL/Sca1-Cre spleens without tumors (n = 3), Rosa26-HGAL/Mb1-Cre spleens (n = 5), Rosa26-HGAL/Aid-Cre spleens (n = 4), and WT spleens (n = 3) classified by 226 genes/probe sets (FDR = 0.101) that are differentially expressed between Rosa26-HGAL/Sca1-Cre splenic tumors and WT spleens. Each row represents a separate gene, and each column denotes a separate mRNA sample. The level of expression of each gene in each sample is represented using a red–blue color scale (upregulated genes are displayed in red, and downregulated genes are shown in blue). NES, normalized enrichment score.
Molecular identity of tumor cells in Rosa26HGAL/Sca1-Cre mice. (A) Heat map of genes significantly induced or repressed in Rosa26-HGAL/Sca1-Cre splenic tumors (n = 4) and WT spleens (n = 3) classified by 226 genes/probe sets (FDR = 0.101) that are differentially expressed between tumor and WT spleens. Each row represents a separate gene, and each column denotes a separate messenger RNA (mRNA) sample. The level of expression of each gene in each sample is represented using a red–blue color scale (upregulated genes are displayed in red, and downregulated genes are in blue). (B-D) GSEA of the transcriptional signatures within splenic tumors compared with control spleen from WT littermates. Gene expression data from Rosa26-HGAL/Sca1-Cre tumors showed significant enrichment in genes upregulated in follicular lymphomas described by Shipp et al41 (GSEA FDR q value = 0.000) (B), enrichment in MYC target genes (GSEA FDR q value = 0.000) (C), and significant enrichment in genes expressed in normal GCBs (GSEA FDR q value = 0.000) (D). (E) Heat map of genes significantly induced or repressed within Rosa26-HGAL/Sca1-Cre splenic tumors (n = 4), Rosa26-HGAL/Sca1-Cre spleens without tumors (n = 3), Rosa26-HGAL/Mb1-Cre spleens (n = 5), Rosa26-HGAL/Aid-Cre spleens (n = 4), and WT spleens (n = 3) classified by 226 genes/probe sets (FDR = 0.101) that are differentially expressed between Rosa26-HGAL/Sca1-Cre splenic tumors and WT spleens. Each row represents a separate gene, and each column denotes a separate mRNA sample. The level of expression of each gene in each sample is represented using a red–blue color scale (upregulated genes are displayed in red, and downregulated genes are shown in blue). NES, normalized enrichment score.
Using the same set of genes that was able to discriminate between Rosa26HGAL/Sca1-Cre mice and WT littermates in B splenocytes, we observed marked differences in expression between splenocytes from WT littermates and nonmalignant splenocytes from Rosa26HGAL/Sca1-Cre, Rosa26HGAL/Mb1-Cre, and Rosa26HGAL/Aid-Cre animals, whereas individual splenocyte samples from animals with different promoters governing HGAL expression always clustered together (Figure 6E). The extent of the difference in the expression of these genes varied based on the promoter used to express HGAL, with the fewest changes observed between splenocytes from Rosa26HGAL/Aid-Cre mice and WT littermates and the most changes observed between splenocytes from Rosa26HGAL/Mb1-Cre mice and WT littermates. A supervised analysis using significance analysis of microarrays at a 10% FDR identified 654 genes with significantly different expression between B splenocytes of nonmalignant Rosa26HGAL/Mb1-Cre mice and WT littermates (supplemental Figure 9), whereas a similar analysis at a 15% FDR identified only 91 genes with significantly different expression between B splenocytes of nonmalignant Rosa26HGAL/Aid-Cre mice and WT littermates (supplemental Figure 10). A smaller gene set with significantly different expression between B splenocytes of nonmalignant Rosa26HGAL/Aid-Cre mice and WT littermates would be expected, because HGAL is expressed only upon GC formation in these animals.
GSEA of genes differentially expressed between B splenocytes from individual mice models in comparison with WT littermates demonstrated model-specific and generalized changes across all 3 animal models (supplemental Figure 11). Common to all 3 models were enrichments of genes belonging to mTORC1 signaling, interferon response, E2F targets, and interleukin-6 (IL-6)/JAK/STAT3 signaling, among others (supplemental Figure 11D). MYC targets were enriched in splenocytes from Rosa26HGAL/Sca1-Cre and Rosa26HGAL/Aid-Cre animals and, for example, p53 targets were only enriched in splenocytes from Rosa26HGAL/Sca1-Cre animals (supplemental Figure 11).
To further characterize the HGAL gain-of-function DLBCL tumors, we performed exome sequencing of 8 murine tumors and paired samples of germline tail DNA as a reference (supplemental Table 3). In total, we observed 124 missense and/or non-sense mutations in 110 genes, with a mean of 15 per tumor) (supplemental Figure 12); this is similar to the median of 17 genetic alterations per tumor found in human DLBCL.7 Some mutations coincided with classical AID hotspots (WRCY or the inverse RGYW in 0-17% of mutations per tumor), whereas others were likely caused by different mechanisms, as recently reported by Chapuy et al in human DLBCL.7 Some of the mutated genes were previously reported in human DLBCL tumors, with 18 mutations previously detected in >7% of analyzed human DLBCL tumors (eg, PIM1, GNA13, FAS, PDF4DIP, NFKBIA, and PTPN6) (supplemental Table 4). Although some of the mutations in these 18 genes were previously reported in GCB and ABC human DLBCL tumors, others were exclusively detected in GCB human DLBCL (eg, GNA13 and PTPN6),7,14 also pointing to the GC origin of the mouse DLBCL associated with the conditional expression of HGAL.
Discussion
Herein, we demonstrate that conditional expression in mice of HGAL, a protein that enhances BCR signaling and limits B-cell motility and migration, leads to a lymphoma that morphologically, immunophenotypically, and genetically resembles human GCB-type DLBCL. HGAL is characterized by restricted expression, primarily in GCs and early precursors in mice (no data in humans), raising the possibility that HGAL expression at other stages might be deleterious to B cells. Further, definitive staging of somatic genetic lesions is not obvious because tumors can exhibit phenotypes of a certain stage of development but contain gene alterations from prior stages. To test these possibilities, we specifically used a Cre allele that is active in GCB cells (Aid-Cre) and added Cre alleles that are expressed from the pro-B–cell stage (Mb1-Cre) and HSCs (Sca1-Cre) as controls in our study. Noticeably, development of lymphoma occurred regardless of the Cre allele. These data might indicate that, irrespective of the differential stage at which HGAL is conditionally expressed, its constitutive expression leads to a block in B-cell differentiation at the GC reaction, as indicated by the expression of PNA and enriched expression of other GC genes (Figure 6D), as well as the presence of mutated immunoglobulin genes in all of the analyzed tumors. These observations are in line with data from human lymphoma patients, in whom HGAL is expressed in 90% of GCB-type DLBCLs.45 Furthermore, these results are concordant with our previous observations in Sca1-HGAL transgenic mice; HGAL expression is restricted to HSCs that exhibited increased-size intestinal Peyer’s patches, polyclonal B-cell lymphoid hyperplasia, and systemic reactive amyloid A amyloidosis, but the mice did not develop lymphoma.22
It is unknown how HGAL may contribute to lymphomagenesis in humans. HGAL expression is tightly regulated and limited to the GC reaction. It is upregulated by IL-4 and IL-13 secreted by the GC microenvironment15 and downregulated by BCR and CD40 stimulation.21,53,54 Expression of PRDM155 and mir-155,56 which are implicated in the termination of the GC reaction and differentiation into plasma cells, also downregulates HGAL expression. Therefore, any genetic aberration that will trap B cells within the GC stage, such as BCL6 translocation/mutations or PRDM1 deletions/mutations commonly observed in human DLBCL,7,57-60 will permit constitutive HGAL expression. This constitutive expression of HGAL may reprogram normal biological functions and lead to enhanced chronic and tonic BCR signaling and restriction of B cells to the GC by inhibiting their motility and migration, thereby contributing to lymphomagenesis. Indeed, we previously reported enhanced BCR signaling and increased BCR synapse intensity and density following BCR stimulation in Rosa26HGAL/Mb1-Cre lymphocytes in comparison with lymphocytes not expressing HGAL originating from WT control littermates.20 Alternatively, HGAL expression may be deregulated during lymphomagenesis by genetic aberrations affecting regulatory regions controlling its expression; however, it is unknown whether such genetic aberrations occur.
Lymphomas observed in mice occurred in a similar time frame starting from 13 months of age, irrespective of the Cre allele used. These findings indicate that secondary genetic aberrations or external triggers are likely required for lymphomagenesis. Indeed, we observed mutations in multiple genes (eg, PIM1, GNA13, FAS, PDE4DIP, NFKBIA, and PTPN6) that are implicated in the pathogenesis of human DLBCL.13,60 Of interest are mutations in the GNA13 gene, whose expression is upregulated in GC lymphocytes.14 It functions in transmitting S1PR2 signals, leading to GC confinement, similar to HGAL.14 GNA13 mutations are among the most common genetic alterations in GC-derived B-cell lymphomas, whereas genetic events in GNA13 are largely absent from all other hematologic malignancies, including non-GCB lymphomas.61 We and other investigators have shown that GNA13 deletion confers a strong susceptibility to GC-derived lymphoma in mice that, similar to our tumors, expressed IRF4.14 Deleterious mutations in GNA13 deregulate AKT signaling and lead to loss of GC confinement, allowing B cells to egress into circulation. Survival of these cells outside of the GC depends on expression of BCL2 or MYC.13,14 The concomitant constitutive HGAL expression and GNA13 mutations may allow transformed GCBs to leave the GC and disseminate into the circulation and to other organs. The interplay between the HGAL and S1PR2/GNA13 pathways in GC lymphocytes and lymphoma needs to be evaluated in future studies.
In summary, by using mouse genetics, we demonstrate that enforced constitutive HGAL expression drives lymphoma formation that phenocopies human GCB-type DLBCL. Our results implicate HGAL in human lymphomagenesis.
Raw array microarray data files have been deposited in the Gene Expression Omnibus database (accession number GSE142368).
Data sharing requests should be sent to Izidore S. Lossos (e-mail: ilossos@med.miami.edu).
The online version of this article contains a data supplement.
The publication costs of this article were defrayed in part by page charge payment. Therefore, and solely to indicate this fact, this article is hereby marked “advertisement” in accordance with 18 USC section 1734.
Acknowledgments
The authors thank all members of their groups for useful suggestions and for critical reading of the manuscript.
Research in C.V.-D.’s group is partially supported by Federación Española de Enfermedades Raras (FEDER), “Miguel Servet” Grant (CPII19/00024 - AES 2017-2020) from the Instituto de Salud Carlos III (Ministerio de Economía y Competitividad), “Fondo de Investigaciones Sanitarias/Instituto de Salud Carlos III” (PI17/00167). Research in I.S.-G.’s group is supported in part by SAF2015-64420-R Ministerio de Economía y Competitividad (MINECO)/FEDER, Reglamento (UE), RTI2018-093314-B-I00 Spanish Ministry of Science, Innovation and Universities (MCIU)/Spanish State Research Agency (AEI)/FEDER, UE, by Junta de Castilla y León (UIC-017, CSI001U16, and CSI234P18), and by the German Carreras Foundation (DJCLS; R13/26 and DJCLS 02R/2016). I.S.-G.’s laboratory is a member of the EuroSyStem and the DECIDE Network, which is funded by the European Union under the FP7 program. I.S.-G. and C.V.-D. have been supported by the German Federal Office for Radiation Protection (BfS) (FKZ: 3618S32274). A.C.-G. is supported by Fondo Social Europeo (FSE)-Conserjería de Educación de la Junta de Castilla y León 2019 European Social Fund (ESF) fellowship (CSI067-18). I.S.L. is supported by the National Institutes of Health, National Cancer Institute (grant 1R01CA233945), the Intramural Funding Program from the University of Miami Sylvester Comprehensive Cancer Center (SCCC), by the Dwoskin and Anthony Rizzo Families Foundations, and by the Jaime Erin Follicular Lymphoma Research Consortium.
Authorship
Contribution: C.V.-D., I.S.L., and I.S.-G. conceived the project; J.R.-G., A.C.-G., X.J., M.I.-H., A.J.G., V.D., B.P., D.A.-L., and J.D.L.R developed the methodology; O.B., S.Z., and Y.N. reviewed the pathology; O.B., A.J.G., Y.N., O.B., C.V.-D., I.S.L., and I.S.-G. analyzed and interpreted data; J.R.-G., A.C.-G., X.J., M.I.-H., A.J.G., Y.N., O.B., V.D., B.P., D.A.-L., J.D.L.R., C.V.-D., I.S.L., and I.S.-G. prepared the manuscript; J.R.-G., A.C.-G., M.I.-H., A.J.G., D.A.-L., and C.V.-D. compiled administrative, technical, or material support (ie, reporting or organizing data, constructing databases); and C.V.-D., I.S.L., and I.S.-G. supervised the study.
Conflict-of-interest disclosure: The authors declare no competing financial interests.
Correspondence: Izidore S. Lossos, Division of Hematology, Department of Medicine, University of Miami, Sylvester Comprehensive Cancer Center, 1475 NW 12th Ave (D8-4), Miami, FL 33136; e-mail: ilossos@med.miami.edu.

This feature is available to Subscribers Only
Sign In or Create an Account Close Modal