

Key Points
Dynamic CTCF-binding sites colocalize with lineage-specific transcription factors and are essential for hematopoiesis.
Dynamic CTCF-binding sites directly mediate the chromatin interactions of associated regulatory elements.

Abstract
While constitutive CCCTC-binding factor (CTCF)–binding sites are needed to maintain relatively invariant chromatin structures, such as topologically associating domains, the precise roles of CTCF to control cell-type–specific transcriptional regulation remain poorly explored. We examined CTCF occupancy in different types of primary blood cells derived from the same donor to elucidate a new role for CTCF in gene regulation during blood cell development. We identified dynamic, cell-type–specific binding sites for CTCF that colocalize with lineage-specific transcription factors. These dynamic sites are enriched for single-nucleotide polymorphisms that are associated with blood cell traits in different linages, and they coincide with the key regulatory elements governing hematopoiesis. CRISPR-Cas9–based perturbation experiments demonstrated that these dynamic CTCF-binding sites play a critical role in red blood cell development. Furthermore, precise deletion of CTCF-binding motifs in dynamic sites abolished interactions of erythroid genes, such as RBM38, with their associated enhancers and led to abnormal erythropoiesis. These results suggest a novel, cell-type–specific function for CTCF in which it may serve to facilitate interaction of distal regulatory emblements with target promoters. Our study of the dynamic, cell-type–specific binding and function of CTCF provides new insights into transcriptional regulation during hematopoiesis.
Introduction
Precise transcriptional regulation during cell differentiation relies on the spatial orchestration of interactions among different types of cis-regulatory elements (CREs),1 consisting of enhancers, insulators, repressors, and other DNA elements. How proper communication among these CREs is established and regulated is a fundamental question in both functional genomics and developmental biology.
Interactions between specific chromosomal elements, such as enhancer-promoter loops, are typically restricted to limited regions defined as topologically associating domains (TADs).2,3 The CCCTC-binding factor (CTCF), together with cohesin complexes, plays fundamental roles in the formation and maintenance of these chromatin interactions.4-7 CTCF is highly enriched at TAD boundaries and forms physical loops with intervening DNA,3,5 providing an insulated environment that is required for proper expression of some lineage-specifying genes.8 Most TAD boundaries are similar across different cell types, consistent with early studies showing highly similar CTCF occupancy across the genome in different cell types9 and species.10,11 However, more recent studies indicated that a considerable fraction of CTCF occupancy is dynamic (ie, variable across cell types) and lineage specific.12-15 Although these studies highlight potential new roles for CTCF, their cross-comparison and interpretation have been confounded by the use of different technical approaches to analyze CTCF chromatin occupancy, variable tissue sources (ie, immortalized vs primary cells), and different genetic backgrounds of compared samples. Therefore, interpreting the tissue specificity of different CTCF-occupied sites observed across current studies is challenging. Moreover, the functional outcomes of dynamic, tissue-specific CTCF chromatin occupancy are unknown.
We quantitatively mapped CTCF occupancy genome-wide in primary human hematopoietic stem and progenitor cells (HSPCs), B cells, T cells, monocytes, and erythroblast cells to identify binding sites that are dynamic (cell-type specific) during hematopoiesis, an important disease-related process that is under precise transcriptional regulation16,17 and subject to extensive, well-characterized genetic variation.18-20 By correlating dynamic CTCF chromatin occupancy with epigenetic profiles, chromatin organization, and human genome-wide association study data, we identified potential roles for dynamic CTCF occupancy in transcriptional regulation during hematopoiesis. We then validated our model via high-throughput functional perturbation assays and precise genome editing. Our study reveals a novel mechanism for developmental regulation of gene expression that appears to be influenced by genetic variants that impact blood cell traits.
Methods
Cell isolation and erythroid differentiation
To obtain CD34+ HSPCs, granulocyte colony-stimulating factor–mobilized mononuclear cells from a healthy donor were purchased from Key Biologics. CD34+ cells were purified with CliniMACS CD34 microbeads (Miltenyi Biotech, 130-017-051). At least 95% of purified cells were CD34+. Other cell types were isolated from CD34− peripheral blood mononuclear cells of the same donor. B cells, monocytes, CD4+ T cells, and CD8+ T cells were isolated with CD19 microbeads (Miltenyi Biotech, 130-050-301), CD14 microbeads (Miltenyi Biotech, 130-050-201), CD4 microbeads (Miltenyi Biotech, 130-055-101), and CD8 microbeads (Miltenyi Biotech, 130-055-201), respectively.
A 3-phase culture protocol was used for erythroid differentiation and maturation, as previously described.21 In phase 1 (days 0-7), purified CD34+ cells were grown to a density of 1 to 8 × 10⁵ cells/mL in Iscove modified Dulbecco medium with 2% human AB plasma, 3% human AB serum, 1% penicillin/streptomycin, 3 IU/mL heparin, 10 µg/mL insulin, 200 µg/mL holotransferrin, 1 IU/mL erythropoietin (EPO), 10 ng/mL human stem cell factor (SCF; PeproTech, 300-07), and 1 ng/mL interleukin-3 (IL-3). In phase 2 (days 8-12), IL-3 was omitted from the medium. In phase 3 (days 12-18), cells were grown to a density of 1 to 5 × 10⁶ cells/mL, with both IL-3 and SCF omitted from the media and the holotransferrin concentration increased to 1 mg/mL. The differentiation status was measured by flow cytometry. Erythroblasts were collected on day 12.
ChIP-seq
Isolated cells were resuspended in phosphate-buffered saline at 1 × 10⁶ cells/mL, followed by adding formaldehyde to a 1% final concentration. The cell solutions were rotated at room temperature for 10 minutes, quenched by addition of glycine to a 125-mM final concentration, and incubated at room temperature for 5 minutes. Fixed cells were washed twice in cold phosphate-buffered saline, and the cell pellets were stored at −80C. ChIP with antibodies to CTCF (Millipore, 07-729), GATA1 (Abcam, ab11852), H3K27ac (Abcam, ab4729), TAL1 (GeneTex, GTX116020), or H3K27me3 (Abcam, ab6002) was prepared in biological replicates, as described previously10 with the following modification. For CTCF-, GATA1-, and TAL1-based ChIP, ∼5 to 10 × 106 cross-linked cells were used, and for H3K27ac- and H3K27me3-based ChIP, ∼1 to 3 × 10⁶ cross-linked cells were used. Sequencing libraries were generated using the NEBNext Ultra II DNA library prep kit (New England Biolabs, E7645) with homemade Truseq adaptors. Libraries were sequenced with an Illumina HiSeq 2500 or HiSeq 4000. The sequencing reads were mapped to hg19 with the Burrows-Wheeler aligner (0.7.15-r1140) with the default setting (bwa mem). Reads that could not be uniquely mapped to the human genome were removed by samtools (version 1.3.1, samtools view -q 1). Strand cross-correlations were calculated with SPP. ChIP-seq peaks were called by using MACS2 (2.0.10.20131216), and peaks identified by 2 biological replicates were kept. Peaks that overlapped with the blacklist regions defined by ENCODE were further removed. The T-cell ChIP-seq results represent a combination of CD4+ and CD8+ T cells.
Dynamic CTCF peaks
The number of ChIP-seq reads located with each peak region were calculated by the program FeatureCount.22 The R package DeSeq223 package was used to identify regions with significantly different ChIP-seq read coverage. Specifically, pairwise comparisons were performed on CTCF ChIP-seq signals between HSPCs and different blood lineages. Peak regions that showed at least eightfold signal changes and an adjusted P value < .001 were further selected and defined as dynamic binding sites.
Motif analysis
FIMO was used for the motif scan with consensus motifs downloaded from HOMER.24 Motif enrichment was conducted using findMotifsGenome.pl in the HOMER package (version 4.10.1), with hg19 as the reference genome.
ATAC-seq
ATAC-seq libraries of 50 000 cells per sample were constructed according to the published omni-ATAC protocol.25 Libraries were 100-bp paired-end sequenced with an Illumina HiSeq 4000. The adaptor sequencing reads were trimmed by skewer26 and then mapped to hg19 by using BWA (v0.7.1). Reads mapped to mitochondrial DNA were removed. ATAC-seq peaks were called by using MACS2 with the following parameters: macs2 callpeak, –nomodel, –shift −100, and –extsize 200.
Dynamic CTCF-binding site function enrichment analysis
Functional annotation analysis was performed with the GREAT Web server (http://great.stanford.edu/), with the whole genome as background. ATAC-seq data from different blood lineages and primary hematopoietic stem cells were downloaded from a previous publication.27 Raw reads were remapped to the hg19 human genome. Duplicated reads and mitochondria DNA reads were removed. Chromatin openness of the dynamic CTCF loci in different blood cell types was calculated using FeatureCount. The Pearson correlation was calculated based on ATAC-seq signals in dynamic CTCF-binding sites.
RBC trait enrichment analysis
HUDEP-2 cell culture and induced maturation
HUDEP-2 cells were maintained in culture as previously described.29 For expansion, the cells were grown to 0.2 to 0.8 × 10⁶ cells/mL in StemSpan serum-free expansion medium (Stem Cell Technologies, 9650) in the presence of 50 ng/mL SCF, 3 IU/mL EPO, 1 µM dexamethasone, 1 µg/mL doxycycline, and 1% penicillin-streptomycin. To induce erythroid maturation, HUDEP-2 cells were grown to 0.7 to 1.4 × 10⁶ cells/mL in Iscove modified Dulbecco medium (Invitrogen) supplemented with 2% fetal bovine serum, 3% human serum albumin, 3 IU/mL EPO, 10 µg/mL insulin, 1000 µg/mL holotransferrin, 3 U/mL heparin, and 1 µg/mL doxycycline for days 1 to 3. Cells were grown to 1 to 2 × 10⁶ cells/mL in the same medium for days 4 and 5.
Generation of HUDEP-2 knockin cell lines
Cas9 single gRNA (sgRNA) RNPs were generated by mixing 0.5 µL of 40 µM Cas9 protein and 1 µL of 50 µM sgRNA (Synthego, 5′-aaacaacUcagagggUUccc-3′) at room temperature for 10 minutes. The RNP cocktail was then mixed with 5 µg single-strand oligodeoxynucleotides and 200 ng pMaxGFP, added to 2 × 10⁵ HUDEP-2 cells, and subjected to nucleofection with the Neon transfection system (Invitrogen, 1150 V, 30 ms, 2 pulses). After 1 week of cell culture, single GFP+ cells were sorted into individual wells of 96-well U-bottom plates with a BD Bioscience Aria cell sorter. After 2 weeks of clonal expansion, targeted deep sequencing was performed to identify clones with accurate homozygous deletion of CTCF-binding motifs. Two clones were selected for further experiments.
CD34+ cell genome editing, differentiation, and methylcellulose colony assays
CD34+ cells were thawed and recovered in StemSpan serum-free expansion medium supplemented with 100 ng/mL human SCF, 100 ng/mL Flt3-L, and 50 ng/mL thyroperoxidase for 1 day and then nucleotransfected with Cas9-sgRNA RNP via the Neon transfection system (1160 V, 10 ms, 3 pulses). After nucleotransfection, the cells were recovered in expansion medium for 2 days before further experiments.
For erythroid differentiation, 2 × 10⁵ recovered CD34+ cells were resuspended in phase 1 erythroid differentiation medium to initiate the 3-phase differentiation protocol. The concentrations of the different cell samples were adjusted every 2 days to make them equal. For the erythroid methylcellulose colony assay, 800 cells were seeded into a 3-cm dish containing methylcellulose (Stem Cell Technologies, H4230) supplemented with 10 ng/mL SCF, 2 U/mL EPO, 1 ng/mL IL-3, and 1% penicillin-streptomycin. Three dishes for each type of genome-edited cells with 2 biological replicates were prepared. The number of colonies was counted after 14 d in culture. The sgRNA targeting CTCF-binding sites is 5′-cacUggagcagggagccagc-3′. Negative control sgRNA was purchased from Synthego.
Flow cytometry
For cellular phenotyping of CD34+ and HUDEP-2 cells, CD235a fluorescein isothiocyanate (FITC) (BD Biosciences, BDB559943), Band3-allophycocyanin (a gift from Xiuli An, NY Blood Center), and CD49d-Brilliant Violet 421 (BioLegend, 304322) were used. For apoptosis assays, the FITC Annexin V apoptosis kit (BD Bioscience, 556547) was used.
Real-time PCR analysis
RNA from approximately 1 × 10⁶ cells was isolated with the RNeasy Plus Mini kit (Qiagen), followed by generation of complementary DNA with the SuperScript IV VILO kit (Thermo Fisher Scientific). Quantitative real-time polymerase chain reaction (PCR) was performed with TaqMan primer/probe sets for RBM38 and HBB, with HPRT1 or GAPDH as housekeeping genes, respectively (Applied Biosystems). Data were analyzed by using the comparative threshold cycle 2−ΔΔCT method and normalized to the expression of GAPDH (for HBB) or HPRT1 (for RBM38). The values were expressed as the fold increase over WT HUDEP-2 cells before differentiation, which was set as 1.
HiChIP
HiChIP libraries of 10 × 106 cells per sample by using an H3K27ac antibody were prepared as previously described,30,31 with the following modification. After proximity ligation, the nuclear lysates were sonicated with a Branson 250 sonicator (microtip, 100% duty, 20% output, 12 × 10 s intervals). We used 8 µg H3K27ac antibodies for each sample. Reverse cross-linked ChIP DNAs were purified with the DNA Clean & Concentrator-5 purification kit (Zymo Research) and quantified with Qubit (Life Technologies). The samples were then end repaired, deoxyadenosine triphosphate labeled, and adaptor ligated with an NEBNext Ultra II DNA library prep kit, followed by streptavidin pull-down and PCR amplification of the library. PCR products (300-1000 bp) were size selected by using E-gel (Invitrogen). Libraries were 100-bp paired-end sequenced with an Illumina HiSeq 4000 to obtain ∼300 × 106 reads. The sequencing reads were mapped to hg19 with HiC-pro.32 The outputs were further processed with Hichipper33 to identify significant loops. The H3K27ac peaks located 2 kb upstream and 500 bp downstream of transcriptional start sites were defined as promoters. The remaining H3K27ac peaks were defined as enhancers.
Capture Hi-C
Capture Hi-C libraries were constructed according to a previously published protocol.34 We used 20 × 106 cells per sample to construct the 3C libraries. Biotinylated bait DNA targeting the RBM38 promoter region was designed to target both ends of a DpnII restriction fragment with CapSequm software.35 We used 2 μg of the 3C DNA for capture. Libraries were 150-bp paired-end sequenced with an Illumina Miseq. Capture Hi-C data were processed with CCanalyser3.34
Hi-C analysis
CRISPR-Cas9 screen for CTCF GOSs involved in erythroid expansion and maturation
An oligo pool encoding 1188 sgRNAs targeting 257 CTCF GOSs and 100 nontarget sgRNAs (supplemental Table 4) with a 5′ universal flanking sequence and 3′ universal flanking sequence were synthesized by Twist Biosciences. Construction of the sgRNA library was performed according to a published protocol,38 with the following modification. PCR products of the oligo pool were gel purified and cloned into a BsmBI-digested and gel-purified pLentiGuide-Puro vector (Addgene, 52963) by Gibson assembly with the HiFi DNA assembly master mix (New England Biolabs, E2621). The assembly products were transformed into competent cells (New England Biolabs, C3040). Plasmids from ∼200 000 colonies were extracted. To determine the quality of the lentiviral plasmid library, sgRNAs were amplified from plasmid library by using lentiGuide-Puro-specific sequencing primers. The sequencing primers contained Illumina universal sequences on their 5′ end. An 8-bp nucleotide unique barcode sequence was inserted between the Illumina sequence and the sgRNA flanking sequence in the forward primer. Gel-purified PCR products were 75-bp single-end sequenced with an Illumina Miseq. Lentiviral particles were generated by transfecting HEK 293T cells with the library plasmids pVSVG, pRevtat, and pGagpol with Lipofectamine 2000 (Life Technologies). Viral titers were determined by serial dilution.
A total of 15 × 106 HUDEP-2 cells stably expressing Cas9 were used for transduction with the lentiviral library at a multiplicity of infection of ∼0.3. After 1 day, the infected cells were selected in fresh expansion medium in the presence of 1 μg/mL puromycin for an additional 2 days. Nontransduced HUDEP-2 cells were used as a control to confirm the complete removal of cells lacking sgRNAs. Approximately 3 × 10⁶ cells were transduced to yield ∼1000× coverage of the sgRNA library. The cells were then maintained in the expansion medium for 8 days. We collected 2 × 10⁶ cells per sample at days 0 and 8. After 8 days of expansion, the cells were maintained in differentiation medium to induced erythroid maturation. On day 5, the cells were stained with CD235a-FITC, Band3-allophycocyanin, and CD49d-Brilliant Violet 421 antibodies and the Near-IR dead cell stain kit (Thermo Fisher Scientific, L34975). Stained cells were then subjected to cell sorting with an Aria III cell sorter (BD Biosciences) to obtain CD235a+/Band3+ and CD235a+/Band3− populations. Two biological replicates with 2 technical replicates per biological replicate were collected. Genomic DNA was extracted by using the Purelink genomic DNA mini kit (Life Technologies). We amplified the sgRNAs with barcoded lentiGuide-Puro-specific primers, with 500 ng genomic DNA per reaction. All genomic DNA were used for amplification. PCR products from the same samples were pooled. Equal amounts of PCR products from each sample were pooled, gel purified, and 75-bp single-end sequenced with an Illumina Nextseq550.
Results
Lineage-specific CTCF occupancy during hematopoiesis
To investigate dynamic CTCF occupancy during hematopoiesis, we performed CTCF chromatin immunoprecipitation sequencing (ChIP-seq) in mobilized peripheral blood CD34+ HSPCs, T cells (CD4+ and CD8+), B cells, monocytes, and in vitro–differentiated erythroblasts from the same normal donor (Figure 1A; supplemental Figure 1A-C, available at the Blood Web site). All ChIP-seq data set replicates met the metrics for high quality according to ENCODE standards,41 and they showed high reproducibility (supplemental Figure 1D-E). Since CD4+ and CD8+ T cells show highly similar CTCF-binding profiles (supplemental Figure 2B), we combined the data from the 2 cell types for all subsequent analyses in this study. We then performed a series of pairwise comparisons of the CTCF occupancy profiles between progenitors and differentiated blood cell types. By using a stringent threshold (adjusted P value < .001 and fold change > 8), we identified 103, 138, 156, and 378 dynamic (ie, cell-type–specific) CTCF-binding sites in T cells, B cells, monocytes, and erythroid cells, respectively (Figure 1B-C; supplemental Figure 2A; supplemental Table 1). Those dynamic CTCF sites contribute to 0.4%, 0.4%, 0.7% and 1.4%, respectively, of the total genome-wide CTCF-binding events in each cell type.

Dynamic CTCF occupancy during hematopoiesis. (A) Schematic of the primary human blood cells analyzed. HSPCs, T cells, B cells, and monocytes were purified by their corresponding purification beads. Erythroblasts were differentiated in vitro from HSPCs. (B) Heatmap in each panel represents the CTCF ChIP-seq signals within the 2-kb window centered on ChIP-seq peak summits specific to different blood cell types. (C) Genome browser tracks showing an erythroid-dynamic CTCF-binding site (highlighted in pink). (D) Top overrepresented motifs among the dynamic CTCF-binding sites from different types of blood cells. (E) The color chart displays the DNA sequences around the summits of CTCF-bound peaks, aligned with the DNA sequence of core CTCF motif and upstream motifs. Red represents A, blue represents C, green represents T, and yellow represents G. (F) The heatmap represents the ChIP-seq signals within a 2-kb window centered on dynamic CTCF-binding sites and the location of TF binding site motifs in different blood cell types. The DNA segments in each panel are in the same order for each cell type, decreasing from the highest aggregated CTCF ChIP-seq signals within a 2-kb window. The graphs above each heatmap show the aggregated ChIP-seq signal or frequency of matches to motifs. Ery, erythroblast; mono, monocyte.
Dynamic CTCF occupancy during hematopoiesis. (A) Schematic of the primary human blood cells analyzed. HSPCs, T cells, B cells, and monocytes were purified by their corresponding purification beads. Erythroblasts were differentiated in vitro from HSPCs. (B) Heatmap in each panel represents the CTCF ChIP-seq signals within the 2-kb window centered on ChIP-seq peak summits specific to different blood cell types. (C) Genome browser tracks showing an erythroid-dynamic CTCF-binding site (highlighted in pink). (D) Top overrepresented motifs among the dynamic CTCF-binding sites from different types of blood cells. (E) The color chart displays the DNA sequences around the summits of CTCF-bound peaks, aligned with the DNA sequence of core CTCF motif and upstream motifs. Red represents A, blue represents C, green represents T, and yellow represents G. (F) The heatmap represents the ChIP-seq signals within a 2-kb window centered on dynamic CTCF-binding sites and the location of TF binding site motifs in different blood cell types. The DNA segments in each panel are in the same order for each cell type, decreasing from the highest aggregated CTCF ChIP-seq signals within a 2-kb window. The graphs above each heatmap show the aggregated ChIP-seq signal or frequency of matches to motifs. Ery, erythroblast; mono, monocyte.
Of those dynamic sites, 10.2%, 12.5%, 4.5%, and 7.9% are located within 2 kb (supplemental Figure 2C) of transcription start sites, indicating a majority of them are distal regulatory elements. Motif enrichment analysis showed that the core CTCF motif was the most overrepresented sequence in dynamic CTCF-binding sites (Figure 1D). Additional motifs flanking the core CTCF motif have been shown to affect CTCF occupancy.42 Specifically, the upstream motif can increase CTCF binding, while the downstream motif can destabilize occupancy. We found that the upstream motif was significantly depleted in the dynamic CTCF-bound sites compared with constitutive ones (6% vs 15%, P value < 1e-5, 2-sided χ2 test). In contrast, no significant difference was observed for the downstream motifs (5% vs 4%, P value = .17, 2-sided χ2 test) (Figure 1E; supplemental Figure 3A). The second-most overrepresented sequences were binding site motifs of master regulator transcription factor (TFs) in different blood lineages. The binding site motif of the erythroid master TF GATA1 and the GATA-E-box motif for cognate binding of GATA1 and TAL1 (Figure 1D) were highly enriched in erythroid-dynamic CTCF-binding sites. Similarly, motifs for the master TFs IRF8, AP-1, and RUNX1 were significantly and specifically enriched in dynamic CTCF-binding sites of B cells, monocytes, and T cells, respectively (Figure 1D; supplemental Figure 3B). These motif enrichments suggested that the dynamically bound CTCF sites were also occupied by cell-type–specific master regulatory TFs. We confirmed this association by conducting GATA1 and TAL1 ChIP-seq in the same in vitro–differentiated erythroblasts, which revealed colocalization between approximately two-thirds of the dynamic CTCF-binding sites and master erythroid TFs (Figure 1F). In addition, these master TF-bound, dynamic CTCF-binding sites were coupled with high levels of the active chromatin modification marker H3K27ac (Figure 1F).
To further understand the colocalization between CTCF and master TFs, we investigated the distribution of CTCF and GATA1 motifs (Figure 1F). The distance between the 2 motifs was <300 bp in 77% of the cooccupied loci with a median distance of 108 bp (Figure 1F; supplemental Figure 3C), suggesting that majority of GATA1 and CTCF-binding sites are in the same CRE. We found similar observations when examining the distribution of CTCF and master TFs motifs in B cells, monocytes, and T cells (Figure 1F).
Dynamic CTCF-binding sites reveal important regulatory elements for hematopoiesis
In general, the chromatin accessibility patterns of CREs are distinctive for different types of blood cells.27 If the dynamic CTCF-binding sites we identified here are involved in lineage-specific transcriptional regulation during hematopoiesis, we predict that chromatin accessibility at these sites can also be used as cell identification markers. Indeed, although the 749 nonredundant dynamic sites comprised only 0.1% of the total accessible peaks (590 650) previously identified in different blood lineages,27 correlations of chromatin accessibility among the dynamic CTCF sites recapitulated the hierarchical structure of most types of blood cells (Figure 2A).
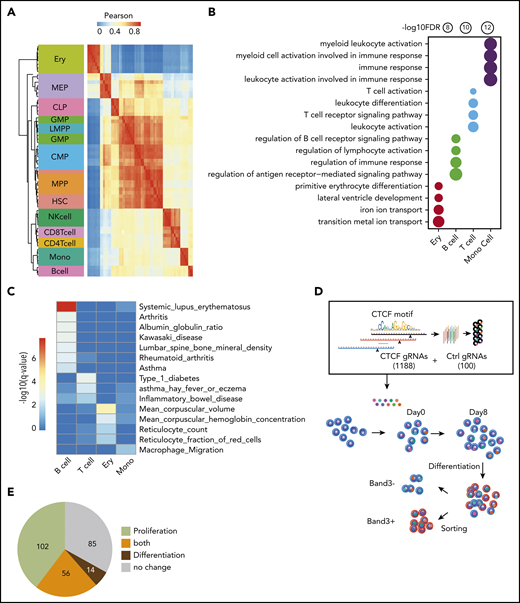
Functional importance of dynamic CTCF-binding sites. (A) Heatmap showing the unsupervised hierarchical clustering based on Pearson correlation of ATAC-seq signals on dynamic CTCF peaks across different blood lineages. The hierarchical cluster was generated based on the Pearson correlation of normalized ATAC-seq signals within dynamic CTCF sites. The chromatin accessibility within dynamic CTCF sites in each blood cell types were calculated based on ATAC-seq data generated in the previous publication.19 (B) Functional annotation results of dynamic CTCF sites for the top Gene Ontology cellular component and phenotype from GREAT. The radius of the circle represents the significance, −log10(FDR), of the enrichment. (C) Enrichment significance of trait-associated SNPs within different types of dynamic CTCF-binding sites. (D) Schematic of the pooled sgRNA library design and screening procedure used to experimentally validate the function of dynamic CTCF-binding sites. (E) Pie chart showing the numbers of dynamic CTCF-binding sites with different functions based on sgRNA perturbation results. CLP, common lymphoid progenitor; CMP, common myeloid progenitor; GMP, granulocyte-monocyte progenitor; HSC, hematopoietic stem cell; LMPP, lymphomyeloid primed progenitor; MEP, megakaryocytic-erythroid progenitor; MPP, myeloid primed progenitor; NK, natural killer.
Functional importance of dynamic CTCF-binding sites. (A) Heatmap showing the unsupervised hierarchical clustering based on Pearson correlation of ATAC-seq signals on dynamic CTCF peaks across different blood lineages. The hierarchical cluster was generated based on the Pearson correlation of normalized ATAC-seq signals within dynamic CTCF sites. The chromatin accessibility within dynamic CTCF sites in each blood cell types were calculated based on ATAC-seq data generated in the previous publication.19 (B) Functional annotation results of dynamic CTCF sites for the top Gene Ontology cellular component and phenotype from GREAT. The radius of the circle represents the significance, −log10(FDR), of the enrichment. (C) Enrichment significance of trait-associated SNPs within different types of dynamic CTCF-binding sites. (D) Schematic of the pooled sgRNA library design and screening procedure used to experimentally validate the function of dynamic CTCF-binding sites. (E) Pie chart showing the numbers of dynamic CTCF-binding sites with different functions based on sgRNA perturbation results. CLP, common lymphoid progenitor; CMP, common myeloid progenitor; GMP, granulocyte-monocyte progenitor; HSC, hematopoietic stem cell; LMPP, lymphomyeloid primed progenitor; MEP, megakaryocytic-erythroid progenitor; MPP, myeloid primed progenitor; NK, natural killer.
To elucidate the potential functions of dynamic CTCF-binding sites, we used the GREAT database and tool43 to find enrichment for function-related terms for their presumptive target genes. The presumptive target genes of the erythroid-dynamic CTCF-binding sites were highly enriched in red blood cell (RBC)–specific features, such as metal ion transport and primitive erythrocyte differentiation (Figure 2B). Similarly, presumptive target genes of the dynamic CTCF-binding sites in B cells, T cells, and monocytes were all significantly enriched in important cellular functions of their corresponding lineages (Figure 2B). To further assess the potential for dynamic CTCF-binding sites to impact human genetic traits, we calculated their enrichment of genetic variants associated with traits and phenotypes from public human genome-wide association study catalogs44,45 (Figure 2C). Dynamic CTCF-binding sites in erythroblasts were predominantly enriched for single-nucleotide polymorphisms (SNPs) associated with RBC traits, such as reticulocyte count (q = 1.3e–2) and mean corpuscular volume (q = 6.5e–5). Similarly, B-cell and T-cell dynamic CTCF-binding sites were enriched for genetic variants associated with autoimmune disease, such as lupus erythematosus (q = 1.2e–8), type 1 diabetes (q = 9.9e–4), and allergic asthma (q = 4.8e–3). Monocyte dynamic CTCF-binding sites were enriched for SNPs associated with macrophage migration (q = 2.9e–2). The enrichment of genetic variants in dynamic CTCF sites was also more significant than randomly selected binding sites of GATA1 and PU.1 (supplemental Figure 3D).
We next experimentally tested the functions of these dynamic CTCF-binding sites in HUDEP-2 cells, an immortalized human cell line that proliferates as immature RBC precursors and can be induced to undergo terminal erythroid maturation.29 Since dynamic CTCF sites are highly cell-type specific, we performed CTCF ChIP-seq using undifferentiated and differentiated HUDEP-2 cells and confirmed that >60% of dynamic sites detected in primary erythroid cells were recapitulated in HUDEP-2 cells (supplemental Figure 4A). We designed a pooled CRISPR-Cas9 library comprising 1188 guide RNAs (gRNAs) targeting the consensus CTCF motifs of 257 erythroid-dynamic CTCF-binding sites and 100 control nontarget gRNAs. We delivered the packaged gRNA lentiviral vectors to cas9-expressing HUDEP-2 cells and measured the abundance of each gRNA during erythroblast proliferation and differentiation by high-throughput sequencing (Figure 2D). The gRNAs with differential representation in HUDEP-2 cells during an 8-day expansion represented erythroid-dynamic CTCF-binding sites that affect survival and/or proliferation of immature erythroblasts. Additionally, we induced terminal maturation for 5 days and fractionated cells according to expression of the late-stage erythroid marker Band3. gRNAs that are differentially expressed in Band3+ vs Band3− erythroblasts indicate CTCF-binding sites that regulate erythroid maturation. We identified 158 erythroid-dynamic CTCF-binding sites significantly (false discovery rate [FDR] < 0.05) affecting proliferation and 70 sites affecting differentiation, with 56 of these sites affecting both processes (Figure 2E; supplemental Figure 4B). In summary, we tested 257 out of 378 erythroid-dynamic CTCF sites, among which two-thirds (172/257 = 67%) were involved in erythroid cell proliferation, differentiation, or both. These phenotypes obtained by directed mutagenesis demonstrate the functional importance of a large majority of dynamic CTCF-binding sites.
Epigenetic and 3D chromatin features associated with dynamic CTCF occupancy
We next focused on the lineage-specific CTCF-bound sites observed during erythropoiesis to investigate the epigenetic features that are associated with their dynamic binding. We defined the 378 sites with significantly increased CTCF occupancy during differentiation from HSPCs to erythroblasts as gained occupancy sites (GOSs). We also defined the 1375 sites bound strongly by CTCF in HSPCs, but not erythroid cells, as lost occupancy sites (LOSs). Presumptive target genes for LOSs were enriched in nonerythroid biological processes such as neutrophil degranulation, T-cell activation, and lymphocyte differentiation. These sites may be involved in suppression of alternative lineages during erythropoiesis. For comparison, 7094 CTCF-binding sites at which occupancy did not change (adjusted P value > .5) in HSPCs and erythroblasts were designated as constitutive sites (CONs). We conducted the assay for transposase-accessible chromatin using sequencing (ATAC-seq)46 to measure chromatin accessibility in HSPCs and erythroid cells. Erythroid-specific GOSs were depleted in ATAC-seq signals in HSPCs and acquired these signals during erythroid differentiation, indicating that transitions from closed to open chromatin states were associated with CTCF binding. Conversely, the chromatin around LOSs was open in HSPCs and closed in erythroblasts (Figure 3A). The active marker H3K27ac displayed a similar pattern to the ATAC-seq signal for the GOSs and LOSs (Figure 3A). In contrast, only low levels of H3K27me3 were observed at the dynamic CTCF-binding sites in both HSPCs and erythroblasts (Figure 3A). Therefore, polycomb repressive complexes47 do not play a role in regulating CTCF-associated chromatin accessibility during erythroid differentiation. In contrast to GOSs and LOSs, the CONs showed similar epigenetic signals between HSPCs and erythroblasts (supplemental Figure 4C).

Epigenetic and 3D chromatin features of dynamic CTCF occupancy. (A) Heatmap showing the signals of ATAC-seq, H3K27ac, and H3K27me3 around the 20-kb windows centered on the peak summits of GOSs (top) and LOSs (bottom) in HSPCs and erythroblasts. (B) Heatmap showing the methylation levels of CpG sites within the CTCF motifs in HSPC and erythroblast dynamic sites. Each row represents 1 CpG site. Left panel represents the CpG sites in GOSs. Right panel represents the CpG sites in LOSs. (C) Aggregated distribution of different groups of CTCF-binding sites within a 2-Mb window of the TAD boundary in erythroblasts identified by Hi-C. (D) Pie chart showing the proportion of CTCF peaks overlapping with the anchors of chromatin loops identified by H3K27ac HiChIP using HSPC differentiated erythroblasts from the same donor. (E) Box plot showing the distribution of the number of loops per anchor region for GOSs and CONs in erythroblasts.
Epigenetic and 3D chromatin features of dynamic CTCF occupancy. (A) Heatmap showing the signals of ATAC-seq, H3K27ac, and H3K27me3 around the 20-kb windows centered on the peak summits of GOSs (top) and LOSs (bottom) in HSPCs and erythroblasts. (B) Heatmap showing the methylation levels of CpG sites within the CTCF motifs in HSPC and erythroblast dynamic sites. Each row represents 1 CpG site. Left panel represents the CpG sites in GOSs. Right panel represents the CpG sites in LOSs. (C) Aggregated distribution of different groups of CTCF-binding sites within a 2-Mb window of the TAD boundary in erythroblasts identified by Hi-C. (D) Pie chart showing the proportion of CTCF peaks overlapping with the anchors of chromatin loops identified by H3K27ac HiChIP using HSPC differentiated erythroblasts from the same donor. (E) Box plot showing the distribution of the number of loops per anchor region for GOSs and CONs in erythroblasts.
Previous studies showed that CpG DNA methylation in CTCF motifs prevents CTCF occupancy.48 Therefore, we examined the relationship between CpG methylation changes and CTCF occupancy at its consensus motif during erythropoiesis by comparing whole-genome bisulfite sequencing data generated by the BLUEPRINT consortium.49 The mean CpG methylation levels changed significantly in the CTCF motifs of the dynamic binding sites (P = 4.01e–12, Wilcoxon test; supplemental Figure 4D). Despite these significant global changes, the methylation levels of a large proportion of CpG sites within CTCF motifs were unchanged (Figure 3B). Therefore, CpG methylation may regulate dynamic CTCF occupancy at some sites during erythropoiesis, but it is unlikely to be a universal determinant.
TADs maintain insulated chromosomal neighborhoods for interactions between lineage-specific genes and their regulatory elements.8 CTCF-binding sites are highly enriched at TAD boundaries and are essential for maintaining their structures.50 However, when we searched for an association between dynamic CTCF-binding sites and TAD boundaries in erythroid cells,36 we found that the dynamic sites were not enriched at TAD boundaries (Figure 3C). This result suggests that, unlike constitutive CTCF-binding sites, the dynamic CTCF-binding sites do not function by maintaining TADs.
Because dynamic CTCF-binding sites are frequently co-occupied by lineage-specific master TFs and associated with H3K27ac signals, we hypothesized that they are involved in the CRE interactome (ie, the spatial interactions among enhancers and promoters). To test this hypothesis, we first used HiChIP30,31 to profile chromatin conformation in a protein-centric manner, focusing on H3K27ac in CD34+ HSPC-derived erythroblasts. HiChIP identified 70% of conventional H3K27ac ChIP-seq peaks and 427 052 (FDR < 0.05) CRE loops in erythroblasts (supplemental Figure 4E). We then superimposed the dynamic CTCF-binding sites with the CRE interactome. Approximately 60% of GOSs overlapped with anchors of the enhancer loops. In contrast, only 22% of constitutive CTCF peaks overlapped these anchors (Figure 3D). Loop anchors that overlapped the dynamic CTCF-binding sites were involved in significantly more CRE interactions (P = 2.2e–16, 2-tailed t test), indicating that they are located within the hubs of the active regulatory elements (Figure 3E). This conclusion still held when compared with constitutive CTCF sites with similar H3K27ac enrichment (supplemental Figure 4F).
Together, these results show that dynamic CTCF-binding sites had little involvement in maintaining TADs; rather, they appeared to be directly involved in CRE interactions.
Disruption of erythroid-dynamic CTCF occupancy leads to abnormal erythropoiesis
The peak with the most significant change in CTCF occupancy during erythropoiesis is located 24 kb downstream of the RBM38 gene (Figure 4A). RBM38 facilitates a unique alternative splicing program associated with erythroid terminal maturation.19,51 This dynamic CTCF site is also located within the same linkage disequilibrium block of a common SNP rs910758, which is associated with the size and number of circulating RBCs. Similar dynamic CTCF-binding sites that are colocalized with GATA1 and regulate important erythroid genes, like those encoding membrane hemoprotein CYB5A,52 iron-sulfur cluster assembly protein ISCA1,53 iron transporter SLC25A37,54 and mechanotransduction protein FAM38A,55 are presented in supplemental Figure 5.

Disrupting dynamic CTCF binding leads to abnormal hematopoiesis. (A) Signal tracks for CTCF and GATA1 ChIP-seq and ATAC-seq at the RBM38 gene locus in HSPCs and erythroblasts. The dynamic site that was genome edited to remove the CTCF motif is highlighted. (B) CTCF ChIP-seq signals in WT HUDEP-2 cells (WT) and HUDEP-2 cells with a 19-bp deletion of the CTCF motif near RBM38 promoter (mut) after 3 days of inducted erythroid maturation. The dynamic CTCF site that harbors the deleted motif is highlighted. (C) Representative flow cytometric plot of Band3 and CD49d expression in gated CD235a+ WT HUDEP-2 cells and 2 mut clones after 3 days of induced maturation. (D) Cell pellets of WT HUDEP-2 cells and 2 mut clones after 4 days of induced maturation. (E) Relative expression level of HBB in WT HUDEP-2 cells and 2 mut clones, as compared with GAPDH before differentiation (D0) and 3 days after induced maturation (D3). D0, n = 2; D3, n > 3. *P < .05, paired 1-tailed t test. (F) Representative flow cytometric plot of annexin V and propidium iodide expression in WT HUDEP-2 cells and 2 mut clones after 3 days of induced maturation. (G) Genome-edited CD34+ cells were grown in erythroid differentiation medium for 12 days. Representative flow cytometric plots of Band3 and CD49d levels in gated CD235a+ cells. (H) Genome-edited CD34+ cells were seeded onto methylcellulose. Box plot shows the numbers of burst-forming unit–erythroid colonies after 14 days in culture. n = 6, *P < .01, unpaired 2-tailed t test. NT, nontargeting control gRNA; PI, propidium iodide.
Disrupting dynamic CTCF binding leads to abnormal hematopoiesis. (A) Signal tracks for CTCF and GATA1 ChIP-seq and ATAC-seq at the RBM38 gene locus in HSPCs and erythroblasts. The dynamic site that was genome edited to remove the CTCF motif is highlighted. (B) CTCF ChIP-seq signals in WT HUDEP-2 cells (WT) and HUDEP-2 cells with a 19-bp deletion of the CTCF motif near RBM38 promoter (mut) after 3 days of inducted erythroid maturation. The dynamic CTCF site that harbors the deleted motif is highlighted. (C) Representative flow cytometric plot of Band3 and CD49d expression in gated CD235a+ WT HUDEP-2 cells and 2 mut clones after 3 days of induced maturation. (D) Cell pellets of WT HUDEP-2 cells and 2 mut clones after 4 days of induced maturation. (E) Relative expression level of HBB in WT HUDEP-2 cells and 2 mut clones, as compared with GAPDH before differentiation (D0) and 3 days after induced maturation (D3). D0, n = 2; D3, n > 3. *P < .05, paired 1-tailed t test. (F) Representative flow cytometric plot of annexin V and propidium iodide expression in WT HUDEP-2 cells and 2 mut clones after 3 days of induced maturation. (G) Genome-edited CD34+ cells were grown in erythroid differentiation medium for 12 days. Representative flow cytometric plots of Band3 and CD49d levels in gated CD235a+ cells. (H) Genome-edited CD34+ cells were seeded onto methylcellulose. Box plot shows the numbers of burst-forming unit–erythroid colonies after 14 days in culture. n = 6, *P < .01, unpaired 2-tailed t test. NT, nontargeting control gRNA; PI, propidium iodide.
To investigate in detail the function of this prominent dynamic CTCF site, we generated HUDEP-2 single clones with a homozygous 19-bp CTCF motif deletion in the dynamic CTCF site downstream of the RBM38 gene (supplemental Figure 6A). Targeted DNA sequencing confirmed the deletion (supplemental Figure 6B), and ChIP-seq revealed loss of CTCF occupancy in the mutant cells (Figure 4B). After 3 days of induced maturation, the mutant clones showed aberrant maturation, indicated by increased expression of Band3 (69% to 72%) compared with wild-type (WT) cells (25%) (Figure 4C) and reduced hemoglobinization and HBB expression (Figure 4D-E). In addition, the mutant cells exhibited an ∼2.5-fold increase in apoptosis compared with controls (∼25% vs 10%; Figure 4F). Consistent results were observed in 2 independent mutant clones for all assays, which indicates the results were not affected by clonal variability in HUDEP-2 cells.
To validate our findings in primary erythroblasts, we electroporated peripheral blood–mobilized CD34+ HPSCs with Cas9-gRNA ribonucleoprotein (RNP) complex targeting the RBM38 CTCF GOS, followed by culture under conditions to support erythroid differentiation. Targeted deep sequencing of the genomic DNA extracted from the bulk cells indicated that the overall editing efficiency is >90%, which led to the disruption of the target CTCF-binding site in 50% of cells (supplemental Figure 6C-D). Consistent with our findings in HUDEP-2 cells clones, disruption of the RBM38 dynamic CTCF-binding site increased the fraction of Band3-expressing cells during erythroid differentiation (Figure 4G). After seeding into semisolid methylcellulose cultures, HSPCs with perturbated CTCF binding produced 40% fewer burst-forming unit–erythroid colonies compared with controls (Figure 4H) (P < .01, Student t test).
Dynamic CTCF occupancy modulates CRE interactions
To explore the regulatory mechanisms involving this dynamic CTCF site, we first assigned it to its target genes. H3K27ac HiChIP identified multiple genomic loci interacting with this CTCF site, of which the RBM38 gene promoter showed the strongest interaction (supplemental Figure 7A-B). Moreover, deletion of the CTCF motif in HUDEP-2 cells reduced RBM38 expression by nearly 50% compared with the WT level after 3-day induced erythroid maturation (Figure 5A). These results indicate that dynamic CTCF occupancy at this site is involved in regulating the activity of the RBM38 promoter.

Regulatory mechanism of dynamic CTCF binding. (A) Relative expression of RBM38 in WT HUDEP-2 cells and 2 mut clones, as compared with HPRT1 before differentiation (D0) and 3 days after induced maturation (D3). D0, n = 2; D3, n > 3. **P < .01, paired 2-tailed t test. (B) ChIP-seq signal tracks of GATA1 and H3K27ac in WT HUDEP-2 cells and 2 mut clones after 3 days of induced maturation. The dynamic CTCF site that harbors the deleted motif is highlighted. (C) Capture Hi-C results with baits targeting the promoter of the RBM38 gene in WT HUDEP-2 cells and a mut clone before differentiation (D0) and 3 days after induced maturation (D3). The targeted CTCF-binding site is highlighted in pink. (D) Chromatin loops identified by H3K27ac HiChIP that are anchored within the targeted dynamic CTCF-binding site in WT HUDEP-2 cells and a mutant clone after 3 days of induced maturation. The top panel shows a 2.8-Mb window, and the bottom panel zooms in on a 265-kb window. The targeted CTCF-binding site is highlighted. (E) Schematic model of the regulatory mechanism of dynamic CTCF-binding site. chr, chromosome.
Regulatory mechanism of dynamic CTCF binding. (A) Relative expression of RBM38 in WT HUDEP-2 cells and 2 mut clones, as compared with HPRT1 before differentiation (D0) and 3 days after induced maturation (D3). D0, n = 2; D3, n > 3. **P < .01, paired 2-tailed t test. (B) ChIP-seq signal tracks of GATA1 and H3K27ac in WT HUDEP-2 cells and 2 mut clones after 3 days of induced maturation. The dynamic CTCF site that harbors the deleted motif is highlighted. (C) Capture Hi-C results with baits targeting the promoter of the RBM38 gene in WT HUDEP-2 cells and a mut clone before differentiation (D0) and 3 days after induced maturation (D3). The targeted CTCF-binding site is highlighted in pink. (D) Chromatin loops identified by H3K27ac HiChIP that are anchored within the targeted dynamic CTCF-binding site in WT HUDEP-2 cells and a mutant clone after 3 days of induced maturation. The top panel shows a 2.8-Mb window, and the bottom panel zooms in on a 265-kb window. The targeted CTCF-binding site is highlighted. (E) Schematic model of the regulatory mechanism of dynamic CTCF-binding site. chr, chromosome.
This reduction in RBM38 expression could occur by the deletion decreasing either the intrinsic activity of the enhancer or affecting the connectivity between the promoter and its associated enhancer. In order to distinguish between these 2 mechanisms, we examined the impact of deleting the CTCF motif on occupancy of other TFs. ChIP-seq revealed only a modest decrease in the occupancy of GATA1 and almost no change in signals of the active histone modification marker (H3K27ac) after deletion of the 19-bp core CTCF motif (Figure 5B), indicating that enhancer activity remained intact. Therefore, we investigated whether dynamic CTCF occupancy affected interactions between distal enhancers and the RBM38 promoter. We conducted capture Hi-C with baits targeting the RBM38 promoter (supplemental Table 2) to quantitatively assess its interactions with distal CREs. Under self-renewal conditions, we observed enhancer-promoter interactions in both WT and mutant cells lacking the core CTCF motif. After 3 days of induced erythroid maturation, this interaction became even stronger in WT cells but was dramatically weakened in mutant cells (Figure 5C), suggesting that CTCF occupancy is required to maintain this promoter-enhancer interaction during differentiation. To further understand how deletion of the GOS-associated CTCF motif affects its interactions with other genomic loci, we conducted H3K27ac HiChIP in differentiated WT and mut HUDEP-2 cells. At the global level, interactions among CREs were similar between WT and mutant HUDEP-2 cells (supplemental Figure 7C). However, the CTCF-deleted motif region lost 85% (12/14) of its interactions with distal genomic loci (supplemental Figure 7A). Instead, a short distance loop with another GATA1 binding site 5 kb upstream showed the strongest interaction (Figure 5D; supplemental Figure 7A-B) with this dynamic CTCF site. These findings suggest that CTCF occupancy is essential to maintain the 3D organization of RBM38 with its associated regulatory elements during erythroid maturation.
Discussion
The CTCF protein has multiple functions in all cell types and is required for response to stress stimulation56,57 and the viability of early embryos.58 Conditional gene ablation has demonstrated essential roles for CTCF in muscle59 and neurons.60 However, CTCF knockout studies cannot discriminate between generalized “housekeeping” functions and lineage-specific activities within the same cell types. To fully and precisely define the repertoire of CTCF activities in specific tissues, it is necessary to examine its effector CREs during the course of cellular differentiation and maturation. Several lines of evidence indicate that CTCF provides an insulated environment for cell-type–specific transcriptional regulation. For example, erythroid-specific interactions between CTCF-binding sites regulate the expression of α-globin (HBA) genes.61 In this model, the CTCF-binding sites themselves do not directly interact with enhancers. Other TFs such as YY1 have been shown to play an important role to mediate promoter-enhancer interactions.62 Other studies indicate that CTCF may contribute to promoter-enhancer interactions in certain genomic loci.63-67
We interrogated lineage-specific CTCF functions in multipotent hematopoietic progenitors and their progeny cells. Our results showed that CTCF can directly occupy enhancer sequences in a lineage-specific manner. This lineage-specific regulatory function of CTCF is different from that described in previous models. Specifically, the CTCF-binding sites are dynamic and not related to TAD domains. Dynamic CTCF occupancy is strongly associated with chromatin accessibility and colocalization of lineage-specific master TFs. Therefore, it is possible that these or other TFs act as pioneer factors to open previously closed chromatin to facilitate lineage-specific CTCF binding to its cognate DNA elements (Figure 5E). This process may be similar to “assisted loading,”68,69 whereby the binding of master TFs leads to nucleosome displacement and increases the accessibility of surrounding chromatin, which can expose a previously inaccessible CTCF site. Under this scenario, epigenetic changes during differentiation regulate CTCF occupancy at specific genomic loci, which in turn control local interactions among CREs. We showed that selective elimination of CTCF binding to DNA within an essential erythroid CRE redirects its long-range DNA interactions, thereby reducing gene expression and causing aberrations in erythroid maturation. In contrast, loss of CTCF binding to this CRE did not alter occupancy of erythroid TFs. Importantly, our directed mutagenesis experiments allowed us to dissociate the impacts of CTCF vs other TFs at this enhancer, since only CTCF binding was affected.
Further studies are required to fully define how CTCF mediates the chromatin interactions of associated regulatory elements. However, our observations suggest one possible model (Figure 5E). The dynamic CTCF-binding sites usually interact with multiple regulatory elements, and disruption of CTCF binding not only affects enhancer-promoter interactions but also dismantles nearly all of the 3D chromatin interactions with CTCF-associated regulatory sequences. A plausible explanation for these observations is that CTCF recruits associated lineage-specific enhancers to active loci with a high concentration of the transcriptional machinery, such as a TF or membraneless organelles formed through phase separation. Without CTCF occupancy, those enhancer elements do not sustain their interactions with these transcriptionally active loci and other regulatory elements (Figure 5E).
The mechanism underlying the cooperation of CTCF and lineage-specific TFs needs to be further investigated. However, the analysis of the distribution of CTCF and GATA1 motifs within the dynamic sites in erythroid cells provides some interesting insights. The distances between the 2 motifs spread over a broad range. This heterogeneity in distance suggested that the cooperation of the 2 TFs does not depend on a fixed distance. The fact that the distributions are similar on each side of the CTCF motif also argues against a direct, high-affinity interaction between CTCF and GATA1, since those types of interactions should differ depending on the relative spatial orientation of the 2 TFs along the DNA. This may explain why a majority (82%) of genome-wide GATA1 binding sites were not occupied by CTCF. The CTCF protein may interact with DNA differently at the dynamic sites compared with the constitutively bound sites. We found that the latter sites show enrichment for both the core CTCF-binding site motif and the upstream motif associated with greater stability of binding42 but that the upstream motif was depleted in the dynamic sites. Thus, the intrinsic affinity of CTCF may be lower for motifs at the dynamic sites compared with the CONs, which could facilitate the changes in occupancy during differentiation. In the future, identifying more comprehensively how CTCF interacts with locus-specific chromatin-regulating protein complexes at specific dynamic sites using recently developed biotinylated dCas9 gRNA–based technologies70,71 may also provide important information to better understand the underlying mechanism.
The ChIP-seq, ATAC-seq, HiChIP, and capture Hi-C data reported in this article have been deposited in the Gene Expression Omnibus database (accession number GSE131055).
The online version of this article contains a data supplement.
The publication costs of this article were defrayed in part by page charge payment. Therefore, and solely to indicate this fact, this article is hereby marked “advertisement” in accordance with 18 USC section 1734.
Acknowledgments
Ryo Kurita and Yukio Nakamura (Cell Engineering Division, RIKEN BioResource Center, Tsukuba, Japan) provided the HUDEP-2 cells. Xiuli An (Laboratory of Membrane Biology, New York Blood Center) provided the Band3 antibody. The authors thank the St. Jude Children’s Research Hospital Flow Cytometry core facility for cell sorting, the Hartwell Center core facility for providing the high-throughput sequencing, and the Center for Advanced Genome Engineering for targeted deep sequencing.
This work was funded by National Institutes of Health, National Institute of General Medical Sciences grant R35GM133614 (Y.C.) and National Institutes of Health, National Institute of Diabetes and Digestive and Kidney Diseases grant R24DK106766 (M.J.W., R.C.H., and Y.C.).
The content is solely the responsibility of the authors and does not necessarily represent the official views of the National Institutes of Health.
Authorship
Contribution: Q.Q. and Y.C. designed the experiments, analyzed data, and wrote the manuscript; Q.Q. and Y.H. performed ChIP-seq with help from R.F.; Q.Q. performed ATAC-seq and capture Hi-C; Q.Q. and L.C. performed HiChIP; Q.Q. generated the knockin cell line under the guidance of S.P.-M.; L.C. conducted CD34+ cell genome editing and differentiation with help from P.X.; Q.Q. conducted the CRISPR-Cas9 screen with help from T.Y.; Q.Q., Y.C., X.T., Y.L., and D.S. performed bioinformatics analyses with help from X.Z.; M.J.W. and R.C.H. provided conceptual advice; Y.C. supervised the study; and all authors discussed the results and contributed to preparing the manuscript.
Conflict-of-interest disclosure: The authors declare no competing financial interests.
Correspondence: Yong Cheng, MS 341, Room D3007F, St. Jude Children’s Research Hospital, 262 Danny Thomas Place, Memphis, TN 38105-3678; e-mail: yong.cheng@stjude.org.

This feature is available to Subscribers Only
Sign In or Create an Account Close Modal