

Key Points
MT2 is able to function independently of its proteolytic activity, likely by binding to Hjv and Hfe.
Interaction with substrates is pivotal for MT2 suppression of hepcidin expression.

Abstract
Matriptase-2 (MT2), encoded by TMPRSS6, is a membrane-anchored serine protease that plays a key role in suppressing hepatic hepcidin expression. MT2 is synthesized as a zymogen and undergoes autocleavage for activation. Previous studies suggest that MT2 suppresses hepcidin by cleaving hemojuvelin and other components of the bone morphogenetic protein–signaling pathway. However, the underlying mechanism is still debatable. Here we dissected the contributions of the nonproteolytic and proteolytic activities of Mt2 by taking advantage of Mt2 mutants and Tmprss6−/− mice. Studies of the protease-dead full-length Mt2 (Mt2S762A) and the truncated Mt2 that lacks the catalytic domain (Mt2mask) indicate that the catalytic domain, but not its proteolytic activity, was required for Mt2 to suppress hepcidin expression. This process was likely accomplished by the binding of Mt2 ectodomain to Hjv and Hfe. We found that Mt2 specifically cleaved the key components of the hepcidin-induction pathway, including Hjv, Alk3, ActRIIA, and Hfe, when overexpressed in hepatoma cells. Nevertheless, studies of a murine iron-refractory iron-deficiency anemia–causing mutant (Mt2I286F) in the complement protein subcomponents C1r/C1s, urchin embryonic growth factor, and bone morphogenetic protein 1 domain indicate that Mt2I286F can be activated, but it exhibited a largely compromised ability to suppress hepcidin expression. Coimmunoprecipitation analysis revealed that Mt2I286F, but not Mt2S762A, had reduced interactions with Hjv, ActRIIA, and Hfe. In addition, increased expression of a serine protease inhibitor, the hepatocyte growth factor activator inhibitor-2, in the liver failed to alter hepcidin. Together, these observations support the idea that the substrate interaction with Mt2 plays a determinant role and suggest that the proteolytic activity is not an appropriate target to modulate the function of MT2 for clinical applications.
Introduction
Matriptase-2 (MT2) is a type II transmembrane serine protease that is encoded by the TMPRSS6 gene in humans and the Tmprss6 gene in mice.1 Tmprss6 is expressed predominantly in hepatocytes, and MT2 is a key suppressor for hepatic hepcidin.1-4 Mutations in the TMPRSS6 gene result in inappropriately high hepcidin expression and cause iron-refractory iron-deficiency anemia (IRIDA).3-5 Similar phenotypes are also reported in mouse models with a global Tmprss6 knockout (Tmprss6−/−), a truncated Tmprss6 that lacks the coding sequence for the catalytic domain (Mt2mask), or an Ile286Phe substitution (Mt2I286F) in the complement protein subcomponents C1r/C1s, urchin embryonic growth factor, and bone morphogenetic protein 1 (CUB) domain (Figure 1A).6-10 Hepcidin inhibits iron efflux from duodenal epithelial cells, macrophages, and hepatocytes into the circulation by directly occluding the plasma membrane iron exporter, ferroportin, as well as by inducing its internalization and degradation.11,12 Lack of hepcidin causes juvenile hemochromatosis.13,14
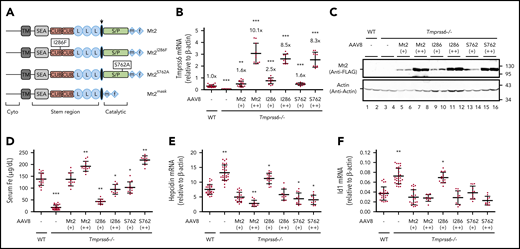
Suppression of hepcidin expression by Mt2S762A , but not by Mt2I286F , in Tmprss6−/− mice. Eight-week old Tmprss6−/− mice of both sexes were intraperitoneally injected with AAV8-Mt2, Mt2S762A, or Mt2I286F at ∼8 × 10¹¹ (+) and ∼4 × 10¹² (++) viral genome-particles per mouse, or phosphate-buffered saline as control (–). Animals were euthanized at 3 weeks’ postinjection for analysis. Age-matched wild-type (WT) littermates on the same background were included as additional controls. Each group consisted of at least 10 animals with similar numbers of male and female mice. (A) Diagrams of Mt2 constructs with C-terminal FLAG/MYC tag. The arrow indicates the predicted cleavage activation site. Catalytic, serine protease (S/P) catalytic domain; Cyto, cytoplasmic domain; f, FLAG; L, low-density lipoprotein receptor class A domain; m, MYC; SEA, sea urchin sperm protein, enteropeptidase agrin; TM, transmembrane domain. (B) qRT-PCR analysis of hepatic Tmprss6 mRNA. The relative levels to endogenously expressed Tmprss6 mRNA in WT mice were also presented. (C) A representative image of western blot analysis for transduced Mt2 protein in the liver extracts (250 µg protein) by using an anti-FLAG antibody. β-actin was used as a loading control. (D) Serum iron (Fe) concentrations. (E-F) qRT-PCR analysis of hepatic hepcidin and Id1 mRNA. All qRT-PCR results are expressed as the amount relative to that of β-actin for each sample. Data are expressed as the mean ± standard deviation. One-way analysis of variance was used to analyze the data relative to WT mice. *P <.05; **P <.01; ***P <.001.
Suppression of hepcidin expression by Mt2S762A , but not by Mt2I286F , in Tmprss6−/− mice. Eight-week old Tmprss6−/− mice of both sexes were intraperitoneally injected with AAV8-Mt2, Mt2S762A, or Mt2I286F at ∼8 × 10¹¹ (+) and ∼4 × 10¹² (++) viral genome-particles per mouse, or phosphate-buffered saline as control (–). Animals were euthanized at 3 weeks’ postinjection for analysis. Age-matched wild-type (WT) littermates on the same background were included as additional controls. Each group consisted of at least 10 animals with similar numbers of male and female mice. (A) Diagrams of Mt2 constructs with C-terminal FLAG/MYC tag. The arrow indicates the predicted cleavage activation site. Catalytic, serine protease (S/P) catalytic domain; Cyto, cytoplasmic domain; f, FLAG; L, low-density lipoprotein receptor class A domain; m, MYC; SEA, sea urchin sperm protein, enteropeptidase agrin; TM, transmembrane domain. (B) qRT-PCR analysis of hepatic Tmprss6 mRNA. The relative levels to endogenously expressed Tmprss6 mRNA in WT mice were also presented. (C) A representative image of western blot analysis for transduced Mt2 protein in the liver extracts (250 µg protein) by using an anti-FLAG antibody. β-actin was used as a loading control. (D) Serum iron (Fe) concentrations. (E-F) qRT-PCR analysis of hepatic hepcidin and Id1 mRNA. All qRT-PCR results are expressed as the amount relative to that of β-actin for each sample. Data are expressed as the mean ± standard deviation. One-way analysis of variance was used to analyze the data relative to WT mice. *P <.05; **P <.01; ***P <.001.
Hepatic hepcidin expression is induced via the bone morphogenetic protein (BMP)-signaling pathway.15-17 BMP signaling is initiated upon the binding of BMP ligands to type I and type II BMP receptors. Hepatocytes use a selective set of BMP receptors, including ALK2, ALK3, ActRIIA, and BMPR2, to induce hepcidin expression.18,19 Importantly, a normal range of hepcidin expression also requires the involvement of other plasma membrane proteins such as hemojuvelin (HJV), hemochromatosis protein (HFE), transferrin receptor-2 (TfR2), and neogenin.3 Mutations in the HJV, HFE, or TfR2 gene in humans all reduce hepcidin expression in the liver and result in iron overload.14,20
MT2 is synthesized as a zymogen. The activation is predicted to occur on the cell surface by autocleavage at the cleavage activation site (Figure 1A).1,21,22 In transfected cells, activated MT2 cleaves multiple components of the hepcidin induction pathway that include HJV, BMP receptors, Hfe, and Tfr2.8,9,23 In vivo studies show that a functional Mt2 requires the transmembrane domain and the entire ectodomain.24 However, whether Mt2 suppresses hepcidin solely by cleaving Hjv as reported by earlier studies8,23 remains unknown.
In humans, the IRIDA-causing mutations in MT2 are located throughout the entire extracellular domain.10,25-30 Interestingly, at least 3 mutants in the CUB domains (R271Q, T287N, and G442R) traffic to the cell surface and cleave HJV similarly to wild-type MT2.26,27,31 The mouse IRIDA-causing mutation (I286F) also maps to this region.10
The current study investigated the roles of nonproteolytic and proteolytic activities for the function of Mt2 by using Mt2 mutants, Tmprss6−/− mice, and hepatoma cells. The results show that the nonproteolytic activity plays an indispensable role in suppressing hepcidin expression.
Materials and methods
Complementary DNA constructs
All mouse ORF constructs were the same as described previously (Table 1).9,24 Most of the constructs were engineered with a FLAG/MYC epitope on the C terminus for the sensitive immunodetection of expressed proteins by a horseradish peroxidase (HRP)-conjugated anti-FLAG antibody. The generation of Mt2 mutants and adeno-associated virus-8 (AAV8) vectors32 are described in the supplemental Materials and methods (available on the Blood Web site).
Mouse ORF or mutant constructs used for transfection and generation of AAV8 vectors, as well as the antibodies used for western blot analysis
| Mouse constructs | Encoded proteins | Tag epitope | Antibodies used for western blot analysis |
|---|---|---|---|
| ActRIIA | Type I transmembrane protein | C-terminal FLAG/MYC | Anti-FLAG |
| Alk2 | Type I transmembrane protein | C-terminal FLAG/MYC | Anti-FLAG |
| Alk3 | Type I transmembrane protein | C-terminal FLAG/MYC | Anti-FLAG |
| Bmpr2 | Type I transmembrane protein | C-terminal FLAG/MYC | Anti-FLAG |
| Hai-2 | Type I transmembrane protein | C-terminal FLAG/MYC | Anti-FLAG |
| Hfe | Type I transmembrane protein | C-terminal FLAG/MYC | Anti-FLAG |
| Hjv | GPI-anchored membrane protein | N-terminal 3xFLAG | Anti-FLAG and anti-HJV |
| Mt2 | Type II transmembrane protein | C-terminal FLAG/MYC | Anti-FLAG |
| Mt2I286F | Type II transmembrane protein | C-terminal FLAG/MYC | Anti-FLAG |
| Mt2mask | Type II transmembrane protein | C-terminal FLAG/MYC | Anti-FLAG |
| Mt2S762A | Type II transmembrane protein | C-terminal FLAG/MYC | Anti-FLAG |
| Tfr2 | Type II transmembrane protein | No tag | Anti-Tfr2 |
| Zip14 | Membrane protein with 7 transmembrane segments | C-terminal 3xFLAG | Anti-FLAG |
Animal studies
All animal procedures were approved by the Department of Comparative Medicine, Oregon Health & Science University. We purchased heterozygous Tmprss6+/− mutant mice on B6/129 background.9 Both wild-type and homozygous Tmprss6−/− mice were generated by breeding Tmprss6+/− mice on mixed background. All Tmprss6−/− mice used in the studies were within 2 generations of breeding and had a similar degree of iron deficiency and anemia with no obvious sex-related differences.9
Eight-week old Tmprss6−/− mice were intraperitoneally injected with AAV8-Mt2, AAV8-Mt2S762A, or AAV8-Mt2I286F. The AAV8 vector alone has no effect on iron homeostasis in mice.33,34 Injection of phosphate-buffered saline was included as a control. Mice were euthanized 3 weeks after injection for analysis. Age, sex, and background-matched wild-type littermates were included as additional controls. Injection of AAV8-Mt2mask into Tmprss6−/− mice was performed as in our previous studies.24 The analysis was described in the supplemental Materials and methods. All animals were fed a PicoLab Laboratory Rodent Diet 5L0D containing 240 parts per million iron (LabDiet).
Cell lines, transfection, and immunoprecipitation
Hep3B and HEK293 cells were obtained from ATCC. Transient cotransfection was used to determine the cleavage of Alk2, Alk3, ActRIIA, Bmpr2, Hjv, Hfe, and Tfr2 by mutated or truncated Mt2. The detailed procedures are described in the supplemental Materials and methods.
Statistical analysis
One-way analysis of variance and Tukey’s posttest were used to analyze the data from the animal studies.
Results
In vivo studies of Mt2S762A and Mt2I286F indicate that the catalytic and CUB domains but not the proteolytic activity play pivotal roles in the suppression of hepcidin expression
To determine the contributions of the nonproteolytic activity of Mt2 to its biological function, Tmprss6−/− mice were transduced with AAV8 vectors containing the coding sequence for either the protease-dead Mt2S762A or the mouse IRIDA-causing mutant Mt2I286F for replacement studies. Wild-type Mt2 was used as a positive control. Previous studies showed that this vector is able to specifically target the gene of interest into the hepatocytes and that the expression of introduced gene is evenly distributed in hepatocytes throughout the liver,35 which is similar to the homogenous distribution of native Tmprss6 messenger RNA (mRNA) in hepatocytes.36 Because AAV8-transduced complementary DNA rarely integrates into the genome, animals were euthanized at 3 weeks after viral administration for analysis to avoid the dilution of introduced exogenous DNA due to hepatocyte turnover. The expression levels of exogenously administered Mt2 in the liver were analyzed by using quantitative reverse transcription polymerase chain reaction (qRT-PCR) and western blot. The mRNA levels of wild-type Mt2, Mt2S762A, and Mt2I286F were modestly higher than those of wild-type mice in the low-dose groups, and ∼10.1, 8.5, and 8.3-fold higher in the high-dose groups, respectively (Figure 1B). Because no available antibodies were able to sensitively detect endogenous Mt2 protein, we engineered a FLAG/MYC epitope on the C terminus of the Mt2 constructs (Table 1). All Mt2 forms were detected in the liver extracts at the expected molecular weights by western blot using an anti-FLAG antibody (Figure 1C, lanes 5-16). The relative protein levels between the low- and high-dose groups for Mt2, Mt2S762A, and Mt2I286F were proportional to mRNA levels.
Consistent with our previous studies,9,24 functional analysis revealed that expression of wild-type Mt2 at both doses was able to fully correct the low serum iron and high hepcidin expression status (Figure 1D-E), and it greatly ameliorated the anemia by significantly increasing the levels of hemoglobin, hematocrit, mean cell volume, and mean corpuscular hemoglobin (Table 2). Thus, the transgenic Mt2 acts similarly to the native Mt2. Interestingly, expression of the protease-dead Mt2S762A was able to rescue the defects of Tmprss6−/− mice comparable to that of wild-type Mt2. The parallel decrease in Id1 mRNA with hepcidin mRNA (Figure 1E-F) for both wild-type Mt2 and Mt2S762A indicate that they suppress hepcidin expression by inhibiting the BMP signaling, as previously reported.8 There was no significant reduction for the high red blood cell count in Tmprss6−/− mice expressing either wild-type Mt2 or Mt2S762A, likely due to the fact that the analysis was conducted at 3 weeks after viral administration and that the mouse red blood cell half-life is ∼22 days. In conjunction with our previous studies, which showed that Mt2mask lacked biological activity,24 these results indicate that the catalytic domain but not its proteolytic activity is necessary for Mt2 to suppress hepcidin expression.
Hematologic parameters for WT mice and Tmprss6−/− mice that express full-length or mutated Mt2 by AAV8 vectors
| Parameter | WT (n = 17) | Tmprss6−/− + PBS (n = 26) | Tmprss6−/−- + Mt2 (+) (n = 13) | Tmprss6−/− + Mt2 (++) (n = 13) | Tmprss6−/− + Mt2I286F (+) (n = 12) | Tmprss6−/− + Mt2I286F (++) (n = 10) | Tmprss6−/− + Mt2S762A (+) (n = 12) | Tmprss6−/− + Mt2S762A (++) (n = 10) |
|---|---|---|---|---|---|---|---|---|
| RBC, ×106/µL | 8.75 ± 0.41 | 10.65 ± 0.55*** | 10.82 ± 0.56*** | 10.38 ± 0.45*** | 10.86 ± 0.39*** | 10.78 ± 0.51*** | 10.55 ± 0.54*** | 10.16 ± 0.59*** |
| Hb, g/dL | 13.09 ± 0.51 | 8.42 ± 0.76*** | 11.88 ± 0.82** | 12.56 ± 0.80 | 9.74 ± 0.37*** | 12.01 ± 0.65** | 11.63 ± 0.64** | 12.55 ± 0.53 |
| HCT, % | 48.69 ± 2.72 | 36.76 ± 2.13*** | 48.55 ± 3.66 | 52.27 ± 3.89 | 39.87 ± 2.59*** | 49.35 ± 3.79 | 45.63 ± 3.69 | 50.42 ± 1.97 |
| MCV, fL | 55.21 ± 2.87 | 34.52 ± 2.45*** | 45.58 ± 2.79*** | 50.89 ± 4.45* | 36.91 ± 2.27*** | 46.47 ± 2.88*** | 43.4 ± 2.97*** | 51.04 ± 3.41* |
| MCH, pg | 14.98 ± 0.57 | 7.93 ± 0.85*** | 11.19 ± 1.08*** | 12.45 ± 1.17*** | 8.75 ± 0.86*** | 11.11 ± 0.86*** | 11.09 ± 0.88*** | 12.56 ± 0.96*** |
Data are presented as the mean ± standard deviation. One-way analysis of variance was used to analyze the data relative to wild-type (WT) mice.
Hb, hemoglobin; HCT, hematocrit; MCH, mean corpuscular hemoglobin; MCV, mean cell volume; RBC, red blood cells.
*P < .05; **P < .01; ***P < .001.
In contrast to Mt2S762A, expression of Mt2I286F in Tmprss6−/− mice displayed a largely compromised biological activity with a milder improvement of low serum iron, high hepcidin expression, and anemia at the low dose. A marked correction was detected only at the higher dose (Figure 1B-F; Table 2). These results validate the previous findings in animal studies37 and implicate the critical role of the CUB domain for the function of Mt2.
Mt2 cleaves multiple components of the hepcidin induction pathway in hepatoma cells
To seek insights into the mechanism by which Mt2S762A suppresses hepcidin expression, we first examined the substrates cleaved by wild-type Mt2 in Hep3B cells, a hepatoma cell line that does not endogenously express detectable TMPRSS6 mRNA by qRT-PCR (data not shown). Mt2mask was used as a negative control. Cleavage was indicated by a decrease of the cell surface levels of proteins and the detection of cleaved products in the conditioned medium (CM). Similar to our earlier studies in HEK293 cells9,24 that also lack endogenous TMPRSS6 mRNA (data not shown), Mt2 was able to decrease the cell surface levels of multiple components of the hepcidin induction pathway, including Hjv, Alk3, ActRIIA, Tfr2, Hfe (Figure 2A-E; lanes 2 and 4), and, to a lesser extent, Alk2 and Bmpr2 (supplemental Figure 1A-B). Hjv can be cleaved by Mt2 (at multiple arginine residues) and by the ubiquitously expressed furin convertase (at a single site) (Figure 2F).33,38-40 Our previous studies indicate that the cleavage of HJV by furin convertase is overridden by MT2-mediated cleavage.40 We used aprotinin, a serine protease inhibitor, to block Mt2-mediated cleavage. As shown in Figure 2A, a single furin-cleaved Hjv band migrating at ∼45 kDa was detected in the CM when Hjv was expressed with enhanced green fluorescent protein (EGFP) control (lane 2). In comparison, coexpression with Mt2 resulted in a marked decrease in furin-cleaved Hjv and the appearance of Mt2-cleaved Hjv fragments in CM (Figure 2A, lane 4). Similarly, we also detected the Mt2-cleaved Tfr2 in CM (Figure 2D, lane 4). The cleaved products for other substrates were not determined due to lack of appropriate antibodies. Consistent with our previous observations in HEK293 cells,24 inhibition of the serine protease activity by aprotinin abolished cleavage by Mt2 in Hep3B cells (Figure 2A-E, lanes 4 and 5). Because aprotinin is a membrane-impermeable inhibitor, it is likely that the Mt2-mediated substrate cleavage occurs after reaching the plasma membrane. In comparison, the lack of changes of substrate levels with cotransfection of EGFP by aprotinin (Figure 2A-E, lanes 2 and 3) supports the idea that Hep3B cells lack endogenous MT2 proteolytic activities.

Cleavage and stabilization of substrates by Mt2, the protease-dead Mt2S762A , and Mt2mask in Hep3B cells. (A) Mt2S762A but not Mt2mask increases cell surface Hjv. pCMV9-Hjv was cotransfected with an equal amount of pEGFP-N1 (EGFP), pCMV9-Mt2, Mt2S762A, or Mt2mask plasmid DNA into Hep3B cells. Approximately 30 hours’ posttransfection, fresh medium was changed with or without 10 µM aprotinin (AP). After another 24 hours of incubation, cell surface proteins were biotinylated at 4°C, followed by pull-down of the biotinylated proteins using streptavidin agarose beads. The eluted cell surface proteins, ∼10% of input lysate, and a fraction of concentrated CM were subjected to sodium dodecyl sulfate-polyacrylamide gel electrophoresis and immunodetection by using anti-FLAG antibody for input and cell surface Hjv, Mt2, and Mt2 mutants or by using rabbit anti-HJV antibody for CM Hjv. Each panel was cropped from the same image. Effects of Mt2, Mt2S762A, and Mt2mask on cell surface Alk3 (B), ActRIIA (C), and Tfr2 (D). The cotransfection, biotinylation, and immunodetection were performed essentially the same as described in panel A except that Tfr2 was incubated with either AP (A) or furin convertase inhibitor (F). Alk3 and ActRIIA were subjected to immunodetection by using an anti-FLAG antibody, and Tfr2 was detected by using a rabbit anti-Tfr2 antibody. (E) Mt2S762A but not Mt2mask increases cell surface Hfe. Hep3B cells were cotransfected with pCMV6-Hfe, pJB-1-B2M, and pEGFP-N1 or pCMV6-Mt2 or Mt2S762A or Mt2mask at 1:1:1 ratios of plasmid DNA. AP treatment, the biotinylation of cell surface proteins, and immunodetection were performed as described in panel A. Hfe was detected by using an anti-FLAG antibody. (F) Diagram of N-terminal tagged mouse Hjv with the potential cleavage sites by Mt2 and furin. Quantification of cell surface Hjv band (G) and cell surface Hfe band (H) from panels A and E, respectively. All experiments were repeated at least 3 times, with consistent results. **P <.01; ***P <.001. IB, immunoblotting; n.s., nonspecific band.
Cleavage and stabilization of substrates by Mt2, the protease-dead Mt2S762A , and Mt2mask in Hep3B cells. (A) Mt2S762A but not Mt2mask increases cell surface Hjv. pCMV9-Hjv was cotransfected with an equal amount of pEGFP-N1 (EGFP), pCMV9-Mt2, Mt2S762A, or Mt2mask plasmid DNA into Hep3B cells. Approximately 30 hours’ posttransfection, fresh medium was changed with or without 10 µM aprotinin (AP). After another 24 hours of incubation, cell surface proteins were biotinylated at 4°C, followed by pull-down of the biotinylated proteins using streptavidin agarose beads. The eluted cell surface proteins, ∼10% of input lysate, and a fraction of concentrated CM were subjected to sodium dodecyl sulfate-polyacrylamide gel electrophoresis and immunodetection by using anti-FLAG antibody for input and cell surface Hjv, Mt2, and Mt2 mutants or by using rabbit anti-HJV antibody for CM Hjv. Each panel was cropped from the same image. Effects of Mt2, Mt2S762A, and Mt2mask on cell surface Alk3 (B), ActRIIA (C), and Tfr2 (D). The cotransfection, biotinylation, and immunodetection were performed essentially the same as described in panel A except that Tfr2 was incubated with either AP (A) or furin convertase inhibitor (F). Alk3 and ActRIIA were subjected to immunodetection by using an anti-FLAG antibody, and Tfr2 was detected by using a rabbit anti-Tfr2 antibody. (E) Mt2S762A but not Mt2mask increases cell surface Hfe. Hep3B cells were cotransfected with pCMV6-Hfe, pJB-1-B2M, and pEGFP-N1 or pCMV6-Mt2 or Mt2S762A or Mt2mask at 1:1:1 ratios of plasmid DNA. AP treatment, the biotinylation of cell surface proteins, and immunodetection were performed as described in panel A. Hfe was detected by using an anti-FLAG antibody. (F) Diagram of N-terminal tagged mouse Hjv with the potential cleavage sites by Mt2 and furin. Quantification of cell surface Hjv band (G) and cell surface Hfe band (H) from panels A and E, respectively. All experiments were repeated at least 3 times, with consistent results. **P <.01; ***P <.001. IB, immunoblotting; n.s., nonspecific band.
No cleavage was detected by Mt2mask, except for Tfr2. Surprisingly, expression of Mt2mask also resulted in a marked decrease of cell surface Tfr2 and the detection of cleaved Tfr2 in the CM similarly to wild-type Mt2 (Figure 2D, lanes 4 and 9). This cleavage was inhibited by aprotinin but not by the furin convertase inhibitor (Figure 2D, lanes 10 and 11). Because Mt2mask lacks the catalytic domain, it is likely that Mt2mask facilitates Tfr2 cleavage by another serine protease. Thus, Tfr2 is unlikely a specific substrate of Mt2. Lack of cleavage of Zip14 (supplemental Figure 2) and endogenous sodium-potassium adenosine triphosphatase by Mt2 (supplemental Figure 3A-B) served as additional negative controls. Zip14 is a transporter for iron, zinc, and manganese that is mainly expressed in the intestine and the liver, and sodium-potassium adenosine triphosphatase is a plasma membrane transporter. These observations suggest that expression of Mt2 does not lead to an indiscriminate cleavage of plasma membrane proteins. We conclude that Hjv, Alk3, ActRIIA, and Hfe are likely the specific substrates of Mt2.
Lack of the proteolytic activity in Mt2 increases cell surface Hjv and Hfe in a manner that depends on the catalytic domain
To determine how the protease-dead Mt2S762A suppresses hepcidin expression, we examined its effects on cell surface localization of Mt2 substrates and compared it with the nonfunctional Mt2mask in Hep3B cells. We reasoned that any difference between Mt2S762A and Mt2mask would account for the role of the catalytic domain in Mt2 function. Both Mt2S762A and Mt2mask trafficked to the plasma membrane by biotinylation analysis (Figure 2A-B, lanes 6-9), indicating that they were folded properly. As expected, no substrate cleavage was detected upon Mt2S762A expression. Intriguingly, compared with Mt2mask, expression of Mt2S762A resulted in marked increases in cell surface Hjv and Hfe (Figure 2A,E [lanes 6-9], 2G-H). Consistently, inhibition of the Mt2 proteolytic activity by aprotinin also led to increases of cell surface Hjv and Hfe, albeit to lesser extents (Figure 2A,E, lanes 4/5). No noticeable difference was detected for cell surface Alk3 and ActRIIA between Mt2S762A and Mt2mask expression (Figure 2B-C). These results indicate that Mt2 can stabilize cell surface Hjv and Hfe by the nonproteolytic function of the catalytic domain. Relative to wild-type Mt2, the higher levels of Mt2S762A and Mt2mask (Figure 2A-E) likely resulted from slower rates of degradation (supplemental Figure 4A-C) and the reduced ectodomain shedding from the cells (supplemental Figure 5).24 We also detected increased levels of cell surface Hjv and Hfe by Mt2S762A in CHO and HEK293 cells (supplemental Figure 3A-D).
In both Hep3B and HEK293 cells, we found that expression of Mt2S762A increased at least 3 forms of cell surface Hjv migrating at ∼60, 55, and 26 kDa by using an anti-FLAG antibody (Figure 2A; supplemental Figure 3C). HJV undergoes autocatalytic cleavage at the Asp-Pro bond under acidic conditions41 in addition to Mt2 and furin-mediated cleavage. The 26 kDa band corresponds to the cleaved fragments of this cleavage.42 Hjv is an Asn-linked glycoprotein. In the endoplasmic reticulum, Asn-linked glycoproteins cotranslationally obtain high mannose oligosaccharides, which can be further modified to complex oligosaccharides in the Golgi/trans Golgi network (TGN) compartments. To determine whether the ∼60 and 55 kDa bands resulted from differential Asn-glycosylation, biotinylated cell surface proteins were subjected to digestion with either Endo-H, which cleaves only high mannose oligosaccharides, or PNGase-F, which cleaves both high-mannose and Golgi-modified complex oligosaccharides. A shift in the molecular weight by western blot indicates that oligosaccharides have been removed. As shown in Figure 3, both Hjv bands at ∼60 and 26 kDa were sensitive to PNGase-F but resistant to Endo-H, indicating that they obtained complex oligosaccharides during the transit through the Golgi compartment (lanes 8-10). In contrast, the ∼55 kDa band was sensitive to both Endo-H and PNGase-F, indicating that it has high mannose oligosaccharides. Our earlier studies on HJV Asn-glycosylation suggest that nascent HJV traffics from endoplasmic reticulum to the plasma membrane bypassing the Golgi/TGN compartments, and that upon reaching the cell surface, HJV could undergo retrograde trafficking to the Golgi/TGN compartments to acquire complex oligosaccharides in hepatoma cells.43 These results indicate that Mt2S762A facilitate complex oligosaccharide-modified Hjv recycling back to the plasma membrane.
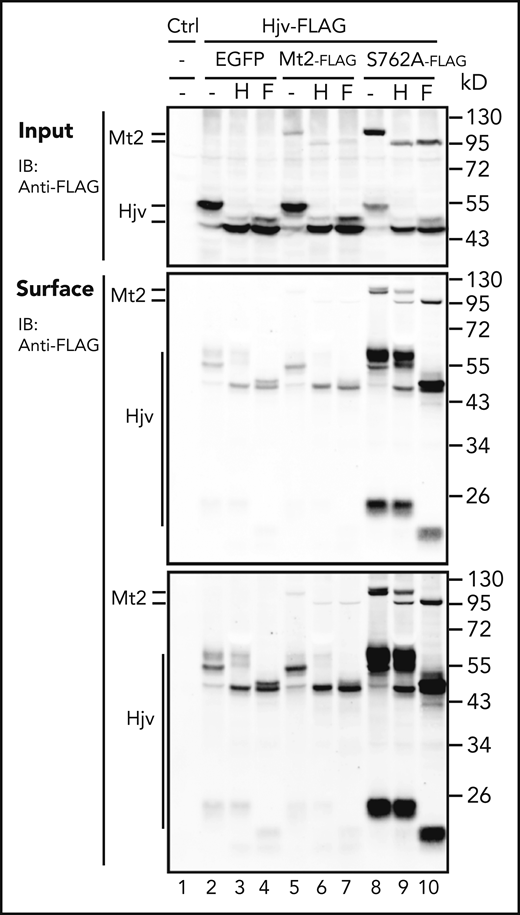
N-glycosylation analysis of cellular and cell surface Hjv. Cotransfection of HEK293 cells with Hjv and Mt2 or mutants, as well as the biotinylation of cell surface proteins, was performed as described in the Figure 2A legend. Cell lysate (input) and biotinylated cell surface proteins were subjected to digestions by Endo-H (H) or PNGase F (F), followed by immunodetection with anti-FLAG HRP for Hjv, Mt2, and Mt2 mutants. Two images for cell surface proteins with different exposure times are presented. All experiments were repeated at least 3 times, with consistent results. Ctrl, control; IB, immunoblotting.
N-glycosylation analysis of cellular and cell surface Hjv. Cotransfection of HEK293 cells with Hjv and Mt2 or mutants, as well as the biotinylation of cell surface proteins, was performed as described in the Figure 2A legend. Cell lysate (input) and biotinylated cell surface proteins were subjected to digestions by Endo-H (H) or PNGase F (F), followed by immunodetection with anti-FLAG HRP for Hjv, Mt2, and Mt2 mutants. Two images for cell surface proteins with different exposure times are presented. All experiments were repeated at least 3 times, with consistent results. Ctrl, control; IB, immunoblotting.
Mt2I286F can be activated, but it displays an altered capability to cleave substrates
To characterize the defects of Mt2I286F, we first examined whether it underwent activation. Activation of Mt2 is predicted to occur by proteolysis of the cleavage activation site (Figure 1A, arrow). Catalytic domain shedding from cells was used as an indicator for activation. As shown in supplemental Figure 5, expression of Mt2I286F and wild-type Mt2 displayed similar extents of catalytic domain shedding from the cells. Biotinylation analysis of cell surface proteins revealed that Mt2I286F trafficked to the plasma membrane similarly to wild-type Mt2 (Figure 4A). These results indicate that the Ile286Phe substitution did not affect its activation and that Mt2I286F was folded properly.
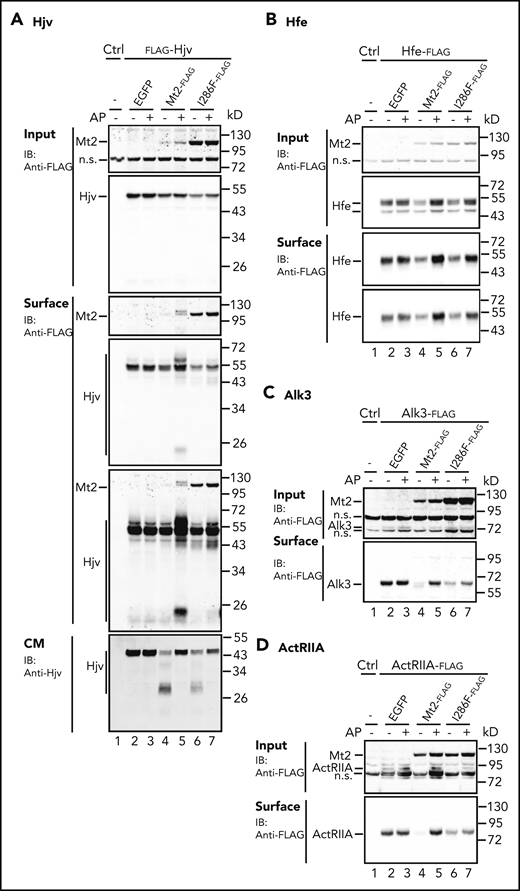
Substrate cleavage by Mt2I286F. Mt2I286F cleaves Hjv (A), Hfe (B), Alk3 (C), and ActRIIA (D) in Hep3B cells. Cotransfection of pCMV9-Hjv, pCMV6-Hfe, Alk3, or ActRIIA with pEGFP-N1 (EGFP), pCMV9-Mt2, or Mt2I286F, aprotinin (AP) treatment, biotinylation, and immunodetection were performed as described in Figure 2A-C and E. Input and cell surface Hjv, Hfe, Alk3, ActRIIA, Mt2, and Mt2 mutants were detected by using anti-FLAG HRP, and CM Hjv was detected by using a rabbit anti-HJV antibody. All experiments were repeated at least 3 times, with consistent results. IB, immunoblotting; n.s., nonspecific band.
Substrate cleavage by Mt2I286F. Mt2I286F cleaves Hjv (A), Hfe (B), Alk3 (C), and ActRIIA (D) in Hep3B cells. Cotransfection of pCMV9-Hjv, pCMV6-Hfe, Alk3, or ActRIIA with pEGFP-N1 (EGFP), pCMV9-Mt2, or Mt2I286F, aprotinin (AP) treatment, biotinylation, and immunodetection were performed as described in Figure 2A-C and E. Input and cell surface Hjv, Hfe, Alk3, ActRIIA, Mt2, and Mt2 mutants were detected by using anti-FLAG HRP, and CM Hjv was detected by using a rabbit anti-HJV antibody. All experiments were repeated at least 3 times, with consistent results. IB, immunoblotting; n.s., nonspecific band.
Hep3B cells were used to test the cleavage activity of Mt2I286F toward its substrates. Mt2I286F could cleave Hjv and Hfe as potently as wild-type Mt2, as manifested by decreases in their levels on cell surface (Figure 4A-B, lanes 4 and 6). These results indicate that Mt2I286F fully retains the proteolytic activity, which is consistent with the autocleavage studies (supplemental Figure 5). The relatively less ∼30 kDa Hjv fragments in the CM by Mt2I286F (Figure 4A, lanes 4 and 6) could be due to a compromised proteolytic activity of the shed ectodomain, as indicated in an earlier study.10 Distinct from wild-type Mt2, inhibition of the proteolytic activity by aprotinin failed to significantly increase cell surface Hjv (Figure 4A, lanes 5 and 7). The cleavage of Alk3 and ActRIIA by Mt2I286F was less potent than wild-type Mt2 (Figure 4C-D, lanes 4 and 6), and the cleavage was less efficiently suppressed by aprotinin (Figure 4C-D, lanes 5 and 7). These observations indicate that Mt2I286F displays a compromised ability to cleave some substrates despite a proper activation. Relative to wild-type Mt2, the higher levels of Mt2I286F (Figure 4A-C) likely resulted from its slower rate of degradation in the cells (supplemental Figure 4A,C).
Mt2I286F has reduced ability to associate with substrates
We next tested the hypothesis that the altered cleavage of Mt2I286F results from reduced interactions with substrates, by coimmunoprecipitation. To avoid cleavage during the analysis, cell extracts from HEK239 cells that individually express Mt2, Mt2I286F, Mt2S762A, Mt2mask, Hjv, Hfe, ActRIIA, or Alk3 were mixed in the presence of inhibitors. Consistent with previous studies,23,44,45 Mt2 coimmunoprecipitated with Hjv when using an anti-HJV antibody. Mt2S762A behaved similarly to wild-type Mt2. However, no evident Mt2I286F was pulled down (Figure 5A, lanes 4-6). These results indicate that Mt2I286F but not Mt2S762A had a reduced interaction with Hjv. Similarly, studies using an anti-MT2 antibody also revealed that Mt2 coimmunoprecipitated with ActRIIA or Hfe, and that Mt2I286F but not Mt2S762A exhibited reduced associations with ActRIIA and Hfe (Figure 5B-C, lanes 4-6). The coimmunoprecipitation analysis for Alk3 was not successful because of a high nonspecific binding of Alk3 to protein-A agarose beads. Together, these results suggest that the Ile286Phe substitution reduces the binding of Mt2 to substrates, whereas the Ser762Ala substitution does not.
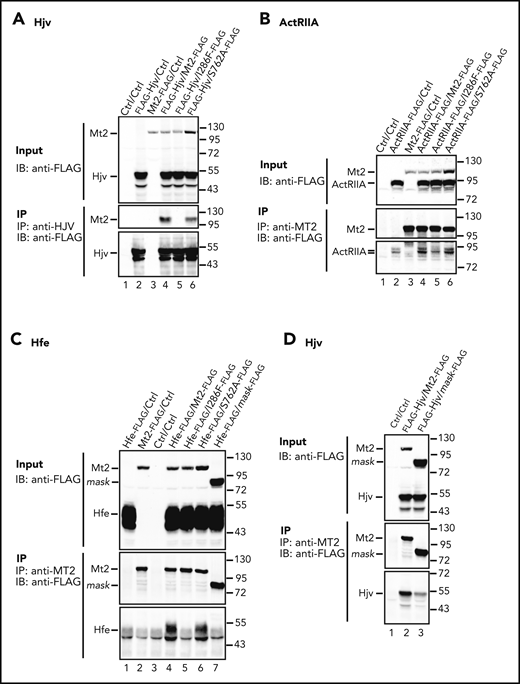
I286F mutation reduces the interaction of Mt2 with Hjv, ActRIIA, and Hfe. HEK293 cells were transfected individually with pCMV6-Mt2, Mt2I286F, Mt2S762A, Mt2mask, pCMV9-Hjv, pCMV6-ActRIIA, or Hfe/pJB-1-B2M. Untransfected cells were used as control (Ctrl). Immunoprecipitation was performed by mixing the lysates in the presence of protease inhibitors. (A) Mt2I286F was not coimmunoprecipitated with Hjv. A rabbit anti-HJV antibody was used for pulldown. The eluates and 10% input were subjected to sodium dodecyl sulfate-polyacrylamide gel electrophoresis and immuodetection for Hjv and Mt2 using a HRP-conjugated anti-FLAG antibody. Mt2I286F has reduced interaction with ActRIIA (B), and both Mt2I286F and Mt2mask have reduced interactions with Hfe (C). Coimmunoprecipitation was performed by using a rabbit anti-MT2 antibody. An HRP-conjugated anti-FLAG antibody was used for immunodetection of ActRIIA, Hfe, Mt2, and Mt2 mutants. (D) Mt2mask has reduced interaction with Hjv. Coimmunoprecipitation and immunodetection were performed as described in panels B and C. An HRP-conjugated anti-FLAG antibody was used for immunodetection of Hjv, Mt2, and Mt2mask. All experiments were repeated at least 3 times, with consistent results. IB, immunoblotting; IP, immunoprecipitation.
I286F mutation reduces the interaction of Mt2 with Hjv, ActRIIA, and Hfe. HEK293 cells were transfected individually with pCMV6-Mt2, Mt2I286F, Mt2S762A, Mt2mask, pCMV9-Hjv, pCMV6-ActRIIA, or Hfe/pJB-1-B2M. Untransfected cells were used as control (Ctrl). Immunoprecipitation was performed by mixing the lysates in the presence of protease inhibitors. (A) Mt2I286F was not coimmunoprecipitated with Hjv. A rabbit anti-HJV antibody was used for pulldown. The eluates and 10% input were subjected to sodium dodecyl sulfate-polyacrylamide gel electrophoresis and immuodetection for Hjv and Mt2 using a HRP-conjugated anti-FLAG antibody. Mt2I286F has reduced interaction with ActRIIA (B), and both Mt2I286F and Mt2mask have reduced interactions with Hfe (C). Coimmunoprecipitation was performed by using a rabbit anti-MT2 antibody. An HRP-conjugated anti-FLAG antibody was used for immunodetection of ActRIIA, Hfe, Mt2, and Mt2 mutants. (D) Mt2mask has reduced interaction with Hjv. Coimmunoprecipitation and immunodetection were performed as described in panels B and C. An HRP-conjugated anti-FLAG antibody was used for immunodetection of Hjv, Mt2, and Mt2mask. All experiments were repeated at least 3 times, with consistent results. IB, immunoblotting; IP, immunoprecipitation.
Similar to Mt2I286F, coimmunoprecipitation analysis also revealed a markedly reduced interaction of Mt2mask with Hfe and Hjv (Figure 5C-D). These results suggest that the catalytic domain of Mt2 is involved in substrate binding. The interaction between Mt2mask and ActRIIA was not examined because of their similar molecular weights. We also attempted to test the hypothesis that Mt2S762A suppresses hepcidin expression by perturbing Alk3 and Hjv binding to BMP6 using the pull-down assays. Both Alk3 (a type I BMP receptor) and Hjv (a BMP coreceptor) induce hepcidin expression via BMP signaling, and BMP6 is an essential BMP ligand.3 No direct interaction between Alk3 and Hjv has been reported. Unfortunately, neither full-length Alk3 nor full-length Hjv was able to pull-down BMP6 in either the absence or presence of Mt2 or mutants (supplemental Figure 6). This is likely due to low binding affinities.
To test the hypothesis that the stabilization of Hjv by Mt2S762A in Figure 2A results from their association, we generated the Mt2S762A/I286F construct. Mt2S762A/I286F is predicted to have a reduced interaction with Hjv in addition to the abolished proteolytic activity. It trafficked to the plasma membrane similarly to Mt2S762 (supplemental Figure 7A). In contrast to a marked increase of cell surface Hjv by Mt2S762A, only a subtle increase was detected by Mt2S762A/I286F expression (supplemental Figure 7B). These data indirectly indicate that the increase of cell surface Hjv by Mt2S762 is mediated through Hjv-Mt2S762 association and that the CUB domain of Mt2 plays a key role in this process.
Mt2 mediates suppression of hepcidin expression without a decrease in liver Hjv
To seek insights into the potential mechanism by which Mt2 suppresses hepcidin expression in vivo, the levels of endogenously expressed Hjv in the whole liver extracts of mice from the studies in Figure 1 were subjected to immunodetection. Hjv is predominantly expressed in hepatocytes of the liver.46 In line with decreases of Hjv by Mt2 in Hep3B cells (Figure 2A), elevated Hjv was detected in the liver of Tmprss6−/− mice by using a mouse anti-Hjv antibody (Figure 6A, lanes 1-4). As a positive control, this antibody specifically detected the introduced exogenous FLAG-tagged Hjv in the liver of Hjv−/− mice33 (Figure 6A, lane 18). Interestingly, suppression of hepcidin expression by exogenous Mt2 in Tmprss6−/− mice was associated with a mild increase, rather than a decrease, in hepatic Hjv (Figure 6A-B, lanes 5-8; supplemental Figure 8). A further increase was detected upon Mt2S762A expression (Figure 6A, lanes 9-12). These increases were not proportional to the levels of Mt2. In comparison, a mild increase of Hjv was detected when Mt2I286F was expressed (Figure 6B, lanes 9-12). We also noticed a mild increase of Hjv by expressing higher levels of Mt2mask (Figure 6A, lanes 14-15). Together with the qRT-PCR analysis in Figure 1E, these observations indicate the lack of a direct association of hepcidin expression with hepatic Hjv levels. This idea is also supported by western blot analysis of Hjv in the liver membrane preparations showing a similar profile as the whole liver extracts (Figure 6A,C).
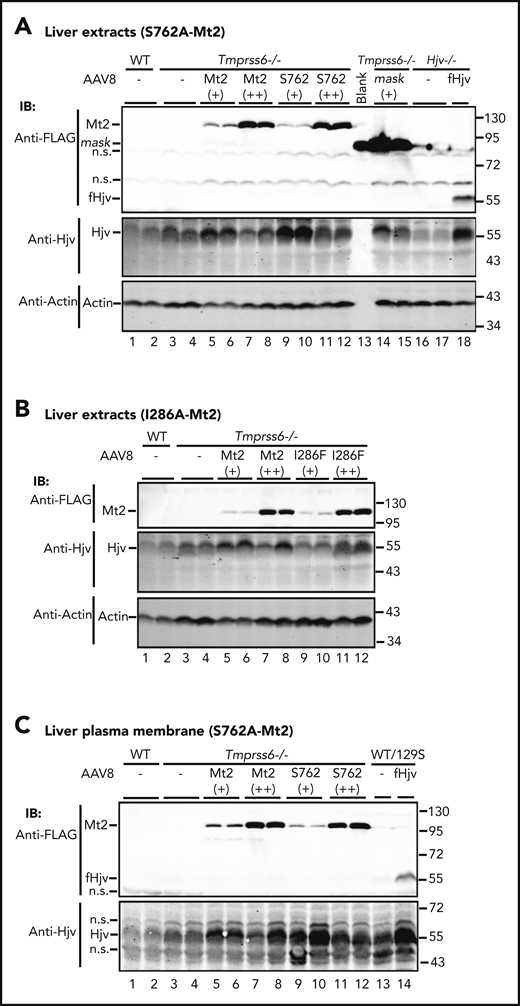
Immunodetection of endogenously expressed Hjv in the liver of Tmprss6−/− mice that express exogenous Mt2. (A) Representative images of western blot analysis for endogenously expressed Hjv, β-actin, and introduced Mt2, Mt2S762A, Mt2mask, or FLAG-tagged Hjv (fHjv) in the whole liver extracts (250 µg protein) of wild-type (WT), Tmprss6−/−, and Hjv−/− mice. (B) Representative images of western blot analysis for endogenously expressed Hjv, β-actin, and introduced Mt2 or Mt2I286F in the whole liver extracts (250 µg protein) of WT and Tmprss6−/− mice. (C) Representative images of western blot analysis for endogenously expressed Hjv, and introduced Mt2, Mt2S762A, Mt2mask, or Hjv in the liver membrane preparation (250 µg protein) of WT, Tmprss6−/−, and WT 129S6 mice expressing exogenous FLAG-tagged Hjv (fHjv). IB, immunoblotting; n.s., nonspecific band.
Immunodetection of endogenously expressed Hjv in the liver of Tmprss6−/− mice that express exogenous Mt2. (A) Representative images of western blot analysis for endogenously expressed Hjv, β-actin, and introduced Mt2, Mt2S762A, Mt2mask, or FLAG-tagged Hjv (fHjv) in the whole liver extracts (250 µg protein) of wild-type (WT), Tmprss6−/−, and Hjv−/− mice. (B) Representative images of western blot analysis for endogenously expressed Hjv, β-actin, and introduced Mt2 or Mt2I286F in the whole liver extracts (250 µg protein) of WT and Tmprss6−/− mice. (C) Representative images of western blot analysis for endogenously expressed Hjv, and introduced Mt2, Mt2S762A, Mt2mask, or Hjv in the liver membrane preparation (250 µg protein) of WT, Tmprss6−/−, and WT 129S6 mice expressing exogenous FLAG-tagged Hjv (fHjv). IB, immunoblotting; n.s., nonspecific band.
Increased expression of the hepatocyte growth factor activator inhibitor-2 in the liver does not alter hepcidin expression
To further determine the role of Mt2 proteolytic activity, we tested the effects of increased hepatocyte growth factor activator inhibitor-2 (Hai-2) on hepcidin expression. HAI-2 is a broad membrane-associated serine protease inhibitor that inhibits the proteolytic activities of MT2.47 When Hep3B cells were cotransfected with equal amounts of Tmprss6 and Hai-2 plasmid DNA, FLAG-tagged Hai-2 was able to abolish Mt2-mediated cleavage of Hjv, Alk3, ActRIIA, and Hfe (supplemental Figure 9A-D), which is similar to aprotinin treatment (Figure 2A-C,E) and our earlier studies in HEK293.24 In the liver of wild-type 129S6 mice, a relatively low level of Hai-2 mRNA was detected compared with that of Tmprss6 mRNA (Figure 7A-C). We reasoned that if Mt2 acts via its proteolytic activity, increased Hai-2 in the liver would inhibit the function of Mt2, leading to an elevated Bmp-signaling, an increased hepcidin expression, and a reduced serum iron concentration that resembles Tmprss6 knockout. Intriguingly, when the levels of Hai-2 mRNA were increased to 2.2- and 4.8-fold higher than those of Tmprss6 mRNA in the liver by AAV8 vectors, there were no significant changes of Id1 mRNA, hepcidin mRNA, and serum iron concentrations in wild-type 129S6 mice (Figures 7A-F). The expressed exogenous Hai-2 in the liver migrated similarly to those expressed in Hep3B cells (Figures 7G-H). As a positive control, we detected significant decreases of serum hepatocyte growth factor (HGF) levels by excess Hai-2 (Figure 7I). HGF is secreted as an inactive pro-HGF, and hepsin is one of the activators.48 Hepsin−/− mice have reduced serum HGF.49 Hepsin is a membrane-associated serine protease that is predominantly expressed in hepatocytes of the liver,49,50 and its proteolytic activity is inhibited by HAI-2.51,52 Interestingly, the extent of serum HGF reduction by excess Hai-2 is comparable to that seen in Hepsin−/− mice.49 We predict that the reduction of serum HGF by transgenic Hai-2 likely resulted from inhibition of the proteolytic activity of native hepsin (Figure 7J), which suggests that the transgenic Hai-2 was functional in vivo. Taken together, these observations support the idea that Mt2 suppresses hepcidin expression independently of its proteolytic activity.
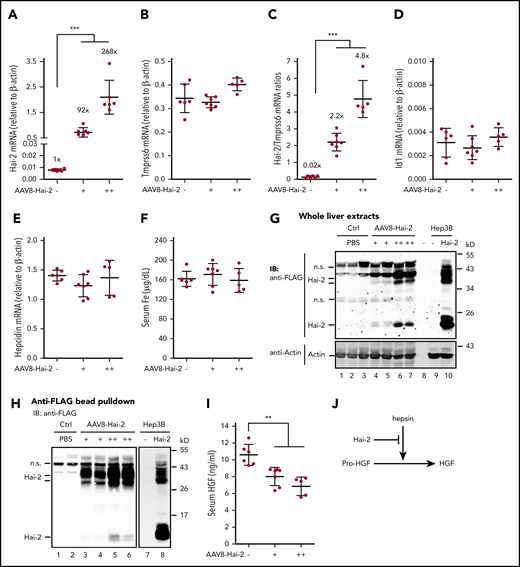
Increased Hai-2 in the liver does not alter hepcidin expression. Eight-week-old wild-type 129S6 male mice were intraperitoneally injected with AAV8-Hai-2 at ∼0.6 × 10¹¹ (+) and ∼2.2 × 10¹¹ (++) viral genome-particles per mouse, or phosphate-buffered saline (PBS) as control) (Ctrl) (–). Animals were euthanized at 3 weeks’ postinjection for analysis. Each group consisted of at least 5 animals. (A-B) qRT-PCR analysis of hepatic Hai-2 and Tmprss6 mRNA. (C) Ratios of Hai-2 mRNA vs Tmprss6 mRNA in the liver. Results were calculated by using the data from panels A and B. (D-E) qRT-PCR analysis of hepatic Id1 and hepcidin mRNA. (F) Serum iron (Fe) concentrations. All qRT-PCR results are expressed as the amount relative to that of β-actin for each sample. Data are expressed as the mean ± standard deviation. One-way analysis of variance was used to analyze the data relative to the PBS control group. (G) A representative image of western blot analysis for transduced FLAG-tagged Hai-2 protein in the whole liver extracts (250 µg protein) by using an anti-FLAG antibody. Cell lysate of Hep3B cells expressing FLAG-tagged Hai-2 was included as a positive control. β-actin was used as a loading control. (H) Representative images of western blot analysis for concentrated FLAG-tagged Hai-2 from the liver. FLAG-tagged Hai-2 from ∼2 mg liver extract proteins was pulled down by using anti-FLAG affinity gel (A2220; MilliporeSigma), followed by elution using the 3 × FLAG peptide at ∼200 µg/mL (F4799; MilliporeSigma) and immunodetection using anti-FLAG antibody. Both images were derived from the same membrane with different exposure times because of the relatively low Hai-2 level in transfected Hep3B cells. (I) Serum HGF assay using an Enzyme-Linked Immunosorbent Assay Kit (RAB0214; MilliporeSigma). Serum was obtained from blood collected by cardiac puncture. One-way analysis of variance was used to analyze the data relative to the PBS control group. (J) Diagram for Hai-2 reduction of serum HGF via hepsin. **P <.01; ***P <.001. IB, immunoblotting; n.s., nonspecific band.
Increased Hai-2 in the liver does not alter hepcidin expression. Eight-week-old wild-type 129S6 male mice were intraperitoneally injected with AAV8-Hai-2 at ∼0.6 × 10¹¹ (+) and ∼2.2 × 10¹¹ (++) viral genome-particles per mouse, or phosphate-buffered saline (PBS) as control) (Ctrl) (–). Animals were euthanized at 3 weeks’ postinjection for analysis. Each group consisted of at least 5 animals. (A-B) qRT-PCR analysis of hepatic Hai-2 and Tmprss6 mRNA. (C) Ratios of Hai-2 mRNA vs Tmprss6 mRNA in the liver. Results were calculated by using the data from panels A and B. (D-E) qRT-PCR analysis of hepatic Id1 and hepcidin mRNA. (F) Serum iron (Fe) concentrations. All qRT-PCR results are expressed as the amount relative to that of β-actin for each sample. Data are expressed as the mean ± standard deviation. One-way analysis of variance was used to analyze the data relative to the PBS control group. (G) A representative image of western blot analysis for transduced FLAG-tagged Hai-2 protein in the whole liver extracts (250 µg protein) by using an anti-FLAG antibody. Cell lysate of Hep3B cells expressing FLAG-tagged Hai-2 was included as a positive control. β-actin was used as a loading control. (H) Representative images of western blot analysis for concentrated FLAG-tagged Hai-2 from the liver. FLAG-tagged Hai-2 from ∼2 mg liver extract proteins was pulled down by using anti-FLAG affinity gel (A2220; MilliporeSigma), followed by elution using the 3 × FLAG peptide at ∼200 µg/mL (F4799; MilliporeSigma) and immunodetection using anti-FLAG antibody. Both images were derived from the same membrane with different exposure times because of the relatively low Hai-2 level in transfected Hep3B cells. (I) Serum HGF assay using an Enzyme-Linked Immunosorbent Assay Kit (RAB0214; MilliporeSigma). Serum was obtained from blood collected by cardiac puncture. One-way analysis of variance was used to analyze the data relative to the PBS control group. (J) Diagram for Hai-2 reduction of serum HGF via hepsin. **P <.01; ***P <.001. IB, immunoblotting; n.s., nonspecific band.
Discussion
This study investigated the roles of the proteolytic and nonproteolytic activities of Mt2. We found that Mt2 specifically cleaved Hjv, Alk3, ActRIIA, and Hfe in hepatoma cells, and that Mt2 could potently suppress hepcidin expression independently of the proteolytic activity in vivo. Our data support the idea that the substrate binding plays an indispensable role for the function of Mt2.
The underlying mechanism for the function of MT2 is controversial. Early studies predicted that MT2 suppresses hepcidin expression by cleaving HJV through its proteolytic activity.8,23 Our recent data suggest that Mt2 could act independently of Hjv in vivo and show that it cleaves multiple components of the hepcidin induction pathway in HEK293 cells.9,24 In the current study, we found that Mt2 was able to specifically cleave Hjv, Alk3, ActRIIA, and Hfe in hepatoma cells. These observations strengthen the idea that Hjv is not the only substrate of Mt2.
We showed, for the first time, that Mt2 was able to suppress hepcidin expression in vivo via its nonproteolytic function by taking advantage of the protease-dead full-length Mt2S762A. This finding is consistent with the in vitro studies showing that MT2S762A retains the ability to reduce hepcidin in HepG2 cells,53 as well as the in vivo studies of matriptase and prostasin showing that their zymogens are biologically functional.54-56 Matriptase is a close family member of Mt2 that is exclusively expressed in epithelial cells.1,54,57 We found that this nonproteolytic function of Mt2 requires the entire ectodomain because deletion of the catalytic domain abolishes the function of Mt2 in mice.7,24 Mechanistic studies using Mt2S762A and Mt2mask suggest that this nonproteolytic function is likely accomplished by binding to and stabilizing Hjv and Hfe. Both Hjv and Hfe are essential for the induction of hepcidin expression.3 We speculate that the binding of Mt2 to Hjv, Hfe, and perhaps other components of the hepcidin induction pathway is sufficient to block their functions. This idea is supported by the observations that neither increased hepatic Hai-2 expression (Figure 7) nor administration of the protease inhibitor aprotinin33 was able to alter hepcidin expression in mice, and that Mt2 is detected predominantly as the full-length zymogen form in the liver.9,24
Studies of the murine IRIDA-causing mutant Mt2I286F indicate that having the proteolytic activity alone is not sufficient to suppress hepcidin expression. We found that the Ile286Phe substitution in the CUB domain did not affect the activation, proteolytic activity, or cell surface expression of Mt2 (Figures 4; supplemental Figure 5). In agreement with the findings that Ile286Phe substitution in mice causes inappropriately high hepcidin expression and iron deficiency similar to Tmprss6 knockout,10 we showed that Mt2I286F displayed a largely compromised ability when expressed in Tmprss6−/− mice (Figure 1). Coimmunoprecipitation analysis suggests that this compromised function likely resulted from the reduced interaction with at least Hjv, ActRIIA, and Hfe (Figure 5). Interestingly, at least 3 human IRIDA-causing mutants in the CUB domains of MT2 (R271Q, T287N, and G442R) also traffic to the cell surface and cleave HJV similarly to wild-type MT2.26,27,31 We speculate that these human IRIDA-causing mutations might also cause reduced interaction with one or more substrates, leading to blunted functions similarly to Mt2I286F and that the improvement by expressing a higher level of Mt2I286F in Tmprss6−/− mice could result from overcoming the attenuated substrate binding. Together, these observations imply that the substrate interactions play a pivotal role for the biological function of Mt2.
Further analysis of hepatic Hjv revealed that suppression of hepcidin expression by Mt2 in Tmprss6−/− mice was not associated with the decreases of Hjv in the liver (Figure 6). Rather, we detected constantly higher levels of hepatic Hjv than in wild-type counterparts. This outcome is unlikely due to the altered distribution or altered function of transduced Mt2 by the AAV8 vector. Previous studies showed that the AAV8 vector is able to evenly introduce the gene of interest into hepatocytes throughout the liver.35 In situ hybridization also reveals a homogenous distribution of Tmprss6 mRNA in hepatocytes.36 Thus, the transduced Mt2 is predicted to be distributed in hepatocytes similarly to the native Mt2. With respect to the function, data obtained from this and our earlier studies indicate that the transduced Mt2 acts similarly to native Mt2. Expression of transduced Mt2 in the liver of Tmpress6−/− mice was able to fully correct the low serum iron status by suppressing hepatic hepcidin expression (Figure 1D-E).9 Importantly, the levels of hepatic hepcidin mRNA by transduced Mt2 were even lower than those in wild-type mice (Figure 1E). On the basis of the data from our earlier studies,9,36 we speculate that the higher levels of Hjv by transduced Mt2 (Figure 6) likely result from the liver iron depletion. In a similar setting of studies, we found that expression of transduced Mt2 over a 3-week period was able to fully correct the low serum iron concentration but did not improve the severe iron depletion in the liver of Tmprss6−/− mice. The liver non-heme iron levels remained ∼4.5-fold lower than those of wild-type littermates, which was similar to the control Tmpress6−/− group.9 Interestingly, our previous studies suggest that iron depletion increases Mt2 protein via a posttranscriptional mechanism.36 Based on these observations, we hypothesize that the constant iron depletion in the liver of Tmpress6−/− mice increases the levels of transduced Mt2, which leads to sequestration of more Hjv via its nonproteolytic activity to block the induction of hepcidin expression.
The clinical significance of our findings is potentially important. The proteolytic activity of MT2 has been identified as a target for the treatment of iron overload disorders by application of specific inhibitors to block the function of MT2 that is predicted to elevate hepcidin expression.53,58,59 Our data suggest that such an approach might not be able to achieve this goal. On the basis of the findings in this and previous studies, we propose a model in which Mt2 binds to substrates on the plasma membrane through the CUB and catalytic domains, followed by rapid removal of substrates from the cells via its protease activity. During this process, the substrate binding and sequestration by Mt2 are sufficient to limit the induction of hepcidin expression. From this, we predict that either depletion of MT2 or disruption of substrate interaction would be the appropriate strategy to inhibit the function of MT2 in vivo.
Requests for data sharing should be e-mailed to the corresponding author.
The online version of this article contains a data supplement.
The publication costs of this article were defrayed in part by page charge payment. Therefore, and solely to indicate this fact, this article is hereby marked “advertisement” in accordance with 18 USC section 1734.
Acknowledgments
The authors thank Aaron Wortham, Peizhong Mao, and Mastura Wahedi for technical assistance, and the Molecular Virology Core of Oregon Health & Science University for the generation of the AAV8 vectors.
This work was supported by the National Institute of Diabetes and Digestive and Kidney Diseases, National Institutes of Health (R01DK072166 [C.A.E.] and R01DK102791[A.-S.Z.]).
Authorship
Contribution: C.A.E. designed the studies, analyzed the data, and wrote the manuscript; S.J. performed experiments and analyzed the data; A.-S.Z. designed the studies, performed experiments, analyzed the data, and wrote the manuscript; and all authors contributed to the editing of the final manuscript.
Conflict-of-interest disclosure: The authors declare no competing financial interests.
Correspondence: An-Sheng Zhang, Department of Cell, Developmental, and Cancer Biology L215, OHSU, 3181 SW Sam Jackson Park Rd, Portland, OR 97239; e-mail: zhanga@ohsu.edu.

This feature is available to Subscribers Only
Sign In or Create an Account Close Modal