

Key Points
Recurrent somatic 13q12.2 deletions in ALL lead to upregulation of FLT3 through chromatin remodeling and enhancer hijacking.

Abstract
Mutations in the FMS-like tyrosine kinase 3 (FLT3) gene in 13q12.2 are among the most common driver events in acute leukemia, leading to increased cell proliferation and survival through activation of the phosphatidylinositol 3-kinase/AKT-, RAS/MAPK-, and STAT5-signaling pathways. In this study, we examine the pathogenetic impact of somatic hemizygous 13q12.2 microdeletions in B-cell precursor (BCP) acute lymphoblastic leukemia (ALL) using 5 different patient cohorts (in total including 1418 cases). The 13q12.2 deletions occur immediately 5′ of FLT3 and involve the PAN3 locus. By detailed analysis of the 13q12.2 segment, we show that the deletions lead to loss of a topologically associating domain border and an enhancer of FLT3. This results in increased cis interactions between the FLT3 promoter and another enhancer located distally to the deletion breakpoints, with subsequent allele-specific upregulation of FLT3 expression, expected to lead to ligand-independent activation of the receptor and downstream signaling. The 13q12.2 deletions are highly enriched in the high-hyperdiploid BCP ALL subtype (frequency 3.9% vs 0.5% in other BCP ALL) and in cases that subsequently relapsed. Taken together, our study describes a novel mechanism of FLT3 involvement in leukemogenesis by upregulation via chromatin remodeling and enhancer hijacking. These data further emphasize the role of FLT3 as a driver gene in BCP ALL.
Introduction
FLT3, encoding the FMS-like tyrosine kinase 3 (FLT3), is one of the most commonly mutated genes in acute leukemia, with ∼30% of acute myeloid leukemia (AML) and ∼5% of pediatric B-cell precursor (BCP) acute lymphoblastic leukemia (ALL) displaying mutations.1 FLT3 is a class III receptor tyrosine kinase that is primarily expressed in the bone marrow, in particular on CD34+ hematopoietic stem and early progenitor cells.1 Upon binding of the FL ligand, FLT3 dimerizes and tyrosine residues in the tyrosine kinase domains become autophosphorylated. This results in downstream activation of the phosphatidylinositol 3-kinase/AKT-, RAS/MAPK-, and STAT5-signaling pathways and, subsequently, in increased proliferation and reduced apoptosis.1 The majority of mutations are either internal tandem duplications (ITDs) of the juxtamembrane domain, most common in AML, or activating tyrosine kinase domain mutations, both of which lead to constitutive activation of the FLT3 receptor. Furthermore, high FLT3 expression is seen in some leukemic subtypes regardless of mutational status, for example, in ALL with high hyperdiploidy (51-67 chromosomes).2,3
We have previously reported recurrent somatic hemizygous 13q12.2 microdeletions in childhood BCP ALL, with currently unknown effects.4,5 The only gene in the deleted region is PAN3, which encodes the regulatory subunit of the poly(A)-nuclease (PAN) deadenylation complex (PAN2-PAN3 complex). PAN3 has not previously been implicated in cancer apart from in a single case of myelodysplastic syndrome with a PAN3/PSMA2 fusion.6 However, the 13q12.2 deletions are also located immediately 5′ of FLT3 and we therefore hypothesized that they may affect its expression. Indeed, here we show that 13q12.2 deletions in ALL lead to upregulation of FLT3 expression by inducing cis interactions between the FLT3 promoter and an enhancer element located distally to the deleted region. Our study thus reveals a novel mechanism of FLT3 involvement in leukemogenesis.
Patients and methods
Patient cohorts
A total of 1418 BCP ALL cases from 5 different patient cohorts were included in the investigation (supplemental Figure 1, available on the Blood Web site). The Lund discovery cohort (cohort 1) is an expansion of a previously published series consisting of 276 cases genotyped by Illumina BeadChips (Illumina, San Diego, CA) or CytoScan HD single-nucleotide polymorphism (SNP) arrays (Affymetrix/Thermo Fisher Scientific, Waltham, MA).7 The Therapeutically Applicable Research to Generate Effective Treatments (TARGET) program (https://portal.gdc.cancer.gov/projects; dbGAP accession number phs000464) ALL phase 2 discovery cohort (cohort 2) comprises 783 cases genotyped by the Affymetrix Genome-Wide Human SNP Array 6.0. Three validation cohorts, including high-hyperdiploid ALL cases only, were also included: cohort 3 (n = 123)8 genotyped by Affymetrix CytoScan HD array; cohort 4 (n = 97)9 genotyped by Illumina BeadChips; and cohort 5, the TARGET ALL phase 2 validation cohort (n = 139), genotyped by whole-exome sequencing (WES). Informed consent was obtained according to the Declaration of Helsinki and the study was approved by the Ethics Committee of Lund University.
SNP array data analysis
Illumina (.idat files) and Affymetrix (.CEL files) intensity files were analyzed by GenomeStudio v2011.1 (Illumina) and PennCNV (1.0.5),10 respectively. Copy-number alterations (CNAs) were called with TAPS11 and manually reviewed in GenomeStudio or Chromosome Analysis Suite (v3.3). The 13q12.2 deletion allele frequency was estimated by dividing the median log R ratio of SNPs across the deleted region with the median log R ratio of all chromosome 13 SNPs.
Whole-genome and exome data analysis
Genomic-sequencing data for cases in cohort 1 have been previously published.3,4 For whole-genome sequencing (WGS) and WES data from TARGET (cohorts 2 and 5), methods are available at the TARGET project portal. Germline single-nucleotide variants (SNVs) were identified by the GATK4 (v4.0.11.0)12 UnifiedGenotyper and filtered by GATK hard filters.13 Somatic variants were called by Mutect2.14 Structural variants were identified by Manta, Delly, and SvABA.15-17 CNA analysis of WES data was performed using CNVkit.18 To estimate the 13q12.2 deletion allele frequency, a sliding window approach was used (bin, 30 kb; step, 10 kb) to calculate the relative coverage ratio between tumor/matched normal samples. For Complete Genomics data, germline SNVs annotated as “VQLOW” or that were covered by <20 reads were filtered out. Somatic variants were identified by the TARGET WGS analysis pipeline. Functional annotation of variants was performed using SNPEff.19 For cases 16 to 19 (Table 1), FLT3 ITD was analyzed as previously described20 and screening of all coding exons of FLT3 was done using a targeted panel (Ampliseq System) and sequenced on an Ion S5 (Thermo Fisher Scientific). Raw data were analyzed with the Torrent browser (Thermo Fisher Scientific) and SeqNext (JSI Medical System, Los Angeles, CA). WES libraries of cases 20 to 22 (Table 1) were constructed using the Nextera DNA exome kit (Illumina) and sequenced on a NextSeq 500 (Illumina).
13q12.2 deletions in 27 cases of ALL
| Case | Deleted region* | Size, bp | FLT3 mutation | Deletion at diagnosis | Deletion at relapse |
|---|---|---|---|---|---|
| 1 | chr13:28 689 519-28 818 033† | 128 514 | p.A680V | Yes | Yes |
| 2 | chr13:28 686 699-28 818 553† | 131 854 | No | Yes | Yes |
| 3 | chr13:28 691 097-28 795 606 | 104 509 | p.D835Y | Yes | N/A |
| 4 | chr13:28 675 905-28 816 917† | 141 012 | p.I867S | Yes | N/A |
| 5 | chr13:28 678 803-28 814 370 | 135 567 | No | Yes | N/A |
| 6 | chr13:28 689 487-28 818 033† | 128 546 | No | Yes | N/A |
| 7 | chr13:28 675844-28 779 095† | 103 251 | ITD | Yes | N/A |
| 8 | chr13:28 678 544-28 717 233† | 38 689 | No | Yes | N/A |
| 9 | chr13:28 672 989-28 816 869† | 143 880 | No | Yes | N/A |
| 10 | chr13:28 681 356-28 816 438 | 135 082 | NK | Yes | N/A |
| 11 | chr13:28 681 356-28 816 438 | 135 082 | NK | Yes | N/A |
| 12 | chr13:28 675 878-28 817 064† | 141 186 | No | Yes | N/A |
| 13 | chr13:28 682 922-28 798 410† | 115 488 | No | Yes | No |
| 14 | chr13:28 706 767-28 749 112† | 42 345 | No | No | Yes |
| 15 | chr13:28 675 750-28 835 054† | 159 304 | p.M837P | Yes | Yes |
| 16 | chr13:28 685 061-28 813 774 | 128 713 | No | Yes | N/A |
| 17 | chr13:28 689 100-28 801 000 | 111 900 | p.R834dup | Yes | N/A |
| 18 | chr13:28 689 223-28 722 472 | 33 249 | No | Yes | N/A |
| 19 | chr13:28 690 533-28 829 444 | 138 911 | No | Yes | N/A |
| 20 | chr13:28 691 097-28 828 603 | 137 506 | No | Yes | N/A |
| 21 | chr13:28 719 402-28 814 420 | 95 018 | No | Yes | N/A |
| 22 | chr13:28 687 654-28 759 548 | 71 894 | ITD | Yes | N/A |
| 23 | chr13:28 712 891-28 813 915 | 101 024 | No | Yes | N/A |
| 24 | chr13:28 712 891-28 813 915 | 101 024 | No | Yes | N/A |
| 25 | chr13:28 712 685-28 830 678 | 117 993 | No | Yes | N/A |
| 26 | chr13:28 712 435-28 752 128 | 39 693 | p.S838_D839insEG/p.N841T | Yes | N/A |
| 27 | chr13:28 712 685-28 813 851 | 101 166 | p.L576P | Yes | N/A |
bp, base pair; N/A, data not available (no relapse or no sample available); NK, not known.
Minimally deleted region based on SNP array analysis or WES copy number data unless otherwise indicated.
Breakpoint validated by WGS.
Fluorescence in situ hybridization
Metaphase fluorescence in situ hybridization was done on relapse samples from cases 1 and 2 (Table 1) according to standard methods using a whole-chromosome paint probe for chromosome 13 (Applied Spectral Imaging, Neckarhausen, Germany), the Vysis LSI21 probe (Abbott Laboratories, Abbott Park, IL), and the fosmid G248F80597D11.
RNA-sequencing and data analysis
RNA-sequencing (RNA-seq) data of cohort 1 (n = 152) have been published.21 For RNA-seq data from TARGET (high-hyperdiploid, n = 37; nonhyperdiploid case with 13q12.2 deletion, n = 1), methods are available at the TARGET project portal. RNA-seq reads were mapped to human_g1k_v37 by the STAR (version 2.6.1d)22 2-pass mapping pipeline with WASP parameter.23 Only reads that passed WASP filtering were used for allele-specific expression analysis. Gene expression was quantified by RNA-Seq by Expectation-Maximization (RESM)24 and differential expression analysis was performed by the Wilcoxon rank-sum test.
Genotype phasing and allele-specific expression analysis
Genotype phasing of 13q12.2 was performed with the Sanger Imputation Service using the Haplotype Reference Consortium reference panel.25 GATK4 ASEReadCounter was used to evaluate the allele counts of expressed heterozygous SNV sites. Heterozygous SNVs with individual allele read depths ≥10 were kept. Read counts of exonic heterozygous SNVs from the same homolog were aggregated based on the phasing results. The binomial test was applied to estimate allelic bias of exonic SNVs in the RNA-seq data against the genomic data. Allelic ratios >2 or <0.5, and values of P < .05 were used to identify allele-specific expression.
Chromatin structure and ChIP-seq data mining
GM12878 histone marks chromatin immunoprecipitation (ChIP)-sequencing (ChIP-seq) data (H3K27ac and H3K4me3) and DNase I–hypersensitive site sequencing (DNase-seq) data (bigwig files) were downloaded from the University of California, Santa Cruz (UCSC) database (http://genome.ucsc.edu/ENCODE/dataMatrix/encodeDataMatrixHuman.html). ETS transcription factor (ERG) and runt-related transcription factor 1 (RUNX1) ChIP-seq data were downloaded from the National Center for Biotechnology Information (NCBI) Gene Expression Omnibus (GEO) database, accession numbers GSE42075, GSE117864, and GSE138031. Proximity ligation-assisted ChIP sequencing (PLAC-seq) data, assay for transposase-accessible chromatin using sequencing (ATAC-seq) data, and ChIP-seq data (H3K27ac and H3K4me3) from the ALL cell line NALM-6 were obtained from GEO, accession number GSE126300.26 Raw reads were aligned to human_g1k_v37 using the Burrows-Wheeler Aligner (BWA)27 and signal tracks were generated using deeptools.28
DS1, DS2, and DS3 motif scanning
Motif scanning of the DNaseI hypersensitive site (DS)1, DS2, and DS3 regulatory elements was done with the GimmeMotifs (v0.12.0).29 Initally, “gimme scan” was run with hg19 as reference, against the GimmeMotifs default motif database gimme.vertebrate.v5.0, derived from the Catalog of Inferred Sequence Binding Preferences (CIS-BP) database.30 To specifically scan for ERG and RUNX motifs, a custom position weight matrix file, containing 3 ERG motifs and 8 RUNX motifs (supplemental Table 1 and supplemental Figure 2), was generated from ERG and RUNX position weight matrices from the gimme.vertebrate.v5.0, HOMER,31 and Jaspar CORE32 databases.
Hi-C data analysis
Previously published high-resolution chromosome conformation capture (Hi-C) data from 6 primary BCP ALL samples, including 1 sample with 13q12.2 deletion (#3 in the present study; Table 1), were used to investigate the chromatin interaction at the 13q12.2 locus.3 To achieve high-resolution chromatin-interactions maps, the previously constructed Hi-C libraries from 2 of the high-hyperdiploid cases,3 including #3, were resequenced on a NovaSeq (Illumina), with 1.5 billion pair-end reads obtained for each sample. Paired-end reads were mapped to human_g1k_v37 using Juicer.33 Hi-C data of the GM12878 and NALM-6 cell lines were downloaded from GEO (accession numbers GSE63525 and GSE115491, respectively). All .hic files were converted into 25-kb read count matrices. Reads mapped to the same or adjacent bins were removed. The filtered contact matrices were normalized by the chromosome-adjusted iterative correction procedure.34 Standardized genome-wide chromosome-adjusted iterative correction procedure scores (Z scores) were used for interaction frequency analysis. Additionally, multiHiCcompare was used to detect differential chromatin interactions.35 Insulation score36 calculations were performed as described in Yang et al.3
Results
Hemizygous 13q12.2 microdeletions are recurrent in BCP ALL
Overall, hemizygous 13q12.2 deletions were identified in 27 of 1418 BCP ALL cases in the 5 cohorts (Table 1). The deletion size varied from 39 kb to 160 kb, with a median size of 129 kb (Figure 1A). The majority of the proximal breakpoints were located immediately upstream of the FLT3 gene, whereas the distal breakpoints mapped to introns 6 (20 of 27; 74%), 5 (3 of 27; 11%), 1 (2 of 27; 7.4%), 2 (1 of 27; 3.7%), and 8 (1 of 27; 3.7%) of the PAN3 gene. Metaphase fluorescence in situ hybridization in 2 cases and WGS in 11 cases confirmed that the CNAs in the region were due solely to interstitial deletions and not associated with other structural rearrangements (Table 1; supplemental Figure 3). The deletions could be confirmed to be somatic in 23 of 27 cases based on comparison with a matched normal sample (#1-2, #4-15, and #20-27) or because of a small residual signal from the normal cells in the SNP array analysis (#3). Two cases (#6 and #7) harbored subclonal deletions (estimated to <10% of the cells). One case (#16) had trisomy 13 as well as 2 different 13q12.2 deletions, thus retaining 1 copy of this segment (supplemental Figure 4). Of the 27 cases with 13q12.2 deletions, paired diagnostic and relapse samples were available from 5 cases. Three of these had the same deletion at both diagnosis and relapse, 1 case lost the deletion at relapse, and 1 case harbored the deletion at relapse but not at diagnosis (Table 1). Among 25 investigated cases with 13q12.2 deletions, FLT3 mutations were identified in 9 (36%) (Table 1).
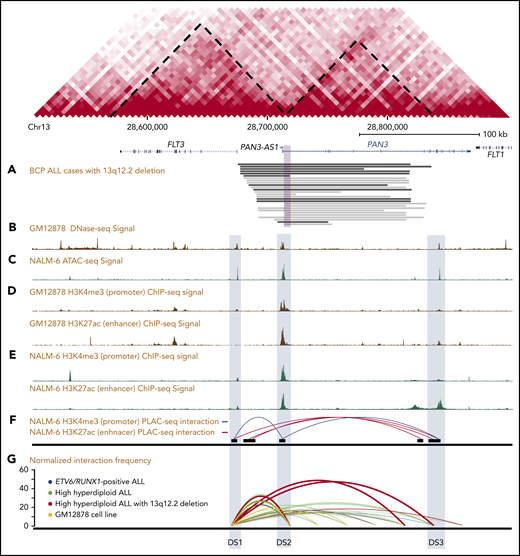
Genetic mapping and epigenetic landscape of the 13q12.2 locus. Map of the FLT3 and PAN3 loci in 13q12.2. Predicted topologically associating domains based on data from the lymphoblastic GM12878 cell line are indicated by diagonal dashed lines. (A) Hemizygous deletions identified in 27 BCP ALL samples by WGS (black) or SNP array or WES (gray). The violet square corresponds to the minimally deleted region. (B) DNase-seq signal based on the GM12878 cell line. (C) ATAC-seq signal based on the NALM-6 cell line. (D) ChIP-seq of histone modifications (H3K27ac and H3K4me3) based on the GM12878 (E) and the NALM-6 cell lines. (F) H3K27ac- and H3K4me3-enriched PLAC-seq interaction map based on the NALM-6 cell line. (G) Relative interaction frequencies in 13q12.2 in 6 primary ALL cases and the GM12878 cell line based on Hi-C, where higher values on the y-axis correspond to stronger interaction. Increased interactions with the enhancer element DS3 are seen in the case with 13q12.2 deletion.
Genetic mapping and epigenetic landscape of the 13q12.2 locus. Map of the FLT3 and PAN3 loci in 13q12.2. Predicted topologically associating domains based on data from the lymphoblastic GM12878 cell line are indicated by diagonal dashed lines. (A) Hemizygous deletions identified in 27 BCP ALL samples by WGS (black) or SNP array or WES (gray). The violet square corresponds to the minimally deleted region. (B) DNase-seq signal based on the GM12878 cell line. (C) ATAC-seq signal based on the NALM-6 cell line. (D) ChIP-seq of histone modifications (H3K27ac and H3K4me3) based on the GM12878 (E) and the NALM-6 cell lines. (F) H3K27ac- and H3K4me3-enriched PLAC-seq interaction map based on the NALM-6 cell line. (G) Relative interaction frequencies in 13q12.2 in 6 primary ALL cases and the GM12878 cell line based on Hi-C, where higher values on the y-axis correspond to stronger interaction. Increased interactions with the enhancer element DS3 are seen in the case with 13q12.2 deletion.
13q12.2 deletions are enriched in the high-hyperdiploid ALL subgroup and associated with relapse
We next investigated the cytogenetic and clinical features of cases with 13q12.2 deletions. Among 9 cases with 13q12.2 deletions in cohort 1, 7 were high hyperdiploid (7 of 110; 6.4%) and 2 (2 of 166; 1.2%) were non–high-hyperdiploid (P = .046; 2-tailed Fisher exact test). Similarly, in cohort 2, deletions were identified in 4 of 120 high-hyperdiploid (2.7%) and 2 of 663 non–high-hyperdiploid (0.3%) cases (P = .012; 2-tailed Fisher exact test). The 4 cases with deletions that were not high hyperdiploid in cohorts 1 and 2 comprised 1 ETV6/RUNX1+ case, 2 cases with intrachromosomal amplification of chromosome 21 (iAMP21), and 1 B-other case (Table 2). Further investigations of 3 validation cohorts showed that 13q12.2 deletions were identified in 4 of 123 (3.3%; cohort 3), 3 of 97 (3.1%; cohort 4), and 5 of 139 (3.6%; cohort 5) high-hyperdiploid cases, respectively. Overall, the frequency of 13q12.2 deletions was 3.9% in high-hyperdiploid cases and 0.48% in nonhyperdiploid pediatric BCP ALL (P = 6.4 × 10⁻⁶, 2-tailed Fisher exact test). Thus, although 13q12.2 deletions were not restricted to high-hyperdiploid ALL, they were clearly more common in this subtype compared with other BCP ALL subtypes.
Clinical and cytogenetic data of 27 cases of ALL with 13q12.2 deletions
| Case* | Cohort | Sex | Age, y | WBC count, ×109/L | Genetic subtype | Karyotype at diagnosis |
|---|---|---|---|---|---|---|
| 1† | 1 | M | 3 | 51 | HeH | 55,XY,+X,+4,+5,+6,idic(7)(p11),+8,+10,+14,+17,+21 |
| 2† | 1 | F | 5 | 6.3 | HeH | 53,XX,+4,+6,+10,+14,+18,+21,+21 |
| 3† | 1 | F | 3 | 19 | HeH | 55,XX,+X,+4,+6,+7,+10,+14,+17,+18,+21 |
| 4† | 1 | M | 5 | 2.0 | HeH | 59,XXY,−1,−2,−3,−7,−9,−11,−12,−13,+14,−16,−19,−20,+21 |
| 5† | 1 | F | 6 | 1.2 | HeH | 53,XX,+X,+4,+6,+8,+10,+14,+17,+21,+21 |
| 6† | 1 | F | 15 | 3.5 | HeH | 57,XX,+X,+X,+4,+6,der(8)t(8;14)(p11;q12),+10,+14,+14,+17,+18,+21,+21 |
| 7† | 1 | M | 4 | 17 | HeH | 57,XY,+X,+3,+4,+6,+8,+10,+14,+16,+18,+21/55-57,idem,i(7)(q10) |
| 8† | 1 | F | 11 | 6.1 | iAMP21 | 45-47,XX,del(5)(p13),−7,−8,−19,qdp(21)(q22q22),+r,+1-2mar,inc |
| 9† | 1 | F | 4 | 12 | ETV6/RUNX1 | 46,XX,del(12)(p13p13),t(12;21)(p13;q22) |
| 10 | 2 | F | 17 | 19 | B-other | N/A |
| 11 | 2 | F | 10 | 5.6 | HeH | N/A |
| 12 | 2 | M | 17 | 2.1 | HeH | 57,XY,+X,+4,+6,+9,+10,+14,+14,+18,+21,+21,+mar |
| 13 | 2 | F | 7 | 3.6 | HeH | N/A |
| 14 | 2 | F | 2 | 1.3 | HeH | 53,XX,+X,+6,+14,+15,+17,+21,+21 |
| 15 | 2 | F | 12 | 1.1 | iAMP21 | N/A |
| 16 | 3 | M | 4 | 18 | HeH | 53,XY,+X,+4,+6,+13,+18,+21,+21‡ |
| 17 | 3 | F | 5 | 6.3 | HeH | 53,XX,+X,+4,+4,+6,+14,+21,+21/54,idem,+17‡ |
| 18 | 3 | M | 3 | 27 | HeH | 52,XY,+X,+6,+14,+17,+18,+21,+21‡ |
| 19 | 3 | F | 4 | 9.9 | HeH | 54,XX,+X,+X,+6,+10,+14,+18,+21,+21‡ |
| 20 | 4 | M | 4 | 2.0 | HeH | 52,XY,+X,+4,+6,+14,+21,+21‡ |
| 21 | 4 | F | 4 | 4.8 | HeH | 54,XX,+X,+4,+6,+14,+17,+18,+21,+21‡ |
| 22 | 4 | M | 10 | 1.4 | HeH | 54,XY,+X,+4,+10,+14,+14,+20,+21,+21/56,idem,+8,+9‡ |
| 23 | 5 | M | 12 | 36 | HeH | 57,XY,+X,+1,add(1)(p13),del(1)(q42),+3,+4,+6,+7,del(7)(q22),+10,−12,+14,+14,i(17)(q10),+21,+21,+mar |
| 24 | 5 | F | 7 | 7.2 | HeH | 54,XX,+X,dup(1)(q21q32),+4,+6,+10,+14,+17,+18,+21 |
| 25 | 5 | F | 13 | 18 | HeH | 55,XX,+X,+X,dup(1)(q25q44),+4,+6,+10,+14,+17,+18,+21 |
| 26 | 5 | F | 6 | 29 | HeH | 53,XX,+X,+4,+6,+9,+14,+21,+21/53,idem,−9,+der(9;17)(q10;q10) |
| 27 | 5 | F | 13 | 118 | HeH | 56,XX,+X,+4,+6,+8,+10,+11,+14,+14,+21,+21 |
F, female; HeH, high-hyperdiploid; iAMP21, intrachromosomal amplification of chromosome 21; M, male; N/A, data not available; WBC, white blood cell.
Cases 10-15 correspond to TARGET cases PANPRP, PANVUV, PAPHCJ, PARBRK, PAPJIB, and PARSZH, respectively. Cases 23-27 correspond to TARGET cases PARDXI, PARFJK, PARRVI, PAPAMH, and PARKZX, respectively.
The karyotypes of cases 1-9 have been previously published in Olsson et al.7
Based on SNP array data only.
Of the 27 cases with 13q12.2 deletions, 18 were female, giving a male-to-female ratio of 0.50 (Table 2). Restricting the analysis to the 23 high-hyperdiploid cases increased this ratio to 0.64 (14 female). The median age at diagnosis was 6 years for all patients (range, 2-17 years) and 5 years for high-hyperdiploid patients (range, 2-17 years) (Table 2). The median white blood cell count was 6.3 × 10⁹/L for all cases and the same for high-hyperdiploid cases only (range, 1.1-118 and 1.2-118, respectively).
We have previously reported that 13q12.2 deletions were enriched at diagnosis in cases that subsequently suffered leukemia relapse in cohort 1.5 To see whether this held true in an independent cohort, we analyzed data from cohort 2. 13q12.2 deletions were seen in 3 of 90 cases (3.3%) that relapsed and 3 of 690 cases (0.43%) that did not (P = .045; 2-tailed Fisher exact test), in line with the data from cohort 1.
13q12.2 deletions lead to upregulation of FLT3 in cis
The only gene in the 13q12.2-deleted region is PAN3, a regulatory subunit of the PAN2-PAN3 complex, involved in messenger RNA decay.37 The deletions comprised 1 (n = 2) or more exons (n = 25) of PAN3, including its promoter (Figure 1). To investigate whether the 13q12.2 deletions affect the expression of the PAN3 gene, differential expression analyses was performed on RNA-seq data. To avoid potential gene-expression bias between different subtypes of BCP ALL and gene-dosage effects caused by CNAs, we restricted this analysis to high-hyperdiploid ALL cases with disomy 13 (n = 83). Hemizygous deletions of 13q12.2 led to a somewhat reduced expression of PAN3 but this effect was not statistically significant (log2 fold change = −0.285; P = .27), indicating that PAN3 expression is rescued by expression of the retained allele (Figure 2). Because FLT3 is located immediately proximally to the 13q12.2 deletions, we next examined whether the expression of this gene was affected. Significantly higher expression of FLT3 (log2 fold change = 0.55; P = .025) was detected in cases with 13q12.2 deletions (n = 8) compared with cases lacking the deletion (n = 75), indicating that the deletions lead to increased expression of FLT3 in high-hyperdiploid ALL (Figure 2). This difference remained when cases with FLT3 mutations were excluded (P = .028; supplemental Figure 5A). There was no difference in FLT3 expression between cases with and without FLT3 mutation in cases lacking 13q12.2 deletion (supplemental Figure 5) or between female and male patients (supplemental Figure 6).
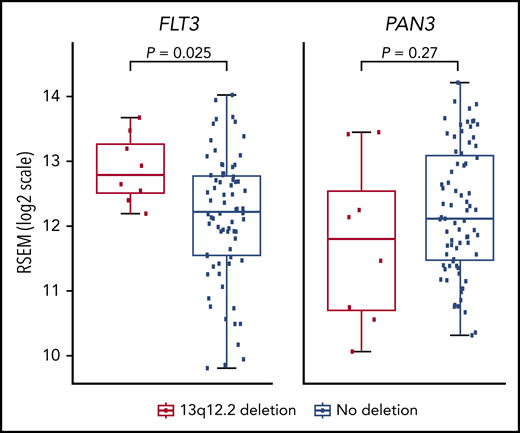
Gene-expression analysis of high-hyperdiploid cases with 13q12.2 deletions. RNA expression of the FLT3 and PAN3 genes in cases with and without 13q12.2 deletions.
Gene-expression analysis of high-hyperdiploid cases with 13q12.2 deletions. RNA expression of the FLT3 and PAN3 genes in cases with and without 13q12.2 deletions.
We next performed allele-specific expression analysis of FLT3. Of 77 informative BCP ALL cases with expression of exonic heterozygous SNVs detectable by RNA-seq, 9 harbored 13q12.2 deletions. Significant allele expression bias for FLT3 was seen in the 7 cases with clonal 13q12.2 deletions, whereas the 2 cases with subclonal deletions as well as cases lacking the deletion did not show allele-expression bias (Figure 3A).
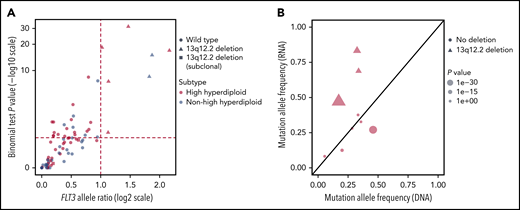
Allele-specific expression analysis of FLT3 in BCP ALL. (A) Scatterplot of allelic ratio (x-axis) and log-scale binomial P values (y-axis) of FLT3 in BCP ALL (n = 77) with informative SNVs. The horizontal line represents the binomial P value of .05 (log10 scale) and the vertical lines represent the ratio for the expressed reference/nonreference allele (log2 scale). All 7 cases with clonal 13q12.2 deletions displayed allele-specific expression of FLT3 (top right quadrant). (B) FLT3 mutant allele frequencies observed by RNA-seq (y-axis) and by genomic-sequencing data (x-axis) of 9 BCP ALL cases. The line y=x is shown in black. The 3 cases with concurrent FLT3 mutation and 13q12.2 deletion showed increased expression of the mutated allele.
Allele-specific expression analysis of FLT3 in BCP ALL. (A) Scatterplot of allelic ratio (x-axis) and log-scale binomial P values (y-axis) of FLT3 in BCP ALL (n = 77) with informative SNVs. The horizontal line represents the binomial P value of .05 (log10 scale) and the vertical lines represent the ratio for the expressed reference/nonreference allele (log2 scale). All 7 cases with clonal 13q12.2 deletions displayed allele-specific expression of FLT3 (top right quadrant). (B) FLT3 mutant allele frequencies observed by RNA-seq (y-axis) and by genomic-sequencing data (x-axis) of 9 BCP ALL cases. The line y=x is shown in black. The 3 cases with concurrent FLT3 mutation and 13q12.2 deletion showed increased expression of the mutated allele.
To ascertain whether it was the FLT3 allele on the chromosomal homolog harboring the deletion that was preferentially expressed (consistent with a cis effect) or the other FLT3 allele (a trans effect), SNP array data and WGS data were phased to build a haplotype scaffold of the 13q12.2 locus for each case. Six cases were informative in this analysis (ie, carried at least 2 heterozygous SNVs in the deleted region and at least 1 expressed heterozygous SNV in FLT3 exons). Per the analysis, all cases showed an upregulation of the FLT3 allele that was on the chromosome 13 homolog with the deletion, that is, a cis effect (supplemental Table 2).
To investigate the association between FLT3 mutations and 13q12.2 deletions, we analyzed the expression of the mutated alleles. Among the 9 informative BCP ALL cases with expression of somatic FLT3 mutations detectable by RNA-seq, significantly higher expression of the FLT3 mutation was detected in cases that carried 13q12.2 deletions (n = 3), in contrast to cases lacking 13q12.2 deletions (n = 6) (Figure 3B). This indicates that the FLT3 mutations were in the same chromosomal homolog as the 13q12.2 deletions and that the deletions lead to increased expression of the mutated alleles. Analyzing the predicted clonality of FLT3 mutations and 13q12.2 deletions in cases that harbored both revealed that the mutation and deletion were present at similar frequencies in the majority of cases, and thus likely present in the same clone (supplemental Figure 7). In 1 case each, the mutation and the deletion were found in a larger proportion of the cells. Furthermore, in 1 case, the mutation was missing in the relapse sample, showing that the deletion arose first.
Functional annotation of 13q12.2 regulatory elements
Considering our finding that 13q12.2 deletions are associated with upregulation of FLT3 expression in cis, we next examined the regulatory elements at this locus. Using publicly available DNase-seq and ATAC-seq data, 3 open chromatin regions were identified in the region: DS1 (FLT3 promoter, chr13:28 674 500 to 28 675 000), DS2 (chr13:28 710 000 to 28 715 000), and DS3 (PAN3 intron 8; chr13:28 843 000 to 28 843 500) (Figure 1B-C). The 13q12.2 deletions resulted in loss of DS2. Further examination of publicly available ChIP-seq data of the histone modifications H3K4me3 (marks of promoters) and H3K27ac (marks of active enhancers) showed that the H3K4me3 signal was enriched at DS1 and DS2 and the H3K27ac signal at DS2 and DS3 (Figure 1D-E), respectively. Further analysis of H3K4me3-enriched PLAC-seq data showed interactions between DS1 and DS2, whereas long-range interactions between DS1 and DS3 were observed in H3K27ac-enriched data (Figure 1F).26 These data indicate that DS2 and DS3 both act as enhancers for FLT3. Transcription factor–binding sites in these regions are given in supplemental Table 3. A targeted search for sequences commonly bound by RUNX1 and ERG showed a number of moderately strong hits (supplemental Table 4) and ChIP-seq data showed that the RUNX1 signal was enriched in all 3 regions whereas the ERG signal was enriched in DS1 and DS2 (supplemental Figure 8).
Hi-C data from ALL cell lines showed that the 13q12.2 locus is divided into 2 topologically associating domains (TADs), 1 harboring FLT3 and the other PAN3, with a TAD border at approximately chr13:28 710 000 to 28 715 000 (Figure 4A). The 13q12.2 deletions overlap with this TAD boundary (Figure 1). Analysis of high-resolution contact matrices from 2 primary high-hyperdiploid ALL, 1 without 13q12.2 deletion and 1 with, revealed that the case without deletion displayed similar TADs as in the cell lines whereas the ALL with deletion had lost these TADs (Figure 4A). To address this further, we analyzed the insulation score profile of previously published primary BCP ALL Hi-C data, in total 6 cases, including the case with 13q12.2 deletion.3 This showed that the deletion resulted in significant changes in the local insulation score profile, indicating that the 3-dimensional genome organization was disrupted in this region (Figure 4B). Increased interaction frequencies between DS1 and DS3 were also seen in the case with 13q12.2 deletion compared with samples lacking the deletion (Figure 1G). This finding was confirmed by statistical analysis of contact matrices from all samples, showing that the 13q12.2 deletion in case 3 significantly increased the interaction frequencies between DS1 and DS3 (false discovery rate <.01; supplemental Table 5). No differences were detected in contact matrices in chromosome 13 between female and male patients in BCP ALL samples without 13q12.2 deletion (supplemental Table 6). Taken together, our data demonstrate a novel cis-acting mechanism in which deletion of a TAD border and regulatory element DS2 leads to increased expression of the FLT3 allele located directly at the proximal end of the deletion via increased interactions with the DS3 enhancer (Figure 4C).
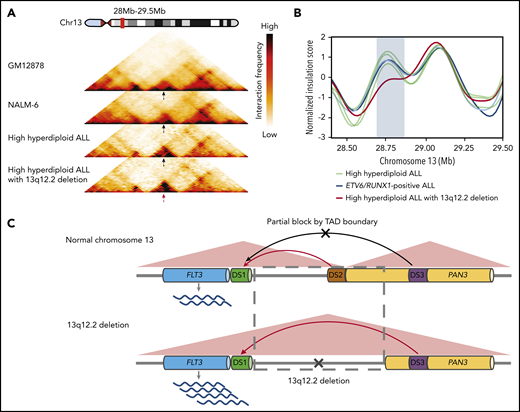
Changes in TADs and enhancer hijacking in ALL with 13q12.2 deletion. (A) Juicer KR-normalized Hi‐C interaction heatmaps at 13q12.2 (chr13:28.0 to 29.5 Mb) of the GM12878 cell line, the NALM-6 cell line, and 2 primary high-hyperdiploid ALL cases (25‐kb resolution). The black arrows indicate the TAD boundary between DS1 and DS3 and the red arrow indicates the disruption of this TAD boundary in the case with 13q12.2 deletion (case 3). (B) Insulation score profile at 13q12.2 derived from chromatin interaction sequencing of 6 primary ALL cases. The case with 13q12.2 deletion (case 3) displays a deviant insulation score in this region (blue rectangle), corresponding to aberrant chromatin organization likely due to loss of a TAD boundary. (C) Schematic figure of chromatin remodeling and enhancer hijacking in ALL with 13q12.2 deletion. In normal hematopoietic cells, FLT3 expression is primarily controlled by interactions between the FLT3 promoter element DS1 with the DS2 enhancer located in the 5′ region of PAN3 (top panel). In cells with 13q12.2 deletion, a TAD boundary is lost together with DS2, resulting in increased interactions between DS1 and the upstream enhancer element DS3, thereby upregulating FLT3 messenger RNA expression (bottom panel).
Changes in TADs and enhancer hijacking in ALL with 13q12.2 deletion. (A) Juicer KR-normalized Hi‐C interaction heatmaps at 13q12.2 (chr13:28.0 to 29.5 Mb) of the GM12878 cell line, the NALM-6 cell line, and 2 primary high-hyperdiploid ALL cases (25‐kb resolution). The black arrows indicate the TAD boundary between DS1 and DS3 and the red arrow indicates the disruption of this TAD boundary in the case with 13q12.2 deletion (case 3). (B) Insulation score profile at 13q12.2 derived from chromatin interaction sequencing of 6 primary ALL cases. The case with 13q12.2 deletion (case 3) displays a deviant insulation score in this region (blue rectangle), corresponding to aberrant chromatin organization likely due to loss of a TAD boundary. (C) Schematic figure of chromatin remodeling and enhancer hijacking in ALL with 13q12.2 deletion. In normal hematopoietic cells, FLT3 expression is primarily controlled by interactions between the FLT3 promoter element DS1 with the DS2 enhancer located in the 5′ region of PAN3 (top panel). In cells with 13q12.2 deletion, a TAD boundary is lost together with DS2, resulting in increased interactions between DS1 and the upstream enhancer element DS3, thereby upregulating FLT3 messenger RNA expression (bottom panel).
Discussion
In this study, we performed a comprehensive genomic, transcriptomic, and chromatin architecture analysis of BCP ALL cases to investigate the frequency of 13q12.2 deletions and their pathological impact. Despite the loss of 1 copy of the PAN3 gene, we found no clear effect on its expression. Instead, we found that the breakpoints of the 13q12.2 deletions occur immediately 5′ to the FLT3 promoter. Considering that FLT3 mutations are well-known driver events in leukemia, we focused our studies on investigating the possible role of 13q12.2 deletions in dysregulation of FLT3 gene expression. We here show that the deletions disrupt the TAD structure and change promoter-enhancer interactions in the region, leading to increased expression of the FLT3 allele encoded on the same chromosomal homolog (Figure 4C). Such enhancer hijacking has recently been reported for the IRS4 gene in lung cancer, sarcoma and squamous cell cancer, the CCNE1 and IGF2 genes in gastric cancer, and the TAL1 and LMO2 genes in T-ALL,38-40 but it is not yet known how common this mechanism is in tumorigenesis. Our data demonstrate, for the first time, that 13q12.2 deletions lead to FLT3 overexpression via chromatin remodeling and enhancer hijacking in leukemia and reveal new details of normal FLT3 regulation in hematopoietic cells.
High levels of FLT3 expression have been shown to be associated with FLT3 phosphorylation in leukemia, resulting in putative ligand-independent activation of the receptor.41,42 Thus, the 13q12.2 deletions are expected to result in activated downstream FLT3 signaling. Furthermore, high FLT3 expression has been reported to be a poor prognostic sign in both ALL and AML.42-45 In line with this, we found a higher frequency of relapses in cases with 13q12.2 deletions in 2 independent cohorts treated on different protocols. However, larger prospective studies are needed to determine whether 13q12.2 deletions could be used as a prognostic indicator in ALL.
We have previously reported that 13q12.2 deletions are associated with high-hyperdiploid ALL.5 Here, we could validate this in an independent data set. This strongly suggests that recurrent 13q12.2 deletions play a particular pathogenetic role in high-hyperdiploid ALL development. Notably, even though FLT3 levels are generally high in this subgroup, cases with deletions still had significantly increased expression. Together with the fact that FLT3 mutations are particularly common in high-hyperdiploid cases,4,46 this further indicates that FLT3 is a strong driver in the leukemogenesis of high-hyperdiploid ALL.
The basis for 13q12.2 deletions being enriched in high-hyperdiploid ALL is not known. Interestingly, 2 of the 4 nonhyperdiploid cases with 13q12.2 deletion belonged to the iAMP21 ALL subtype. iAMP21 is generally seen in only 2% of pediatric BCP ALL,47 indicating that 13q12.2 deletions could also be enriched in this subgroup. Both high-hyperdiploid and iAMP21 ALL have gain of parts of chromosome 21, including the region containing the genes encoding the RUNX1 and ERG hematopoietic transcription factors. Interestingly, we detected putative binding sites for RUNX1 in the DS2 and DS3 regulatory regions, and ALL cell line ChIP-seq data showed RUNX1 binding to these regions. It is thus possible that RUNX1 plays a role in the strong association between 13q12.2 deletions and high-hyperdiploid/iAMP21 leukemia but further functional studies are needed to substantiate this.
There were more female than male patients with 13q12.2 deletion both overall and in high-hyperdiploid cases only. BCP ALL is somewhat more common in male patients,48 whereas the high-hyperdiploid subtype is equally common in female and male patients.49 We could not detect a difference in chromatin interactions in chromosome 13 or FLT3 expression levels between female and male patients, indicating that gene regulation in the 13q12.2 locus is similar between the sexes. Taken together, further studies of larger cohorts of ALL with 13q12.2 deletion are needed to determine whether the skewed sex ratio detected in this study was incidental or corresponds to a true biological phenomenon.
Previous studies have shown that FLT3 ITD and activating mutations are associated with upregulation of FLT3 expression in AML.41,42 Moreover, in AML, FLT3 mutations are rendered homozygous via somatic uniparental isodisomy of 13q in a proportion of the cases, indicating that increased expression levels of FLT3 mutations contribute to leukemia development.42,43 We could not detect higher FLT3 expression in cases with FLT3 mutations lacking 13q12.2 deletion. However, 3 ALL cases with concurrent 13q12.2 deletions and FLT3 mutations showed significantly higher expression of the FLT3-mutated alleles, suggesting a potential selective advantage of the FLT3 mutant clone with 13q12.2 deletions through increased expression of the mutation. Analysis of the clonal composition of leukemia with concurrent FLT3 mutations and 13q12.2 deletions showed that either the mutation or the deletion could occur first, indicating that these aberrations do not occur in a specific order.
The precise timing of the 13q12.2 deletions in BCP ALL vary among cases. Of 5 paired diagnostic-relapse samples with 13q12.2 deletions, 3 shared the deletion, suggesting that it was present in the leukemic founder clone. On the other hand, 1 case with paired diagnostic-relapse samples harbored the deletion only in the diagnostic clone, whereas another had it only in the relapse clone, suggesting a later occurrence. Furthermore, 1 case with trisomy 13 harbored different deletions in 2 of the chromosomal homologs, showing that at least 1 of the deletions must have occurred after the gain of this chromosome. Finally, 2 cases had subclonal deletions, indicating that the deletion occurred at later stages of the leukemic evolution. Thus, the 13q12.2 deletion appears to give a selective advantage to the leukemic cell regardless of the stage at which it arises.
In summary, our study describes a novel way of FLT3 involvement in leukemogenesis by upregulation via enhancer hijacking. These data further highlight the role of FLT3 as a driver event in the development of high-hyperdiploid BCP ALL.
Publicly available data sets used in this study are available as specified in the different subsections. The remaining data sets are available from the corresponding author upon reasonable request.
The online version of this article contains a data supplement.
The publication costs of this article were defrayed in part by page charge payment. Therefore, and solely to indicate this fact, this article is hereby marked “advertisement” in accordance with 18 USC section 1734.
Acknowledgments
The results published here are in part based upon data generated by the Therapeutically Applicable Research to Generate Effective Treatments (TARGET) Initiative (phs000464). The TARGET data used for this analysis are available at https://portal.gdc.cancer.gov/projects. Information about TARGET can be found at https://ocg.cancer.gov/programs/target.
This work was supported by grants from the Swedish Cancer Society (CAN 2017/291 [B.J.]; CAN 2016/497 [K.P.]), the Swedish Childhood Cancer Foundation (TJ2018-0061 [M.Y.]; PR2018-0004 [B.J.]; PR2018-0023 [K.P.]), the Swedish Research Council (2016-01084 [B.J.]; 2016-01459 [K.P.]), the Ministry of Health of the Czech Republic (Czech Health Research Council; #15-30626A [M.Z.]), the University Hospital Motol (#00064203 [M.Z., J.Z.]), governmental funding of clinical research within the National Health Service (ALFSKANE-623431 [K.P.]), and the Royal Physiographic Society of Lund (M.Y.).
Authorship
Contribution: M.Y., L.O.-A., J.U., and K.H.N. analyzed data; S.S. and E.L.W. performed experiments; N.D., M.S., M.Z., J.Z., T.F., and B.J. provided resources and analyzed data; K.P. supervised the study; and M.Y. and K.P. designed the study and wrote the article with input from all authors.
Conflict-of-interest disclosure: The authors declare no competing financial interests.
Correspondence: Kajsa Paulsson, Division of Clinical Genetics, Lund University, BMC C13, SE-221 84 Lund, Sweden; e-mail: kajsa.paulsson@med.lu.se.

This feature is available to Subscribers Only
Sign In or Create an Account Close Modal