

Key Points
AML cells display aberrant CTCF occupancy, and patients with TET2 mutations show a particularly strong gain of CTCF binding in promoters.
Aberrant CTCF binding is enriched at CEBPA, PU.1, and RUNX1 motifs, and azacitidine exerts profound effects on CTCF occupancy.

Abstract
CCTC-binding factor (CTCF) is a key regulator of gene expression through organization of the chromatin structure. Still, it is unclear how CTCF binding is perturbed in leukemia or in cancer in general. We studied CTCF binding by chromatin immunoprecipitation sequencing in cells from patients with acute myeloid leukemia (AML) and in normal bone marrow (NBM) in the context of gene expression, DNA methylation, and azacitidine exposure. CTCF binding was increased in AML compared with NBM. Aberrant CTCF binding was enriched for motifs for key myeloid transcription factors such as CEBPA, PU.1, and RUNX1. AML with TET2 mutations was characterized by a particularly strong gain of CTCF binding, highly enriched for gain in promoter regions, while AML in general was enriched for changes at enhancers. There was a strong anticorrelation between CTCF binding and DNA methylation. Gain of CTCF occupancy was associated with increased gene expression; however, the genomic location (promoter vs distal regions) and enrichment of motifs (for repressing vs activating cofactors) were decisive for the gene expression pattern. Knockdown of CTCF in K562 cells caused loss of CTCF binding and transcriptional repression of genes with changed CTCF binding in AML, as well as loss of RUNX1 binding at RUNX1/CTCF-binding sites. In addition, CTCF knockdown caused increased differentiation. Azacitidine exposure caused major changes in CTCF occupancy in AML patient cells, partly by restoring a CTCF-binding pattern similar to NBM. We conclude that AML displays an aberrant increase in CTCF occupancy that targets key genes for AML development and impacts gene expression.
Introduction
Acute myeloid leukemia (AML) is a hematological malignancy characterized by accumulation of immature blast cells in the blood and bone marrow (BM). AML development is driven by aberrant gene expression patterns caused by genetic and epigenetic changes of the genome.1 The chromatin organizing protein CCTC-binding factor (CTCF) is a transcription factor (TF) and a key gene in the regulation of gene expression by forming 3-dimensional chromatin interactions.2,3 CTCF serves as an anchor at boundaries for topological associated domains (TADs), which defines compartments of genomic regions that are transcriptionally coregulated.4 Importantly, CTCF plays a key role in bringing promoters and enhancers together by either facilitating or inhibiting the contacts, as well as acting as an insulator through the isolation of genomic regions.5 Together with cohesin, CTCF organizes the looping of DNA at a 40-kb level, and the orientation of the binding motif sequence is crucial for the loop formation.6,7 However, CTCF does not seem to affect higher order genomic compartmentalization.8 CTCF binding is at least in part sensitive to DNA methylation,9,10 which suggests that DNA methylation can affect the CTCF-binding landscape and thereby the shaping of chromatin architecture. CTCF can also protect DNA from being methylated, and loss of CTCF binding results in hypermethylation of CTCF-binding sites (CBSs).11 CTCF has been implicated in carcinogenesis in general11 and has shown to be critical for normal development and hematopoiesis.12-14 Studies of aberrant CTCF binding in primary cancers have been scarce, and studies in AML are lacking.
AML is a heterogeneous disease characterized by chromosomal aberrations and/or genetic mutations in individual genes. Especially in cytogenetically normal AML, TF genes (ie, CEBPA and RUNX1), epigenetic genes (ie, DNMT3A, TET2, AXLH1, IDH1, and IDH2), and the nucleophosmin 1 gene (NPM1) are frequently mutated.15 A recent study found that CTCF directly interacts with NPM1 and that this interaction is critical for insulating functions of CTCF.16 Mutated NPM1 protein gets trapped in the cytosol and loses its ability to shuttle back to the nucleus.17 AML with mutated NPM1 has also been found to be associated with hypermethylation in AML.18
The TET2 (ten-eleven-translocation-2) enzyme converts 5-methylcytosine (5mC) DNA to 5-hydroxymethylcytosine (5hmC), which constitutes a step in the demethylation process.19 Consequently, loss-of-function mutations in TET2 cause global DNA hypermethylation.20 The TET2 enzyme also regulates alternative splicing through oxidation of 5mC at CTCF-binding sites. Indeed, a decreasing TET2 activity level results in increased 5mC, which causes CTCF eviction and promotes exon exclusion.21 Myelodysplastic syndrome and AML patients with TET2 mutations have been suggested to respond better to treatment with hypomethylating agents.22,23
Taken together, we hypothesized that aberrant CTCF occupancy could be involved in regulating leukemogenic gene expression patterns in AML and that AML with mutant NPM1 and TET2 would be of special interest to study with regard to CTCF binding. Our study reveals that AML is associated with an aberrant CTCF occupancy pattern characterized mainly by gain of CTCF binding enriched for motifs for key myeloid TFs. TET2-mutated AML stood out as a type of AML with an especially strong CTCF binding, while AML with NPM1 mutations did not display a distinct CTCF-binding pattern. In general, there was a strong anticorrelation between DNA methylation and CTCF binding, while the effect on gene expression was dependent on the location as well as binding on the motifs for the aberrant occupancy. In addition, exposure to azacitidine resulted in major changes in CTCF binding that were associated with the antiproliferative effects induced by the drug.
Methods
Patient material and normal CD34+ cells
BM mononuclear cells (MNCs) were obtained from 14 normal karyotype AML patients as well as 16 healthy donors after informed consent, following institutional review board approval and the Declaration of Helsinki recommendations. AML samples were vitally frozen and thawed before fluorescence-activated cell sorting (FACS) sorting, while normal BM (NBM) cells were sorted and used fresh.
FACS
BM-MNCs from AML patients were thawed and marked with anti-human antibodies against CD3, CD19, CD45 (all from BD Biosciences), CD33 (eBioscience), and NKp46 (Beckman Coulter) to purify AML cells and exclude normal T, B, and natural killer cells. After staining and sorting, AML cells were divided for RNA and DNA extraction and fixing for chromatin immunoprecipitation sequencing (ChIP-seq) analysis. Anti-CD61 (BD Biosciences) was used to analyze K562 differentiation.
DNA, RNA extraction, RNA-seq, and immunoblotting
Following sorting, cells were lysed with RLT buffer, and DNA and RNA were extracted using an AllPrep Kit (Qiagen) or TRIzol (Invitrogen) according to manufacturer protocol. RNA sequencing (RNA-seq) was performed as previously described.24 Protein lysate was loaded on sodium dodecyl sulfate gel, and antibodies against CTCF (Abcam) and actin (Abcam) were used. For details, see supplemental Methods (available at the Blood Web site).
ChIP-seq
For more information about the fixing protocol and ChIP-seq, see supplemental Methods.
DNA methylation
Methylation assay was performed using Infinium MethylationEPIC BeadChip (Illumina). For more details see supplemental Methods.
Cell lines, CTCF knockdown, and azacitidine exposure
K562, HAP1TET2−, and HAP1TET2+ cells were purchased from Horizon Discovery and cultured in Iscove Modified Dulbecco Medium (Gibco). CTCF was knocked down by small interfering RNA (siRNA) in K562 cells as described in supplemental Methods. Mononuclear cells from 4 patients were thawed and cultured with and without 1µM azacitidine every 12 hours for 5 days. After incubation with azacitidine, cells were FACS sorted and analyzed as described above (for details, see supplemental Methods).
RNA-seq data from the ClinSeq cohort
Expression data for the comparison of CTCF expression between AMLTET2mut and AMLTET2wt was retrieved from RNA-seq analysis from our previously published ClinSeq cohort.24,25
Data analysis
For a detailed description, see supplemental Methods. In short, DNA methylation data were processed using ChAMP26 and Limma packages. Data were normalized using BMIQ27 or FunctionalNormliazation28 for treated samples. ChIP-seq reads were aligned against reference genome GRCh38 with bowtie.29 Peaks were called with model-based analysis of ChIP-seq,30 and the DiffBind package was used to run differential binding analysis. ChIPpeakAnno was used for downstream analysis of peaks. Raw sequencing read quality was assessed by FastQC.31 For RNA-seq data, Star was used to align the reads to the reference genome GRCh38. FeatureCounts from subread was used to count the fragments in the exon regions as defined in the corresponding file. The edgeR package was used for RNA normalization using trimmed mean of M values to define a design matrix based on the experimental design, fit gene-wise generalized linear models, and conduct likelihood ratio tests for the selected group comparisons.
Results
CTCF binding is perturbed in AML with major gain of CTCF occupancy, especially in TET2-mutated AML
ChIP-seq for CTCF was performed on leukemic cells from 14 AML patients and CD34+ cells from the BM (NBM) of 5 healthy donors (Figure 1A). Samples were selected to represent subgroups of AML with TET2, and NPM1 mutations (supplemental Table 1), and patients with DNMT3A, IDH1, and IDH2 mutations were excluded. A CBS was defined as a ChIP-seq peak present in ≥2 samples among all analyzed samples. In total, 78 165 CBSs were identified in AML samples (AMLall, representing all AMLs regardless of mutations) and 61 376 in NBM samples (Figure 1B). Among CBSs, 17 507 were unique to AMLall and 718 were unique to NBM, while 60 658 were represented in both AML and NBM (Figure 1B). CBSs in AMLall vs NBM were significantly skewed toward increased binding in introns and intergenic sites (P < .05), while CBSs in TET2-mutated samples (AMLTET2mut) showed enrichment in promoter regions compared with TET2 wild-type samples (AMLTET2wt) (Figure 1C; supplemental Table 2). Significantly more enhancers were bound to CTCF in AMLall compared with NBM (Figure 1D). In an unsupervised clustering of the most variable CBSs, AML clustered separately from NBM, while AMLTET2mut clustered separately from other AMLs and displayed a strong increase in CTCF occupancy. In contrast, AML with NPM1 mutations (AMLNPM1mut) did not cluster separately from NPM1 wild-type samples (AMLNPM1wt) (Figure 1E). A principal-component analysis (PCA) plot further confirmed these separations (supplemental Figure 1A). There was no difference in CTCF expression between AMLall and NBM or between AML with or without TET2 mutations, suggesting that differences in CTCF expression do not explain the pattern of gained CTCF occupancy (supplemental Figure 1B-C).

CTCF occupancy and its distribution within the genome. (A) Experimental outline illustrating the analyses of patient samples. (B) Venn diagram displaying unique and common CTCF peaks in AMLall and NBM cells. (C) Distribution of CTCF-binding sites over genomic features. (D) Percentage of enhancers that contain a CTCF-binding site (Z-test, *P < .01). (E) Heatmap of unsupervised hierarchical clustering for the 1000 most variably bound CTCF peaks based on interquartile range measure. DMSO, dimethyl sulfoxide; UTR, untranslated region.
CTCF occupancy and its distribution within the genome. (A) Experimental outline illustrating the analyses of patient samples. (B) Venn diagram displaying unique and common CTCF peaks in AMLall and NBM cells. (C) Distribution of CTCF-binding sites over genomic features. (D) Percentage of enhancers that contain a CTCF-binding site (Z-test, *P < .01). (E) Heatmap of unsupervised hierarchical clustering for the 1000 most variably bound CTCF peaks based on interquartile range measure. DMSO, dimethyl sulfoxide; UTR, untranslated region.
We then characterized differential CTCF occupancy and found 2064 differentially bound CTCF-binding sites (DBCs) between AMLall and NBM (false discovery rate [FDR] <0.05), where 1803 (87.4%) were gained and 261 (12.5%) lost in AMLall (Figure 2A; supplemental Table 3A,D). We also compared AMLTET2mut and AMLTET2wt vs NBM, which revealed 15 021 DBCs (13 311 (88.6%) gained) for AMLTET2mut vs NBM (Figure 2B; supplemental Table 3A,E) and 891 DBCs (539 (60.5%) gained) for AMLTET2wt vs NBM (Figure 2C; supplemental Table 3A,F). In AMLTET2mut vs AMLTET2wt, we identified 3217 DBCs, of which 2682 (83.6%) were gained and 526 (16.4%) lost in AMLTET2mut (Figure 2D; supplemental Table 3A,G). In contrast, AMLNPM1mut only showed 101 DBCs compared with AMLNPM1wt, confirming low impact on CTCF binding in AMLNPM1mut (Figure 2E; supplemental Table 3A,H). The overlap between DBCs from the AMLall vs NBM and the 2 mutation-specific comparisons was small (Figure 2F). Interestingly, the AMLTET2mut vs AMLTET2wt comparison revealed more unique DBCs than the AMLall vs NBM comparison (3070 vs 1934), showing a greater difference in mutation related CTCF occupancy within AML rather than between AML and normal cells. Clustering of all DBCs is shown in supplemental Figure 2A.
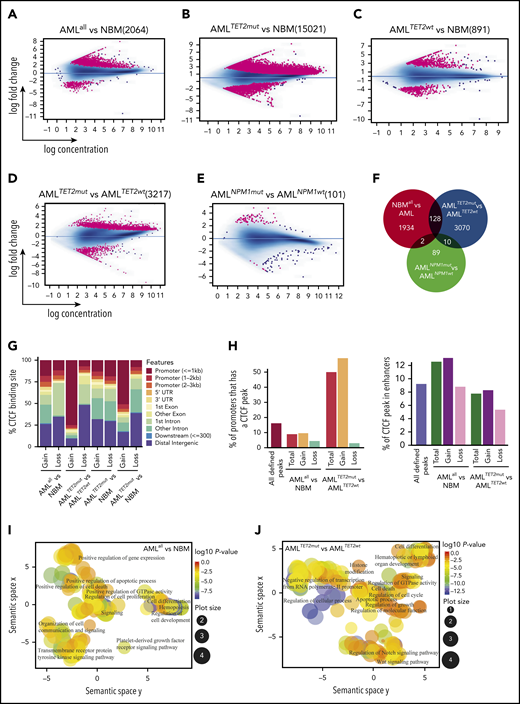
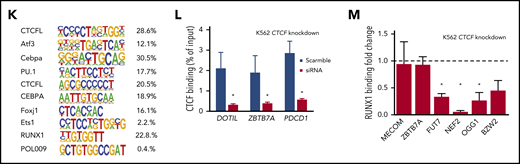
CTCF differential occupancy. (A-E) MA plots of differentially bound CTCF sites between AMLall and NBM (A), AMLTET2mut and NBM (B), AMLTET2wt and NBM (C), AMLTET2mut and AMLTET2wt (D), and AMLNPM1mut and AMLNPM1wt (E) (FDR <0.05). (F) Venn diagram showing DBC overlap for comparisons between AMLall vs NBM (pink circle), AMLTET2mut vs AMLTET2wt (blue circle), and AMLNPM1mut and AMLNPM1wt (green circle). (G) Distribution of gained and lost CTCF binding over genomic features for AMLall and AMLTET2mut specific DBCs. (H) Enrichment of differentially bound CTCF peaks in promoters (left) and enhancers (right) compared with all detected CTCF peaks. (I-J) Scatterplot of GO terms of gained DBCs in AMLall vs NBM (I) and AMLTET2mut vs AMLTET2wt (J). Circle color indicates P value (−log10P value) and circle size the frequency of the GO terms. (K) Motif analysis of all DBCs in AMLall vs NBM. (L) ChIP quantitative PCR using anti-CTCF in K562-CTCF knockdown cells (*P < .05; Student t test). (M) ChIP quantitative PCR using anti-RUNX1 in K562-CTCF knockdown cells; scramble control was set to 1 (dashed line), and values were normalized against scramble control (*P < .05; Student t test).
CTCF differential occupancy. (A-E) MA plots of differentially bound CTCF sites between AMLall and NBM (A), AMLTET2mut and NBM (B), AMLTET2wt and NBM (C), AMLTET2mut and AMLTET2wt (D), and AMLNPM1mut and AMLNPM1wt (E) (FDR <0.05). (F) Venn diagram showing DBC overlap for comparisons between AMLall vs NBM (pink circle), AMLTET2mut vs AMLTET2wt (blue circle), and AMLNPM1mut and AMLNPM1wt (green circle). (G) Distribution of gained and lost CTCF binding over genomic features for AMLall and AMLTET2mut specific DBCs. (H) Enrichment of differentially bound CTCF peaks in promoters (left) and enhancers (right) compared with all detected CTCF peaks. (I-J) Scatterplot of GO terms of gained DBCs in AMLall vs NBM (I) and AMLTET2mut vs AMLTET2wt (J). Circle color indicates P value (−log10P value) and circle size the frequency of the GO terms. (K) Motif analysis of all DBCs in AMLall vs NBM. (L) ChIP quantitative PCR using anti-CTCF in K562-CTCF knockdown cells (*P < .05; Student t test). (M) ChIP quantitative PCR using anti-RUNX1 in K562-CTCF knockdown cells; scramble control was set to 1 (dashed line), and values were normalized against scramble control (*P < .05; Student t test).
TET2-mutated AML is characterized by an enrichment of CTCF occupancy in promoters
We further analyzed the distribution of DBCs over genomic features and again, AMLTET2mut presented with a distinct pattern. Three-quarters (74%) of gained DBCs in AMLTET2mut vs AMLTET2wt were located within promoters and only 12% in distal intergenic regions, while almost half (48%) of the lost CBSs were located in distal intergenic regions and only 7% in promoter regions (Figure 2G; supplemental Table 3B). Gained and lost CBSs in AMLall vs NBM were distributed more similarly but with slightly more gain in promoters and “other” introns and more losses in distal intergenic regions and first introns (P < .05) (Figure 2G; supplemental Table 3B). Enhancers, as defined by the FANTOM project,32 gained CTCF binding in AMLall as well as AMLTET2mut (supplemental Table 3C). DBCs were enriched for enhancers in AMLall vs NBM, while DBCs for AMLTET2mut vs AMLTET2wt were highly enriched for promoters (P<.001; Figure 2H). Gene Ontology (GO) analysis of gained AMLall specific as well as gained AMLTET2mut-specific DBCs related to cell proliferation, cell death, and cell differentiation, while AMLTET2mut-specific DBCs also showed changes in Notch and Wnt signaling pathways33,34 (Figure 2I-J; supplemental Table 4A-B). Scatterplots of GO terms of lost sites as well as list of all GO terms for lost and gained are shown in supplemental Figure 2B-C and supplemental Table 4A-D.
To better understand the differences in CTCF binding seen in AMLTET2mut, we studied CTCF binding by ChIP polymerase chain reaction (PCR) in TET2-knockout HAP1 cells. CTCF binding was found to be increased at some CBSs, such as DOT1L, but also unchanged as well as decreased at other loci (supplemental Figure 3F). Thus, TET2 activity seems to affect CTCF binding, while the pattern of gain and loss appear to be context dependent. The results also suggest that other factors than the direct enzymatic activity of TET2 could be responsible for the change in CTCF occupancy in AMLTET2mut.
Differentially bound CTCF sites are enriched at key myeloid TFs, and loss of CTCF binding leads to partial loss of RUNX1 binding and altered cellular functions
The top motif for DBCs in AMLall vs NBM included CEBPA, PU.1, ETS1, and RUNX1, which are TFs known to be involved in AML development35,36 (Figure 2K; supplemental Table 5). Other top motifs such as ATF3, DDIT3 (C/EBPzeta, CHOP), and FOSL237 were significantly upregulated in the AMLall samples (supplemental Figure 3A), which may contribute to their AML-specific motif enrichment. CCCTC-binding factor like (CTCFL) that share the same binding motif as CTCF,38 was the most significantly enriched motif (Figure 2K). CEBPA motifs were found in the top gained, as well as top lost, DBCs, whereas BCL11A, Klf4, and Plagl1 were enriched for gained and AP-1 and PU.1 for lost DBCs (supplemental Figure 3C-D). DBCs for AMLTET2mut vs AMLTET2wt were also enriched for several important TFs suggested to play roles in hematopoiesis or leukemia, such as the KLF7,39 SOX4,40 FOXH1,41 HIC1,42 and BCL11A43 (supplemental Figure 3E).
To investigate whether a loss of CTCF binding also affected binding of neighboring TFs, we knocked down CTCF by siRNA in K562 cells and analyzed binding of CTCF (Figure 2L) and RUNX1 (Figure 2M) at cobinding regions by ChIP-PCR. CTCF knockdown caused a loss of CTCF binding as well as loss of RUNX1 binding at most, but not all, investigated sites (Figure 2L; supplemental Figure 3B), which shows RUNX1 binding to be dependent on CTCF occupancy in a context-dependent manner.
CTCF binding is known to impact the surrounding chromatin. In order to study histone changes at gained and lost DBCs, ChIP-seq was performed for H3K18ac, H3K27ac, and H3K4me1 in 5 AML samples (UPN01, UPN03, UPN15, UPN17, and UPN20) and H2A.Z in 4 AML samples (UPN01, UPN15, UPN17, and UPN20) and 4 NBM samples (Figure 3A). Differential binding to histone marks was calculated for DBCs between AMLall and NBM samples. Histone marks associated with active transcription and accessible chromatin, such as H3K18acetylation, H3K27acetylation, and H3K4me1, increased at gained CTCF-binding sites, while they decreased at lost DBCs in AML. The same pattern was thus observed for the promoter associated mark (H3K18acetylation), as well as the active enhancer mark (H3K27acetylation). Histone variant H2A.Z has been shown to increase chromatin accessibility for transcriptionally activating as well as repressive complexes,44 and we found lost CTCF binding in AMLall to be associated with decreased H2A.Z occupancy (Figure 3A).
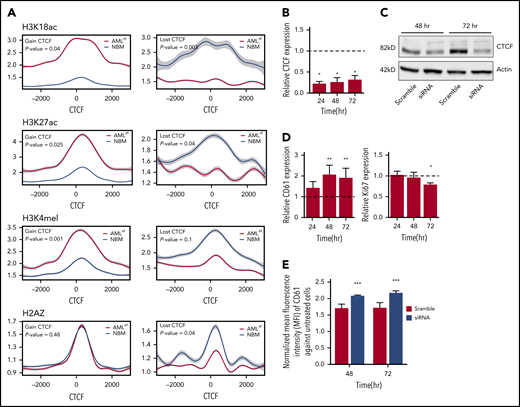
CTCF changes and their correlation with histone marks and effects on cell differentiation. (A) ChIP-seq on histone marks (H3K18ac, H3K27ac, H3K4me1, and H2AZ) displays changes in histone modifications around gained (left) and lost (right) CTCF-binding sites between AMLall and NBM. (B) CTCF expression by real-time quantitative PCR following its knockdown in K562 cells. Relative gene expression was calculated using 2−ΔΔCt against GAPDH, while scramble control was set to 1 (dashed line) and knockdown was normalized against the scramble (P < .05; Student t test). (C) Western plot showing CTCF protein levels following CTCF knockdown. (D) CD61 and Ki67 expression by real-time quantitative PCR in K562 after CTCF knockdown; normalization was done as described in panel B. (E) Detection of surface marker CD61 on K562-CTCF knockdown by FACS. Mean florescence intensity was used to calculate the expression level of CD61 after normalization against untransfected K562 cells (P < .001; Student t test). *P < .05, **P < .01, ***P < .001.
CTCF changes and their correlation with histone marks and effects on cell differentiation. (A) ChIP-seq on histone marks (H3K18ac, H3K27ac, H3K4me1, and H2AZ) displays changes in histone modifications around gained (left) and lost (right) CTCF-binding sites between AMLall and NBM. (B) CTCF expression by real-time quantitative PCR following its knockdown in K562 cells. Relative gene expression was calculated using 2−ΔΔCt against GAPDH, while scramble control was set to 1 (dashed line) and knockdown was normalized against the scramble (P < .05; Student t test). (C) Western plot showing CTCF protein levels following CTCF knockdown. (D) CD61 and Ki67 expression by real-time quantitative PCR in K562 after CTCF knockdown; normalization was done as described in panel B. (E) Detection of surface marker CD61 on K562-CTCF knockdown by FACS. Mean florescence intensity was used to calculate the expression level of CD61 after normalization against untransfected K562 cells (P < .001; Student t test). *P < .05, **P < .01, ***P < .001.
In addition, we studied whether cellular functions can be altered by CTCF knockdown in K562 cells. Transient knockdown by siRNA was effective at the mRNA and protein levels (Figure 3B-C) and caused a significant increase of the megakaryocytic differentiation marker CD61, a key differentiation marker in K562 cells (Figure 3D-E). In addition, the proliferation marker Ki67 was decreased after 72 hours (Figure 3D). Together, this suggests that knockdown of CTCF causes altered cellular function, particularly differentiation, in a leukemic cell line. It should be noted that altered cellular functions after CTCF knockdown have been shown to be dependent on cell type, type and efficacy of knockdown, and the time course.8
DNA methylation and gene expression analyses in AML and NBM cells
To integrate CTCF binding with DNA methylation and gene expression, EPIC methylation arrays and RNA-seq were performed on the same AML samples that had undergone ChIP-seq. AMLall samples displayed hypomethylation compared with NBM, with 70% of differentially methylated cytosine guanine dinucleotide (CpGs) (DMCs) being hypomethylated (supplemental Figure 4A). Similarly, 84.8% of DMCs in AMLNPM1mut were hypomethylated compared with AMLNPM1wt, while 93.2% of DMCs in AMLTET2mut were hypermethylated compared with AMLTET2wt (supplemental Figure 4A). Hypomethylation in AMLTET2mut occurred preferentially in the promoters, whereas hypermethylation was overrepresented in distal regions (supplemental Figure 4B). Differentially expressed genes (DEGs) were also defined between groups by RNA-seq data (supplemental Figure 4C and supplemental Table 6). PCA analyses using data from each omics analysis (data on DBCs, DMCs, and DEG) show the degree of separation between groups and underline the separation of NBM and AMLTET2mut with regard to CTCF binding and DNA methylation (Figure 4A).
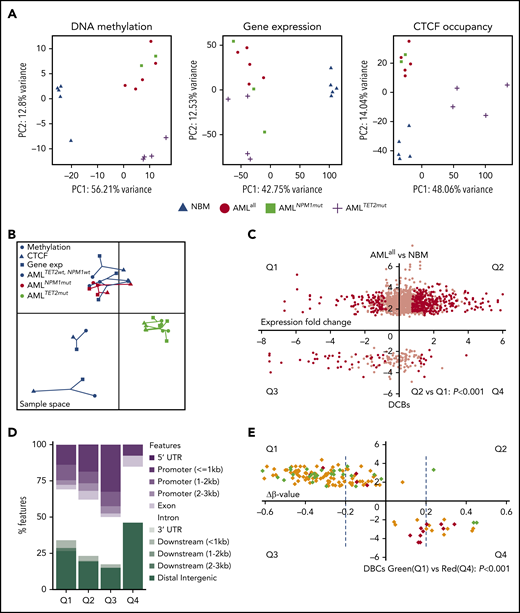
Correlations among CTCF occupancy, DNA methylation, and gene expression. (A) PCA analysis of DMCs (left), DEGs (middle), and DBCs (right) based on analyses from EPIC DNA methylation array, RNA-seq, and ChIP-seq for CTCF, respectively. (B) Multiple coinertia analysis of DMCs, DBCs, and DEGs based on EPIC DNA methylation, RNA-seq, and ChIP-seq data, where data from all 3 analyses performed in the same samples were integrated. Each patient is represented by filled circles for DNA methylation data, triangles for ChIP-seq data, and filled squares for gene expression data, while the length of the line that connects the 3 omics types is proportional to the divergence of the data in the same sample. (C) Dot plot of DBCs (AMLall vs NBM) in relation to the change in expression of the related genes comparing AMLall and NBM. The x-axis represents fold change of gene expression, and the y-axis fold change in CTCF occupancy (FDR <0.05). Black dots indicate genes with statistically significant change expression (FDR <0.05, fold change >1.5). χ2 test was used to calculate statistical significance between Q1 and Q2 (P < .001). (D) Bar plot showing the genomic distribution of DBCs with differentially expressed gene in panel C. (E) Dot plot of DBCs in relation to fold change of β-values (Δβ-value) for AMLall vs NBM, where the x-axis represents fold change in β-value and the y-axis fold change in CTCF occupancy. Statistical significance is indicated by dashed blue lines for Δβ-value (FDR <0.05, fold change >1.5). Green and red diamonds represent up- or downregulated genes, respectively, while yellow diamonds represent genes with no change in gene expression. χ2 test used to calculate statistical significance in gene expression between Q1 and Q4 (P < .001). PC, principal component.
Correlations among CTCF occupancy, DNA methylation, and gene expression. (A) PCA analysis of DMCs (left), DEGs (middle), and DBCs (right) based on analyses from EPIC DNA methylation array, RNA-seq, and ChIP-seq for CTCF, respectively. (B) Multiple coinertia analysis of DMCs, DBCs, and DEGs based on EPIC DNA methylation, RNA-seq, and ChIP-seq data, where data from all 3 analyses performed in the same samples were integrated. Each patient is represented by filled circles for DNA methylation data, triangles for ChIP-seq data, and filled squares for gene expression data, while the length of the line that connects the 3 omics types is proportional to the divergence of the data in the same sample. (C) Dot plot of DBCs (AMLall vs NBM) in relation to the change in expression of the related genes comparing AMLall and NBM. The x-axis represents fold change of gene expression, and the y-axis fold change in CTCF occupancy (FDR <0.05). Black dots indicate genes with statistically significant change expression (FDR <0.05, fold change >1.5). χ2 test was used to calculate statistical significance between Q1 and Q2 (P < .001). (D) Bar plot showing the genomic distribution of DBCs with differentially expressed gene in panel C. (E) Dot plot of DBCs in relation to fold change of β-values (Δβ-value) for AMLall vs NBM, where the x-axis represents fold change in β-value and the y-axis fold change in CTCF occupancy. Statistical significance is indicated by dashed blue lines for Δβ-value (FDR <0.05, fold change >1.5). Green and red diamonds represent up- or downregulated genes, respectively, while yellow diamonds represent genes with no change in gene expression. χ2 test used to calculate statistical significance in gene expression between Q1 and Q4 (P < .001). PC, principal component.
CTCF binding and DNA methylation anticorrelates in AML and NBM cells
To identify corelationships between multiple omics datasets, we used the integrative multiple coinertia analysis (Figure 4B). This analysis integrated differential loci for all samples that were covered by all 3 omics analyses (ChIP-seq, EPIC methylation array, and RNA-seq), which included all AML samples. Most strikingly, AMLTET2mut samples were highly correlated and distinguished from other AML samples.
In order to investigate how CTCF correlates with DNA methylation and gene expression, we integrated the data sets by overlapping CTCF peaks with CpGs in the EPIC array and related genes from RNA-seq. Regardless of sample type (AMLall or NBM), there was a strong anticorrelation between CTCF binding and DNA methylation (within 30 bp from the center of the CTCF peak; P = 2.2-4.2 × 10⁻¹⁶) (supplemental Figure 5). CTCF binding was dominantly found at unmethylated sites with β-values <0.10. Anticorrelation between CTCF binding and DNA methylation was also seen for DBCs in AMLall in enhancer locations (supplemental Figure 6B).
To understand why AMLTET2mut exhibited strong gain of CTCF occupancy and still showed genome-wide DNA hypermethylation, we investigated the degree of overlap between DMCs and CBSs. Importantly, of the hypermethylated DMCs in AMLTET2mut, only 7% (62 of 809) overlapped with a CBS. In contrast, 31% of hypomethylated DMCs in AMLall vs NBM were located in a CBS (supplemental Figure 6A). Also, gains of CTCF in AMLTET2mut were primarily seen at promoters where hypomethylation was overrepresented in AMLTET2mut (Figure 2G; supplemental Figure 4B). In addition, DBCs in promoters showed little overlap with DMCs in AMLTET2mut vs AMLTET2wt (supplemental Figure 6E). Furthermore, gained DBC in AMLTET2mut occurs at sites that are hypomethylated in both AMLTET2mutand AMLTET2wt (supplemental Figure 6F). Thus, hypermethylation in AMLTET2mut occurs dominantly outside of CTCF-binding sites. The same degree of anticorrelation between CTCF binding and DNA methylation is also seen in both AMLTET2mutand AMLTET2wt (supplemental Figure 6F-G).
Increased CTCF binding in promoter regions is associated with DNA hypomethylation and increased gene expression, while CTCF changes in distal regions anticorrelate with gene expression
We next investigated whether aberrant CTCF binding was related to proleukemic gene expression patterns. Therefore, all DBCs were investigated for changes in expression of related genes. In AMLall, gain of CTCF binding correlated with transcriptional upregulation (quadrant 2 [Q2] vs Q1; P < .001), while loss correlated with transcriptional downregulation (Q4 vs Q3; P < .05) (Figure 4C). Still, some genes displayed anticorrelation between CTCF binding and gene expression. DBCs in promoters were more likely to show a positive correlation to gene expression, while changes in distal intergenic regions were more likely to show an anticorrelation (Figure 4D). This finding could reflect the different roles of CTCF as a TF at promoters and as an insulator at gene distal locations where the location in relation to TAD boundaries likely is of importance.8,45 In addition, DBCs that correlate with active transcription were associated with binding motifs of transcriptional activators, such as RUNX2, FOSL2, OSR1, and FOXA2,37,46-48 while DBCs that anticorrelate with gene expression are associated with motifs of transcriptional repressors, such as BCL6, PRDM1, and YY249-54 (supplemental Table 8A-B).
DNA methylation data were also integrated with both CTCF binding and gene expression for DBCs in AMLall samples. Almost all sites that gained CTCF binding were hypomethylated (Figure 4E), while all sites that lost CTCF binding were hypermethylated. Gene expression decreased at hypermethylated sites that lost CTCF binding, while it was increased at hypomethylated sites that gained CTCF binding (Figure 4E). For AMLTET2mut vs AMLTETwt same trends were found (supplemental Figure 6C-D), but due to low overlap between AMLTET2mut specific DBCs and DMCs, changes were not statistically significant.
Among genes that increased regarding both CTCF binding and gene expression in AML were DOT1L, a histone H3K79 methyltransferase related to leukemia development and a well-known therapeutic target55 ; and ZBTB7A, known to be a proto-oncogene, overexpressed in leukemia56,57 and PDCD-1 (PD-1), which is a key check point in immunomodulation (Figure 5A-C,E). In addition, FOSL2, known to promote cell growth and constitutively expressed in leukemia,58 was hypomethylated and gained both CTCF binding and gene expression (Figure 5D-F).
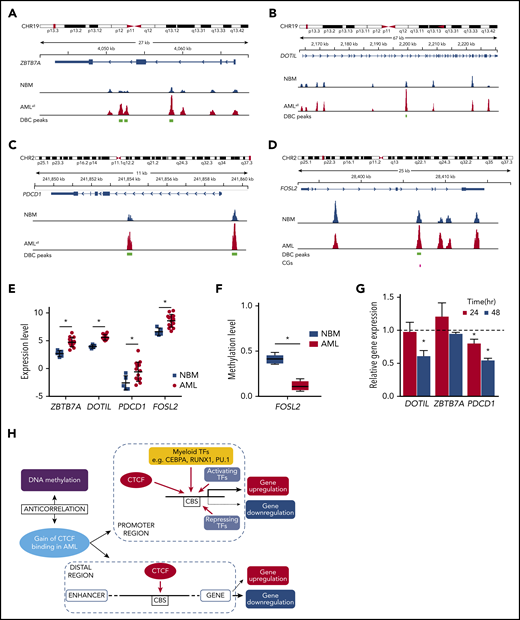
Genes with aberrant CTCF occupancy and changed gene expression in AML. (A-D) Integrative Genomics Viewer tracks visualize CTCF peaks from ChIP-seq results of AMLall and NBM for 4 genes: ZBTB7A (A), DOT1L (B), PDCD1 (C), and FOSL2 (D). Green boxes indicate differentially bound peaks, and pink boxes indicate a CpG detected by the EPIC array that overlaps with a DBC peak. (E) Expression levels of the 4 genes in panels A-D from RNA-seq data (*FDR <0.05, fold change >1.5). (F) Box plot of β-values for the CpG in FOSL2 (*FDR <0.05). (G) Gene expression by quantitative PCR following CTCF knockdown in K562 cells. Relative gene expression was calculated using 2−ΔΔCt against GAPDH, while scramble control was set to 1 (dashed line) and knockdown was normalized against the scramble control (P < .05; Student t test). (H) Hypothetical model of aberrant CTCF binding and how it relates to DNA methylation and gene expression in AML. CHR, chromosome.
Genes with aberrant CTCF occupancy and changed gene expression in AML. (A-D) Integrative Genomics Viewer tracks visualize CTCF peaks from ChIP-seq results of AMLall and NBM for 4 genes: ZBTB7A (A), DOT1L (B), PDCD1 (C), and FOSL2 (D). Green boxes indicate differentially bound peaks, and pink boxes indicate a CpG detected by the EPIC array that overlaps with a DBC peak. (E) Expression levels of the 4 genes in panels A-D from RNA-seq data (*FDR <0.05, fold change >1.5). (F) Box plot of β-values for the CpG in FOSL2 (*FDR <0.05). (G) Gene expression by quantitative PCR following CTCF knockdown in K562 cells. Relative gene expression was calculated using 2−ΔΔCt against GAPDH, while scramble control was set to 1 (dashed line) and knockdown was normalized against the scramble control (P < .05; Student t test). (H) Hypothetical model of aberrant CTCF binding and how it relates to DNA methylation and gene expression in AML. CHR, chromosome.
In order to investigate the causal relationship between differential CTCF binding and changed gene expression, we knocked down CTCF in K562 cells and studied the expression of genes at DBCs that had also displayed altered gene expression in AMLall vs NBM. Knockdown led to loss of CTCF at DBCs (Figure 2L) as well as downregulation of related genes (Figure 5G). However, the impact on expression is likely promoter regulation dependent, since not all genes that lose CTCF binding become transcriptionally repressed. A hypothetical model, based on ours and previously published results on CTCF, is shown in Figure 5H and outlines the relationships among aberrant CTCF binding, DNA methylation, and gene expression in AML.
Azacitidine treatment induces profound changes in CTCF occupancy in AML patient cells
The demethylating agent azacitidine is widely used for treatment of myeloid malignancies, including AML.22 Therefore, we further investigated how azacitidine exposure affects CTCF occupancy and the resulting gene expression. We incubated samples from 4 AMLTET2mut patients with and without azacitidine in vitro (at concentrations inducing antileukemic effects; see supplemental Figure 7A) and analyzed samples by ChIP-seq for CTCF, RNA-seq, and EPIC methylation array. Firstly, we confirmed that azacitidine exposure caused demethylation (Figure 6A). Azacitidine also caused a significant change in CTCF binding with 14 943 DBCs. There was an equal number of gained and lost CBSs (7474 vs 7469 lost; FDR <0.001; Figure 6B), but DBCs with more than twofold change were enriched for gained sites (7073 gained vs 5251 lost, dark pink). Top DBCs are listed in supplemental Table 7. A PCA analysis showed that azacitidine had a significant impact on CTCF occupancy, DNA methylation, and transcriptomic level (Figure 6C). Both gain and loss of CTCF binding was significantly associated with increased expression (P < .001; Figure 6D). In addition to enrichment for the CTCF motif (P < 1 × 10⁻¹⁶), repressed genes were significantly enriched for the transcriptional repressor BCL11A (P < 1 × 10⁻¹¹) (supplemental Table 8C) while transcriptionally activated genes were enriched for motifs for transcriptional activators such as PLAGL1 (P < 1 × 10⁻¹⁹) and POU2F2 (P < 1 × 10⁻¹²) (supplemental Table 8D). GO term analysis on DBCs that also changed expression upon azacitidine exposure showed terms related to apoptosis, cell death, and cell differentiation among upregulated genes and GO terms related to DNA biosynthesis and DNA replication among downregulated genes (supplemental Figure 7B-C and supplemental Table 9A-B).
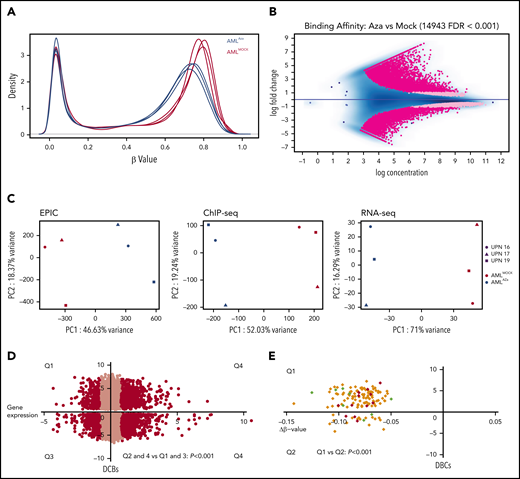
Azacitidine induces hypomethylation and changes in CTCF occupancy. (A) Density plots for β-values of all normalized CpGs (n = 723 768) in azacitidine and mock-treated AML samples. (B) MA plot of differentially bound CTCF sites between azacitidine- and mock-treated samples (FDR <0.001). Dark pink dots show peaks with fold change >1.5. (C) PCA analysis of differentially methylated sites (left), differentially bound sites (middle), and differentially expressed genes (right) based on EPIC array data, ChIP-seq for CTCF, and RNA-seq, respectively, in azacitidine- vs mock-treated AML samples. (D) Dot plot of DBCs in relation to changes in gene expression between azacitidine- vs mock-treated samples. The x-axis represents fold change in gene expression and the y-axis fold change in CTCF occupancy (FDR <0.001). Black dots represent genes with statistically significant changes in gene expression (FDR <0.05, fold change >1.5); χ2 test was used to calculate statistical significance between up- and downregulated genes (P < .001). (E) Dot plot of DBCs in relation to fold change in DNA methylation by β-values (Δβ-value) for azacitidine- vs mock-treated samples. The x-axis represents Δβ-value (FDR<0.1) and the y-axis fold change in CTCF occupancy (FDR <0.001). Green and red dots represent up- or downregulated genes, respectively (FDR <0.05, fold change >1.5); χ2 test was used to calculate statistical significance between Q1 and Q2 (P < .001).
Azacitidine induces hypomethylation and changes in CTCF occupancy. (A) Density plots for β-values of all normalized CpGs (n = 723 768) in azacitidine and mock-treated AML samples. (B) MA plot of differentially bound CTCF sites between azacitidine- and mock-treated samples (FDR <0.001). Dark pink dots show peaks with fold change >1.5. (C) PCA analysis of differentially methylated sites (left), differentially bound sites (middle), and differentially expressed genes (right) based on EPIC array data, ChIP-seq for CTCF, and RNA-seq, respectively, in azacitidine- vs mock-treated AML samples. (D) Dot plot of DBCs in relation to changes in gene expression between azacitidine- vs mock-treated samples. The x-axis represents fold change in gene expression and the y-axis fold change in CTCF occupancy (FDR <0.001). Black dots represent genes with statistically significant changes in gene expression (FDR <0.05, fold change >1.5); χ2 test was used to calculate statistical significance between up- and downregulated genes (P < .001). (E) Dot plot of DBCs in relation to fold change in DNA methylation by β-values (Δβ-value) for azacitidine- vs mock-treated samples. The x-axis represents Δβ-value (FDR<0.1) and the y-axis fold change in CTCF occupancy (FDR <0.001). Green and red dots represent up- or downregulated genes, respectively (FDR <0.05, fold change >1.5); χ2 test was used to calculate statistical significance between Q1 and Q2 (P < .001).
We then specifically searched for genes that were demethylated by azacitidine and concomitantly changed CTCF binding and gene expression. Among top genes were KLF6 (Figure 7A-C), SP140, and SLC2A6. SP140 has shown to be specifically methylated in TET2 mutant hematological malignancies.59,60 SLC2A6 has been implicated in solid tumors and is a marker for chronic lymphocytic leukemia with trisomy 12.61,62 Most interestingly, KLF6 is epigenetically dysregulated and methylated in AML.63,64 Furthermore, among CTCF sites gained with azacitidine, 56% (4162 of 7473) were sites normally bound in NBM (Figure 7D), which suggests that azacitidine restores some of the aberrant CTCF-binding pattern in AML.

Azacitidine demethylates, causes gain in CTCF occupancy, and increases KLF6 gene expression. (A) Integrative Genomics Viewer tracks visualize a CTCF peak, the green box represents a differentially bound peak, and the pink boxes a detected CpG by the EPIC array, overlapping with the DBC peak. (B) Expression levels of KLF6 gene (*FDR <0.05, fold change >1.5). (C) Methylation of the 2 CpGs shown in panel A as measured by β-values (*FDR <0.1). (D) Venn diagram showing the overlap CTCF-binding sites gained with azacitidine treatment (red circle) and CTCF-binding sites bound in NBM. There are significant number of gained CTCFs in AMLaza that overlap with NBM (Z-test, P < .001).
Azacitidine demethylates, causes gain in CTCF occupancy, and increases KLF6 gene expression. (A) Integrative Genomics Viewer tracks visualize a CTCF peak, the green box represents a differentially bound peak, and the pink boxes a detected CpG by the EPIC array, overlapping with the DBC peak. (B) Expression levels of KLF6 gene (*FDR <0.05, fold change >1.5). (C) Methylation of the 2 CpGs shown in panel A as measured by β-values (*FDR <0.1). (D) Venn diagram showing the overlap CTCF-binding sites gained with azacitidine treatment (red circle) and CTCF-binding sites bound in NBM. There are significant number of gained CTCFs in AMLaza that overlap with NBM (Z-test, P < .001).
Discussion
CTCF plays a critical role in gene regulation by shaping the structure of chromatin through DNA looping.2,3 For the first time, we here investigated CTCF occupancy in AML patient cells and normal CD34+ BM cells. We investigated the differential CTCF binding in normal vs AML cells and in subgroups of AML cells and integrated CTCF occupancy with genome-wide data on gene expression and DNA methylation. As CTCF binding has been related to DNA methylation,9,10 we also explored the effects of the demethylating drug azacitidine on CTCF binding and related gene expression patterns.
AML cells displayed an aberrant CTCF-binding pattern compared with normal CD34+ BM cells with a significant gain of CTCF occupancy that was enriched in enhancers. Relevant to this, we have previously shown the importance of enhancer usage in both normal myelopoiesis65 and AML.66 AML samples with TET2 mutations showed a particularly strong gain of CTCF occupancy, and this gain was highly enriched at promoter locations. As NPM1 binds to CTCF,16 we hypothesized that mutant NPM1 could impact on CTCF binding through dysfunctional CTCF nuclear transport. However, NPM1 mutations did not significantly impact CTCF binding in our analysis; thus, AMLNPM1mut vs AMLNPM1wt samples were not studied further in detail.
The top 10 motifs for aberrant CTCF occupancy in AMLall included well-known myeloid TFs known to play a role in AML such as CEBPA, PU.1, and RUNX1, which suggest CTCF binding to be involved in the leukemogenic process. The top motifs specific for AMLTET2mut were also TFs known to be involved in leukemia transformation such as SOX4,40 FOXH1,41 and HIC1.42 Furthermore, GO analysis of genes with aberrant CTCF binding and gene expression in AMLTET2mut were enriched for Notch and Wnt signaling. Moreover, GO analysis of differential CTCF binding in AMLall as well as AMLTET2mut showed effects on GO terms related to cell proliferation, cell death, and apoptosis. In addition, sites that changed CTCF binding in AML also displayed epigenetic and chromatin alterations by changes in histone marks. Marks for active chromatin were increased at gained CTCF sites, whereas they were lost at lost CTCF sites. In total, the relation of differential CTCF binding to transformative myeloid TFs and GO terms relevant for leukemia transformation, as well as chromatin changes, suggests that CTCF binding could be involved in regulating leukemogenic gene expression patterns in AML. As a next step, we knocked down CTCF in K562 cells and showed that the knockdown caused decreased CTCF binding as well as RUNX1 binding at specific RUNX1 targets. This shows that occupancy of TFs that bind in the vicinity to CTCF can display CTCF dependency, albeit not at all sites. Knockdown also caused downregulation of genes that were differentially bound to CTCF and differentially expressed in AML. With regard to cellular functions, knockdown caused an increase in cell differentiation and decrease in Ki67 expression, a marker for proliferation. This suggests that changed CTCF binding can alter cellular functions in a leukemogenic direction. Previous studies have shown growth inhibitory effect upon CTCF knockdown8,67,68 ; however this is dependent on the efficacy of the knockdown, cell type, and time course.8,67,68
CTCF binding has previously been related to DNA methylation,10,11,69 and indeed, a strong correlation between CTCF occupancy and DNA methylation was found. Previous studies aiming to decipher the hierarchy of the events have shown that CTCF binding can regulate DNA methylation67 but also that DNA methylation can direct CTCF binding.68 In line with previous reports,70 we show global hypomethylation in AML, which could theoretically be consistent with an increase in CTCF binding. Conversely, AMLTET2mut patients exhibited global hypermethylation but still an increase in CTCF occupancy. We hypothesized that this unexpected correlation was due to AMLTET2mut-specific methylation occurring outside of CTCF-binding sites and that CTCF changes occur at sites lacking CpGs, making them insensitive to DNA methylation. Indeed, only 7% of the hypermethylated sites in AMLTET2mut overlapped with CTCF binding. This suggests that hypomethylation in AMLTET2mut occurs mainly outside of CTCF-binding sites and thus does not contribute to the changes in CTCF binding. Still, the role of hydroxymethylation on CTCF binding needs to be further investigated.
CTCF regulates gene expression through multiple mechanisms2,3,5 and we show that a change in CTCF occupancy can be associated to both up- and downregulation of related genes. However, gain of CTCF binding was more commonly associated with gene upregulation and loss of CTCF binding with downregulation. Still, the outcome on gene expression of changes in CTCF binding was not random. Gains in promoter regions were more likely related to upregulation of genes, whereas downregulation was more common at genomic regions distal to promoters. One could speculate whether this relates to CTCF as an TF and an activator of gene expression at promoters and as an insulator located at more promoter-distant regions.45 In line with this, depletion of CTCF has previously been shown to decrease gene expression near transcription start sites and induce gene expression more distal to transcription start sites, especially when occurring at a TAD boundary separating an enhancer from a promoter.8 Similar findings with respect to CTCF binding and gene expression were recently found in embryonic stem cells in relation also to DNA methylation.68
Changes in gene expression were also associated with binding motifs of DBCs, where gene upregulation was associated with motifs for activating cofactors and downregulation for motifs of repressing cofactors. Thus, the genomic location where aberrant CTCF binding occurs and what motifs that are targeted emerge as key factors of how it affects gene expression. When additionally integrating DNA methylation, the relation between CTCF binding and gene expression was even more unambiguous, where loss of methylation was more clearly associated with gain of CTCF binding and increased gene expression. All of these findings demonstrate the complex and multifaceted role of CTCF in gene regulation and leukemia.
Exposure of azacitidine in AML patient cells exerted profound effects on CTCF binding and significantly changed CTCF occupancy at almost 15 000 sites. Again, binding motifs for DBCs were enriched for activators when genes were upregulated and for repressors when genes were downregulated by azacitidine. Genes that changed both CTCF binding and gene expression with azacitidine were enriched for genes regulating cell proliferation and apoptosis, indicating that changes in CTCF are implicated in the antileukemic effects of the drug. All genes that were found to be demethylated, and concomitantly increased CTCF binding and gene expression by azacitidine treatment, are genes known to be implicated in hematological cancers. Of special interest is KLF6, which is epigenetically dysregulated in AML as well as during aging. Downregulation of KLF6 in CD34+ cells is enough to change the phenotype and induce a AML like gene expression pattern.63,64 Also, among CBSs gained with azacitidine, more than half were bound in NBM, suggesting that azacitidine restores a normal CTCF-binding pattern.
In summary, we show for the first time aberrant occupancy of the key transcriptional regulator CTCF in primary AML cells with a general gain of CTCF binding enriched for enhancers. AML with TET2 mutations stands out as a subtype of AML with particularly high CTCF occupancy, which dominantly occurs in promoters. The underlying mechanism for this prominent gain of CTCF occupancy is unclear and needs further investigation. Clearly, the aberrant CTCF binding is associated with changed gene expression patterns, specifically with gene upregulation in sites that gain CTCF binding near promoters in AML. How this relates to detailed changes in chromatin structure, loop formation, and connections between promoters and enhancers needs to be further studied using methods deciphering DNA interactions, such as Hi-C. In conclusion, our results suggest that CTCF could be involved in the leukemogenesis in AML. However, the role of CTCF for initiating and/or driving leukemia needs further elucidation.
The ChIP-seq and methylation array data reported in this article have been deposited in the National Bioinformatics Infrastructure Sweden repository (doi.org/10.17044/NBIS/G000014).
The online version of this article contains a data supplement.
The publication costs of this article were defrayed in part by page charge payment. Therefore, and solely to indicate this fact, this article is hereby marked “advertisement” in accordance with 18 USC section 1734.
Acknowledgments
Funding for this study was provided by Cancerfonden (Swedish Cancer Society), Vetenskapsrådet, and Stockholms Läns Landsting (Stockholm County Council).
Authorship
Contribution: H.M., A.L., and S.L. designed the research; H.M., S.M., A.N., S.B., C.N., S.D., L.C., K.E., A.L., and S.L. performed the research; S.B., C.B., S.D., L.C., and S.L. contributed vital material and collected data; H.M., S.M., A.N., A.L., and S.L. analyzed and interpreted data; and H.M., A.L., and S.L. wrote the paper
Conflict-of-interest disclosure: The authors declare no competing financial interests.
Correspondence: Sören Lehmann, Department of Medical Sciences, Uppsala University, Uppsala University Hospital, Entrance 101, 1st Floor, 751 85 Uppsala, Sweden; e-mail: soren.lehmann@ki.se.
