

Key Points
Expression of VAV1 mutants on a p53-null background accelerated development of various types of TCNs.
Myc pathway activation is marked in TCNs with VAV1 mutants, accompanying focal somatic copy-number alterations of the Myc locus.

Abstract
Activating mutations in the Vav guanine nucleotide exchange factor 1 (VAV1) gene are reported in various subtypes of mature T-cell neoplasms (TCNs). However, oncogenic activities associated with VAV1 mutations in TCNs remain unclear. To define them, we established transgenic mice expressing VAV1 mutants cloned from human TCNs. Although we observed no tumors in these mice for up to a year, tumors did develop in comparably aged mice on a p53-null background (p53−/−VAV1-Tg), and p53−/−VAV1-Tg mice died with shorter latencies than did p53-null (p53−/−) mice. Notably, various TCNs with tendency of maturation developed in p53−/−VAV1-Tg mice, whereas p53−/− mice exhibited only immature TCNs. Mature TCNs in p53−/−VAV1-Tg mice mimicked a subtype of human peripheral T-cell lymphoma (PTCL-GATA3) and exhibited features of type 2 T helper (Th2) cells. Phenotypes seen following transplantation of either p53−/−VAV1 or p53−/− tumor cells into nude mice were comparable, indicating cell-autonomous tumor-initiating capacity. Whole-transcriptome analysis showed enrichment of multiple Myc-related pathways in TCNs from p53−/−VAV1-Tg mice relative to p53−/− or wild-type T cells. Remarkably, amplification of the Myc locus was found recurrently in TCNs of p53−/−VAV1-Tg mice. Finally, treatment of nude mice transplanted with p53−/−VAV1-Tg tumor cells with JQ1, a bromodomain inhibitor that targets the Myc pathway, prolonged survival of mice. We conclude that VAV1 mutations function in malignant transformation of T cells in vivo and that VAV1-mutant–expressing mice could provide an efficient tool for screening new therapeutic targets in TCNs harboring these mutations.
Introduction
T-cell neoplasms (TCNs) are classified as mature TCNs (so-called peripheral T-cell lymphomas [PTCLs]) and immature TCNs (T-lymphoblastic lymphoma [T-LBL]) based on T-cell immunophenotypes. PTCLs are further subclassified as up to 30 categories based on pathological and clinical features.1 Best standard-care protocols for TCNs have not been established due to lack of knowledge of molecular mechanisms. Recent genomic research has revealed the genetic landscape of PTCL and shown that PTCL driver mutations are highly enriched in factors functioning in survival and activation of normal T cells. Vav guanine nucleotide exchange factor (GEF) 1 (VAV1) is one of those genes genetically altered in various PTCL subtypes and encodes a factor that likely mediates physiological T-cell receptor (TCR) signaling. Frequencies of VAV1 alterations are 18% in adult T-cell lymphoma/leukemia (ATL),2 11% in anaplastic large-cell lymphoma (ALCL), and 7% to 11% in PTCL not otherwise specified (PTCL-NOS).3-5 In angioimmunoblastic T-cell lymphoma (AITL) and nodal PTCL with T-follicular helper (Tfh) phenotype (PTCL-Tfh), VAV1 mutation frequencies are as low as 5%.6,7 However, the RHOAp.Gly17Val mutant, found in up to 70% of AITL, activates VAV1 by disrupting its autoinhibition, suggesting that VAV1 activation is more profoundly related to AITL pathogenesis than estimated from its mutation frequency.7 On the other hand, VAV1 function in T-LBL is controversial, and VAV1 mutations are rarely found in human T-LBL samples.8 Moreover, there is some evidence that VAV1 functions as a tumor suppressor in a mouse model of T-LBL.9
VAV1 is a member of VAV family proteins, consisting of VAV1, VAV2, and VAV3. VAV1 functions as a GEF, facilitating exchange of guanosine diphosphate (GDP) for guanosine triphosphate (GTP).10 TCR stimulation triggers VAV1 phosphorylation through Src family kinases such as LCK and FYN11-13 at amino acid residues Tyr142, 160, and 174 in the acidic (Ac) domain, activating its GEF-dependent function to activate small GTPases such as Rac1 and its GEF-independent function as an adaptor enabling formation of a complex with Src homology 2 (SH2) domain-containing leukocyte protein of 76 kDa (SLP76) and phospholipase C, γ 1 (PLCG1).14-16 Vav1-deficient mice show partially impaired thymic T-cell development.17 VAV1 deficiency in T cells also impairs the immune response after TCR stimulation.18,19
Mutations in VAV1 in PTCL occur in distinct patterns. Missense mutations accumulate at several hotspots in the Ac (Glu175), pleckstrin homology (PH; Lys404), zinc-finger (ZF; Glu556) and SH3 (Arg798 and Arg822) domains. Other mutations include focal in-frame deletions in the Ac domain (Δ165-174) or those in Δ778-786 in the C-terminal SH3 domain by alternative splicing, and fusion of VAV1 lacking the C-terminal SH3 domain with various partner genes (Figure 1A).2-7 Alterations in either the Ac or SH3-SH2-SH3 domains impairs their interaction with the Dbl homology (DH) domain, disrupting autoinhibition.20,21 Both alterations lead to hyperactivation of TCR signaling in vitro,7 though how substitutions in the PH or ZF domains perturb downstream signaling remains unclear.
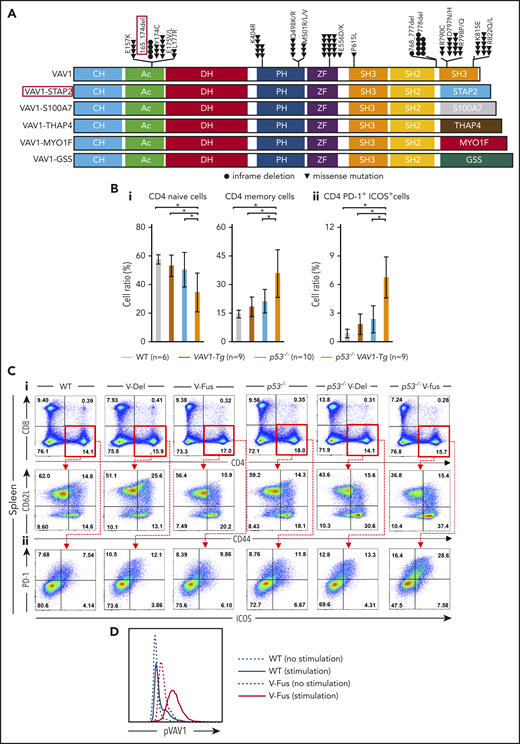
Function of VAV1 mutations in physiological differentiation of splenic T cells. (A) Schematic showing structures of VAV1-mutant proteins resulting from nonsynonymous mutations, in-frame deletions, and fusion with various partners identified in PTCL-NOS,3-5 AITL,7 ALCL,3 and ATL.2 (B) Cell fractions of splenocytes harvested from mice indicated genotypes at 12 weeks of age before tumor development. (i) Percentages of naive T cells defined by CD4+CD62L+CD44− and those of memory T cells defined by CD4+CD62L−CD44+. (ii) Percentage of CD4+PD-1+ICOS+ cells. The number of mice analyzed is as follows: WT, n = 6; VAV1-Tg, n = 9; p53−/−, n = 10; p53−/−VAV1-Tg, n = 9. *P < .05. (C) Representative flow cytometric data indicating CD4 naive and memory T cells (i) and CD4+PD-1+ICOS+ cells (ii) in indicated genotypes at 12 weeks of age. (D) Phosphorylated VAV1 (pVav1) protein expression examined by flow cytometry in naive T cells sorted from splenocytes of V-Fus or WT mice with or without TCR stimulation. Black line indicates WT; red line, V-Fus expression data. Dotted line indicates nonstimulated status; solid line, stimulated status.
Function of VAV1 mutations in physiological differentiation of splenic T cells. (A) Schematic showing structures of VAV1-mutant proteins resulting from nonsynonymous mutations, in-frame deletions, and fusion with various partners identified in PTCL-NOS,3-5 AITL,7 ALCL,3 and ATL.2 (B) Cell fractions of splenocytes harvested from mice indicated genotypes at 12 weeks of age before tumor development. (i) Percentages of naive T cells defined by CD4+CD62L+CD44− and those of memory T cells defined by CD4+CD62L−CD44+. (ii) Percentage of CD4+PD-1+ICOS+ cells. The number of mice analyzed is as follows: WT, n = 6; VAV1-Tg, n = 9; p53−/−, n = 10; p53−/−VAV1-Tg, n = 9. *P < .05. (C) Representative flow cytometric data indicating CD4 naive and memory T cells (i) and CD4+PD-1+ICOS+ cells (ii) in indicated genotypes at 12 weeks of age. (D) Phosphorylated VAV1 (pVav1) protein expression examined by flow cytometry in naive T cells sorted from splenocytes of V-Fus or WT mice with or without TCR stimulation. Black line indicates WT; red line, V-Fus expression data. Dotted line indicates nonstimulated status; solid line, stimulated status.
Here, we established transgenic mice expressing VAV1 mutants driven by the CD2 promoter to define their function in tumorigenesis in vivo.
Methods
Mice
Complementary DNAs (cDNAs) for a human VAV1 mutant (p.165_174del) (V-Del) and a VAV1-STAP2 fusion gene mutant (V-Fus), identified in our PTCL cohort,7 were cloned into a VA vector under control of the human CD2 promoter. Vectors were injected into fertilized eggs to generate V-Del and V-Fus transgenic mice on a C57BL/6 background. V-Del and V-Fus transgenic (VAV1-Tg) mice were crossed with Trp53 knockout (p53−/−) mice to generate p53−/− V-Del or p53−/− V-Fus mice. Age-matched male nude mice served as recipients. All experiments were performed according to guidelines of the Laboratory Animal Resource Center in University of Tsukuba and approved by the Institutional Review Board (19-182).
Whole-transcriptome analysis
Libraries for whole-transcriptome analysis (WTA) were made using a TruSeq RNA Sample Preparation Kit (Illumina) or SMARTer Stranded Total RNA-Seq Kit v2- Pico Input Mammalian22 according to quantity of total RNA following the manufacturer’s protocol. Sequencing was performed at Tsukuba i-Laboratory LLP (Ibaraki, Japan) using NextSeq 500 (Illumina) with a paired-end 36-base read option or at Macrogen Japan (Kyoto, Japan) using HiSeqX (Illumina) with a paired-end 150-base read option.
Whole-exome sequencing
Libraries for whole-exome sequencing (WES) were made using SureSelect XT Mouse All Exon Kits (Agilent Technologies) according to the manufacturer’s instructions. Sequencing data were generated by standard 150-bp paired-end protocol. Sequence alignment and mutation calling were analyzed using the Genomon2 pipeline (https://github.com/Genomon-Project).
Statistics
All statistical analyses were performed with EZR software (Saitama Medical Center, Jichi Medical University, Saitama, Japan).23 Analysis of variance (ANOVA) was used with post hoc comparisons using Bonferroni method to determine differences between multiple groups. For comparison between 2 groups, the Student t test was performed. Survival was analyzed by the Kaplan-Meier method and differences between the curves were calculated by a 2-sided log-rank test. The Fisher exact test was used to compare frequencies of tumor subtypes.
Other experimental methods
The detailed protocols for generation of mice, tumor cell transplantation, quantitative polymerase chain reaction (PCR), immunohistochemical staining, flow cytometry, TCR stimulation, WTA, WES, and in vivo treatment are described in supplemental Methods (available on the Blood Web site).
Results
Expression of VAV1 mutants in p53-null mice (p53−/−VAV1) promotes TCN development
To establish VAV1-mutant transgenic mice, we cloned 2 VAV1 cDNAs, V-Del and V-Fus, derived from human PTCL samples (Figure 1A)7 into VA vectors in which transgenes were driven by the CD2 promoter (supplemental Figure 1A). Resultant vectors were injected into fertilized eggs to generate V-Del and V-Fus transgenic mice (supplemental Figure 1B). TP53 alterations reportedly co-occur in some PTCL cases with VAV1 alterations (supplemental Figure 1C).24 Thus, we crossed V-Del or V-Fus mice with conventional p53−/− mice to generate p53−/− V-Del or p53−/− V-Fus mice. VAV1 cDNA insertion and Trp53 gene loss were confirmed by genomic PCR (supplemental Figure 1D).
We then evaluated blood counts and fractions of B, myeloid, and T cells in peripheral blood (PB) collected from mice of VAV1-Tg, p53−/−, or p53−/−VAV1-Tg genotypes and from wild-type (WT) controls at 8 weeks of age. The number of CD3+ T cells significantly increased in blood of VAV1-Tg and p53−/−VAV1-Tg relative to WT mice (supplemental Figure 2A).
At 12 weeks of age, we obtained single-cell suspensions of splenocytes and thymocytes from mice of each genotype for flow cytometry analysis. The frequencies of naive T cells, defined as CD4+CD62L+CD44−, significantly decreased, whereas the frequencies of memory T cells, defined as CD4+CD62L−CD44+, significantly increased in splenocytes from p53−/−VAV1-Tg relative to WT mice (Figure 1Bi,Ci). Notably, the number of CD4+ cells expressing programmed cell death 1 (PD-1) and inducible T-cell costimulator (ICOS) significantly increased in splenocytes from p53−/−VAV1-Tg compared with WT mice (Figure 1Bii,Cii). In the thymus, the number of double negative 3 (DN3) cells, defined by CD44−CD25+, significantly increased in thymocytes from p53−/−VAV1-Tg relative to WT or p53−/− mice (supplemental Figure 2B-C). These data suggest overall that expression of VAV1 mutants on a p53-null background results in partially impaired thymocyte development at the DN3 stage and skewed expansion of splenic CD4+ T cells.
We also examined phospho-VAV1 protein in naive T cells collected from either V-Fus or WT mice with or without TCR stimulation. Phospho-VAV1 expression levels were higher in cells from V-Fus mice than in those from WT mice with or without stimulation (Figure 1D).
Remarkably, p53−/−VAV1-Tg mice succumbed to tumors at shorter latencies than did p53−/− mice (Figure 2A). In contrast, VAV1-Tg mice on a WT background remained alive during the entire observation period, as did WT mice (>50 weeks; Figure 2A). To further enhance tumorigenicity, we irradiated either VAV1-Tg mice on a p53+/− background (p53+/−VAV1-Tg mice) or p53+/− mice at 4 Gy at ∼8 weeks of age (supplemental Figure 3A). Irradiated p53+/−VAV1-Tg mice also showed shorter survival than irradiated p53+/− mice (supplemental Figure 3B).
![Tumor development in p53-null mice expressing VAV1 mutants. (A) OS of mice of indicated genotypes. (B) Macroscopic analysis of representative thymuses (i) at 12 weeks of age and spleens (ii) at 24 weeks of age from mice of indicated genotypes. (C) Representative data of chest (top) and abdominal (bottom) computed tomography scans, performed on p53−/− V-Fus mice at 16 weeks (top) and 24 weeks (bottom) of age. WT mice served as controls. Arrows indicate a thymic tumor (Thy), swollen lymph node (Ly) and enlarged spleen (Sp), respectively. (D) Subtypes of tumors found in mice of indicated genotypes (p53−/− V-Del, n = 21; p53−/− V-Fus, n = 23; p53−/−, n = 16). Immature T-cell neoplasms (T-lymphoblastic lymphomas [T-LBL]) are shown in blue; mature T-cell neoplasms (lymphoma [Lym]) in orange; and nonhematological malignancies in gray. (E) Cell-surface immunophenotypes of CD4 and CD8 cells from T-LBL or Lym from mice of indicated genotypes. (F) Representative flow cytometric data of CD4 and CD8, and CD24 and mTCRβ as indicators of cell-maturation status, and PD-1 and ICOS, indicating cell-activation status for thymocytes from p53−/− V-Fus and p53−/− mice harboring T-LBL plus WT mice (i) and splenocytes from p53−/− V-Del and p53−/− V-Fus mice harboring Lym plus WT mice (ii). (G) Representative flow cytometric data to show naive-like (CD4+CD62L+CD44−) and memory-like (CD4+CD62L−CD44+) phenotypes for splenocytes from p53−/− V-Del and p53−/− V-Fus mice harboring Lym plus WT mice. DN, double negative; DP, double positive; SP, single positive.](https://ash.silverchair-cdn.com/ash/content_public/journal/blood/136/26/10.1182_blood.2020006513/1/m_bloodbld2020006513f2.png?Expires=1765899282&Signature=i-qAsqtGpvJ1l~n~IhM00gJc1X73AjyZU2k6xizmqpH9CdujMbVOi9M21i7xH-2fvtmQmH8AGPInzKHIR~wmi~~tQHsL6LlnUdmgaFaR52DeyieypC2F7Ent7xWBK3IcrlCx1uL3jNWeUgbAUOpRFfA8ifQvoiSAKxhC~8y33YjUVSaHknkehlM2H5HWTY~SkUr9nnE~q1q533am82RztPIDcpSEqKA7VbgNgbUZZRsPJaPBaPQcYAKcNS4WCWx7b91ew8IrrCMzWiPoLFurAKxhOVtZNz8vUlQICZIbWQ04j-Y~waM-Tuj0rFULmkiMG6dWHG5-L5JRRTZ75XNs2w__&Key-Pair-Id=APKAIE5G5CRDK6RD3PGA)
Tumor development in p53-null mice expressing VAV1 mutants. (A) OS of mice of indicated genotypes. (B) Macroscopic analysis of representative thymuses (i) at 12 weeks of age and spleens (ii) at 24 weeks of age from mice of indicated genotypes. (C) Representative data of chest (top) and abdominal (bottom) computed tomography scans, performed on p53−/− V-Fus mice at 16 weeks (top) and 24 weeks (bottom) of age. WT mice served as controls. Arrows indicate a thymic tumor (Thy), swollen lymph node (Ly) and enlarged spleen (Sp), respectively. (D) Subtypes of tumors found in mice of indicated genotypes (p53−/− V-Del, n = 21; p53−/− V-Fus, n = 23; p53−/−, n = 16). Immature T-cell neoplasms (T-lymphoblastic lymphomas [T-LBL]) are shown in blue; mature T-cell neoplasms (lymphoma [Lym]) in orange; and nonhematological malignancies in gray. (E) Cell-surface immunophenotypes of CD4 and CD8 cells from T-LBL or Lym from mice of indicated genotypes. (F) Representative flow cytometric data of CD4 and CD8, and CD24 and mTCRβ as indicators of cell-maturation status, and PD-1 and ICOS, indicating cell-activation status for thymocytes from p53−/− V-Fus and p53−/− mice harboring T-LBL plus WT mice (i) and splenocytes from p53−/− V-Del and p53−/− V-Fus mice harboring Lym plus WT mice (ii). (G) Representative flow cytometric data to show naive-like (CD4+CD62L+CD44−) and memory-like (CD4+CD62L−CD44+) phenotypes for splenocytes from p53−/− V-Del and p53−/− V-Fus mice harboring Lym plus WT mice. DN, double negative; DP, double positive; SP, single positive.
Tumor development in p53-null mice expressing VAV1 mutants. (A) OS of mice of indicated genotypes. (B) Macroscopic analysis of representative thymuses (i) at 12 weeks of age and spleens (ii) at 24 weeks of age from mice of indicated genotypes. (C) Representative data of chest (top) and abdominal (bottom) computed tomography scans, performed on p53−/− V-Fus mice at 16 weeks (top) and 24 weeks (bottom) of age. WT mice served as controls. Arrows indicate a thymic tumor (Thy), swollen lymph node (Ly) and enlarged spleen (Sp), respectively. (D) Subtypes of tumors found in mice of indicated genotypes (p53−/− V-Del, n = 21; p53−/− V-Fus, n = 23; p53−/−, n = 16). Immature T-cell neoplasms (T-lymphoblastic lymphomas [T-LBL]) are shown in blue; mature T-cell neoplasms (lymphoma [Lym]) in orange; and nonhematological malignancies in gray. (E) Cell-surface immunophenotypes of CD4 and CD8 cells from T-LBL or Lym from mice of indicated genotypes. (F) Representative flow cytometric data of CD4 and CD8, and CD24 and mTCRβ as indicators of cell-maturation status, and PD-1 and ICOS, indicating cell-activation status for thymocytes from p53−/− V-Fus and p53−/− mice harboring T-LBL plus WT mice (i) and splenocytes from p53−/− V-Del and p53−/− V-Fus mice harboring Lym plus WT mice (ii). (G) Representative flow cytometric data to show naive-like (CD4+CD62L+CD44−) and memory-like (CD4+CD62L−CD44+) phenotypes for splenocytes from p53−/− V-Del and p53−/− V-Fus mice harboring Lym plus WT mice. DN, double negative; DP, double positive; SP, single positive.
Supplemental Table 1 summarizes distribution and immunophenotype of each tumor. Macroscopic observations and computed tomography scans revealed that tumor-bearing p53−/−VAV1-Tg mice displayed marked thymic enlargement or splenomegaly, sometimes accompanied by lymphadenopathy and extranodal tumors, whereas most tumor-bearing p53−/− mice showed only thymic enlargement (Figure 2B-C; supplemental Figure 3C; supplemental Table 1; and data not shown). We defined tumors as immature TCNs corresponding to human T-lymphoblastic lymphoma (T-LBL) and TCNs (lymphoma [Lym]) as mature (see “Flow cytometry” in supplemental Methods for details). Lym and T-LBL developed in p53−/−VAV1-Tg mice, whereas only T-LBL was seen in p53−/− mice (Figure 2D). The tumors also developed in irradiated p53+/−VAV1-Tg mice. p53+/− mice were either T-LBL or nonhematological malignancies as found in a p53-null background, whereas the WT Trp53 allele was deleted in these tumors (supplemental Figure 3D).
The most frequently observed immunophenotypes in T-LBL were CD8+ single-positive (SP) in p53−/−VAV1-Tg mice and CD4+CD8+ double-positive (DP) in p53−/− mice. In addition, we observed TCNs with mature phenotypes in p53−/−VAV1-Tg mice in contrast to p53−/− mice, which developed only immature TCNs (P < .05) (Figure 2E). We also examined cell-surface expression of CD24 and membrane TCR (mTCR) β-chain (mTCRβ), both of which reflect differentiation status,9 by flow cytometry. T-LBL of p53−/−VAV1-Tg mice exhibited CD24+mTCRβhigh+. In contrast, T-LBL from p53−/− mice displayed CD24+mTCRβlow+ (Figure 2Fi). These data suggest that T-LBL samples from p53−/−VAV1-Tg mice are more mature than those from p53−/− mice.
Lym in p53−/−VAV1-Tg mice were mainly CD4−CD8− double negative (DN), although some were CD4+ SP (Figure 2E). All Lym tumor cells exhibited a CD24−mTCRβ+ mature T-cell phenotype and also expressed PD-1 and ICOS (Figure 2Fii) together with a CD44+CD62L− memory-like phenotype (Figure 2G).
Hematoxylin-eosin (HE)-stained sections showed that T-LBL thymus tissues were massively infiltrated by immature lymphocytes, and corticomedullary boundaries were disrupted (Figure 3Ai). Spleen from Lym samples exhibited enlarged follicles that were massively infiltrated by mature lymphocytes (Figure 3Aii). Lung and/or liver tissues were also infiltrated by tumor cells in some T-LBL and Lym samples (supplemental Figure 3E).
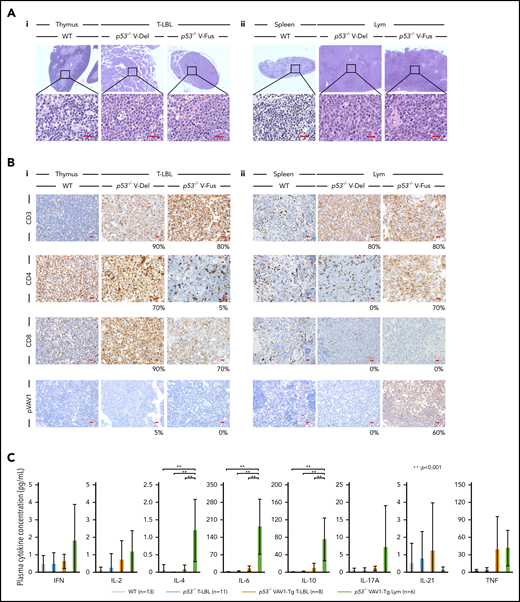
Characterization of tumors found in VAV1-mutant p53-null mice. (A) Sections stained by hematoxylin-eosin (HE) for tumors collected from mice of indicated genotypes. (i) Thymuses from indicated mutant mice harboring T-LBL plus control WT mice. (ii) Spleens from indicated mutant mice harboring Lym plus WT mice. Original magnification: ×4; insets, ×100. Scale bars, 20 µm. (B) Immunohistochemical analysis of CD3, CD4, CD8a, and phosphorylated-VAV1 (pVAV1). (i) Thymuses from indicated mutant mice harboring T-LBL or WT mice. (ii) Spleens from indicated mutant mice harboring Lym or WT mice. Original magnification ×40. Scale bars, 20 µm. The percentages at the bottom right corner of figures for both T-LBL and Lym samples indicate the positivity in the tumor cells. (C) Serum cytokines found in blood of tumor-bearing mice of indicated genotypes measured at 16 to 24 weeks as control WT mice. The number of mice analyzed is as follows: WT, n = 13; p53−/− mice bearing T-LBL, n = 11; p53−/−VAV1-Tg mice bearing T-LBL, n = 8; p53−/−VAV1-Tg mice bearing Lym, n = 6. **P < .001.
Characterization of tumors found in VAV1-mutant p53-null mice. (A) Sections stained by hematoxylin-eosin (HE) for tumors collected from mice of indicated genotypes. (i) Thymuses from indicated mutant mice harboring T-LBL plus control WT mice. (ii) Spleens from indicated mutant mice harboring Lym plus WT mice. Original magnification: ×4; insets, ×100. Scale bars, 20 µm. (B) Immunohistochemical analysis of CD3, CD4, CD8a, and phosphorylated-VAV1 (pVAV1). (i) Thymuses from indicated mutant mice harboring T-LBL or WT mice. (ii) Spleens from indicated mutant mice harboring Lym or WT mice. Original magnification ×40. Scale bars, 20 µm. The percentages at the bottom right corner of figures for both T-LBL and Lym samples indicate the positivity in the tumor cells. (C) Serum cytokines found in blood of tumor-bearing mice of indicated genotypes measured at 16 to 24 weeks as control WT mice. The number of mice analyzed is as follows: WT, n = 13; p53−/− mice bearing T-LBL, n = 11; p53−/−VAV1-Tg mice bearing T-LBL, n = 8; p53−/−VAV1-Tg mice bearing Lym, n = 6. **P < .001.
Analysis of CD3, CD4, and CD8 immunohistochemical staining in thymus and spleen from tumor-bearing p53−/−VAV1-Tg, p53−/−, and control WT mice confirmed T-LBL and Lym immunophenotypes determined by flow cytometry (Figure 3B). To evaluate the activation status of exogenous V-Fus mutant or endogenous VAV1 proteins in WT mice, we assessed phospho-VAV1 at Tyr174 by immunohistochemical staining (note that V-Del mutant protein lacks Tyr174 and cannot be similarly evaluated). We detected phospho-VAV1 only in spleen tissues from Lym samples from p53−/− V-Fus mice (Figure 3Bi-ii).
We then evaluated serum cytokine concentrations in tumor-bearing p53−/−VAV1-Tg, p53−/−, and control WT mice at 16 weeks of age. Interleukin-4 (IL-4), IL-6, and IL-10 levels significantly increased in p53−/−VAV1-Tg mice harboring Lym relative to WT or p53−/− mice with T-LBL or p53−/−VAV1-Tg mice with T-LBL (Figure 3C). These data suggest overall that p53−/−VAV1-Tg mice harboring Lym exhibit skewed commitment toward a type 2 T helper (Th2) phenotype.
In summary, we observed TCNs with mature phenotypes in p53−/−VAV1-Tg mice in contrast to p53-null mice, which developed only immature TCNs.
p53−/− VAV1-mutant and p53−/− tumor cells show cell-autonomous transforming activity
To assess cell-autonomous activity of tumor cells seen in p53−/−VAV1-Tg and p53−/− mice, we prepared single-cell suspensions from thymic tumors of p53−/−VAV1-Tg and p53−/− mice harboring T-LBL and from enlarged spleens of p53−/−VAV1-Tg mice harboring Lym (Figure 4A). These donor cells were injected intraperitoneally into immunodeficient BALB-c/ν mice (nude mice) after 2 Gy irradiation. The recipient mice transplanted with T-LBL from p53−/−VAV1-Tg mice gradually succumbed to tumors at shorter latencies than those with p53−/− T-LBL (Figure 4B). In addition, Lym samples from p53−/−VAV1-Tg mice were also transplantable into nude mice, though latencies for tumor development were longer than those with T-LBL, whereas secondarily transplanted mice succumbed to tumors with shorter latencies (Figure 4C). Macroscopically, the recipient mice transplanted with either T-LBL or Lym displayed marked splenomegaly, lymphadenopathy, liver enlargement, and ascites (data not shown). HE-stained sections of spleen from the engrafted recipient mice showed that follicles were enlarged and massively infiltrated by tumor cells (Figure 4D). Significant proportions of cells in spleens and lymph nodes of the recipient mice transplanted with either T-LBL or Lym were donor-derived, as indicated by H-2Kb positivity (Figure 4E). Flow cytometry and immunohistochemical staining showed that tumor cell immunophenotypes in recipients mimicked those of donor cells (Figure 4F and data not shown). Genomic PCR performed in tumor tissues from the recipient mice confirmed that donor cells exhibited integration of human VAV1 and partial deletion of Trp53 gene, as recipient cells harboring WT Trp53 were found in tumor issues (supplemental Figure 4).
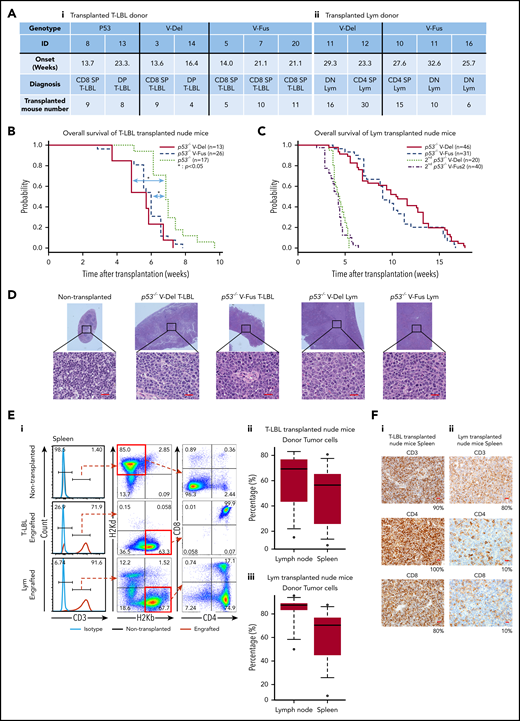
Tumor-initiating capacity of tumor cells found in p53−/−VAV1-Tg and p53−/− mice. (A) Summary of donor mice, showing genotypes and various experimental parameters. The summary of transplanted T-LBL donor mice (i) and Lym donor mice (ii). (B) OS of nude mice transplanted intraperitoneally with T-LBL of indicated genotypes (p53−/− V-Del, n = 13; p53−/− V-Fus, n = 26; and p53−/−, n = 17). (C) OS of nude mice that were initially and then secondarily transplanted with Lym from p53−/−VAV1-Tg mice (p53−/− V-Del, n = 46; p53−/− V-Fus, n = 31; 2nd p53−/− V-Del, n = 20; 2nd p53−/− V-Fus, n = 40). (D) HE-stained sections from nude mice transplanted with T-LBL or Lym of indicated genotypes. Original magnification: ×4; insets, ×100. Scale bars, 20 µm. (E) Characterization of donor-derived cells in spleens and lymph nodes. (i) Representative flow cytometric analysis for CD3, CD4, and CD8 to determine immunophenotypes of tumor cells, and H2Kd and H2Kb, MHC class I molecules to determine recipient-derived (ν/ν) and donor-derived (C57BL/6) cells, respectively. (ii) Percentages of donor cells in lymph nodes and spleens of nude mice transplanted with T-LBL. (iii) Percentages of donor cells in lymph nodes and spleens of nude mice transplanted with Lym. (F) Immunohistochemical analysis for CD3, CD4, and CD8 in spleens of nude mice transplanted with T-LBL (i) and Lym (ii) from p53−/−VAV1-Tg mice. Original magnification ×40. Scale bars, 20 µm. The percentage at the bottom right corner is positivity in the tumor cells.
Tumor-initiating capacity of tumor cells found in p53−/−VAV1-Tg and p53−/− mice. (A) Summary of donor mice, showing genotypes and various experimental parameters. The summary of transplanted T-LBL donor mice (i) and Lym donor mice (ii). (B) OS of nude mice transplanted intraperitoneally with T-LBL of indicated genotypes (p53−/− V-Del, n = 13; p53−/− V-Fus, n = 26; and p53−/−, n = 17). (C) OS of nude mice that were initially and then secondarily transplanted with Lym from p53−/−VAV1-Tg mice (p53−/− V-Del, n = 46; p53−/− V-Fus, n = 31; 2nd p53−/− V-Del, n = 20; 2nd p53−/− V-Fus, n = 40). (D) HE-stained sections from nude mice transplanted with T-LBL or Lym of indicated genotypes. Original magnification: ×4; insets, ×100. Scale bars, 20 µm. (E) Characterization of donor-derived cells in spleens and lymph nodes. (i) Representative flow cytometric analysis for CD3, CD4, and CD8 to determine immunophenotypes of tumor cells, and H2Kd and H2Kb, MHC class I molecules to determine recipient-derived (ν/ν) and donor-derived (C57BL/6) cells, respectively. (ii) Percentages of donor cells in lymph nodes and spleens of nude mice transplanted with T-LBL. (iii) Percentages of donor cells in lymph nodes and spleens of nude mice transplanted with Lym. (F) Immunohistochemical analysis for CD3, CD4, and CD8 in spleens of nude mice transplanted with T-LBL (i) and Lym (ii) from p53−/−VAV1-Tg mice. Original magnification ×40. Scale bars, 20 µm. The percentage at the bottom right corner is positivity in the tumor cells.
We conclude that tumor cells from both T-LBL and Lym samples have tumor-initiating activity.
Gene-expression profiles of tumors harboring VAV1 mutants
To define molecular mechanisms underlying tumorigenesis, we next performed WTA using RNA extracted from whole thymocytes from the following groups: (1) T-LBL from p53−/−VAV1-Tg mice (>90% were tumor cells [n = 4: p53−/− V-Del, n = 2; p53−/− V-Fus, n = 2]), (2) T-LBL from p53−/− mice (>90% were tumor cells, n = 2), (3) CD4/CD8-DP thymocytes from WT mice (n = 3), (4) a tumor cell fraction (CD4/CD8 DN or CD4 SP) of splenocytes from Lym from p53−/−VAV1-Tg mice (n = 5: p53−/− V-Del, n = 3; p53−/− V-Fus mice, n = 2), and (5) CD4-SP or CD8-SP splenocytes of WT mice (n = 6: CD4 SP, n = 3; CD8 SP, n = 3).
Principal component analysis and unsupervised clustering revealed a distinct gene-expression pattern in each group of tumor cells (Figure 5A; supplemental Figure 5A). We then determined genes highly expressed in tumors with VAV1 mutations by comparing a list of genes more highly expressed in T-LBL from p53−/−VAV1-Tg compared with p53−/− mice as well as those more highly expressed in Lym from p53−/−VAV1-Tg compared with splenocytes of WT mice. We identified 176 genes showing a twofold change and 36 genes showing a threefold change common to both lists (Figure 5B; supplemental Figure 5B; supplemental Table 2). Remarkably, Myc was one of the genes most highly expressed in VAV1-mutant tumors (Figure 5C). We also examined the Myc expression levels by quantitative PCR analysis for T-LBL of p53−/−VAV1-Tg mice (n = 8) and that of p53−/− mice (n = 6). We confirmed that Myc expression levels were significantly higher in T-LBL of p53−/−VAV1-Tg T-LBL than that of p53−/− T-LBL (supplemental Figure 5C). Metascape analysis25 for genes highly expressed in VAV1-mutant tumors indicated enrichment of cell-cycle–related pathways (supplemental Figure 5D; supplemental Table 3).
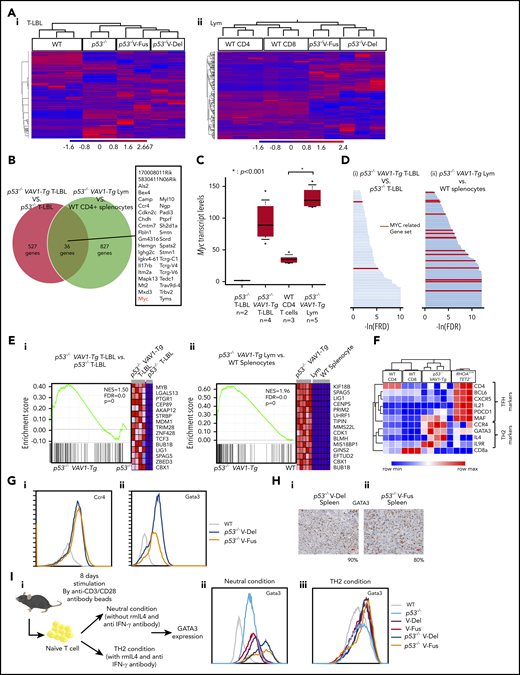
WTAs for tumors found in p53−/−VAV1-Tg or p53−/− mice. (A) Unsupervised hierarchical clustering analyses for T-LBL from mice of indicated genotypes and whole thymocytes from WT mice (i), and tumor cells sorted from Lym from mice of indicated genotypes and CD4+ or CD8+ splenocytes from WT mice (ii). (B) Venn diagram of genes expressed at threefold higher levels in T-LBL from p53−/−VAV1-Tg mice relative to p53−/− mice, or levels seen in Lym from p53−/−VAV1-Tg mice relative to CD4+ splenocytes. Thirty-six genes highly expressed in both of T-LBL and Lym of p53−/−VAV1-Tg mice compared with controls are listed. (C) Myc expression levels in T-LBL from p53−/− mice of (n = 2), and p53−/−VAV1-Tg mice (n = 4), and in CD4+ splenocytes from WT mice (n = 3), and Lym from p53−/−VAV1-Tg mice (n = 5). (D) Significantly enriched gene sets identified by GSEA using curated gene sets in the Molecular Signatures Database.26,27 T-LBL from p53−/−VAV1-Tg mice vs T-LBL from p53−/− mice (i), and tumor cells sorted from Lym from p53−/−VAV1-Tg mice vs CD4+ and CD8+ splenocytes from WT mice (ii). Red lines indicate MYC-related gene sets. (E) Representative results of enrichment plots of Myc-related gene sets. T-LBL from p53−/−VAV1-Tg mice vs T-LBL from p53−/− mice (i), and tumor cells sorted from Lym from p53−/−VAV1-Tg mice vs CD4+ or CD8+ splenocytes from WT mice (ii). (F) GEPs of WT CD4+ or CD8+ splenocytes, tumor cells sorted from Lym from p53−/−VAV1-Tg mice, and cells from AITL-like tumors in RHOAG17VTet2−/− mice.28 (G) Cell-surface expression of Ccr4 and Gata3 analyzed by flow cytometry. (H) Immunohistochemical analysis for Gata3 in spleens of Lym from p53−/−VAV1-Tg mice. Original magnification ×40. Scale bars, 20 µm. The percentages at the bottom right corner indicate positivity in the tumor cells. (I) Schema showing a protocol for skewed differentiation of naive T cells sorted from splenocytes with each genotype. Cells were cultured in neutral condition without any cytokines or antibodies and Th2 condition with recombinant mouse IL-4 and anti–IFN-γ antibody, respectively. Gata3 expression levels were examined by flow cytometry 8 days after TCR stimulation.
WTAs for tumors found in p53−/−VAV1-Tg or p53−/− mice. (A) Unsupervised hierarchical clustering analyses for T-LBL from mice of indicated genotypes and whole thymocytes from WT mice (i), and tumor cells sorted from Lym from mice of indicated genotypes and CD4+ or CD8+ splenocytes from WT mice (ii). (B) Venn diagram of genes expressed at threefold higher levels in T-LBL from p53−/−VAV1-Tg mice relative to p53−/− mice, or levels seen in Lym from p53−/−VAV1-Tg mice relative to CD4+ splenocytes. Thirty-six genes highly expressed in both of T-LBL and Lym of p53−/−VAV1-Tg mice compared with controls are listed. (C) Myc expression levels in T-LBL from p53−/− mice of (n = 2), and p53−/−VAV1-Tg mice (n = 4), and in CD4+ splenocytes from WT mice (n = 3), and Lym from p53−/−VAV1-Tg mice (n = 5). (D) Significantly enriched gene sets identified by GSEA using curated gene sets in the Molecular Signatures Database.26,27 T-LBL from p53−/−VAV1-Tg mice vs T-LBL from p53−/− mice (i), and tumor cells sorted from Lym from p53−/−VAV1-Tg mice vs CD4+ and CD8+ splenocytes from WT mice (ii). Red lines indicate MYC-related gene sets. (E) Representative results of enrichment plots of Myc-related gene sets. T-LBL from p53−/−VAV1-Tg mice vs T-LBL from p53−/− mice (i), and tumor cells sorted from Lym from p53−/−VAV1-Tg mice vs CD4+ or CD8+ splenocytes from WT mice (ii). (F) GEPs of WT CD4+ or CD8+ splenocytes, tumor cells sorted from Lym from p53−/−VAV1-Tg mice, and cells from AITL-like tumors in RHOAG17VTet2−/− mice.28 (G) Cell-surface expression of Ccr4 and Gata3 analyzed by flow cytometry. (H) Immunohistochemical analysis for Gata3 in spleens of Lym from p53−/−VAV1-Tg mice. Original magnification ×40. Scale bars, 20 µm. The percentages at the bottom right corner indicate positivity in the tumor cells. (I) Schema showing a protocol for skewed differentiation of naive T cells sorted from splenocytes with each genotype. Cells were cultured in neutral condition without any cytokines or antibodies and Th2 condition with recombinant mouse IL-4 and anti–IFN-γ antibody, respectively. Gata3 expression levels were examined by flow cytometry 8 days after TCR stimulation.
We then performed gene-set enrichment analysis (GSEA)26,27 for WTA data. Analysis of the Hallmark gene matrix analysis in the Molecular Signature Database (MSigDB) indicated significant enrichment of multiple oncogenic pathways, including the G2M checkpoint, E2F targets, and phosphatidylinositol 3-kinase–AKT–mammalian target of rapamycin signaling in T-LBL from p53−/−VAV1-Tg relative to p53−/− mice (supplemental Figure 5E; supplemental Table 4). Notably, most gene sets significantly enriched in T-LBL from p53−/−VAV1-Tg mice were also significantly enriched in Lym tumors from p53−/−VAV1-Tg mice (supplemental Figure 5E; supplemental Table 4). Analysis of curated gene sets in the MSigDB indicated enrichment of multiple MYC-related gene sets in both T-LBL and Lym from p53−/−VAV1-Tg mice (Figure 5D-E; supplemental Table 5).
We further evaluated Lym features seen in p53−/−VAV1-Tg mice to determine what type of human TCNs these tumors reflected. Although Lym tumor cells expressed PD-1 and ICOS, both used for classification of Tfh phenotypes in the World Health Organization (WHO) classification for human TCNs,1 gene-expression profiles (GEPs) of Lym samples did not show enrichment of a Tfh signature; in contrast, we observed clear enrichment of a Tfh signature in tumors from AITL model mice expressing the G17V RHOA mutation on a Tet2-null background28 (Figure 5F). Remarkably, we observed enrichment of a Th2 signature in Lym samples from p53−/−VAV1-Tg mice relative to WT CD4 splenocytes (supplemental Figure 5F). These data suggest that Lym from p53−/−VAV1-Tg mice mimic a subtype of peripheral T-cell lymphoma (PTCL-GATA3) among human TCNs. Flow cytometry analysis also revealed expression of Ccr4, a marker of PTCL-GATA3, in these Lym tumor cells (Figure 5Gi). Gata3 protein expression was also confirmed by both flow cytometry analysis and immunohistochemical staining in these cells (Figure 5Gii,H).
Notably, GSEA showed that gene sets, including genes more highly expressed in human PTCL-GATA3 specimens with both VAV1 and TP53 alterations than those in PTCL-GATA3 specimens with TP53 alterations but without VAV1, tended to be enriched in tumors from p53−/−VAV1-Tg mice comparing to those from p53−/− mice. Conversely, gene sets including genes more highly expressed in tumors from p53−/−VAV1-Tg mice than from p53−/− mice tended to be enriched in human PTCL-GATA3 specimens with VAV1 and TP53 alterations (supplemental Figure 5G).
GEPs of T cells from non–tumor-bearing mice
Next, we examined the GEPs of T cells from non–tumor-bearing mice with each genotype. WTA was performed using RNA from CD4+ naive T cells (CD4 TN) and memory T cells (CD4 Tmem) sorted from whole spleen of the following non–tumor-bearing mice at 12 weeks of age: (1) p53−/−VAV1-Tg mice, (2) p53−/− mice, and (3) WT mice. We found that Myc expression was significantly higher in CD4 TN from p53−/− V-Fus mice than in CD4 TN from WT mice (supplemental Figure 6Ai) and in CD4 Tmem from p53−/− V-Fus mice than in CD4 Tmem from p53−/− mice (supplemental Figure 6Bi). In addition, Gata3 expression was significantly higher in CD4 Tmem from p53−/− V-Fus mice than in CD4 Tmem from p53−/− mice (supplemental Figure 6Bii). Notably, we identified by GSEA that G2M checkpoint and E2F targets were commonly enriched in CD4 Tmem from p53−/− V-Fus mice compared with CD4 Tmem from WT mice and in Lym from p53−/−−VAV1-Tg mice compared with CD4+ splenocytes from WT mice (supplemental Figure 6D-E; supplemental Table 4). Notably, inflammatory-related pathways were also enriched in both CD4 TN and CD4 Tmem from p53−/− V-Fus mice comparing to those from p53−/− or WT mice, although enrichment of these pathways was not observed in Vav1-mutated tumors (supplemental Figure 6C-E; supplemental Table 4).
Therefore, enrichment of cell-cycle–related pathways such as G2M checkpoint and E2F targets and slightly higher levels of Myc and Gata3 were observed in CD4 T cells of p53−/−VAV1-Tg mice even at non–tumor-bearing status, whereas enrichment of multiple oncogenic pathways, especially those related to Myc, was only observed in tumors of these mice.
To examine the skewed differentiation of naive T cells collected from mice with each genotype, we stimulated naive T cells by anti-CD3/CD28 microbeads without any other cytokines or antibodies (“neutral condition”) or in the presence of IL-4 and anti–IFN-γ antibody, which have been widely used for induction of Th2 cells (“Th2 condition”); Gata3 expression levels were then examined (Figure 5Ii). In the neutral condition, the Gata3 expression levels were the highest in cells from p53−/−VAV1-Tg mice than in those with the other genotypes, whereas the levels were higher in cells from VAV1-Tg mice than those from WT or p53−/− mice (Figure 5Iii). VAV1 mutant did not affect the Gata3 expression levels in the Th2 condition (Figure 5Iiii). These data suggest that mutant VAV1 induces Th2 skewing, which is further augmented by deletion of the Trp53 gene.
Clonal architecture of tumors harboring VAV1 mutants
To assess clonal architecture of T-LBL and Lym tumor cells, we performed WES analysis of paired tumors plus tails (as normal controls) collected from 17 mice (7 p53−/−VAV1-TgLBL, 7 p53−/−VAV1-TgLym, and 3 p53−/−LBL). In total, we detected 132 somatic mutations, including 111 single-nucleotide variants (SNVs), 18 insertions and deletions (indels), and 3 nonsense mutations. The percentage of targeted bases covered by 2×, 10×, 20×, 30×, 40×, 50×, and 100× sequencing average reads is shown in Figure 6A. Average read depth varied from 77.1 to 133.7 (supplemental Figure 7A). WES analysis identified 2 recurrent mutations: Notch1 mutations in tumors from both p53−/−VAV1-Tg mice and p53−/− mice, and Ddx3x mutations in p53−/−VAV1-Tg mice only. p53−/−VAV1-Tg mice also exhibited Jak1 and Tet2 mutations, which are seen in human ATL/PTCL-NOS (Figure 6B; supplemental Table 6).
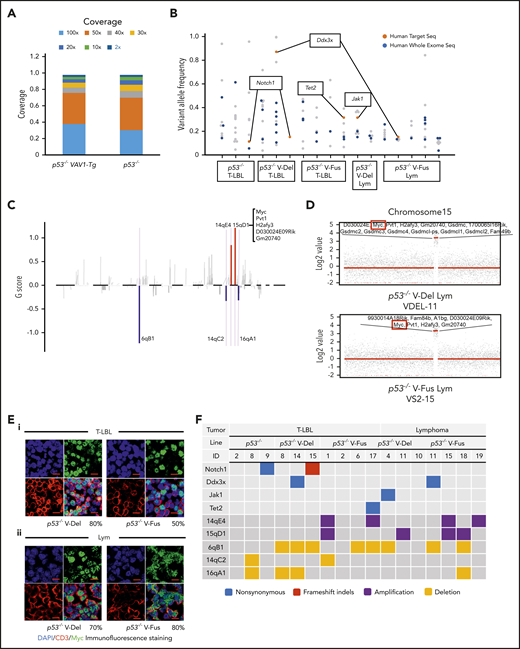
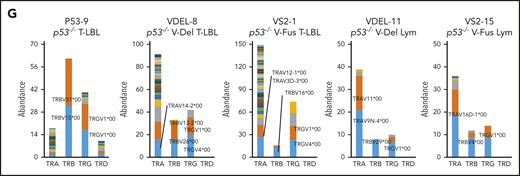
WES analysis of tumor and tail samples. (A) Percentages of targeted bases covered by at least 2×, 10×, 20×, 30×, 40×, 50×, and 100× sequencing reads (top). (B) Variant allele frequencies of somatic mutations in each tumor (T-LBL from p53−/− mice, n = 3; T-LBL from p53−/− V-Del, n = 3; T-LBL from p53−/− V-Fus, n = 4; Lym from p53−/− V-Del, n = 2; and Lym from p53−/− V-Fus, n = 5). Mutations identified in human targeted capture sequencing data2,4 are shown in orange, and those identified in human WES data2 in blue. (C) Focal SCNAs identified through the GISTIC 2.0 algorithm using WES data. Amplified regions are shown in red; deleted regions are shown in blue. Chromosome 15qD1 includes the Myc locus. (D) High-level amplification of the Myc locus identified in Lym from 2 p53−/−VAV1-Tg mice. (E) Immunofluorescent staining for indicated markers in thymus from, p53−/− V-Del, and p53−/− V-Fus mice harboring T-LBL (i), and in spleens of p53−/− V-Del and p53−/− V-Fus mice harboring Lym (ii). Original magnification ×400. Scale bars, 10 µm. The percentage at the bottom right corner is positivity in the tumor cells. CD3, red; Myc, green; 4′,6-diamidino-2-phenylindole (DAPI), blue. (F) Comutation plots including the spectrum of somatic mutations and focal SCNAs. (G) Rearrangements of TCR genes identified through the MiXCR algorithm using WES data. The y-axis indicates each rearranged TCR gene with a certain complementarity-determining region 3 (CDR3) sequence. Distinct CDR3 regions are indicated by alternating colors within each sample; colors are indicated in descending order and do not indicate sequence identity.
WES analysis of tumor and tail samples. (A) Percentages of targeted bases covered by at least 2×, 10×, 20×, 30×, 40×, 50×, and 100× sequencing reads (top). (B) Variant allele frequencies of somatic mutations in each tumor (T-LBL from p53−/− mice, n = 3; T-LBL from p53−/− V-Del, n = 3; T-LBL from p53−/− V-Fus, n = 4; Lym from p53−/− V-Del, n = 2; and Lym from p53−/− V-Fus, n = 5). Mutations identified in human targeted capture sequencing data2,4 are shown in orange, and those identified in human WES data2 in blue. (C) Focal SCNAs identified through the GISTIC 2.0 algorithm using WES data. Amplified regions are shown in red; deleted regions are shown in blue. Chromosome 15qD1 includes the Myc locus. (D) High-level amplification of the Myc locus identified in Lym from 2 p53−/−VAV1-Tg mice. (E) Immunofluorescent staining for indicated markers in thymus from, p53−/− V-Del, and p53−/− V-Fus mice harboring T-LBL (i), and in spleens of p53−/− V-Del and p53−/− V-Fus mice harboring Lym (ii). Original magnification ×400. Scale bars, 10 µm. The percentage at the bottom right corner is positivity in the tumor cells. CD3, red; Myc, green; 4′,6-diamidino-2-phenylindole (DAPI), blue. (F) Comutation plots including the spectrum of somatic mutations and focal SCNAs. (G) Rearrangements of TCR genes identified through the MiXCR algorithm using WES data. The y-axis indicates each rearranged TCR gene with a certain complementarity-determining region 3 (CDR3) sequence. Distinct CDR3 regions are indicated by alternating colors within each sample; colors are indicated in descending order and do not indicate sequence identity.
We then analyzed somatic copy-number alterations (SCNAs) using the WES data. In total, 5 focal SCNAs were identified: 2 amplifications (14qE1 and 15qD1) and 3 deletions (6qB1, 14aC2, and 16qA1) (Figure 6C). Notably, focal SCNAs of 15qD1, including the Myc locus, were recurrently observed in tumors of 4 p53−/−VAV1-Tg mice (1 of 7 T-LBL, and 3 of 7 Lym), but were not detected in T-LBL from p53−/− mice (supplemental Table 7). Two tumors from p53−/−−VAV1-Tg mice showed high-level (more than eightfold) amplification of 15qD1, including the Myc locus (Figure 6D).
Actually, Myc protein was highly expressed in CD3+ T-LBL and Lym tumor cells from p53−/−VAV1-Tg mice but was only minimally expressed in equivalent cells from p53−/− mice (Figure 6E; supplemental Figure 7B). In contrast, at 12 weeks of age, Myc protein was detected only in a minimal number of thymus and spleen cells in V-Fus, p53−/−, and p53−/− V-Fus mice (supplemental Figure 7C), although as shown in supplemental Figures 6Ai,Bi, Myc messenger RNA upregulation was observed in splenic CD4 TN and Tmem cells from p53−/− V-Fus mice at this time period (supplemental Figure 6Ai,Bi).
Figure 6F summarizes recurrent gene mutations and focal SCNAs. Finally, application of the MiXCR algorithm using WES data identified clonal rearrangements of at least 1 of the TCR genes in all tumors (Figure 6G; supplemental Figure 7D), supporting clonal expansion of T-lineage cells in all the tumors. Additionally, all tumors except for 1 had rearrangements of TCR β-chain genes. Lym tumors always had rearrangements of TCR α-chain genes, whereas some T-LBL also had rearrangements.
Treatment with a bromodomain inhibitor prolongs overall survival of mice harboring VAV1-mutant tumors
We tested the in vivo effect of JQ1 using nude mice that had undergone secondary transplantation with T-LBL or Lym from p53−/−VAV1-Tg mice or T-LBL from p53−/− mice. Recipient mice were injected intraperitoneally with JQ1 at 3 mg/kg (p53−/−VAV1-Tg T-LBL, n = 7; Lym, n = 20; p53−/− T-LBL, n = 10) or with vehicle (p53−/−VAV1-Tg T-LBL, n = 10; Lym, n = 20; p53−/− T-LBL, n = 10) once every 2 days from day 7 after transplantation until animals died (Figure 7A). JQ1 prolonged overall survival (OS) of recipient mice transplanted with T-LBL or Lym from p53−/−VAV1 mice (Figure 7B-C). By contrast, OS of JQ1-treated recipient mice transplanted with T-LBL from p53−/− mice was comparable to that seen in vehicle-treated mice (Figure 7D).
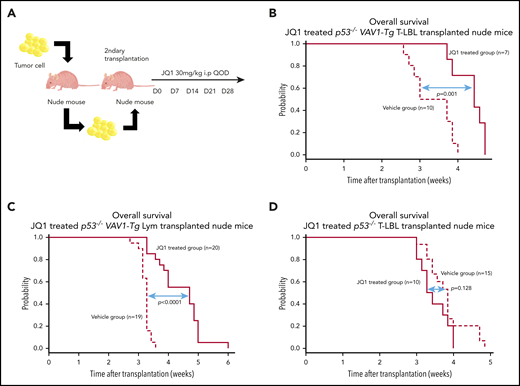
Effects of bromodomain inhibitors on VAV1-mutant tumor cells. (A) Schematic showing protocol used for vehicle or JQ1 treatment. Single-cell suspensions were prepared from spleens of nude mice transplanted with T-LBL or Lym from p53−/−VAV1-Tg mice or T-LBL from p53−/− mice and intraperitoneally injected into nude mice. JQ1 at 3 mg/kg was injected intraperitoneally into secondarily transplanted nude mice once every 2 days from day 7 until animals died. (B-D) Survival curves for vehicle- and JQ1-treated nude mice transplanted with T-LBL from p53−/−VAV1-Tg mice (B), Lym from p53−/−VAV1-Tg mice (C), or T-LBL from p53−/− mice (D).
Effects of bromodomain inhibitors on VAV1-mutant tumor cells. (A) Schematic showing protocol used for vehicle or JQ1 treatment. Single-cell suspensions were prepared from spleens of nude mice transplanted with T-LBL or Lym from p53−/−VAV1-Tg mice or T-LBL from p53−/− mice and intraperitoneally injected into nude mice. JQ1 at 3 mg/kg was injected intraperitoneally into secondarily transplanted nude mice once every 2 days from day 7 until animals died. (B-D) Survival curves for vehicle- and JQ1-treated nude mice transplanted with T-LBL from p53−/−VAV1-Tg mice (B), Lym from p53−/−VAV1-Tg mice (C), or T-LBL from p53−/− mice (D).
Discussion
Here, we report that expression of VAV1 mutants accelerates TCN development in the presence of Trp53 deletion. Two kinds of VAV1 mutants, V-Fus and V-del, have similar oncogenic properties because tumors harboring either V-Fus or V-del mutant display similar phenotypes, GEPs, and genomic abnormalities. Although all TCNs seen in p53-null mice were immature T-LBL with CD24+TCRβlow, TCNs expressing VAV1 mutants exhibited more mature immunophenotypes, namely, T-LBL with CD24+TCRβ+ and Lym.
PTCL-NOS in humans is classified as belonging to either PTCL-GATA3 or PTCL-Tbx21 subgroups, depending on molecular signature.29 PTCL-GATA3 has a worse prognosis,29,30 is characterized by high MYC expression,30 and often shows complex genomic abnormalities with a high frequency of MYC amplifications.24 Here, we report that Lym resembles human PTCL-GATA3: Lym tumors exhibit a Th2 phenotype based on tumor GEPs and cytokine profiles in sera of Lym-bearing mice. We also observed increased Myc expression and amplification of Myc locus in Lym tumors. Comparison of GEPs in mouse Lym and human PTCL-GATA3 further revealed features common to both (supplemental Figure 5G).
We observed Ccr4 expression as well as Gata3 expression on Lym tumor cells harboring VAV1 mutants, and others have reported that Ccr4 expression levels positively correlate with those of GATA3 in human PTCL-GATA3.31 Mogamulizumab, a defucosylated anti-CCR4 antibody, is reportedly effective against some PTCLs that express CCR4 on tumor cells.32 Therefore, PTCLs that harbor VAV1 mutations should be evaluated for CCR4 expression as mogamulizumab could be a treatment option.
Development of Lym with Th2 skewing and high Myc expression may be attributable to chronic active TCR signaling, considering that we observed VAV1 phosphorylation, a marker of active TCR signaling, in V-Fus–expressing nontumor T cells and Lym tumor cells (Figures 1D and 3Bii). TCR signaling reportedly activates cell-cycle–related activities, including Myc expression, and augments proliferation of mature T cells,33 whereas sustained TCR signaling in T cells results in mature TCN development due to deregulation of proliferative signals.34 In addition, it is known that tonic rather than acute TCR signaling instructs CD4 naive T cells to differentiate into Gata3-expressing Th2 rather than Th1 cells.35 Indeed, we observed enrichment of cell-cycle–related gene sets (G2M checkpoint and E2F targets), and slightly elevated expression of Myc and Gata3, all of which occur downstream of TCR signaling,36,37 in V-Fus–expressing CD4 TN and CD4 Tmem prior to tumor development. Exacerbation of these activities represented by amplification of the Myc locus and the other oncogenic events occur as Lym develops.
In contrast, we did not observe VAV1 phosphorylation in V-Fus–expressing T-LBL tumor cells, suggesting that accelerated T-LBL development seen in mice harboring the V-Fus mutant is likely not due to TCR signal activation. V-Fus lacks the C-terminal SH3 domain, which is reportedly required for interaction with Notch1 intracellular domain (ICN1) and Cbl-b protein, a ubiquitin ligase that facilitates the degradation of ICN1 by Cbl-b.9 Activation of Notch signaling due to overexpression of the ICN138,39 or gain of functions in the NOTCH1 gene38,40 reportedly lead to T-LBL development. Therefore, T-LBL development in mice harboring the V-Fus mutant may be attributable to Notch1 activation, although these mechanisms remain to be characterized. Enhanced Myc pathway activity seen in VAV1-mutant T-LBL may also be due to increased Notch1 signaling, as Myc transcription is reportedly directly regulated by Notch1 in T-LBL.41,42
In summary, we established mice expressing VAV1 mutants in T cells, enabling us to assess the oncogenic roles of these mutations in TCNs. Our mouse models may provide important tools in which to test new therapeutic strategies to antagonize these malignancies.
Information and requests for resources and reagents should be directed to, and will be fulfilled by, the Lead Contact Shigeru Chiba (schiba-tky@umin.net).
The online version of this article contains a data supplement.
The publication costs of this article were defrayed in part by page charge payment. Therefore, and solely to indicate this fact, this article is hereby marked “advertisement” in accordance with 18 USC section 1734.
Acknowledgments
The authors thank Elise Lamar for editorial assistance (www.eliselamar.com). The authors also thank Yutaka Suzuki, Kaoru Uchimaru, and Makoto Yamagishi (University of Tokyo) for active discussion, and Yukari Sakashita and Hiroko Kunifuda for technical assistance. Mouse and cell illustrations (Figures 5I and 7A; supplemental Figure 3A) were supported by DBCLS TogoTV (https://togotv.dbcls.jp/pics.html).
This work was supported by Grants-in-Aid for Scientific Research (KAKENHI: 18K16077 [T.B.N.], 18H02834 [M.S.-Y.], 16H02660 [S.C.], and 19H03683 [S.C.]) from the Ministry of Education, Culture, Sports, and Science of Japan, and Japan Agency for Medical Research and Development (AMED) under grant numbers JP20ck0106544h and JPxxlm0203010 (M.S.-Y.) and JP16cm0106505h (S.C.).
Authorship
Contribution: K.F. and M.S.-Y. performed experiments and analyzed data; M.F., T.S., Y. Suehara, T.B.N., S.S., S.Y., Y. Shiraishi, and K.C. collected data and were involved in this project; H.M., T.B.N., and K.O. stained samples and diagnosed; M.F., T.B.N., A.B., K.K., S.O., and J.I. provided GEP data for human AITL, PTCL-GATA3, ATL patient, and AITL mouse models; K.F., M.S.-Y., and S.C. generated the figures and tables and wrote this manuscript; M.S.-Y. and S.C. led the entire project; and all authors participated in discussions and interpretation of the data and results.
Conflict-of-interest disclosure: M.S.-Y. received funds from Celgene. K.K. received funds from Otsuka Pharmaceuticals, Takeda Pharmaceutical, and Chugai Pharmaceutical. K.O. received funds from Celgene and Daiichi Sankyo. S.C. received funds from Thyas, Takeda Pharmaceutical, Chugai Pharmaceutical, Kyowa-Kirin, Ono Pharmaceutical, Sanofi, and Astellas Pharmaceutical for research unrelated to this work. The remaining authors declare no competing financial interests.
Correspondence: Shigeru Chiba, Department of Hematology, Faculty of Medicine, University of Tsukuba., 1-1-1 Tennnodai, Tsukuba, Ibaraki 305-8575, Japan; e-mail: schiba-tky@umin.net; and Mamiko Sakata-Yanagimoto, Department of Hematology, Faculty of Medicine, University of Tsukuba., 1-1-1 Tennnodai, Tsukuba, Ibaraki 305-8575, Japan; e-mail: sakatama-tky@umin.net.

This feature is available to Subscribers Only
Sign In or Create an Account Close Modal