

Key Points
T-PLL cells resemble activated T-lymphocytes with augmented memory-type effector functions including a marked anergy to apoptotic triggers.
Specific co-opting loss of inhibitory receptors and the overexpressed signal enhancer TCL1A lower thresholds toward permissive TCR input.

Abstract
T-cell prolymphocytic leukemia (T-PLL) is a poor-prognostic neoplasm. Differentiation stage and immune-effector functions of the underlying tumor cell are insufficiently characterized. Constitutive activation of the T-cell leukemia 1A (TCL1A) oncogene distinguishes the (pre)leukemic cell from regular postthymic T cells. We assessed activation-response patterns of the T-PLL lymphocyte and interrogated the modulatory impact by TCL1A. Immunophenotypic and gene expression profiles revealed a unique spectrum of memory-type differentiation of T-PLL with predominant central-memory stages and frequent noncanonical patterns. Virtually all T-PLL expressed a T-cell receptor (TCR) and/or CD28-coreceptor without overrepresentation of specific TCR clonotypes. The highly activated leukemic cells also revealed losses of negative-regulatory TCR coreceptors (eg, CTLA4). TCR stimulation of T-PLL cells evoked higher-than-normal cell-cycle transition and profiles of cytokine release that resembled those of normal memory T cells. More activated phenotypes and higher TCL1A correlated with inferior clinical outcomes. TCL1A was linked to the marked resistance of T-PLL to activation- and FAS-induced cell death. Enforced TCL1A enhanced phospho-activation of TCR kinases, second-messenger generation, and JAK/STAT or NFAT transcriptional responses. This reduced the input thresholds for IL-2 secretion in a sensitizer-like fashion. Mice of TCL1A-initiated protracted T-PLL development resembled such features. When equipped with epitope-defined TCRs or chimeric antigen receptors, these Lckpr-hTCL1Atg T cells gained a leukemogenic growth advantage in scenarios of receptor stimulation. Overall, we propose a model of T-PLL pathogenesis in which TCL1A enhances TCR signals and drives the accumulation of death-resistant memory-type cells that use amplified low-level stimulatory input, and whose loss of negative coregulators additionally maintains their activated state. Treatment rationales are provided by combined interception in TCR and survival signaling.
Introduction
T-cell prolymphocytic leukemia (T-PLL) is the most common mature T-cell leukemia.1 Characterized by the expansion of peripheral T cells, T-PLL typically presents with exponentially rising tumor burden in peripheral blood (PB) paralleled by splenomegaly, lymphadenopathy, and bone marrow (BM) infiltration.2,3 T-PLL shows poor responses to conventional cytostatics. The induced remissions after anti-CD52 Alemtuzumab are rarely sustained.4-6 With a median overall survival (OS) of <3 years, T-PLL patients still face a dismal prognosis.2,4,5 T-PLL cells display a classical CD2+,5+,7+ post-thymic immunophenotype and bear no autoaggressive features.3,7,8
The most characteristic molecular hallmark of T-PLL are the rearrangements inv(14)(q11q32) and t(14;14)(q11q32) that juxtapose the T-cell leukemia 1A (TCL1A) oncogene locus under control of enhancers of T-cell receptor (TCR)α or TCRδ genes.9 The resulting aberrant expression of TCL1A is found in the majority of T-PLL.2,10 As peripheral T cells lack TCL1A, this abrogation of physiological TCL1A silencing is considered causal in the initiation towards T-PLL. Transgenic (tg) TCL1A is oncogenic in mice by inducing mature T-cell leukemias that resemble human T-PLL.9
Apart from a synergism of TCL1A with the frequently perturbed damage checkpoint kinase ataxia telangiectasia mutated (ATM),11 an oncogenic concept around the T-cell receptor (TCR), the most central receptor in growth and differentiation of T cells, is still elusive in T-PLL. We had shown that, in T-PLL cells, TCL1A is recruited to TCR-induced protein complexes involving the signaling components ZAP70, LCK, and AKT.9 A physical interaction of TCL1A with the prosurvival Ser/Thr kinase AKT enhances its catalytic activity.10,12,13 Given our observation that TCL1A expression itself is inefficient in penetrating the tight homeostatic control in polyclonal settings,14 we postulated a cooperativity of TCL1A with TCR signals to promote clonal escape and leukemic outgrowth.
Moreover, the maturation stage and effector profile of T-PLL are insufficiently established and cannot be inferred from the clinical presentations. We phenotypically and functionally characterized the T cells of 188 well-annotated T-PLL and interrogated the modulatory impact of TCL1A. The memory-type tumor cells of no obvious clonotypic bias differed from normal T cells by high activation levels and aberrant TCR-elicited intracellular and effector responses. We show a competitive advantage by tonic TCR signals enhanced by kinase-coactivating and antiapoptotic TCL1A.
Methods
Samples
PB was obtained from 188 T-PLL patients (details in the supplemental Methods, available on the Blood Web site; supplemental Table 1) and age-matched healthy donors after informed consent according to GCP guidelines and review-board approved protocols (#11-319). PB mononuclear cells (PBMCs) from T-PLL patients and healthy volunteers were isolated by density gradient centrifugation (Histopaque; Sigma-Aldrich).
Mice
Procedures were approved under 2012.A166, 2012.A394, FK/1050, 8.87-50.10.35.08.071, 84-02042012A417, and 84-02042012A339. TCRtgOT-1, RAG1-deficient, and Lckpr-hTCL1Atg mice were obtained from Jackson Laboratories (Bar Harbor, ME) and CARCEA mice were obtained from the Patterson Institute (Manchester, UK).15 CARCEA and Lckpr-hTCL1Atg mice were crossbred for 10 generations toward double-tg animals (CARCEAxLckpr-hTCL1Atg). In vivo bioluminescence imaging was performed in murine recipients of OT-1 T cells transduced with luciferase vectors using the IVIS Imaging System Lumina II (PerkinElmer; supplemental Methods). Magnetic resonance imaging on anesthetized animals (Isofluran; AbbVie) was performed using an Ingenia 3.0T magnetic resonance imaging system (Philips) with a small rodent solenoid coil (Philips Research). Magnetic resonance images were acquired as described.16 Spleen volumetry was conducted using OsiriX lite (Pixmeo).
Magnetic-bead–based cell enrichment
Healthy T-cell populations were enriched from PBMCs by negative selection using the following kits according to the manufacturer’s instructions (Miltenyi Biotec): pan-T-cell isolation kit, naïve CD4+ T-cell isolation kit II, memory CD4+ T-cell isolation kit, and CD4+ central memory (CM) T-cell isolation kit. Required target purities of >98% were determined by flow cytometry.
Flow cytometry
Applied antibodies are listed in the supplemental Methods. TCR Vβ expression was assessed by the human IOTest β Mark Kit (BeckmanCoulter) and the Mouse Vβ TCR Screening Panel (BD Pharmingen) on a Gallios cytometer using the Kaluza software (BeckmanCoulter).
Gene expression profiling (GEP)
RNA was extracted from 1 × 10⁷ PBMCs of T-PLL patients (>95% T-cell purity) and healthy-donor PB T-cell populations (see "Magnetic-bead–based cell enrichment") using the mirVana Kit (Invitrogen) or ReliaPrep (Promega). Hybridization and reading on Illumina HumanHT 12 v4 BeadChip arrays or Illumina TrueSeq libraries with PE sequencing was done according to the manufacturer’s instructions. Data were submitted to the Gene Expression Omnibus (GEO) database under accession number GSE107397 and gene set enrichment (GSE) uploading.11 The published dataset GSE58445 was used for comparative analyses.17 Validations were performed by quantitative reverse transcription polymerase chain reaction (qRT-PCR). Detailed information on the bioinformatic algorithms (eg, normal T-cell subsets, literature-based memory T-cell signatures, or metadata integration) or gene lists are in the supplemental Methods.
Cell culture
All cell lines as well as human and murine primary cells were cultured in RPMI-1640 medium including l-glutamine (Gibco) supplemented with 10% fetal bovine serum (Sigma-Aldrich) and penicillin/streptomycin (100 U/ 0.1 M). For TCR crosslinking, plate-bound anti-CD3ε (OKT3; BioLegend) and/or anti-CD28 (15E8; BioLegend) antibodies were used at various concentrations; phorbolmyristylacetate with ionomycin (Sigma-Aldrich) was used for generic T-cell activation.
Transfection and transduction
The human mature T-cell line HH (TCL1A-negative) was transfected with a doxycycline-inducible TRMPVIR vector containing TCL1A.18 TCL1A expression in these iHH-TCL1A cells was induced by addition of doxycycline (Sigma-Aldrich) for 24 hours. The cell line pairs Jurkat-GFP/-TCL1A, Hut78-GFP/-TCL1A, Hut78-empty-vector (EV)/-TCL1A, CTLL-2-GFP/-TCL1A, and A5-NFAT-GFP19 without or with (−/+) TCL1A were established as described previously10,20 or as in the supplemental Methods. OT-1 T cells were transduced by retroviral vectors coexpressing human TCL1A cDNA10 with GFP (MP91-GFP14 ) or with a luciferase reporter (K. Cornils, Hamburg, Germany).
Immunoblotting
Western blots were performed on whole-cell lysates as described.21 Antibodies are listed in the supplemental Methods. Signals were visualized by Western Bright ECL (Advansta) and recorded on autoradiography films (Santa Cruz Biotechnology). Densitometry used the ImageJ software (http://rsb.info.nhi.gov/ij/).
Immunohistochemistry
Staining for murine CD8+ splenic T cells was performed on cryosections as described.22 Biotinylated primary antibodies (BioLegend), streptavidin-POD conjugate (Roche Diagnostics), and DAB chromogen (Vector Laboratories) were used. Sections were counterstained by hematoxylin (Carl Roth). Slides were digitalized using the VENTANA DP200 scanner (Roche Diagnostics). Signal quantification used the open source software QuPath.23
Immunofluorescence
Stainings for murine CD3, phospho (p)CD3ζ, and the chimeric antigen receptor (CAR) were performed on cryosections as described.22 Fluorescent-dye labeled primary antibodies (CD3; BioLegend), secondary antibodies (BioLegend), or streptavidin were used for detection. Signal quantification used the open source software ImageJ (http://rsb.info.nih.gov/ij).
Statistics
Results are presented with standard descriptive parameters (eg, mean ± standard error of the mean [SEM]) and the specific tests to assess difference probabilities (GraphPad Prism, v5.0). P < 0.05 were considered significant.
Results
T-PLL cells retain TCR expression and display a memory-phenotype spectrum
Multi-parameter immunophenotyping of T-PLL cells showed surface (s) TCRα/β positivity in 90% (129 of 143 cases). Coexpression of sTCRα/β, sCD3, and sCD28 was observed in 120 cases (84%). Although losses of sTCRα/β were paralleled by the absence of sCD3 (14 cases, 10%; Figure 1A), no case lacked all 3 receptors. CD4 single positivity was observed in 62% (Figure 1B).
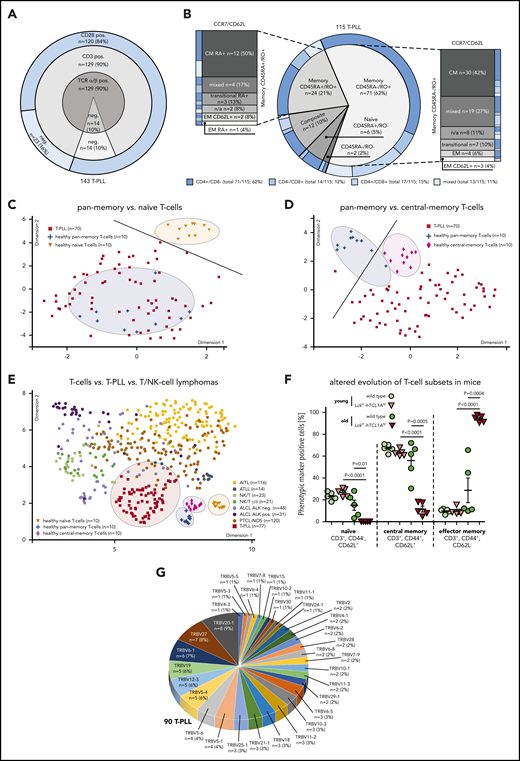
The TCR-positive T-PLL cells comprise a spectrum of memory phenotypes with a predominant CM fraction and frequent unconventional patterns. (A-B) Surface (s) marker expression (flow cytometry) in PB-derived primary T-PLL cells. (A) Distribution of sTCRα/β, sCD3, sCD28 across 143 T-PLL with no case lacking all 3 receptors. (B) Spectrum of naïve/memory differentiation on the basis of expression of CD45RA, CD45RO, CCR7, and CD62L (n = 115; see supplemental Table 2 for marker-defined subsets). A 70% cutoff was used to classify the predominant differentiation. Exemplary cases (including gating strategies) for each conventional and noncanonical pattern are illustrated in supplemental Figure 1A-B. Most cases (95 of 115, 83%) had a dominant T-memory subpopulation (CD45RO+). Within these CD45RA−/RO+ or CD45RA+/RO+ cases, a CCR7+/CD62L+ CM pattern was most frequent. Composite cases comprised 2 distinct populations with at least 1 showing a CD45RO+ phenotype (12 of 115 cases, 10%). Of the few CD45RA+/RO− cases (6 of 115, 5%), 3 (3% of total) resembled classical CCR7+/CD62L+ naïve T cells. A small number of cases had transitional phenotypes of EM-like or of terminally differentiated EM T cells with CD45RA (T-EMRA). Alignments with (co)expression of CD4 and CD8 revealed no association with CD45 isoform patterns. (C-D) Array-based GEP on 70 primary T-PLL and of healthy PB-derived naïve, pan-memory, and CM T cells (10 donors each). UMAP analysis used gene signatures identified in comparative algorithms (25 most differentially expressed genes per comparison; + fold-change sorted; P value cutoff, 0.05; supplemental Methods). The gene lists are in supplemental Table 3, and the most informative genes are illustrated in supplemental Figure 2A. For heatmaps showing signature gene expression in T-PLL vs control samples (unsupervised clustering), see supplemental Figure 2B-C. (C) UMAP on the basis of signature genes identified in the pan-memory vs naive T-cell comparison. Circles and a separator line highlight distinct clustering of healthy-donor T cells vs T-PLL cells. (D) UMAP based on signature genes identified by pan-memory vs CM T-cell comparison. (E) Clustering of 77 T-PLL vs 373 T-cell/natural killer–cell lymphomas using UMAP (5000 most differentially expressed genes over all entities). (F) Accumulation of EM T cells in TCL1A-driven murine (pre)leukemic expansions (flow cytometry). T-splenocytes from young (10 weeks) or old (10 to 16 months) Lckpr-hTCL1Atg mice vs age-matched C57BL/6J wild-type controls (n = 5 each). (G) Frequency-ranked TRBV gene usage in dominant TRB clonotypes of 90 T-PLL on the basis of TRB NGS.
The TCR-positive T-PLL cells comprise a spectrum of memory phenotypes with a predominant CM fraction and frequent unconventional patterns. (A-B) Surface (s) marker expression (flow cytometry) in PB-derived primary T-PLL cells. (A) Distribution of sTCRα/β, sCD3, sCD28 across 143 T-PLL with no case lacking all 3 receptors. (B) Spectrum of naïve/memory differentiation on the basis of expression of CD45RA, CD45RO, CCR7, and CD62L (n = 115; see supplemental Table 2 for marker-defined subsets). A 70% cutoff was used to classify the predominant differentiation. Exemplary cases (including gating strategies) for each conventional and noncanonical pattern are illustrated in supplemental Figure 1A-B. Most cases (95 of 115, 83%) had a dominant T-memory subpopulation (CD45RO+). Within these CD45RA−/RO+ or CD45RA+/RO+ cases, a CCR7+/CD62L+ CM pattern was most frequent. Composite cases comprised 2 distinct populations with at least 1 showing a CD45RO+ phenotype (12 of 115 cases, 10%). Of the few CD45RA+/RO− cases (6 of 115, 5%), 3 (3% of total) resembled classical CCR7+/CD62L+ naïve T cells. A small number of cases had transitional phenotypes of EM-like or of terminally differentiated EM T cells with CD45RA (T-EMRA). Alignments with (co)expression of CD4 and CD8 revealed no association with CD45 isoform patterns. (C-D) Array-based GEP on 70 primary T-PLL and of healthy PB-derived naïve, pan-memory, and CM T cells (10 donors each). UMAP analysis used gene signatures identified in comparative algorithms (25 most differentially expressed genes per comparison; + fold-change sorted; P value cutoff, 0.05; supplemental Methods). The gene lists are in supplemental Table 3, and the most informative genes are illustrated in supplemental Figure 2A. For heatmaps showing signature gene expression in T-PLL vs control samples (unsupervised clustering), see supplemental Figure 2B-C. (C) UMAP on the basis of signature genes identified in the pan-memory vs naive T-cell comparison. Circles and a separator line highlight distinct clustering of healthy-donor T cells vs T-PLL cells. (D) UMAP based on signature genes identified by pan-memory vs CM T-cell comparison. (E) Clustering of 77 T-PLL vs 373 T-cell/natural killer–cell lymphomas using UMAP (5000 most differentially expressed genes over all entities). (F) Accumulation of EM T cells in TCL1A-driven murine (pre)leukemic expansions (flow cytometry). T-splenocytes from young (10 weeks) or old (10 to 16 months) Lckpr-hTCL1Atg mice vs age-matched C57BL/6J wild-type controls (n = 5 each). (G) Frequency-ranked TRBV gene usage in dominant TRB clonotypes of 90 T-PLL on the basis of TRB NGS.
Despite the existence of nonconventional patterns (supplemental Figure 1A-B; supplemental Table 2 for phenotypic categories), the majority of cases was composed of a dominant memory T-cell population (95 of 115 cases, 83%; Figure 1B), indicated by single CD45RO (71 of 115 cases, 62%) or by CD45RO/RA coexpression (24 of 115 cases, 21%). Most frequent within both CD45RA−/RO+ and CD45RA+/RO+ cases was a CCR7+/CD62L+ central-memory (CM) pattern (42 of 95 cases, 44%). Automated spanning-tree progression analysis of density-normalized events,24 confirmed these results (supplemental Figure 1C).
Array-based GEP of healthy-donor PB-isolated T cells (pan-memory [CD45RO+/RA−] T cells, CM [CD45RO+/RA−, CCR7+] T cells, and naïve [CD45RA+/RO−] T cells [10 donors each]) allowed the identification of signatures that best discerned these normal T-cell subsets (supplemental Figure 2A; supplemental Table 3; supplemental Methods). Guided by these most informative gene sets, uniform manifold approximation and projection (UMAP) analyses showed that transcriptomes of primary T-PLL cells (70 cases) revealed a higher similarity to pan-memory T cells as compared with naïve T cells (Figure 1C; supplemental Figure 2B), and to CM T cells as compared with pan-memory T-cells (Figure 1D; supplemental Figure 2C). Quantitative reverse transcription polymerase chain reaction analyses confirmed the T-cell subset-specific expression of 6/6 best-classifier genes in 12 representative T-PLL (supplemental Figure 2D). Moreover, similarities of T-PLL cells to CM T cells were confirmed by applying published25 T-memory signature gene sets (supplemental Figure 2E). Finally, when integrating GEP data of 77 T-PLL with reanalyzed metadata from 373 cases of other mature T-cell/natural killer–cell malignancies covering frequent World Health Organization categories,17 T-PLL showed a distinctly close proximity to (central) memory T cells (Figure 1E).
To assess phenotypic kinetics during disease evolution, we took advantage of the early-stage access provided by the T-PLL model of Lckpr-hTCL1Atg mice with thymic onset of TCL1A overexpression.9,11 In spleens of leukemic animals, we observed, in resemblance of overt human T-PLL, a predominance of memory T cells (CD44+/CD62L−; means, 94.1% [Lckpr-hTCL1Atg] vs 28.7% [wild type (WT)]) with a near-complete exhaustion of the naïve T-cell compartment (Figure 1F). T-splenocytes of preleukemic Lckpr-hTCL1Atg mice showed no differences in sizes of major T-cell populations to age-matched WT controls (means, 25% naïve and 65% CM T cells), implicating a lack of a major differentiation block in early T-PLL pathogenesis. Murine T cells retained CD3/CD28 expression throughout leukemic evolution (supplemental Figure 2F).
The constitutional TCR profile of T-PLL is diverse
High-throughput sequencing of TRBV gene loci in 90 T-PLL by consensus primers26 revealed a broad distribution of rearranged Vβ-chains, with TRBV20-1 (9%) and TRBV27 (8%) as the most prevalent (Figure 1G). The detected TRBV was usually monoclonal, but a small subset of cases (5%) showed a polyclonal composition. These data corroborate the spectral characteristics of expressed TCR domains that we previously observed by a flow-cytometric kit for limited Vβ-species.27
Whole-transcriptome sequencing in 15 T-PLL confirmed the productive expression by the rearranged TCRs (supplemental Figure 3A). Compared with the TCRα and -β diversities of healthy-donor pan-CD3+ T cells (mRNAseq of 4 donors), monoclonality was evident in all 15 cases. Translating the trinucleotide code of the TCRα/β CDR3 into amino acid sequences showed no intercase overlap (supplemental Table 4).
A broad and heterogeneic TCR clonotypic repertoire was also observed in leukemic Lckpr-hTCL1Atg mice in which chronologic assessments suggested evolution from a polyclonal background (supplemental Figure 3B-D). Young Lckpr-hTCL1Atg animals showed the same polyclonal Vβ-spectrum (flow cytometry) as young and old WT controls. The T-cell expansions of leukemic Lckpr-hTCL1Atg mice revealed oligo/monoclonal Vβ-chain expression; however, similar to human T-PLL, without obvious Vβ-chain biases.
T-PLL cells display a markedly activated phenotype
Assessing the basal T-cell activation status of 75 T-PLL compared with healthy-donor T cells, T-PLL cells showed an overall elevated expression of established T-cell activation and proliferation markers (CD38, CD69, CD40L, Ki-67; Figure 2A). This was also observed for the cytokine receptors CD25 (IL-2Rα), CD122 (IL-2Rβ), CD124, and CD127 (Figure 2A). Samples from 3 T-PLL patients were also assessed for changes in T-cell activation between the initial diagnosis and clinical progression (eg, illustrated by increasing PB lymphocytosis). There was no uniform association of altered cellular activation (CD25, CD38, CD69) or secretory IL-2 responses to TCR stimulation upon disease progression, and the preexisting memory pattern (CD45RA/RO) remained unaffected (supplemental Figure 4A; supplemental Table 5).
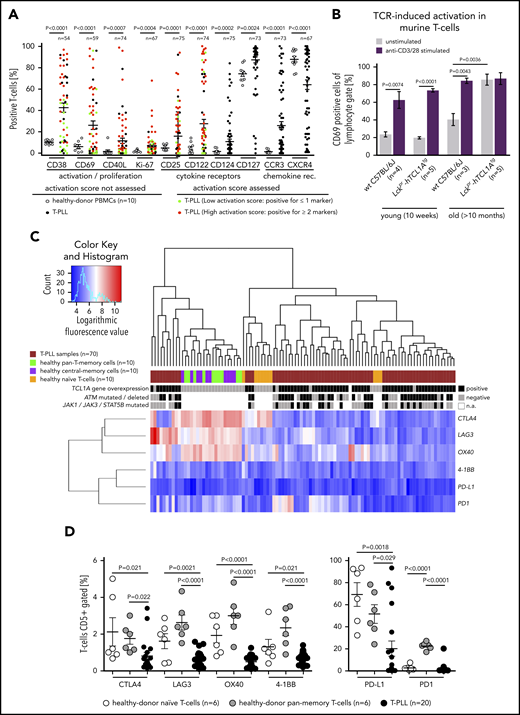
Increased activation state of the T-PLL cell includes losses of immune regulatory receptors. (A) Significantly increased percentages of T cells (flow cytometry) expressing activation/proliferation markers (CD38, CD40L, CD69, Ki-67) as well as cytokine (IL-2, -4, -7) and chemokine receptors (CCR3, CXCR4) in T-PLL samples (up to 75 cases) and CD3-gated healthy-donor PBMCs (n = 10; unpaired Student t test with Welch’s correction). Cutoffs for percentage of positive cells of the first 6 markers: CD122 (>10%), CD25 (>50%), CD38 (>50%), CD40L (>5%), CD69 (>5%), and Ki-67 (>20%). A sum score entails the counts of individual markers that are expressed above these thresholds (positive) for the 7-tier (0-6) activation score: low (green; 0 or 1 marker) vs high (red; ≥2 markers). (B) Higher number of CD69+ T cells at basal (no TCR crosslinking) conditions in leukemic Lckpr-hTCL1Atg and no more increase after TCR engagement compared with age-matched C57BL/6J mice (flow cytometry; P = .0036, unpaired Student t test, SEM). T cells of both strains did not show differences in CD69 positivity in young animals and similar responsiveness to anti-CD3/CD28 stimulation. (C-D) Significantly reduced expression of negative TCR-regulatory coreceptors in T-PLL cells over PB-derived normal T cells (unpaired Student t test with SEM). (C) Heatmap on the basis of coreceptor gene transcript abundances (array-based GEP) in the 3 isolated normal T-cell subsets (each from 10 healthy donors) compared with 70 T-PLL. Alignment with TCL1A mRNA expression as well as genomic lesions in ATM and JAK/STAT genes.11 (D) Flow cytometry confirms immune coreceptor downregulation in CD5 gates of healthy-donor naïve and pan-memory T cells (each n = 6) vs 20 T-PLL (unpaired Student t test, SEM). See supplemental Figure 4D for impaired TCR-induced increases of these coreceptors in T-PLL cells.
Increased activation state of the T-PLL cell includes losses of immune regulatory receptors. (A) Significantly increased percentages of T cells (flow cytometry) expressing activation/proliferation markers (CD38, CD40L, CD69, Ki-67) as well as cytokine (IL-2, -4, -7) and chemokine receptors (CCR3, CXCR4) in T-PLL samples (up to 75 cases) and CD3-gated healthy-donor PBMCs (n = 10; unpaired Student t test with Welch’s correction). Cutoffs for percentage of positive cells of the first 6 markers: CD122 (>10%), CD25 (>50%), CD38 (>50%), CD40L (>5%), CD69 (>5%), and Ki-67 (>20%). A sum score entails the counts of individual markers that are expressed above these thresholds (positive) for the 7-tier (0-6) activation score: low (green; 0 or 1 marker) vs high (red; ≥2 markers). (B) Higher number of CD69+ T cells at basal (no TCR crosslinking) conditions in leukemic Lckpr-hTCL1Atg and no more increase after TCR engagement compared with age-matched C57BL/6J mice (flow cytometry; P = .0036, unpaired Student t test, SEM). T cells of both strains did not show differences in CD69 positivity in young animals and similar responsiveness to anti-CD3/CD28 stimulation. (C-D) Significantly reduced expression of negative TCR-regulatory coreceptors in T-PLL cells over PB-derived normal T cells (unpaired Student t test with SEM). (C) Heatmap on the basis of coreceptor gene transcript abundances (array-based GEP) in the 3 isolated normal T-cell subsets (each from 10 healthy donors) compared with 70 T-PLL. Alignment with TCL1A mRNA expression as well as genomic lesions in ATM and JAK/STAT genes.11 (D) Flow cytometry confirms immune coreceptor downregulation in CD5 gates of healthy-donor naïve and pan-memory T cells (each n = 6) vs 20 T-PLL (unpaired Student t test, SEM). See supplemental Figure 4D for impaired TCR-induced increases of these coreceptors in T-PLL cells.
An increased baseline expression of chemokine-receptors was seen for CCR3 and CCR4, but not for CCR5, CXCR3, or CXCR4 (Figure 2A; supplemental Figure 4B). These patterns of marker expression were not associated with specific T-cell (differentiation) subsets (supplemental Figure 4C; supplemental Table 6). In further support of a leukemia-associated elevated T-cell activation state, basal T-cellular CD69 expression was significantly (P = .0036) increased, and saturated towards further TCR stimulation, in leukemic T-PLL mice as compared with age-matched WT controls (Figure 2B).
T-cell activation by (constant) TCR triggers also involves counter-regulation by coreceptors. Of those, CTLA4, LAG3, PD1, PD-L1, OX40, and 4-1BB were generally downregulated in T-PLL as compared with healthy-donor naïve and pan-memory T cells, both at the mRNA and protein level (Figure 2C-D). Upon stimulation T-PLL cells upregulated these coreceptors to a lower degree than normal T cells (supplemental Figure 4D). This suggests that the transformed T cells have escaped autoregulatory programs to ensure an elevated net level of activation. Although genes encoding TCR pathway components are rarely subject to mutations or copy-number alterations in T-PLL,11 their mRNA level was congruently deregulated here in human and murine T-PLL (eg, downregulated CTLA4; supplemental Figure 5A-C). Major histocompatibility complex (MHC) molecules, as further parts of a T-cell immune synapse, were more often downregulated at the global transcript level in T-PLL vs healthy-donor pan-memory T cells (supplemental Figure 5D).
TCR activation in T-PLL triggers aberrant signal responses
Postulating (auto)antigen/MHC–mediated differentiation of the T-PLL precursor, we assessed the preservation of TCR signal competence in leukemic T-PLL cells. Cell viability increased, particularly in response to CD3/CD28 crosslinking (as compared with IL-2; supplemental Figure 6A). Although CD3 engagement evoked a strong Ca2+-efflux in most T-PLL (8 of 12 cases; 67%) and CD28-costimulation enhanced this second-messenger release in 9 of 12 (75%) cases (Figure 3A), there was a small proportion of weak responders. Pharmacologic inhibition of the central TCR-signaling kinase interleukin-2-inducible T-cell kinase (ITK) suppressed the activation-induced stimulation of T-PLL cell viability (Figure 3B).
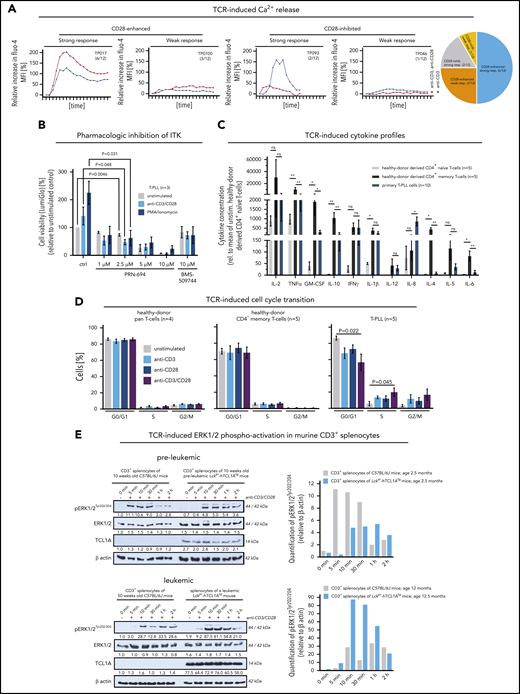
The TCR competent T-PLL cell shows aberrant effector responses. (A) Patterns of Ca2+ efflux upon CD3/28 crosslinking in 12 primary T-PLL; 4 representative examples (and number/cohort): TP017 (strong response, CD28-enhanced), TP093 (strong response, CD28-inhibited), TP018 (weak response, CD28-enhanced), TP046 (weak response, CD28-inhibited). (B) ITK inhibition blocks the stimulation-induced (CD3/CD28 crosslinking, phorbolmyristylacetate/ionomycin) increase in cell viability (CellTiter-Glo) in T-PLL cells (unpaired Student t test, SEM). Inhibitors: PRN-694 (covalent binding; relevant IC50s: ITK 0.3nM; RLK 1.4nM; JAK3 30nM) and BMS-509744 (reversible binding; IC50: ITK 15nM).52 C) Cytokine secretion of anti-CD3/CD28-stimulated healthy-donor derived CD4+ naïve and CD4+ memory T cells (each n = 5) vs T-PLL cells (n = 10) in relation to their unstimulated controls (11-analyte human cytokine array). Overall, secretory responses of healthy memory T cells and T-PLL cells were more similar and higher as compared with healthy-donor CD4+ naïve T cells. Particularly, releases of IL-2, TNFα/β, GM-CSF, IL-10, IFNγ, and IL-1β were strongly increased (unpaired Student t test, SEM). (D) Upon TCR crosslinking T-PLL cells (5 cases) enter the cell cycle (propidium iodide (PI) staining and flow cytometry) more readily than pan–T cells (n = 4) or CD4+ memory T cells (n = 5) from healthy donors, which was more pronounced in conditions of combined CD3/CD28 costimulation (unpaired Student t test, SEM). (E) Enhanced pERK1/2 response to TCR crosslinking in leukemic Lckpr-hTCL1Atg mice upon enrichment of TCL1A-transgene expressing memory T cells (see Figure 1F) as compared with preleukemic mice (and each to age-matched C57BL/6J wild-type controls); pooled splenocyte lysates of 3 mice; for sample purities see supplemental Figure 6D.
The TCR competent T-PLL cell shows aberrant effector responses. (A) Patterns of Ca2+ efflux upon CD3/28 crosslinking in 12 primary T-PLL; 4 representative examples (and number/cohort): TP017 (strong response, CD28-enhanced), TP093 (strong response, CD28-inhibited), TP018 (weak response, CD28-enhanced), TP046 (weak response, CD28-inhibited). (B) ITK inhibition blocks the stimulation-induced (CD3/CD28 crosslinking, phorbolmyristylacetate/ionomycin) increase in cell viability (CellTiter-Glo) in T-PLL cells (unpaired Student t test, SEM). Inhibitors: PRN-694 (covalent binding; relevant IC50s: ITK 0.3nM; RLK 1.4nM; JAK3 30nM) and BMS-509744 (reversible binding; IC50: ITK 15nM).52 C) Cytokine secretion of anti-CD3/CD28-stimulated healthy-donor derived CD4+ naïve and CD4+ memory T cells (each n = 5) vs T-PLL cells (n = 10) in relation to their unstimulated controls (11-analyte human cytokine array). Overall, secretory responses of healthy memory T cells and T-PLL cells were more similar and higher as compared with healthy-donor CD4+ naïve T cells. Particularly, releases of IL-2, TNFα/β, GM-CSF, IL-10, IFNγ, and IL-1β were strongly increased (unpaired Student t test, SEM). (D) Upon TCR crosslinking T-PLL cells (5 cases) enter the cell cycle (propidium iodide (PI) staining and flow cytometry) more readily than pan–T cells (n = 4) or CD4+ memory T cells (n = 5) from healthy donors, which was more pronounced in conditions of combined CD3/CD28 costimulation (unpaired Student t test, SEM). (E) Enhanced pERK1/2 response to TCR crosslinking in leukemic Lckpr-hTCL1Atg mice upon enrichment of TCL1A-transgene expressing memory T cells (see Figure 1F) as compared with preleukemic mice (and each to age-matched C57BL/6J wild-type controls); pooled splenocyte lysates of 3 mice; for sample purities see supplemental Figure 6D.
Generally, the stimulation-induced kinetics in the expression of activation markers, chemokine receptors, and CD45RO in T-PLL cells were rather similar to those of age-matched normal memory T-cell subsets (supplemental Figure 6B-C). Moreover, T-PLL cells revealed a robust (TCR-stimulated) secretion of the predominantly Th1-associated cytokines IFNγ, IL-2, IL-10, TNFα/β, and IL-8 that resembled the response of age-matched healthy-donor CD4+ pan-memory T cells, as compared with CD4+ naïve T cells (Figure 3C; supplemental Figure 7; supplemental Table 7). Furthermore, TCR crosslinking stimulated cell-cycle progression from G1-to-S and G2-to-M was more efficient in T-PLL than in pan–T cells or CD4+ memory T cells of healthy-donors (Figure 3D). Fittingly, the enrichment of memory-type TCL1A-transgene expressing T cells during leukemic evolution (Figure 1F) was accompanied by an enhanced TCR-induced p-kinase induction as overtly leukemic Lckpr-hTCL1Atg T cells showed higher pERK1/2 responses to CD3/28 crosslinking than purified age-matched WT controls and T cells from preleukemic stages (Figure 3E; supplemental Figure 6D).
Resistance of T-PLL cells to activation-induced programmed cell death
Repeated stimulation of activated T cells physiologically triggers activation-induced cell death (AICD) mainly by interaction of membrane CD95 (FasR) with its ligand CD95L (extrinsic apoptotic pathway).28 Importantly, T-PLL cells showed a reduced propensity to undergo AICD as compared with healthy-donor pan–T cells, a behavior in which they resembled age-matched healthy-donor CD4+ memory T cells (Figure 4A). Downregulation of FasR only partly explained this aberrant response, because loss of sCD95 expression was observed in only 57% of cases (39 of 68 cases, P < .001; Figure 4B).
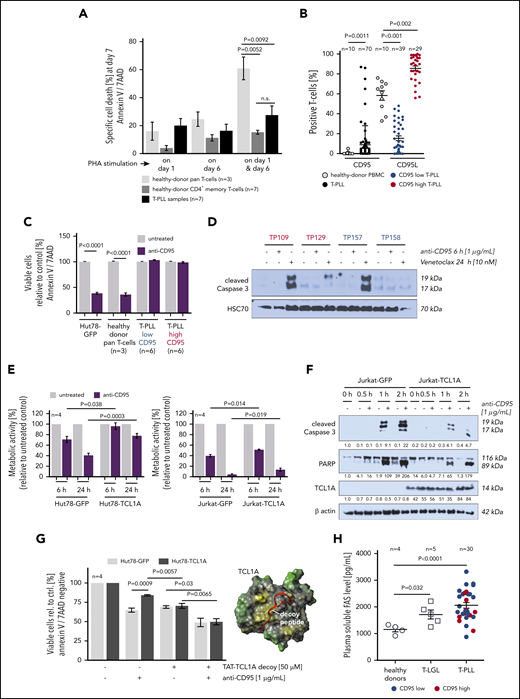
T-PLL cells show a marked defect in the execution of AICD. (A) Apoptosis induction (Annexin V/7AAD flow cytometry) upon repeated T-cell activation. Healthy-donor pan–T cells (n = 3), healthy-donor CD4+ memory T cells (n = 7), and T-PLL cells (n = 7) were cultured in the presence of 10 U/mL IL-2 and stimulated once with 1 µg/mL PHA (either on day 1 or day 6) or repeatedly on day 1 and day 6. T-PLL cells and normal CD4+ memory T cells show a similarly diminished capacity to undergo AICD as compared with age-matched healthy-donor pan–T cells (unpaired Student t test, SEM). (B) CD95L (n = 70 T-PLL) and CD95 (n = 68 T-PLL) expression detected by flow cytometry in healthy-donor T cells (n = 10) and T-PLL cells. Although heterogeneously distributed, CD95L-positive cells are increased in T-PLL samples (P = .0011, unpaired Student t test, SEM). sCD95 (right) reveals a broader range in T-PLL than in healthy controls, with an obvious clustering of cases at the low and high percentages. Color-coded low (<50% cells, blue) vs high (≥50%, red) sCD95 expression is reiterated in panels C, D, and H. (C) Apoptotic response of T-PLL cells (12 cases) to CD95 engagement by an agonistic antibody (Annexin V/7AAD staining, flow cytometry). T-PLL cells are resistant to extrinsically induced apoptosis via Fas ligation, irrespective of FasR (sCD95) expression status. Positive controls: Hut78 mature T-cell lymphoma line and healthy-donor pan–T cells (n = 3; unpaired Student t test, SEM). (D) Lack of Caspase-3 cleavage in T-PLL cell lysates upon CD95-ligation (agonistic antibody), whereas Venetoclax (targeting the intrinsic apoptosis pathway) induced processing of this distal apoptotic executioner. (E) Viability (MTT-based metabolic activity) of Hut78 and Jurkat T cells (functionally Fas/L competent) upon exposure to the CD95 agonistic antibody was decreased to a lesser degree in the presence of TCL1A (unpaired Student t test, SEM). (F) Introduction of TCL1A in Jurkat cells reduced the CD95-ligation induced levels of processed Caspase 3 and PARP. (G) TCL1A-mediated resistance to apoptotic CD95-ligation was alleviated by steric antagonization of the prosurvival TCL1A-AKT interaction (similar susceptibility to anti-CD95 agonistic antibody between Hut78-TCL1A cells and Hut78-GFP controls; unpaired Student t test, SEM). TCL1A surface model (yellow, hydrophobic; green, hydrophilic) with the aligned stretch of interphase-mimicking decoy peptides (red) that were linked to a TAT protein transduction domain. (H) Levels of soluble Fas in plasma of patients with T-LGL (n = 5)and T-PLL (n = 30) were higher than in healthy-donor plasma samples (n = 4; P = .032 and P < .0001, respectively, unpaired Student t test with Welch’s correction), irrespective of CD95 expression (blue/red).
T-PLL cells show a marked defect in the execution of AICD. (A) Apoptosis induction (Annexin V/7AAD flow cytometry) upon repeated T-cell activation. Healthy-donor pan–T cells (n = 3), healthy-donor CD4+ memory T cells (n = 7), and T-PLL cells (n = 7) were cultured in the presence of 10 U/mL IL-2 and stimulated once with 1 µg/mL PHA (either on day 1 or day 6) or repeatedly on day 1 and day 6. T-PLL cells and normal CD4+ memory T cells show a similarly diminished capacity to undergo AICD as compared with age-matched healthy-donor pan–T cells (unpaired Student t test, SEM). (B) CD95L (n = 70 T-PLL) and CD95 (n = 68 T-PLL) expression detected by flow cytometry in healthy-donor T cells (n = 10) and T-PLL cells. Although heterogeneously distributed, CD95L-positive cells are increased in T-PLL samples (P = .0011, unpaired Student t test, SEM). sCD95 (right) reveals a broader range in T-PLL than in healthy controls, with an obvious clustering of cases at the low and high percentages. Color-coded low (<50% cells, blue) vs high (≥50%, red) sCD95 expression is reiterated in panels C, D, and H. (C) Apoptotic response of T-PLL cells (12 cases) to CD95 engagement by an agonistic antibody (Annexin V/7AAD staining, flow cytometry). T-PLL cells are resistant to extrinsically induced apoptosis via Fas ligation, irrespective of FasR (sCD95) expression status. Positive controls: Hut78 mature T-cell lymphoma line and healthy-donor pan–T cells (n = 3; unpaired Student t test, SEM). (D) Lack of Caspase-3 cleavage in T-PLL cell lysates upon CD95-ligation (agonistic antibody), whereas Venetoclax (targeting the intrinsic apoptosis pathway) induced processing of this distal apoptotic executioner. (E) Viability (MTT-based metabolic activity) of Hut78 and Jurkat T cells (functionally Fas/L competent) upon exposure to the CD95 agonistic antibody was decreased to a lesser degree in the presence of TCL1A (unpaired Student t test, SEM). (F) Introduction of TCL1A in Jurkat cells reduced the CD95-ligation induced levels of processed Caspase 3 and PARP. (G) TCL1A-mediated resistance to apoptotic CD95-ligation was alleviated by steric antagonization of the prosurvival TCL1A-AKT interaction (similar susceptibility to anti-CD95 agonistic antibody between Hut78-TCL1A cells and Hut78-GFP controls; unpaired Student t test, SEM). TCL1A surface model (yellow, hydrophobic; green, hydrophilic) with the aligned stretch of interphase-mimicking decoy peptides (red) that were linked to a TAT protein transduction domain. (H) Levels of soluble Fas in plasma of patients with T-LGL (n = 5)and T-PLL (n = 30) were higher than in healthy-donor plasma samples (n = 4; P = .032 and P < .0001, respectively, unpaired Student t test with Welch’s correction), irrespective of CD95 expression (blue/red).
Next, FasR functionality was assessed using the agonistic antibody EOS9.1. Such ligation of CD95 in 12 primary T-PLL samples (6 CD95-high vs 6 -low expressors, Figure 4B) did not induce apoptosis in either group, as per Annexin V expression and cleavage of effector Caspase 3 (Figure 4C-D). To address the potential protective effect of TCL1A against CD95-mediated apoptosis Jurkat and Hut78 T-cell lines of introduced TCL1A expression were interrogated. The presence of TCL1A was associated with higher cell viability as well as reduced processing of Caspase 3 and poly-ADP ribose polymerase (PARP) upon CD95 ligation as compared with the GFP-control–transfected cell lines (Figure 4E-F). The protective impact of TCL1A, likely contributing to resistance to CD95 ligation, could be partially reversed by cellular uptake of interphase decoy peptides that sterically inhibit the physical interaction of TCL1A with the prosurvival kinase AKT29 (Figure 4G).
As another potential mode of resistance to Fas-induced apoptosis, high plasma levels of soluble CD95 (Fas) were reported in T-LGL.30 Indeed, Fas levels in plasma from 30 T-PLL and 5 T-LGL patients were significantly higher (P < .0001 and P = .032; Student t tests) than in healthy-donor derived samples (Figure 4H).
TCL1A enhances the intracellular and effector responses to TCR stimulation
To specifically address the impact of high-level TCL1A on TCR responses, we used T-cell leukemia lines (HH, Hut78, and Jurkat) that were modified to constitutively or inducibly express a TCL1A transgene resulting in protein levels similar to those of human T-PLL (supplemental Figure 8A) and with retention of comparable sCD3/sCD28/sTCR expression between each pair (supplemental Figure 8B). Overall, we identified a proactive impact of introduced TCL1A at the various levels of TCR-induced responses, resembling those that we observed to be aberrant in primary T-PLL cells (Figure 3). In detail, basal TCR-downstream p-kinase levels were slightly increased by TCL1A expression (Figure 5A). Moreover, TCR-induced responses were enhanced as demonstrated by earlier and higher peaked pAKT and pERK1/2 levels (Figure 5A; supplemental Figure 8C-D). Ca2+ flux assays confirmed the TCR signal–amplifying effect of TCL1A, affecting the CD3 (TCR) signal more than CD28 coreceptor stimulation (Figure 5B). This enhancer effect of TCL1A led to higher net levels of cellular activation as detected by expression of activation markers (CD38, CD69; Figure 5C).
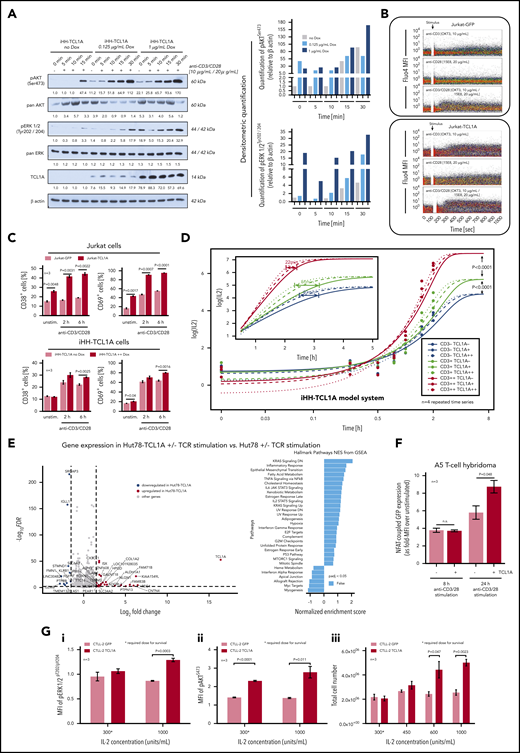
TCL1A enhances TCR downstream signaling. (A) Enforced TCL1A expression in human HH mature T-leukemia cells enhances (earlier and higher levels) the phospho-activation of AKT (pAKTSer473) and pERK1/2Tyr202/204 upon CD3/CD28 crosslinking (TCL1A-dose relatedness by titrated doxycycline in this inducible iHH-TCL1A system). Surface CD3 and CD28 were expressed at similar degrees in both HH−/+ TCL1A sublines (supplemental Figure 8B). Bar charts indicate densitometric quantification of immunoblots. (B) Single-cell and time-resolved Ca2+ flux after TCR stimulation in Jurkat cells and their stable transfectants of TCL1A (fluo-4 loading). Stronger and more extended flux signals were detected in the presence of TCL1A, which was particularly noted for CD3/28 coligation, but also for single crosslinking of either TCR component. (C) Basal and TCR stimulation induced surface expression of the activation markers CD38 and CD69 on Jurkat and iHH cells is increased in the context of TCL1A overexpression (unpaired Student t test, SEM). D) Titration of TCL1A expression and TCR activation in iHH-TCL1A T cells and recording of IL-2 release (ELISA). Multi-level combinations: TCL1A (no, low, high doxycycline dosages) each with CD3 (low, 0.1 µg/mL; high, 1.0 µg/mL) or/and each with CD28 (low, 0.2 µg/mL; high, 2.0 µg/mL) crosslinking antibodies. In a sensitizer-like fashion, TCL1A enhanced IL-2 secretion (earlier reach of isoconcentrations) upon submaximal levels of anti-CD3 (also supplemental Figure 8E). Analyses used fitting kinetic models with a maximum likelihood routine. Observations at 24 hours are not shown for better visibility. Illustrations of each time point are shown in supplemental Figure 8E. (E) Differential gene expression in Hut78-TCL1A T cells (over Hut78-empty-vector controls) without or with TCR stimulation detected by RNAseq. Volcano plot resulting from the extraction of TCR-induced genes in the TCL1A condition (over empty-vector control) with cutoffs of absolute Log2 fold-changes ≥ 1.5 and FDR values < 0.01. GSEA (gene set enrichment analysis) of these genes (10 downregulated and 27 upregulated) shows, among others, a prominent enrichment for IL-2/STAT5 and IL-6/JAK/STAT3 pathway clusters. More details in supplemental Figure 8F and supplemental Table 8. (F) The presence of TCL1A enhances TCR-induced NFAT-coupled GFP expression in the A5 T-cell hybridoma reporter system (unpaired Student t test, SEM). (G) IL-2-dependent murine CTLL-2 cells and their transduction with TCL1A or a GFP control followed by treatment with IL-2. (i-ii) Induced levels of pERK1/2Thr202/Tyr204 and pAKTS473 (flow cytometry, 3 experiments) are higher in the TCL1A expressing subline (unpaired Student t test, SEM). (iii) CTLL-2 cells execute a higher growth response (total cell number) under stimulation with increasing IL-2 concentrations upon ectopic TCL1A expression. TCL1A did not confer IL-2 independence.
TCL1A enhances TCR downstream signaling. (A) Enforced TCL1A expression in human HH mature T-leukemia cells enhances (earlier and higher levels) the phospho-activation of AKT (pAKTSer473) and pERK1/2Tyr202/204 upon CD3/CD28 crosslinking (TCL1A-dose relatedness by titrated doxycycline in this inducible iHH-TCL1A system). Surface CD3 and CD28 were expressed at similar degrees in both HH−/+ TCL1A sublines (supplemental Figure 8B). Bar charts indicate densitometric quantification of immunoblots. (B) Single-cell and time-resolved Ca2+ flux after TCR stimulation in Jurkat cells and their stable transfectants of TCL1A (fluo-4 loading). Stronger and more extended flux signals were detected in the presence of TCL1A, which was particularly noted for CD3/28 coligation, but also for single crosslinking of either TCR component. (C) Basal and TCR stimulation induced surface expression of the activation markers CD38 and CD69 on Jurkat and iHH cells is increased in the context of TCL1A overexpression (unpaired Student t test, SEM). D) Titration of TCL1A expression and TCR activation in iHH-TCL1A T cells and recording of IL-2 release (ELISA). Multi-level combinations: TCL1A (no, low, high doxycycline dosages) each with CD3 (low, 0.1 µg/mL; high, 1.0 µg/mL) or/and each with CD28 (low, 0.2 µg/mL; high, 2.0 µg/mL) crosslinking antibodies. In a sensitizer-like fashion, TCL1A enhanced IL-2 secretion (earlier reach of isoconcentrations) upon submaximal levels of anti-CD3 (also supplemental Figure 8E). Analyses used fitting kinetic models with a maximum likelihood routine. Observations at 24 hours are not shown for better visibility. Illustrations of each time point are shown in supplemental Figure 8E. (E) Differential gene expression in Hut78-TCL1A T cells (over Hut78-empty-vector controls) without or with TCR stimulation detected by RNAseq. Volcano plot resulting from the extraction of TCR-induced genes in the TCL1A condition (over empty-vector control) with cutoffs of absolute Log2 fold-changes ≥ 1.5 and FDR values < 0.01. GSEA (gene set enrichment analysis) of these genes (10 downregulated and 27 upregulated) shows, among others, a prominent enrichment for IL-2/STAT5 and IL-6/JAK/STAT3 pathway clusters. More details in supplemental Figure 8F and supplemental Table 8. (F) The presence of TCL1A enhances TCR-induced NFAT-coupled GFP expression in the A5 T-cell hybridoma reporter system (unpaired Student t test, SEM). (G) IL-2-dependent murine CTLL-2 cells and their transduction with TCL1A or a GFP control followed by treatment with IL-2. (i-ii) Induced levels of pERK1/2Thr202/Tyr204 and pAKTS473 (flow cytometry, 3 experiments) are higher in the TCL1A expressing subline (unpaired Student t test, SEM). (iii) CTLL-2 cells execute a higher growth response (total cell number) under stimulation with increasing IL-2 concentrations upon ectopic TCL1A expression. TCL1A did not confer IL-2 independence.
To assess a key distal effector function as well as to address aspects of saturations and signal replacements, we recorded kinetics of IL-2 release in experiments of titrated dosages of anti-CD3, anti-CD28, and TCL1A in the iHH-TCL1A system. Although maximally stimulated levels of IL-2 were independent of TCL1A, its transfected presence potentiated IL-2 secretion in a threshold-lowering fashion at submaximal intensities of CD3 engagement (Figure 5D; supplemental Figure 8E).
We next studied TCL1A-dictated transcriptional signatures and its impact on IL-2 regulating genes. Analyses of global gene expression of Hut78-TCL1A vs Hut78-EV controls with or without TCR stimulation revealed restricted sets of differentially expressed genes (Figure 5E; supplemental Figure 8F). Their gene set enrichment analysis (GSEA) uncovered, among others, enrichments in the IL-2/STAT5 and IL-6/JAK/STAT3 pathways (Figure 5E, right). A4 T-cell hybridomas that express a GFP-coupled NFAT (major transcription factor for IL-2) reporter, exhibited increased GFP-MFIs upon TCR stimulation under TCL1A overexpression (Figure 5F). This underlines the distal effects of the TCR-signal–enhancing function of TCL1A.
As autocrine IL-2 (triggered by TCR signals) is another major growth input of T cells, we studied the influence of TCL1A on responses to IL-2 in the IL-2-dependent murine T-cell line CTLL-2 (Figure 5G). Therein TCL1A conferred increased p-levels of AKT and ERK1/2 under conditions of required and supramaximal IL-2 dosages (Figure 5Gi-ii). This translated into a noticeable growth advantage (Figure 5Giii).
Modeled chronic TCR stimulation facilitates TCL1A-driven transformation
To assess for a viable cooperation of TCR signals and the impact of TCL1A towards T-cell transformation in vivo, we used TCL1A+/GFP+ or TCL1Aneg/GFP+ transduced ovalbumin (OVA)–specific T cells from TCRtg (OT-1) mice, transplanted them into RAG-/- recipients, and subjected them to defined TCR stimulation by repeated administration of OVA peptide (Figure 6A; supplemental Figure 9A). Importantly, numbers of OVA-stimulated CD3-gated T cells in PB rose earlier and outgrew all other conditions, when they expressed TCL1A (Figure 6A). Of note, the presence of TCL1A seemed to obviate the need for specific TCR stimulation as growth kinetics of OVA-unstimulated TCL1A+/GFP+ cells were congruent to those of OVA-stimulated TCL1Aneg/GFP+ cells. Considering that the OT-1 receptor carries basal autonomous activity in the absence of OVA ligation,31 this supports a concept of TCL1A enhancing intrinsic TCR signaling, a low-level input which normal resting memory T cells depend on.
![Competitive benefits to TCR-stimulated TCL1A-expressing Tcells. (A) The experimental set-up for panels A-E is illustrated above the x-axis. Earlier and more pronounced outgrowth of TCR-stimulated T cells in the presence of TCL1A. Blood was taken every 4 weeks from unstimulated (green, w/o stim) and repeatedly stimulated (red, OVA stim) recipients, of either TCL1neg/GFP+ or TCL1A+/GFP+OT-1 cells. Mean percentages (with SEM) of GFP+ cells (flow cytometry, CD3+ gating) were compared between the cohorts throughout the observation period (5 mice per group). (B) Unstimulated and stimulated recipient mice of TCL1A-Luc or T-Sapphire-Luc (control) transduced OT-1 cells were imaged 12 weeks after the first OVA/vehicle injection. Pseudocolor images were adjusted to the same threshold. (C) Quantified bioluminescence corroborates the data of panels A and B. Signal intensities (average radiance [photons/s/cm2/sr]) are shown as relative values (untreated controls set to 100). (D) Accelerated T-cell tumor induction and shorter OS upon provision of OVA peptide (vs unstimulated) in mice transplanted with TCL1+/GFP+OT-1 cells (log-rank test). (E) T-cell tumors (5 animals per cohort) induced by TCL1A-transduced OT-1 cells showed medium-sized lymphoid cells with a scant basophilic cytoplasm (spleen and PB) and a memory-T immunophenotype. (F) System of CARs as TCR surrogates: splenocytes from CARCEA, Lckpr-hTCL1Atg, and CARCEAxLckpr-hTCL1Atg mice were transplanted into lympho-depleted CEAtg mice. (G) Blood samples from CEAtg recipients of CARCEA (blue), Lckpr-hTCL1Atg (green), or CARCEAxLckpr-hTCL1Atg (red) cells were taken every 2 to 4 weeks and were analyzed by flow cytometry for repopulation of GFP+ (CAR) or TCL1A+ cells (CD3+ gated). Statistical significances for recipients of Lckpr-hTCL1Atg and CARCEAxLckpr-hTCL1Atg cells (descriptive, nonparameteric 95% confidence bands computed on the basis of a normal distribution assumption with smoothed conditional bounds on the basis of local polynomial regression fitting). Insets: activation (CD69) and proliferation (Ki-67) was enhanced in T cells of CARCEAxLckpr-hTCL1Atg, particularly over CARCEA mice (example at 42 weeks post-transplantation; unpaired Student t test, SEM). (H) Quantification of splenic CD8+ T-cell content by IHC on fresh-frozen tissues. In each section 3 representative areas were used for signal quantification (QuPath software; percentage of positive cells; unpaired Student t test with SEM. (I) Immunofluorescence on spleen sections (representative images, 3 mice/cohort) at 621 days post transplantation. Quantified cytoplasmic pCD3ζ signal intensities (3 areas per section; unpaired Student t test, SEM) implicate additive contributions by CAR and genuine TCR signals (single fluorescence channels in supplemental Figure 9E). Similar surface expression of CD3 in all 3 lines (MFIs, bottom right).](https://ash.silverchair-cdn.com/ash/content_public/journal/blood/136/24/10.1182_blood.2019003348/1/m_bloodbld2019003348f6.png?Expires=1767783760&Signature=dgL9O39r-~cQtnnMGqyxmoiKpxXtt~aWxgFwY559D1n43hIwWPdqYttm7e5kRxGAKa8ZHLTk-vGxS7YS~y7XIQh5hCxzDTEsTEoZGx8VObqPWLc0kiQkPHrgkqNZEVK-lnlslm8sErc-QpWyahrftDj4T14EAdCQT9FDpTtuZ4t9tQXgnuXncI~YnZNWLQsMM0P0qUzcJfN61eSNNCtbu3BXUQ0Nh~0pU7u~nLQoWgZwuzxATlKQJn674AI78PjIltlcGQP~YkJpHqILsvLj64uIf-fvzw7FwZ5dOSyp6deETj804IhnhQmxOxANYtcRT3eqaQAOknZtiWY2GwLNtg__&Key-Pair-Id=APKAIE5G5CRDK6RD3PGA)
Competitive benefits to TCR-stimulated TCL1A-expressing Tcells. (A) The experimental set-up for panels A-E is illustrated above the x-axis. Earlier and more pronounced outgrowth of TCR-stimulated T cells in the presence of TCL1A. Blood was taken every 4 weeks from unstimulated (green, w/o stim) and repeatedly stimulated (red, OVA stim) recipients, of either TCL1neg/GFP+ or TCL1A+/GFP+OT-1 cells. Mean percentages (with SEM) of GFP+ cells (flow cytometry, CD3+ gating) were compared between the cohorts throughout the observation period (5 mice per group). (B) Unstimulated and stimulated recipient mice of TCL1A-Luc or T-Sapphire-Luc (control) transduced OT-1 cells were imaged 12 weeks after the first OVA/vehicle injection. Pseudocolor images were adjusted to the same threshold. (C) Quantified bioluminescence corroborates the data of panels A and B. Signal intensities (average radiance [photons/s/cm2/sr]) are shown as relative values (untreated controls set to 100). (D) Accelerated T-cell tumor induction and shorter OS upon provision of OVA peptide (vs unstimulated) in mice transplanted with TCL1+/GFP+OT-1 cells (log-rank test). (E) T-cell tumors (5 animals per cohort) induced by TCL1A-transduced OT-1 cells showed medium-sized lymphoid cells with a scant basophilic cytoplasm (spleen and PB) and a memory-T immunophenotype. (F) System of CARs as TCR surrogates: splenocytes from CARCEA, Lckpr-hTCL1Atg, and CARCEAxLckpr-hTCL1Atg mice were transplanted into lympho-depleted CEAtg mice. (G) Blood samples from CEAtg recipients of CARCEA (blue), Lckpr-hTCL1Atg (green), or CARCEAxLckpr-hTCL1Atg (red) cells were taken every 2 to 4 weeks and were analyzed by flow cytometry for repopulation of GFP+ (CAR) or TCL1A+ cells (CD3+ gated). Statistical significances for recipients of Lckpr-hTCL1Atg and CARCEAxLckpr-hTCL1Atg cells (descriptive, nonparameteric 95% confidence bands computed on the basis of a normal distribution assumption with smoothed conditional bounds on the basis of local polynomial regression fitting). Insets: activation (CD69) and proliferation (Ki-67) was enhanced in T cells of CARCEAxLckpr-hTCL1Atg, particularly over CARCEA mice (example at 42 weeks post-transplantation; unpaired Student t test, SEM). (H) Quantification of splenic CD8+ T-cell content by IHC on fresh-frozen tissues. In each section 3 representative areas were used for signal quantification (QuPath software; percentage of positive cells; unpaired Student t test with SEM. (I) Immunofluorescence on spleen sections (representative images, 3 mice/cohort) at 621 days post transplantation. Quantified cytoplasmic pCD3ζ signal intensities (3 areas per section; unpaired Student t test, SEM) implicate additive contributions by CAR and genuine TCR signals (single fluorescence channels in supplemental Figure 9E). Similar surface expression of CD3 in all 3 lines (MFIs, bottom right).
Competitive benefits to TCR-stimulated TCL1A-expressing Tcells. (A) The experimental set-up for panels A-E is illustrated above the x-axis. Earlier and more pronounced outgrowth of TCR-stimulated T cells in the presence of TCL1A. Blood was taken every 4 weeks from unstimulated (green, w/o stim) and repeatedly stimulated (red, OVA stim) recipients, of either TCL1neg/GFP+ or TCL1A+/GFP+OT-1 cells. Mean percentages (with SEM) of GFP+ cells (flow cytometry, CD3+ gating) were compared between the cohorts throughout the observation period (5 mice per group). (B) Unstimulated and stimulated recipient mice of TCL1A-Luc or T-Sapphire-Luc (control) transduced OT-1 cells were imaged 12 weeks after the first OVA/vehicle injection. Pseudocolor images were adjusted to the same threshold. (C) Quantified bioluminescence corroborates the data of panels A and B. Signal intensities (average radiance [photons/s/cm2/sr]) are shown as relative values (untreated controls set to 100). (D) Accelerated T-cell tumor induction and shorter OS upon provision of OVA peptide (vs unstimulated) in mice transplanted with TCL1+/GFP+OT-1 cells (log-rank test). (E) T-cell tumors (5 animals per cohort) induced by TCL1A-transduced OT-1 cells showed medium-sized lymphoid cells with a scant basophilic cytoplasm (spleen and PB) and a memory-T immunophenotype. (F) System of CARs as TCR surrogates: splenocytes from CARCEA, Lckpr-hTCL1Atg, and CARCEAxLckpr-hTCL1Atg mice were transplanted into lympho-depleted CEAtg mice. (G) Blood samples from CEAtg recipients of CARCEA (blue), Lckpr-hTCL1Atg (green), or CARCEAxLckpr-hTCL1Atg (red) cells were taken every 2 to 4 weeks and were analyzed by flow cytometry for repopulation of GFP+ (CAR) or TCL1A+ cells (CD3+ gated). Statistical significances for recipients of Lckpr-hTCL1Atg and CARCEAxLckpr-hTCL1Atg cells (descriptive, nonparameteric 95% confidence bands computed on the basis of a normal distribution assumption with smoothed conditional bounds on the basis of local polynomial regression fitting). Insets: activation (CD69) and proliferation (Ki-67) was enhanced in T cells of CARCEAxLckpr-hTCL1Atg, particularly over CARCEA mice (example at 42 weeks post-transplantation; unpaired Student t test, SEM). (H) Quantification of splenic CD8+ T-cell content by IHC on fresh-frozen tissues. In each section 3 representative areas were used for signal quantification (QuPath software; percentage of positive cells; unpaired Student t test with SEM. (I) Immunofluorescence on spleen sections (representative images, 3 mice/cohort) at 621 days post transplantation. Quantified cytoplasmic pCD3ζ signal intensities (3 areas per section; unpaired Student t test, SEM) implicate additive contributions by CAR and genuine TCR signals (single fluorescence channels in supplemental Figure 9E). Similar surface expression of CD3 in all 3 lines (MFIs, bottom right).
Bioluminescence imaging 12 weeks after the first stimulation revealed that transplanted cells also accumulated in spleens and other abdominal regions. The strongest signals were recorded in stimulated recipients of TCL1A+/GFP+OT-1 cells (Figure 6B-C).
OVA stimulation promoted the transition of CM to effector memory (EM) T-cell phenotypes on the basis of the changes in expression of CCR7 and CD62L (supplemental Figure 9A, left). The most prominent terminal EM profile was seen in TCL1A-transduced T cells (of OVA-stimulated recipients). This resembles the phenotype of leukemic mice in the spontaneous model of TCL1A-driven T-PLL development (Lckpr-hTCL1Atg; Figure 1F) and implicates TCL1A to propel TCR-activation–induced differentiation.
Fitting these growth kinetics, the onset of T-cell tumors in the TCL1A-transduced conditions was earlier in OVA-stimulated vs unstimulated recipients (6.5-13.5 months vs 7-20 months, respectively) and translated into shorter median OS (295 days vs 400 days, P = .0009; Figure 6D). Diseased mice had leukocytosis, splenomegaly, and lymphadenopathy. The tumors of stimulated mice exhibited the described EM phenotype (Figure 6E) and more frequent CD69+ T cells in the presence of TCL1A (supplemental Figure 9A, right).
To corroborate these findings in another model, we used mice carrying CARs as TCR surrogates with specificity for carcinoembryonic antigen (CARCEA mice).22 To mimic chronic low-input TCR stimulation, we took advantage of CEAtg recipient animals, which provide constant low-level intestinal and pulmonal expression of CEA (Figure 6F). This system allows MHC-independent CAR-mediated tissue-associated recognition of a surface self-antigen. Moreover, autologous repopulation of the host after lymphodepletion better mimics the T-cell homeostatic control enforced by a competitive polyclonal setting. Splenocytes of CARCEA, Lckpr-hTCL1Atg, and CARCEAxLckpr-hTCL1Atg mice (intercrosses described in the supplemental Methods) were transplanted into CEAtg recipients, and PB CD3+ T cells were monitored (Figure 6F). Before the eventual fast incline of only the TCL1A+ clones, there was a protracted phase of smoldering expansions. Importantly, already at early stages, there was a growth advantage of CARCEAxLckpr-hTCL1Atg cells; also over Lckpr-hTCL1Atg T cells (Figure 6G). The CD69- and Ki-67–positive cell fraction was higher among CARCEAxLckpr-hTCL1Atg T cells than among CARCEA T cells (Figure 6G, insets). Late-stage CARCEAxLckpr-hTCL1Atg expansions showed increased spleen volumes (magnetic resonance imaging at 1 year; supplemental Figure 9B) and higher IFNγ plasma levels (supplemental Figure 9C). Upon termination of the experiment at day 621, there were preleukemic signs of B-cell depletion and greater percentages of CD8+ T cells in PB of CARCEAxLckpr-hTCL1Atg transplanted mice (supplemental Figure 9D). This was paralleled by higher densities of CD8+ spleen infiltrates (Figure 6H).
Obviously, the T-cell expansions involved the CAR-antigen deprived splenic and PB milieu, rather than intestinal or pulmonal sites and the latter displayed no autoimmune phenomena, clinically and histologically (not shown). Spleen sections revealed enhanced cytoplasmic pCD3ζ activation (via CAR or TCR) in conditions of TCL1A expression (Figure 6I; supplemental Figure 9E). Quantified pCD3ζ intensities of CARCEAxLckpr-hTCL1Atg cells appeared as the sum of the CAR and TCL1A components and because expression of sCD3 (preserved endogeneous TCR) was similar in all 3 cohorts (Figure 6I), this indicates that TCL1A modulates both, the CAR and the TCR signal.
Together, both in vivo systems of defined TCR stimulation with a proliferative advantage of T-cell expansions in the presence of TCL1A support our in-vitro–derived concept of TCL1A as an enhancer of protumorigenic pulsed or tonic TCR signals.
Activation state and TCL1A-based disease subsets and a treatment rationale
Finally, we assessed the correlation of differentiation phenotypes, activation marker expression, and TCL1A levels with clinical outcome. The rare naïve-T-cell immunophenotype (6 of 61 cases, 10%) was linked to a longer OS than cases with CM and EM-phenotypes (P = .0069; Figure 7A). We observed such a relationship already in an independent cohort by CD45RA immunohistochemistry of BM sections.32 Moreover, expression of at least 2 activation/proliferation markers (31 of 53 cases; 58.0%) was associated with an inferior OS as opposed to cases with a low cellular activation state (20.98 months vs 58.13 months, P = .0012; Figure 7B). In concordance to our previous data from BM specimens,10 high TCL1A protein expression of PB tumor cells correlated with a shorter OS (21.4 months vs 98.9 months, P = .017; Figure 7C).
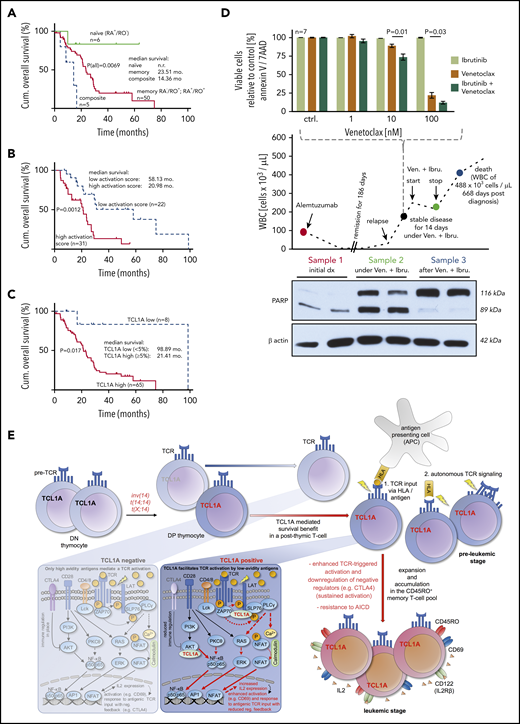
Clinical associations and a model of T-PLL evolution. (A-C) OS from diagnosis (log-rank tests) of uniformly treated T-PLL patients. See supplemental Figure 10 for associations of T-cell differentiation phenotypes with activation scores and with CD95. (A) The rare composite (n = 5) and naïve (n = 6) T-cell phenotypes were associated with a worse and better outcome than the bulk of CD45RO+ T-PLL, respectively. (B) Correlation of higher cellular activation in 53 T-PLL patients with shorter OS. Analyte cutoffs and definition of the activation score are outlined in the legend of Figure 2A. (C) Differential prognosis of T-PLL patients (n = 73) stratified by TCL1A protein expression (percentage of positive cells in PB; flow cytometry). (D) A T-PLL patient in disease progression under cyclophosphamide (previously refractory to alemtuzumab, bendamustine, and fludarabine) was treated with Venetoclax (800 mg/d) and Ibrutinib (420 mg/d). This treatment stabilized PB lymphocyte counts over the entire period of exposure (middle panel). Blood sampling at the indicated (color-coded) time points reveals the cytotoxic effect of this treatment (PARP cleavage, western blots, lower panel) fitting the synergistic in vitro relationship of both substances from samples before this treatment (top). (E) Proposed model of the proleukemogenic cooperation of TCL1A with TCR signaling. TCL1A is normally silenced upon progression of double negative (DN) to double positive (DP) thymocytes. Physiologically (TCL1A negative peripheral T cell, left box), activation via the matured TCR is regulated by coreceptors and only high avidity antigens mediate TCR signals and cell activation. In the T-PLL precursor, genetic aberrations dictate deregulated expression of the antiapoptotic proto-oncogenes TCL1A or MTCP1 (t(X;14)). The resulting survival benefit is supported by the effect of additional genomic alterations (eg, ATM). TCL1A enhances p-kinase responses (underlying physical interactions described in Herling et al10 ) and cellular effector functions such as IL-2 secretion (right box) of the affected T cell and contributes to its resistance to safeguarding cell death (AICD). By enhancing TCR signals, TCL1A enables low-avidity (auto)antigens to trigger a beneficial T-cell activation, in an MHC-dependent context or in autonomous TCR activation. By lowering the TCR-signaling threshold (sensitizer effect), TCL1A propels the transition of naïve T cells into an expanding memory T-cell pool as the origin of final T-PLL outgrowth (see also TCL1A-tg mice). Sustained activation (increased autonomy) is further mediated by impaired control mechanisms (eg, CTLA4 downregulation).
Clinical associations and a model of T-PLL evolution. (A-C) OS from diagnosis (log-rank tests) of uniformly treated T-PLL patients. See supplemental Figure 10 for associations of T-cell differentiation phenotypes with activation scores and with CD95. (A) The rare composite (n = 5) and naïve (n = 6) T-cell phenotypes were associated with a worse and better outcome than the bulk of CD45RO+ T-PLL, respectively. (B) Correlation of higher cellular activation in 53 T-PLL patients with shorter OS. Analyte cutoffs and definition of the activation score are outlined in the legend of Figure 2A. (C) Differential prognosis of T-PLL patients (n = 73) stratified by TCL1A protein expression (percentage of positive cells in PB; flow cytometry). (D) A T-PLL patient in disease progression under cyclophosphamide (previously refractory to alemtuzumab, bendamustine, and fludarabine) was treated with Venetoclax (800 mg/d) and Ibrutinib (420 mg/d). This treatment stabilized PB lymphocyte counts over the entire period of exposure (middle panel). Blood sampling at the indicated (color-coded) time points reveals the cytotoxic effect of this treatment (PARP cleavage, western blots, lower panel) fitting the synergistic in vitro relationship of both substances from samples before this treatment (top). (E) Proposed model of the proleukemogenic cooperation of TCL1A with TCR signaling. TCL1A is normally silenced upon progression of double negative (DN) to double positive (DP) thymocytes. Physiologically (TCL1A negative peripheral T cell, left box), activation via the matured TCR is regulated by coreceptors and only high avidity antigens mediate TCR signals and cell activation. In the T-PLL precursor, genetic aberrations dictate deregulated expression of the antiapoptotic proto-oncogenes TCL1A or MTCP1 (t(X;14)). The resulting survival benefit is supported by the effect of additional genomic alterations (eg, ATM). TCL1A enhances p-kinase responses (underlying physical interactions described in Herling et al10 ) and cellular effector functions such as IL-2 secretion (right box) of the affected T cell and contributes to its resistance to safeguarding cell death (AICD). By enhancing TCR signals, TCL1A enables low-avidity (auto)antigens to trigger a beneficial T-cell activation, in an MHC-dependent context or in autonomous TCR activation. By lowering the TCR-signaling threshold (sensitizer effect), TCL1A propels the transition of naïve T cells into an expanding memory T-cell pool as the origin of final T-PLL outgrowth (see also TCL1A-tg mice). Sustained activation (increased autonomy) is further mediated by impaired control mechanisms (eg, CTLA4 downregulation).
Given our observations of active TCR signaling (Figure 3) in T-PLL cells, but their inertia to CD95L-mediated cell death while maintaining susceptibility to mitochondrial apoptosis (Figure 4C-D), we tested a strategy of combined application of Ibrutinib (targeting ITK) with the BCL2 inhibitor Venetoclax. A 78-year-old T-PLL patient who was refractory to multiple lines of therapy at relapse and presented with exponentially rising lymphocytosis was given Venetoclax and Ibrutinib on the basis of in vitro synergisms of both components (Figure 7D). The treatment immediately stabilized and later reduced leukocyte counts. While under this treatment, cytotoxic effects were demonstrated by marked PARP cleavage in PB tumor cell lysates. In the absence of relevant side effects, the patient opted for cessation of therapy, upon which lymphocytes rapidly rose again and levels of processed PARP dropped below detection.
Discussion
The functional features and signal dependencies of the T-PLL cell need to be better defined to facilitate the development of more effective treatments for this poor prognostic disease.33 Using a refined set of markers and methods in a cohort that is sufficiently large to resolve for variations, we establish, in this study, a high similarity of T-PLL cells to memory T cells in >83% of cases, specifically to CD45RO+, CCR7+ CM T-lymphocytes. Previous descriptions also suggested a memory-stage of maturation in 40% to 60% of T-PLL,3,8,10,32,34 but were solely on the basis of CD45-isoform expression. We also reveal a continuum of memory stages with often nonconventional profiles of postnaïve differentiation. In conjunction with an activated phenotype and retained TCR/coreceptor expression of the T-PLL cell our data implicate continued TCR-mediated activation and differentiation during leukemogenesis. We also suggest that the observed consistent loss of negative-regulatory receptors (eg, CTLA4) in T-PLL cells (Figure 2C-D), contributes to the maintenance of an elevated activation state. The high expression of CD7 in 94% (85 of 90) of our leukemic samples would argue against exhaustion.35,36 These features were chronologically recapitulated in TCL1A-driven murine T-PLL (Figure 1F). An expanding memory cell pool was also described for mice with overexpression of the TCL1 family member MTCP1.37
These data also suggest (auto)antigen experience or at least MHC-driven activation and differentiation of the TCL1A-affected precursor during clonal outgrowth. Chronic antigen stimulation is already implicated in other T-cell malignancies, for example, by autoimmune triggers in the CD8+ T-LGL or by (bacterial) dermatitis in the CD4+ mycosis fungoides and Sézary syndrome.38,39 These entities also show a biased TCRβ gene usage.40-42 The stochastically rather diverse TCRβ repertoire in our cohort of T-PLL (Figure 1G) does not exclude an antigen-dependent pathogenesis. In fact, it remains to be determined, if the slightly overrepresented TCRβs at frequencies of 5% to 8% constitute receptors which all facilitate more permissive signaling, or which share epitopes as fully processed molecules. Moreover, even if considering T-PLL of random clonotypic origin, its TCL1A-driven development could involve enhancement of any TCR-mediated signal (eg, variety of antigens or sole self-MHCs). Of note, in our TCR-centric concept of T-cell lymphomas, there are also entities in which the precursor has lost TCR expression, and survival input is provided by oncogenes acting as TCR signaling mimics or stand-ins.39,43
Importantly, in light of their high-level activation, T-PLL cells do not behave like physiologic CM T cells, because they show resistance to apoptosis upon repetitive stimulation. Healthy memory T cells increase CD95 expression to facilitate such regulatory responses. In contrast, CD95 is downregulated or dysfunctional in T-PLL (Figure 4). Particularly the long-lived CM T cells have been shown to harbor stem-cell–like properties with self-renewal capacities.44,45 Therefore, acquisition of proliferative progenitor-like competence and loss of the capability to respond to extrinsic apoptotic signals might be an oncogenic mechanism of persistence of T-PLL cells.
At the molecular level, we show TCL1A to enhance intracellular signaling and effector responses, particularly following submaximal TCR stimulation. This effect was more pronounced in the context of a CD3 (TCR) signal, as supported by a more obvious modulation of pERK1/2, than of CD28-coreceptor restricted46 AKT activation, which reconciles data from various model systems.10,47,48 It further argues that inappropriate expression of TCL1A in the affected peripheral T cells enables sustenance of an apoptosis-refractory memory fraction via amplifications of low-level TCR input (sensitizer principle). Fittingly, T-PLL cells show reduced TCR-activation thresholds. The previously unrecognized Th1 program elicited by TCR stimulation of T-PLL cells (Figure 3C) is in agreement with reported TCL1A-mediated augmentations of IFN-γ production in primed murine TCL1A-tg Th1 cells.47 Confirming the oncogenic relevance of a cooperation of TCR with TCL1A signaling, our in vivo models of modulated TCRs (including CARs as powerful surrogates) and TCL1A showed an accelerated outgrowth of T cells upon repetitive receptor stimulation, when TCL1A was present.
Our data suggest a concept of T-PLL as an (auto)antigen/(self)MHC-TCR–promoted disease with TCL1A acting as a TCR-signaling enhancer (Figure 7E). It entails the accumulation of self-sustaining memory-type cells that use low-level TCR activation rendering this sufficient to acquire competitive advantages toward homeostatic escape and full transformation. Initiated as a TCL1A-affected thymic emigrant rather than being subject of a primary maturation block at the memory-stage, the CM-like phenotype of T-PLL likely reflects the terminal line of differentiation at which additional oncogenic forces come to carry to completely perturb homeostatic control. Future work needs to integrate this T-cell-development–based model with the defined roles of aberrant pathways instructed by the genomic lesions in ATM or JAK/STAT signaling.11,49 Up to this point, treatment strategies that jointly target TCR cascades and intrinsic apoptotic resistance (Figure 7D) have promising potential.11,50,51
GEP assays were performed on Illumina HumanHT 12 v4 BeadChip arrays according to the manufacturer's instructions. GEP data have been submitted to the GEO database under accession number GSE107397 and GSE-uploading. The published dataset GSE58445 was used for comparative analysis.
The online version of this article contains a data supplement.
The publication costs of this article were defrayed in part by page charge payment. Therefore, and solely to indicate this fact, this article is hereby marked “advertisement” in accordance with 18 USC section 1734.
Acknowledgments
The authors thank the Regional Computing Center of the University of Cologne for providing computing time on the German Research Foundation (DFG)–funded High-Performance Computing system CHEOPS, as well as support. The authors thank C. Haferlach and the MLL for cytogenetic data. The authors gratefully acknowledge all contributing centers that enrolled patients into the trials and registry of the GCLLSG, the GCLLSG staff, and the patients with their families for their invaluable contributions. The authors thank Principia Biopharma (San Francisco, CA) for provision of the ITK inhibitor PRN-694.
M. Herling (HE3553/4-2), I.R. (RO3500/4-2), H.A., and S.N. were funded by DFG as part of the collaborative research group on mature T-cell lymphomas, CONTROL-T (FOR1961). This work was also supported by the EU Transcan-2 consortium ERANET-PLL and by the ERAPerMed consortium JAKSTAT-TARGET. Further support was provided by the Köln Fortune Program (A.S.) and Fritz Thyssen Foundation (10.15.2.034MN; M. Herling and A.S.). A.S. is funded by a scholarship through the José Carreras Leukemia Foundation (DJCLS 03 F/2016). Sequencing analyses were supported by a DFG “Sequencing Costs in Projects” Grant to A.S. and M.H. (SCHR1668/1-1). T.A. was funded by the Academy of Finland (grants 292611, 279163, 295504, 310507, and 326238), European Union's Horizon 2020 Research and Innovation Program (ERA PerMed JAKSTAT-TARGET), and the Cancer Society of Finland.
Authorship
Contribution: M. Herling, S.N., H.A., S.O., A.S., and K.W. were responsible for design and experimental data analysis; S.O., A.S., K.W., D.J., G.C., J.v.J., M.C., P.M., A.K.A., L.W., T.B., T.A.M., P.W., A.B., T.N., S.P., L.V., M.T., J.M., N.R., H.J.M.G., G.R., J.A., M.K., T.P., G.H., M.L.H., H.S., D.M., M.v.B.-B., S.H., R.M., and M.B. performed experiments; G.C., I.R., A.I., H.H.D., M.K., T.A., and J.I. conducted biostatistical analyses; M. Herling, G.H., S.S., and J.D. were responsible for patient samples, immunophenotypes, and karyotyping; M. Herling, M. Hallek, and N.P. collected clinical data; and S.O., A.S., K.W., T.A.M., H.A., and M. Herling prepared the manuscript.
Conflict-of-interest disclosure: The authors declare no competing financial interests.
Correspondence: Marco Herling, Laboratory of Lymphocyte Signaling and Oncoproteome, Department I of Internal Medicine, Center for Integrated Oncology Aachen-Bonn-Cologne-Duesseldorf, CECAD Center of Excellence on Cellular Stress Responses in Aging-Associated Diseases, Center for Molecular Medicine Cologne, Center for Molecular Medicine Cologne University of Cologne, Weyertal 115c, Cologne, 50931 Germany; e-mail: marco.herling@uk-koeln.de.

This feature is available to Subscribers Only
Sign In or Create an Account Close Modal