

Key Points
Analysis of B lineage cells in tissues of healthy organ donors reveals tissue-specific differences and discordance between blood and tissues.
New memory B-cell subsets were discovered, including 1 subset specific to the gut that has unique surface markers and gene expression.

Abstract
Although human B cells have been extensively studied, most reports have used peripheral blood as a source. Here, we used a unique tissue resource derived from healthy organ donors to deeply characterize human B-cell compartments across multiple tissues and donors. These datasets revealed that B cells in the blood are not in homeostasis with compartments in other tissues. We found striking donor-to-donor variability in the frequencies and isotype of CD27+ memory B cells (MBCs). A comprehensive antibody-based screen revealed markers of MBC and allowed identification of novel MBC subsets with distinct functions defined according to surface expression of CD69 and CD45RB. We defined a tissue-resident MBC phenotype that was predominant in the gut but absent in blood. RNA-sequencing of MBC subsets from multiple tissues revealed a tissue-resident MBC gene signature as well as gut- and spleen-specific signatures. Overall, these studies provide novel insights into the nature and function of human B-cell compartments across multiple tissues.
Introduction
Few human B-cell studies have sampled multiple tissues within the same individual, due to inaccessibility of diverse tissues.1-5 Thus, how peripheral blood lymphocytes correlate with secondary lymphoid tissues as well as at mucosal sites is poorly defined for B lineages. Although memory B cells (MBCs) have been characterized in human peripheral blood lymphocytes, and to a significant degree in spleen and tonsil, their characteristics in other secondary lymphoid tissues as well as in gut tissues is less understood. Tissue-resident memory has been identified for T cells6 but is not well defined for human B cells. Recently, antigen-specific B-resident memory cells in murine lung were identified, suggesting similar populations in human mucosal sites.7 Zhao et al4 also recently defined both memory and marginal zone–like B cells in human gut-associated lymphoid tissue. Magri et al8 connected gut immunoglobulin M (IgM) production to plasma cells that are derived from gut MBCs. A more comprehensive understanding of how such B-cell lineages in tissues relate to blood is needed, and it would be helpful for diagnostics and immune-monitoring.
The current study addresses this need by using a unique resource: multiple tissues harvested from individual cadaveric organ donors.6,9,10 These individuals are considered “healthy” in that they have no specific medical condition that precludes organ donation.10 This resource has been used to provide extensive characterization of T-cell, innate lymphoid, and dendritic cell compartments in humans across multiple tissues.6,9,11 Here, we extended this body of work by characterizing B lineage cells over multiple tissues in the same donors. Combining phenotypic and functional analysis allowed us to identify novel MBC subsets, including a tissue-resident subset in the gut that had distinctive surface markers and transcriptome.
Methods
Acquisition of tissues from human organ donors
Human tissues (supplemental Methods, available on the Blood Web site) were obtained as recently described.9
Flow cytometric analysis of cryopreserved samples
Cells were thawed and stained for 40 minutes in 200 µL Hanks Balanced Salt Solution/2 mM EDTA and 3% fetal calf serum with antibodies (supplemental Tables 2 and 3). After fixable viability staining and washing, cells were fixed in 1% paraformaldehyde for 30 minutes before analysis on a BD LSRII (BD Biosciences). Data were analyzed in FlowJo version 9 or 10 (FlowJo LLC). Details are given in the supplemental Methods.
Functional analysis of CD45RB/CD69 subsets in spleen
Cells were thawed and sorted into CD45RB/CD69 subsets of naive B cells (NBCs) and MBCs by using fluorescence-activated cell sorting. Cells were cultured in the presence of 1 µg/mL ODN2006 for 5 days at 37°C and 5% carbon dioxide, and then analyzed by flow cytometry or Enzyme-Linked ImmunoSpot assay. Details are given in the supplemental Methods.
RNA-sequencing
CD45RB/CD69 subsets of NBCs and MBCs of spleen or intestine were sorted. RNA was isolated by using RNeasy Kits (Qiagen). Libraries were prepared by using Illumina TruSeq Total RNA or SMART-Seq v4 Ultra Low Input RNA kits for sequencing and the Illumina Nextera XT DNA Library preparation kit, following the manufacturer’s protocols. Cluster generation and 75 bp paired-read dual-indexed sequencing was performed on Illumina NextSeq 500 or HiSeq 2500 sequencers. Detailed procedures are given in the supplemental Methods.
Gene set enrichment analysis
Gene set enrichment analysis (GSEA) was performed with the f-GSEA R package.12 For each comparison, genes were ranked with expression fold-change between 2 groups. The TRM gene signatures of CD8+ and CD4+ T-cell lineages in lung tissue were obtained from Kumar et al.6 GSEA for plasmablast and plasma cell gene signatures and the statistical analysis are detailed in the supplemental Methods.
Statistical analysis
GraphPad Prism versions 7 and 8 software was used for statistical analysis. For group comparisons, paired or unpaired two-tailed Student t tests with Welch’s correction and unpaired one-way analysis of variance with Tukey’s correction were used as described in the figure legends. P values are shown as *P < .05, **P < .005, ***P < .0005, and ****P ≤ .0001, with ns = not significant. Error bars show mean ± SD. Statistical testing of functional data is described in the supplemental Methods.
Results
Multicolor flow cytometric analysis of classical B-cell compartments
B-cell types include NBCs, antigen-experienced B cells that are CD27+ (commonly termed MBCs); immature B cells expressing CD10; and “atypical,” isotype-switched MBCs that lack CD27 expression. CD27hiCD38brightCD138+ antibody-forming cells (AFCs) are found in peripheral blood lymphocytes and lymphoid tissues.1-3 Tonsils, Peyer’s patches, and, to a lesser extent, spleen also contain germinal center B cells (GCBC) that highly express CD27 and CD38. To begin to assess these B-cell types across multiple tissues in a series of donors (supplemental Table 1), we developed a standardized multicolor panel (supplemental Table 2; “Stain 1”) of established surface markers (supplemental Table 3) for flow cytometric analysis. Figure 1A and supplemental Figure 1 show the gating strategies on representative data, identifying key B lymphocyte populations.

Multicolor flow analysis of B-cell compartments in spleen, blood, BM, and gut. Splenocytes, blood, BM, or intestinal tissue cells (gut) were stained with flow panels 1 or 2 (supplemental Tables 2 and 3), respectively. (A) Gating strategy for 10-color panel “Stain 1” flow cytometric analysis of donor D215 splenocytes to identify CD27– (referred to as “naive B cells”) and CD27+ (referred to as “MBC,” acknowledging the generally accepted but imprecise convention43,44 ) and their isotype distribution. Transitional B cells were identified as CD10hi CD38hi B cells. AFCs of the plasmablast/plasma cell lineage were identified in a broader forward scatter/side scatter (FSC/SSC) gate as CD38brightCD138+ in the right panel. The latter expressed CD27 and displayed a range of CD19 expression, with most cells being positive, consistent with a plasmablast identity rather than a fully differentiated plasma cell45 (bottom right panel). MBCs showed clear surface IgM+ and IgG+ populations, which were less clear among these AFCs, likely due to reduced levels of surface immunoglobulin expression. Arrows indicate subsequent gating of populations, and numbers next to outlined areas indicate percentages of parent gate cells in gated populations. Key gated populations are labeled. (B) Distribution of B- cell compartments across human tissues (for gut data, after careful removal of mucosal epithelia and Peyer’s patches individually isolated cells from jejunum, ileum, and colon were analyzed and compiled, as these showed no significant differences among each other). The graphs show the percentages for CD27–, CD27+, and transitional B cells of CD19+ live singlet lymphocytes (top panel), the percentages for total CD19+ lymphocytes and AFCs as percentage of all live cells cross indicated tissues (middle panel) and GC cells, which were gated as CD38int or CD38hi cells of all live CD19+ IgD– CD10+ cells across tissues (for gating, see supplemental Figure 1). The blue numbers in the graphs represent the mean of the depicted population, also shown as purple lines in the graph. (C) Surface immunoglobulin isotype distribution of human organ donor samples. Upper panel: percentage of switched (IgG+; blue) and unswitched (IgM+ IgD+; red) CD27– and CD27+ cells of CD19+ singlets with mean and standard deviation. Lower panel: graphing of data in upper panel with lines linking data from same samples. (D) “Inferred” IgA/IgE frequencies across tissues of CD27+ cells of CD19+ singlets with mean and standard deviation plotted as difference from 100% using the measured IgG and IgM/IgD frequencies depicted in panel C. (E) Correlation analysis between blood and spleen of CD27+, AFCs, and IgM+ IgD+ B-cell compartments within the same donors. P values were calculated as paired two-tailed Student t test (B-C) or linear regression (E).
Multicolor flow analysis of B-cell compartments in spleen, blood, BM, and gut. Splenocytes, blood, BM, or intestinal tissue cells (gut) were stained with flow panels 1 or 2 (supplemental Tables 2 and 3), respectively. (A) Gating strategy for 10-color panel “Stain 1” flow cytometric analysis of donor D215 splenocytes to identify CD27– (referred to as “naive B cells”) and CD27+ (referred to as “MBC,” acknowledging the generally accepted but imprecise convention43,44 ) and their isotype distribution. Transitional B cells were identified as CD10hi CD38hi B cells. AFCs of the plasmablast/plasma cell lineage were identified in a broader forward scatter/side scatter (FSC/SSC) gate as CD38brightCD138+ in the right panel. The latter expressed CD27 and displayed a range of CD19 expression, with most cells being positive, consistent with a plasmablast identity rather than a fully differentiated plasma cell45 (bottom right panel). MBCs showed clear surface IgM+ and IgG+ populations, which were less clear among these AFCs, likely due to reduced levels of surface immunoglobulin expression. Arrows indicate subsequent gating of populations, and numbers next to outlined areas indicate percentages of parent gate cells in gated populations. Key gated populations are labeled. (B) Distribution of B- cell compartments across human tissues (for gut data, after careful removal of mucosal epithelia and Peyer’s patches individually isolated cells from jejunum, ileum, and colon were analyzed and compiled, as these showed no significant differences among each other). The graphs show the percentages for CD27–, CD27+, and transitional B cells of CD19+ live singlet lymphocytes (top panel), the percentages for total CD19+ lymphocytes and AFCs as percentage of all live cells cross indicated tissues (middle panel) and GC cells, which were gated as CD38int or CD38hi cells of all live CD19+ IgD– CD10+ cells across tissues (for gating, see supplemental Figure 1). The blue numbers in the graphs represent the mean of the depicted population, also shown as purple lines in the graph. (C) Surface immunoglobulin isotype distribution of human organ donor samples. Upper panel: percentage of switched (IgG+; blue) and unswitched (IgM+ IgD+; red) CD27– and CD27+ cells of CD19+ singlets with mean and standard deviation. Lower panel: graphing of data in upper panel with lines linking data from same samples. (D) “Inferred” IgA/IgE frequencies across tissues of CD27+ cells of CD19+ singlets with mean and standard deviation plotted as difference from 100% using the measured IgG and IgM/IgD frequencies depicted in panel C. (E) Correlation analysis between blood and spleen of CD27+, AFCs, and IgM+ IgD+ B-cell compartments within the same donors. P values were calculated as paired two-tailed Student t test (B-C) or linear regression (E).
Data from multiple donors for spleen, blood, bone marrow (BM), and gut are presented in Figure 1B. There was a substantially higher average proportion of CD27+ cells in spleen vs blood (70% vs 20%), indicating that B-cell populations are differentially recirculating between blood and spleen and/or that blood reflects contributions from other tissues that we have not sampled. This is in agreement with other research.2,13,14 CD27+ B cells in BM (46%) were more frequent than in blood (20%) but less than in spleen (70%), whereas gut exhibited the highest frequency among the tissues studied (86.4%) (Table 1). The frequency of transitional cells, in contrast, was similar between blood and spleen, consistent with blood being a conduit to spleen for these cells. There was a surprisingly wide range of CD19+ cells in all 4 tissues. Similarly, splenic AFC frequencies were variable, with an average frequency of 1% and a large number of donors with much lower frequencies and a few donors having 3% to 4% AFCs. Gut AFC frequencies were generally higher than in other tissues and were also variable. BM AFC frequencies had a bimodal distribution, with many donors having very few and another group with ∼1% AFCs. In contrast, blood AFC frequencies were much lower, with a tighter distribution.
Cell population frequencies (%) in human tissues
| Tissue | CD27– | CD27+ | Transitional | CD19+ lymphocytes | Plasmablasts | GC | Total CD19+ | |
|---|---|---|---|---|---|---|---|---|
| CD38 int | CD38 hi | |||||||
| Spleen | 29.61 | 70.39 | 2.24 | 62.08 | 1.00 | 0.81 | 0.10 | 51.93 |
| 14.19 | 14.19 | 2.06 | 11.02 | 1.06 | 1.90 | 0.11 | 13.59 | |
| 10.4-74.8 | 25.2-89.6 | 0.3-10.7 | 39.8-78.6 | 0.1-4.0 | 0.04-10.9 | 0.003-0.4 | 14.4-74.4 | |
| Blood | 79.63 | 20.37 | 3.62 | 24.85 | 0.24 | 0.69 | 0.13 | 7.39 |
| 13.07 | 13.07 | 1.87 | 18.12 | 0.25 | 0.63 | 0.18 | 6.15 | |
| 52.2-97.3 | 2.7-47.8 | 0.8-5.9 | 2.6-72.9 | 0.02-0.9 | 0.09-2.4 | 0-0.6 | 1.6-19.2 | |
| BM | 54.00 | 46.00 | 4.00 | 20.74 | 0.51 | 0.42 | 0.12 | 10.69 |
| 20.79 | 20.79 | 2.83 | 16.40 | 0.50 | 0.42 | 0.15 | 6.87 | |
| 12.8-93.5 | 6.5-87.2 | 0.5-9.2 | 4.0-58.7 | 0.03-1.4 | 0.04-1.7 | 0-0.5 | 2.8-27.7 | |
| Gut | 13.56 | 86.44 | 0.80 | 28.17 | 1.92 | 0.29 | 0.12 | 22.74 |
| 11.85 | 11.85 | 0.73 | 19.80 | 1.30 | 0.22 | 0.13 | 16.00 | |
| 3.6-50.2 | 49.8-96.4 | 0.05-2.0 | 3.2-70.1 | 0.03-3.5 | 0.04-0.8 | 0-0.4 | 1.6-53.8 | |
For each tissue, from top to bottom, shown are the mean, standard deviation, and range of the percentages of listed populations among parent gates. For CD19+ cells, the parent gates are lymphocytes or total events, shown separately. For CD27–, CD27+, and transitional cells, the parent gate is CD19+ lymphocytes. Plasmablasts are gated from all live single cells and GC cells from all live single CD19+ IgD– CD10+ cells.
Among live CD19+, IgD– singlets, we found CD10+ GCBC with high and intermediate expression of CD38 (gating strategy modified from Milpied et al15 ) (supplemental Figure 1), with the latter being most prominent in every tissue. The percentage of CD38int GCBC was significantly higher than CD38hi GC cells in spleen, blood, and BM but not in gut.
“Atypical” CD27–IgG+ MBC, often characterized as CD21lo/neg,16-20 were assessed in spleen, blood, and gut as CD27– IgG+, while characterizing both CD21+ and CD21– cells (supplemental Figure 2). We found low and variable frequencies of both types of cell, with CD21– and CD21+ having similar prevalence, thus revealing a parallel CD21+ yet CD27– memory-like cell that is commonly seen in healthy adults. Notably, ∼25% of gut CD27– cells were IgA+, with only ∼50% IgM+/IgD+ (supplemental Figure 3), similar to observations in gut-associated lymphoid tissue.4
There were no major differences among spleen, blood, BM, and gut (Figure 1C) in the fraction of IgG+ CD27+ cells. In each case, there were fewer IgG+ than IgM+/IgD+ cells. Also, among CD27+ cells in the gut, IgA+ cells accounted for ∼55% of MBC (Figure 1D); direct assessments are presented in supplemental Figure 3.
As highlighted in plots that connect individual donors (Figure 1C), among splenic CD27+ cells, there was striking interindividual variability in the IgM+/IgD+ to IgG+ ratio, such that ∼25% of donors had a higher frequency of IgG+ than IgM+/IgD+ cells, even though on average this was not the case. This scenario was seen to a lesser extent in blood and gut samples. Thus, within single individuals, B-cell isotype composition in blood is not a faithful indicator of composition in spleen.
There was no significant correlation between the total frequency of CD27+ cells among CD19+ in the spleen and blood (P = .25) (Figure 1E), whereas a similar correlation analysis for AFCs almost reached statistical significance (P = .06). Furthermore, frequencies of IgM+/IgD+ cells among CD27+ B cells did not significantly correlate between blood and spleen (P = .25). Hence, for these key B lineage subpopulations, blood is not a good predictor of spleen.
Age, sex, race, and body mass index
CD27+ cells in spleen and blood did not vary as a function of age in our cohort (Figure 2A). However, there was a slightly but significantly reduced frequency of CD27+ cells in gut in the youngest cohort compared with the older ones. All of the donors were aged >18 years (most were aged >27 years), and thus we would not have detected an age-dependent ramp up of this frequency from childhood to young adulthood, as has been seen in blood samples derived from younger cohorts.21-24 AFC frequencies were also not correlated with age (not shown). Similarly, sex did not affect CD27+ cell frequencies in any of these sites (Figure 2B). Of note, we found a significant increase of CD27+ cells in the blood of white donors compared with the blood of Hispanic donors (Figure 2C). Finally, there was no significant correlation between body mass index and the ratio of MBCs to NBCs in the spleen (Figure 2D).
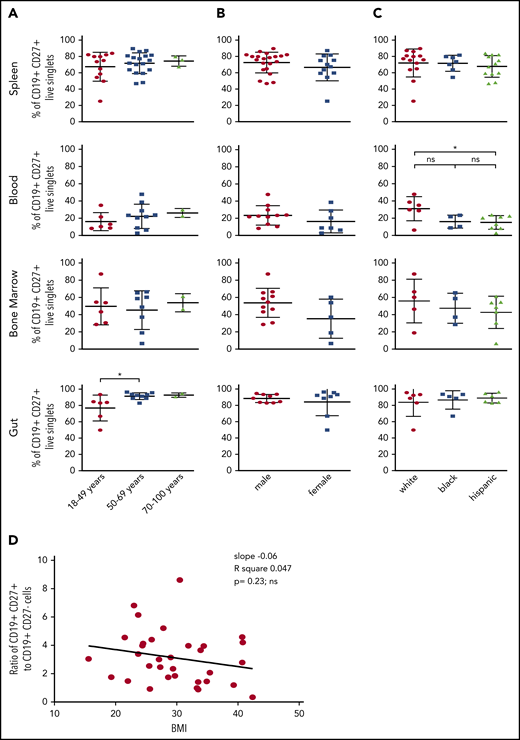
Effect of age, sex, race, and body mass index (BMI) on distribution of MBCs. Splenocytes, blood, BM, or intestinal tissue cells were stained as in Figure 1. (A) The frequencies of CD19+ CD27+ MBCs in these samples were correlated with age. Using the unpaired one-way analysis of variance with Tukey’s correction or the unpaired two-tailed Student t test analysis with Welch’s correction, no significant difference was found for spleen (P = .65), blood (P = .53), or BM (P = .86). For donors aged 18 to 49 years, there was a significant difference (*P = .036) in the gut compared with older donors. (B) Correlation of frequencies of CD19+ CD27+ MBCs with sex. (C) Correlation of frequencies of CD19+ CD27+ MBCs with race. The blood of white donors had significantly more MBCs than the blood of Hispanic donors (*P = .0391). (D) The resulting ratio of CD19+ CD27+ (memory) to CD19+ CD27– (naive) B cells in spleen was further correlated with the BMI of the donors analyzed. Significance was tested by linear regression (slope, −0.06; R2 = 0.047;P = .23, ns).
Effect of age, sex, race, and body mass index (BMI) on distribution of MBCs. Splenocytes, blood, BM, or intestinal tissue cells were stained as in Figure 1. (A) The frequencies of CD19+ CD27+ MBCs in these samples were correlated with age. Using the unpaired one-way analysis of variance with Tukey’s correction or the unpaired two-tailed Student t test analysis with Welch’s correction, no significant difference was found for spleen (P = .65), blood (P = .53), or BM (P = .86). For donors aged 18 to 49 years, there was a significant difference (*P = .036) in the gut compared with older donors. (B) Correlation of frequencies of CD19+ CD27+ MBCs with sex. (C) Correlation of frequencies of CD19+ CD27+ MBCs with race. The blood of white donors had significantly more MBCs than the blood of Hispanic donors (*P = .0391). (D) The resulting ratio of CD19+ CD27+ (memory) to CD19+ CD27– (naive) B cells in spleen was further correlated with the BMI of the donors analyzed. Significance was tested by linear regression (slope, −0.06; R2 = 0.047;P = .23, ns).
Unbiased analysis of flow cytometric data
Data analysis using a targeted gating approach, with each donor representing a data point, is useful for linking to existing literature and determining variation among individuals; however, it is not ideal for extracting key differences among tissues that are common among multiple donors. We therefore performed unbiased analysis using computational data reduction and visualization tools. We concatenated data from our standard 10-color flow cytometric analysis (supplemental Table 2; “Stain 1”) from multiple donors from spleen (n = 11), blood (n = 14), and BM (n = 14); viSNE plots (Figure 3A) of these data revealed both expected and unexpected tissue differences, which highlight the unique nature of the B-cell compartments in each tissue. As examples, by applying “manual gating” to the plots (based on locations of coexpression of markers known to identify specific cell types), it is apparent that BM contains a large population of antibody-secreting cells, whereas MBCs are enriched in spleen (although observed in other tissues). This is best appreciated by comparing the dot density of the populations identified by manual gating vs their appearance in the individual tissue and merged plots. The expression of the individual surface markers used to derive these gatings, as a function of the mapping space, is shown in Figure 3B.
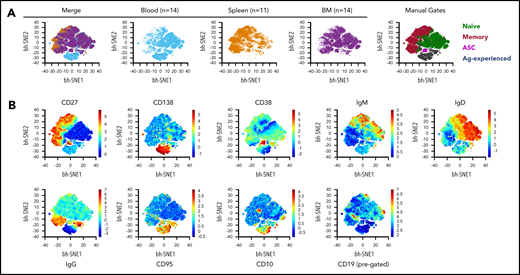
Detection of morphologic differences within B-cell compartments across different tissues using viSNE analysis. (A) viSNE analysis was performed on total live, single B lineage cells by using default parameters in Amir et al.46 θ = 0.5, perplexity = 30; iterations = 1000. B cells from each donor were downsampled to 2000 events to assure equal weighting in the subsequent analysis. Concatenated fetal calf serum files from blood (n = 14 donors) and BM (n = 14) tissues were further downsampled to 22 000 cells to be equivalent to SP (n = 11). All markers from “Stain 1” (supplemental Table 2) except for the viability dye were included in viSNE clustering. The merged file is depicted at far left, followed by the individual tissues. Manual gate overlays are shown at the far right. Population definitions for manual gating are: naive B cell, CD19+ CD27– CD95– CD38–; memory B cell, CD19+ CD27+ CD38–; antibody- secreting cells (ASC), CD38hi CD138+ CD27+; Ag-experienced, CD19+ CD27– CD95+ CD38–. (B) Heatmap profile of the individual markers as expressed in the concatenation of all 39 samples.
Detection of morphologic differences within B-cell compartments across different tissues using viSNE analysis. (A) viSNE analysis was performed on total live, single B lineage cells by using default parameters in Amir et al.46 θ = 0.5, perplexity = 30; iterations = 1000. B cells from each donor were downsampled to 2000 events to assure equal weighting in the subsequent analysis. Concatenated fetal calf serum files from blood (n = 14 donors) and BM (n = 14) tissues were further downsampled to 22 000 cells to be equivalent to SP (n = 11). All markers from “Stain 1” (supplemental Table 2) except for the viability dye were included in viSNE clustering. The merged file is depicted at far left, followed by the individual tissues. Manual gate overlays are shown at the far right. Population definitions for manual gating are: naive B cell, CD19+ CD27– CD95– CD38–; memory B cell, CD19+ CD27+ CD38–; antibody- secreting cells (ASC), CD38hi CD138+ CD27+; Ag-experienced, CD19+ CD27– CD95+ CD38–. (B) Heatmap profile of the individual markers as expressed in the concatenation of all 39 samples.
These conclusions based on concatenated data from multiple tissues and donors are in agreement with those drawn from more traditional analyses. Furthermore, computational analysis identified a previously unseen population of CD138+/CD27lo cells that are mainly found in blood but not BM or spleen. This population is predominantly IgGneg and CD95hi, but as it mostly lacks CD27 and CD38, it does not represent a classic AFC lineage (Figure 3A). Instead they may represent a subset of Ag-experienced or memory-like cells. The identity of these cells will be probed in future work. Overall, unbiased analysis by combining equally weighted populations over numerous donors reveals graphically that among blood, BM, and spleen, none of these tissues is particularly representative of the others; we again caution against use of blood as a proxy for events in secondary lymphoid tissues.
CD45RB and CD69 define 4 novel subsets among MBCs
To investigate potential additional heterogeneity among MBCs, we focused on the expression of CD45RB and CD69, two markers that we had previously identified using the LegendScreen assay as being bimodally expressed on CD27+ cells and with little expression on CD27– cells. The CD45RB antibody recognizes a glyco-epitope on CD45 (and not a splice variant),25 and CD69 is an early activation Ag that is also associated with tissue residence in T cells.26 CD45RB was previously found to be expressed on most blood MBCs and on CD38+ CD27+ presumptive GCBC in tonsils that, according to histology, were actually residing outside the GC.27 However, previous research did not explore spleen or other mucosal tissues, nor did it comprehensively look at multiple individuals. Jackson et al28 had reported that CD45RB+ cells had a higher mean fluorescence intensity for CD69 staining but did not show cytometry plots. CD45RB and CD69 flow cytometric analysis of splenic B lymphocytes of several donors (Figure 4A) revealed the existence of 4 well-delineated subsets, predominantly on CD27+ B cells. Although 15% to 25% of CD27+ B cells lacked expression of both CD45RB and CD69, the frequencies of subsets expressing one or both markers were variable from donor to donor (Figure 4A-B). On average, splenic CD27+ MBCs that express CD45RB+ CD69+ double-positive (DP) cells were the dominant population. Cells expressing CD45RB with or without CD69 generally comprised 50% to 70% of total CD27+ cells. The fraction of these that expressed CD69 was particularly variable from individual to individual.
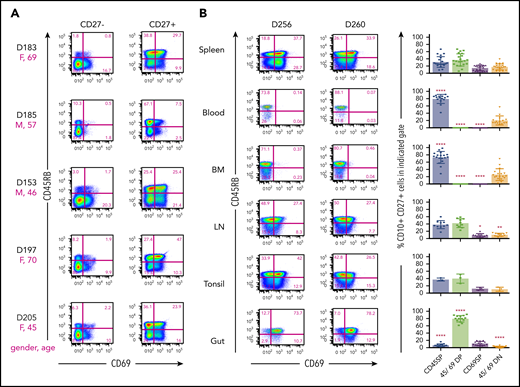
Combination of surface markers CD45RB and CD69 defines new MBC subsets in tissues. Splenocytes were stained for flow cytometric analysis with “Stain 2” (supplemental Table 2). (A) Distribution of CD45RB and CD69 of CD19+ CD27– and CD19+ CD27+ B cells of depicted donor spleens. The magenta letters and numbers show the sex (F = female; M = male) and the age (in years) of the donor. Numbers next to outlined areas indicate percentage of cells in gated populations. The indicated staining results in up to 4 different subsets, CD45RB SP, CD45/CD69 DP, CD69 SP, and CD45/CD69 DN. (B, left panel) CD45RB/CD69 distribution of human CD19+ CD27+ singlets within spleen, blood, BM, lymph nodes (LN), tonsil, or intestinal tissue (Gut) of indicated donors by utilizing “Stain 2” and “Stain 3” (supplemental Table 2). (B, right panel) shows the summary of CD45RB/CD69 distribution of CD19+ CD27+ MBCs within 21 spleen, 15 blood, 18 BM, 10 LN, 3 tonsil, and 14 gut samples. Asterisks indicate significant differences in CD45RB/CD69 subset distribution of indicated tissues compared with spleen using the unpaired two-tailed Student t test with Welch’s correction.
Combination of surface markers CD45RB and CD69 defines new MBC subsets in tissues. Splenocytes were stained for flow cytometric analysis with “Stain 2” (supplemental Table 2). (A) Distribution of CD45RB and CD69 of CD19+ CD27– and CD19+ CD27+ B cells of depicted donor spleens. The magenta letters and numbers show the sex (F = female; M = male) and the age (in years) of the donor. Numbers next to outlined areas indicate percentage of cells in gated populations. The indicated staining results in up to 4 different subsets, CD45RB SP, CD45/CD69 DP, CD69 SP, and CD45/CD69 DN. (B, left panel) CD45RB/CD69 distribution of human CD19+ CD27+ singlets within spleen, blood, BM, lymph nodes (LN), tonsil, or intestinal tissue (Gut) of indicated donors by utilizing “Stain 2” and “Stain 3” (supplemental Table 2). (B, right panel) shows the summary of CD45RB/CD69 distribution of CD19+ CD27+ MBCs within 21 spleen, 15 blood, 18 BM, 10 LN, 3 tonsil, and 14 gut samples. Asterisks indicate significant differences in CD45RB/CD69 subset distribution of indicated tissues compared with spleen using the unpaired two-tailed Student t test with Welch’s correction.
We further examined CD27+ B cells isolated from a variety of sites from multiple donors (Figure 4B). Strikingly, the prevalence of the 4 defined MBC subsets depended on location. Lymph nodes and tonsil had distributions similar to that of spleen; however, subsets expressing CD69 were virtually absent in blood and BM. In these sites, CD45RB single-positive (SP) cells were the dominant population, which is consistent with previous findings.27 In contrast, the vast majority of MBCs in both small and large intestine in all donors tested were DP cells (data not shown). We propose that the expression of both CD45RB and CD69 denotes tissue-resident and/or gut-specific MBCs. The finding that CD69 is also a hallmark of tissue-resident memory T cells in both mice and humans6,9,26 would be consistent with this notion.
In contrast, among CD27– cells, CD45RB– CD69– double negative (DN) cells comprised the great majority in all tissues (supplemental Figure 4). CD69+ cells were absent in both blood and BM; this led to small but significant elevations of DN cells in these 2 sites compared with spleen. Notably, small but detectable populations of CD45RB SP cells were seen in all tissues among CD27– cells, which might correspond with previously identified subsets of CD27– MBCs.
Functional heterogeneity within splenic MBC subsets
To begin to investigate potential functional differences among these newly defined MBC subsets, we stimulated sort-purified individual splenic populations with the TLR9 agonist ODN2006 for 5 days from a cohort of donors. All MBC subsets generated a higher fraction of activated phenotype (CD25+/CD86+) cells compared with NBCs (Figure 5A). DP MBCs generated AFCs with significantly higher efficiency than other MBC subsets. NBCs generated fewer AFCs than all MBC subsets, although for comparison with CD69SP, this did not reach significance when corrected for multiple comparisons (Figure 5B). In line with this finding, DP MBCs generated the most IgM AFCs (Figure 5C), with a trend toward all MBC subsets generating more than NBCs. This trend was also seen for IgG AFCs, although with smaller differences. Overall, this initial analysis reveals some consistent behaviors for the MBC subsets, with DP being most responsive to TLR9 ligation.

Functional characterization of splenic CD45RB/CD69 MBC subsets. Splenocytes of indicated phenotype of NBCs (blue) and MBCs (red) were sort-purified and cultured for 5 days in the presence of ODN2006. (A) After 5 days of stimulation, cells were harvested, and activation markers CD25 and CD86 were analyzed by using flow cytometry. (B) Cells were subjected to flow cytometric analysis to measure AFC (CD27+ CD38+ of live singlets) frequencies. (C) Graphs show the AFC response measured by Enzyme-Linked ImmunoSpot assay for IgM (left panel) and IgG (right panel) isotype for the different subsets. D315 (blue), D443 (orange), D424 (purple), D269 (mustard), and D462 (red); P values for multiple comparisons were adjusted by using a Bonferroni correction (**q < 0.05; *0.05 ≤ q < 0.15).
Functional characterization of splenic CD45RB/CD69 MBC subsets. Splenocytes of indicated phenotype of NBCs (blue) and MBCs (red) were sort-purified and cultured for 5 days in the presence of ODN2006. (A) After 5 days of stimulation, cells were harvested, and activation markers CD25 and CD86 were analyzed by using flow cytometry. (B) Cells were subjected to flow cytometric analysis to measure AFC (CD27+ CD38+ of live singlets) frequencies. (C) Graphs show the AFC response measured by Enzyme-Linked ImmunoSpot assay for IgM (left panel) and IgG (right panel) isotype for the different subsets. D315 (blue), D443 (orange), D424 (purple), D269 (mustard), and D462 (red); P values for multiple comparisons were adjusted by using a Bonferroni correction (**q < 0.05; *0.05 ≤ q < 0.15).
Gene expression profiles of gut-resident and splenic MBC
To obtain additional insight into potential functions of newly identified MBC subsets, we also performed RNA-sequencing of MBC subsets from spleen and ileum and NBCs from spleen of 4 individual donors. Principal component (PC) analysis of differentially expressed genes between DP and DN MBC (Figure 6A) revealed that samples naturally clustered according to subset and tissue, more so than by donor, indicating reproducible subset presence across different individuals. Furthermore, CD69 expression (red symbols) was the more dominant component compared with CD45RB expression in terms of discriminating samples, particularly in PC1. Most notably, ileum samples (which were almost exclusively DP) (Figure 4B) were distinct in PC2 even from their counterparts in the spleen. We therefore further performed PC analysis of differentially expressed genes (DEG) defined by CD69 expression differences (Figure 6B), which clearly indicated the importance of subset marker expression and tissue location, whereas donor sample identity played little role. Thus, residency in tissue induces and/or requires expression of a unique set of genes compared with residency in the spleen. The gene expression that drove these differences was not due to parenchymal tissue contamination, as none of these genes was expressed in published gene expression datasets from intestinal epithelial cells.

Gene expression analysis of CD45RB/CD69 subsets of spleen (SPL) and gut. Single-cell suspensions of SPL and ileum (ILE) were stained for RNA extraction after BD FACS Aria sorting of naive and MBC subsets defined by CD45RB and CD69 expression. (A) PC analysis of MBC subsets from SPL and ILE with genes that are differentially expressed between splenic DP and DN MBCs. The dotted ellipses represent the 95% confidence interval boundary for cell clusters. (B) PC analysis of MBC subsets from SPL and ILE with genes that are differentially expressed between CD69+ and CD69– MBCs. (C) Heatmap of top 40 DEGs between CD69+ and CD69– MBCs ranked by adjusted P value for all splenic MBC subsets. (D) Heatmap of differentially expressed TFs between splenic DP and DN MBCs. (E) Analysis of tissue-specific genes in DP and DN MBCs. Scatterplots display log2 fold-change of SPL DP vs DN samples on the x-axis and ILE DP samples vs SPL DN samples on the y-axis. Gray dots represent genes with significant (P adjusted <.1 and absolute value of log2 fold-change >1) differential expression in at least one of the 2 DP vs DN comparisons. Magenta dots denote “ILE-specific” and purple dots denote “SPL-specific” genes. Light blue and blue dots represent genes that are upregulated or downregulated, respectively, in both comparisons. (F) GSEA for ILE DP vs SPL DN on the TRM gene signature of CD8+ T-cell lineage (left panel) and CD4+ T-cell lineage (right panel) in lung tissue. In each plot, the x-axis shows the genes ranked by log fold-change between ILE DP vs SPL DN, and the y-axis shows the running enrichment score on the signature gene set with nominal P value indicated for 1000 permutations.
Gene expression analysis of CD45RB/CD69 subsets of spleen (SPL) and gut. Single-cell suspensions of SPL and ileum (ILE) were stained for RNA extraction after BD FACS Aria sorting of naive and MBC subsets defined by CD45RB and CD69 expression. (A) PC analysis of MBC subsets from SPL and ILE with genes that are differentially expressed between splenic DP and DN MBCs. The dotted ellipses represent the 95% confidence interval boundary for cell clusters. (B) PC analysis of MBC subsets from SPL and ILE with genes that are differentially expressed between CD69+ and CD69– MBCs. (C) Heatmap of top 40 DEGs between CD69+ and CD69– MBCs ranked by adjusted P value for all splenic MBC subsets. (D) Heatmap of differentially expressed TFs between splenic DP and DN MBCs. (E) Analysis of tissue-specific genes in DP and DN MBCs. Scatterplots display log2 fold-change of SPL DP vs DN samples on the x-axis and ILE DP samples vs SPL DN samples on the y-axis. Gray dots represent genes with significant (P adjusted <.1 and absolute value of log2 fold-change >1) differential expression in at least one of the 2 DP vs DN comparisons. Magenta dots denote “ILE-specific” and purple dots denote “SPL-specific” genes. Light blue and blue dots represent genes that are upregulated or downregulated, respectively, in both comparisons. (F) GSEA for ILE DP vs SPL DN on the TRM gene signature of CD8+ T-cell lineage (left panel) and CD4+ T-cell lineage (right panel) in lung tissue. In each plot, the x-axis shows the genes ranked by log fold-change between ILE DP vs SPL DN, and the y-axis shows the running enrichment score on the signature gene set with nominal P value indicated for 1000 permutations.
Heatmaps depicting unsupervised hierarchical clustering of the 40 most differentially expressed genes in spleen show that the expression of CD69 clearly distinguishes subsets of MBCs at the transcriptome level (Figure 6C). Within the CD69+ or CD69neg subsets, there is further subclustering according to CD45RB expression. Hence, across 4 donors, both CD69 and CD45RB delineate cells with distinct transcriptomes, with CD69 expression specifying more transcriptionally distinct subsets.
Because transcription factor (TF) expression can often correlate with differentiated identity in both committed T and B lineage cells, we focused on the 2 most distinct splenic subsets (DN and DP) and searched for differentially expressed TFs; these are displayed in a hierarchically clustered heatmap in Figure 6D. Among the differentially expressed TFs, several are notable for their expression in subsets of differentiated T and B cells in mice and/or humans. The transcript for EOMES is upregulated in DP MBC and is also upregulated in CD8 memory T cells. Transcripts for FOXM1 and BCL6, which are highly expressed in GCs,29-31 are upregulated in DN MBCs, suggesting a predisposition of these cells to form GC upon restimulation. Commensurate with this, messenger RNA for E2F2, a TF associated with a proliferative program,32 is also increased in expression in DN MBCs. Conversely, PDRM1 messenger RNA is also overexpressed in this subset, suggesting a predisposition to AFC differentiation upon restimulation.33,34 It is possible (even likely) that there is further heterogeneity among the DN MBCs and that seemingly disparate programs could reside in different subtypes of DN MBCs. Although our RNA-sequencing dataset represents a valuable resource, more work is required to elucidate the functions of these TFs in controlling function of these MBC subsets.
PC analysis revealed the distinct nature of gut DP MBCs (Figure 6A). To assess how their transcriptional pattern differed from counterpart DP MBCs in the spleen, we plotted covariate expression of DEGs between splenic DP and DN and DEGs between ileum DP and splenic DN in terms of log2 fold-change in each dimension (Figure 6E). Genes with positive or negative log2 fold-change are upregulated or downregulated in DP, regardless of location; the positively regulated genes (right quadrants) are considered as DP signature genes. There are also a number of genes exclusively upregulated in DP in the gut, which comprise gut tissue-resident MBC “signature” genes. Notably, given the predilection for DP forming AFCs on restimulation (Figure 5), both plasmablast and plasma cell gene signatures were enriched when splenic or gut DP MBCs were compared with splenic NBCs (supplemental Figure 5).
Although MBCs have been known to locate in mucosal and other tissues of both mice and humans,2,35,36 whether these MBCs have unique properties, akin to the well-described resident-memory T cell types found in these same sites, has not been well explored. The identification in humans of transcriptomes that characterize these gut-resident MBC vs splenic DN MBCs of the same individual allowed us to compare their transcriptomes vs those of lung tissue-resident memory T cells derived by us from comparable donors6 using GSEA. Remarkably, considering the many differences between B and T cells, both the CD4 and CD8 lung TRM gene sets were enriched in the DP MBC from ileum (Figure 6F), giving support to the concept that these gut-resident MBCs do have inherent characteristics of resident memory lymphocytes.
Discussion
We report a comprehensive analysis of B-cell phenotypes, functions, and transcriptomes across multiple tissues and donors. Our findings provide deeper insight into human B-cell compartments, in particular MBCs. An important message is that the blood does not predict MBC compartments in terms of frequency, immunoglobulin isotype, or subset identity in any of the tissues and that blood is not in equilibrium with the spleen.
There was substantial interindividual variation in the frequencies of B cells among lymphocytes in all sites tested, as well as the fraction of those B cells that carried the canonical MBC marker CD27. Overall, the degree of variation seen in the B-cell compartment is strikingly different from the minimal interindividual variation observed in T-cell compartments in comparable human donors.9
A second contribution of this work is identification of previously unrecognized subsets of MBCs, determined by expression of CD45RB and CD69. Previous studies identified CD45RB as being expressed on some MBCs27 and further showed that CD69 was upregulated in some MBCs of gut and spleen, including a CD27– marginal zone precursor cell found in gut-associated lymphoid tissue (GALT).4 Extending this theory, the current study showed that the combination of CD45RB and CD69 divided splenic CD27+ cells into 4 distinct subsets, with functional heterogeneity. Overall, we found that the MBC compartment exhibits higher levels of activation and a higher propensity to differentiate into antibody-secreting cells upon in vitro stimulation compared with NBCs. Notably, CD27– B cells, which are mainly naive, had very low percentages of cells positive for either marker. This could reflect that we carefully removed the mucosal epithelia and Peyer’s patches and other identifiable GALT from our intestinal samples, focusing instead on lamina propria localized B cells. The CD27– cells that do express these markers could represent subtypes of MBCs that do not express CD27.2,17,37 In particular, such cells are likely to include marginal zone precursor cells, as recently described.4 Very recently, Grimsholm et al have revealed further MBC heterogeneity based on levels of CD27 expression, with CD27dull cells being precursor cells that are more prevalent in younger individuals24 ; these could resemble the CD80–PDL-2– MBC found in mice.38,39
Support for distinct identities for these subsets comes from gene expression profiling and tissue distribution of the subsets. Gene expression analysis of splenocytes revealed clustering by subset across individual donors. In addition, all MBC subsets clustered separately from NBCs. Defining TFs that were differentially expressed between DN and DP splenic MBCs were identified for each of the subsets; the CD69+ subsets were distinct from their negative counterparts with respect to differentially expressed TFs.
A third advance is further characterization of human gut-resident MBCs, along with their unique surface phenotype and transcriptome. Gut resident MBCs were reliably isolated from nearly all donors. These MBCs were almost exclusively DP MBCs, with few if any SP cells. Conversely, the blood and BM were devoid of CD69+ cells. Notably, CD69 helps retain cells in tissues and is a marker of tissue-resident memory.26,40 In the past several years, studies have characterized heterogeneity and relationships among immature, MBCs, marginal zone–like, and plasma lineage cells in gut.4,5,13,41,42 Magri et al8 reported transcriptomes of IgM+ and IgG+ MBCs in human terminal ileum. Although their markers did not include those we used, it is likely that they were largely studying subtypes of DP MBCs in gut, given the prevalence of this phenotype in gut B cells. Here, we propose that these gastrointestinal-resident (non-GALT) B cells are a type of tissue-resident MBC and that dual expression of CD45RB and CD69 is a marker of BRM.
Another B-cell type is the “atypical” or “tissue-like” MBC, which lacks CD27.16-19 We identified these “atypical” MBCs as CD27–, IgG+, B cells in gut, spleen, and blood; moreover, we found that only a subset of these lacked CD21 expression, which has been considered in most reports to be diagnostic of these cells. The functional significance of CD21 expression among CD27– IgG+ MBC is not clear.
This work provides valuable baselines for understanding and comparing B-cell compartments throughout the human body and is the foundation for several future studies. First, the functional properties and significance of the MBC subsets in tissues other than the spleen need to be determined. Second, it will be important to determine the specificities and repertoires of these subsets. Third, the developmental origins and connections of the MBCs should be established. Addressing these directions will be important for understanding local responses to pathogens and vaccines, as well as autoimmune diseases.
The RNA-seq data reported in this article have been deposited in the Gene Expression Omnibus database (accession number GSE154583).
The online version of this article contains a data supplement.
The publication costs of this article were defrayed in part by page charge payment. Therefore, and solely to indicate this fact, this article is hereby marked “advertisement” in accordance with 18 USC section 1734.
Acknowledgments
The authors thank Harvey Lerner, Amy Friedman, and the transplant coordinators from LiveOnNY for tissues from organ donors and members of the Farber Lab at Columbia University for providing access to human organ donor tissue samples. The authors also thank Uri Hershberg and other members of the P01 group for valuable discussions and suggestions during the development of this work. The Unified Flow Core at the University of Pittsburgh provided expert cell sorting. The authors thank the Sulzberger Genome Center and William Horne at the Health Sciences Sequencing Core at Children’s Hospital of Pittsburgh for performing RNA-sequencing. They thank Ailing Liu for viSNE analysis and Jishnu Das for statistical analysis. They further thank Stephen Joachim, Laura Conter, Kristen Faidley, Rachel Green, and Meagan Osburn for help with isolating and purifying cells from human tissues and the Center for Research Computing at the University of Pittsburgh.
Supported by the National Institutes of Health, National Institute of Allergy and Infectious Diseases (P01-AI106697, M.J.S. and D.L.F.; R01-AI43603, M.J.S.; R21-AI126440) and the Clinical and Translational Science Institute (L.A.B.).
Authorship
Contribution: F.J.W., N.M.W., E.T.L.P., and M.J.S. designed research; N.M.W. and F.J.W. implemented and analyzed all experiments; Y.S. and W.M. performed bioinformatics analysis; L.A.B. performed flow cytometric analysis and D.L.F. gave conceptual advice and provided tissue samples; and M.J.S. wrote the manuscript together with N.M.W. and F.J.W.
Conflict-of-interest disclosure: The authors declare no competing financial interests.
Correspondence: Mark J. Shlomchik, Department of Immunology, University of Pittsburgh School of Medicine, W1052 Biomedical Science Tower, 200 Lothrop St, Pittsburgh, PA 15261; e-mail: mshlomch@pitt.edu.

This feature is available to Subscribers Only
Sign In or Create an Account Close Modal