

Key Points
Disruption of the β-catenin-TCF/LEF interaction compromises steady-state and emergency granulopoiesis.
TCF/LEF factors regulate G-CSF receptor expression by directly interacting with CSF3R promoter and enhancer regions.

Abstract
The canonical Wnt signaling pathway is mediated by interaction of β-catenin with the T-cell factor/lymphoid enhancer-binding factor (TCF/LEF) transcription factors and subsequent transcription activation of Wnt-target genes. In the hematopoietic system, the function of the pathway has been mainly investigated by rather unspecific genetic manipulations of β-catenin that yielded contradictory results. Here, we used a mouse expressing a truncated dominant negative form of the human TCF4 transcription factor (dnTCF4) that specifically abrogates β-catenin-TCF/LEF interaction. Disruption of the β-catenin-TCF/LEF interaction resulted in the accumulation of immature cells and reduced granulocytic differentiation. Mechanistically, dnTCF4 progenitors exhibited downregulation of the Csf3r gene, reduced granulocyte colony-stimulating factor (G-CSF) receptor levels, attenuation of downstream Stat3 phosphorylation after G-CSF treatment, and impaired G-CSF-mediated differentiation. Chromatin immunoprecipitation assays confirmed direct binding of TCF/LEF factors to the promoter and putative enhancer regions of CSF3R. Inhibition of β-catenin signaling compromised activation of the emergency granulopoiesis program, which requires maintenance and expansion of myeloid progenitors. Consequently, dnTCF4 mice were more susceptible to Candida albicans infection and more sensitive to 5-fluorouracil-induced granulocytic regeneration. Importantly, genetic and chemical inhibition of β-catenin-TCF/LEF signaling in human CD34+ cells reduced granulocytic differentiation, whereas its activation enhanced myelopoiesis. Altogether, our data indicate that the β-catenin-TCF/LEF complex directly regulates G-CSF receptor levels, and consequently controls proper differentiation of myeloid progenitors into granulocytes in steady-state and emergency granulopoiesis. Our results uncover a role for the β-catenin signaling pathway in fine tuning the granulocytic production, opening venues for clinical intervention that require enhanced or reduced production of neutrophils.
Introduction
Hematopoietic stem cells (HSCs) and progenitors, collectively known as HSPCs, sustain mature blood cell production throughout the lifetime of an organism. HSPCs respond to stress conditions, such as infections, by tailoring a response adequate to resolve the insult.1 Thus, identifying the mechanisms that regulate HSPC function in homeostasis and stress situations is important for understanding the dynamic nature of the system. One of the critical yet controversial pathways in HSPC regulation is the canonical Wnt signaling pathway. The central regulator in this signaling cascade is β-catenin, a cytoplasmic protein that in the absence of Wnt stimulus is targeted for degradation. Binding of Wnt ligands to Frizzled receptors activates the pathway by β-catenin stabilization, its accumulation in the cytoplasm, nuclear translocation, and subsequent binding to the N terminus of the T-cell factor/lymphoid enhancer-binding factor (TCF/LEF). Consequently, the TCF/LEF transcription factors change from a repressive to an active state, inducing transactivation of Wnt-target genes. In the absence of Wnt ligands, TCF/LEF factors recruit a transcription repression complex composed of Groucho/TLE, CtBP, and histone deacetylases.2-4 In vertebrates, 4 TCF/LEF genes exist: TCF7, TCF7L1, TCF7L2, and LEF1. They respectively encode TCF1, TCF3, TCF4, and LEF1 proteins, and their expression has been detected in HSPCs.5-8
Numerous studies demonstrate a critical role of the Wnt signaling pathway in hematopoiesis, but its role in HSPC maintenance and fate remains controversial.9 On one hand, several publications, based on inactivation of the pathway, proposed that Wnt signaling is required for proper HSPC function.10-12 In line with these reports, gain-of-function approaches indicated that activation of the Wnt/β-catenin signaling pathway results in enhanced HSPC function.13-17 On the other hand, studies by Leutz and Nerlov proposed that constitutive activation of β-catenin conferred multilineage differentiation defects and induced exhaustion of the HSPC pool.18,19 In addition, several loss-of-function approaches in mice suggested that the Wnt/β-catenin signaling pathway is dispensable for hematopoiesis in steady-state conditions.20-22 These discrepancies are often justified by the use of distinct methods and approaches, which result in different levels of Wnt pathway activation/inactivation.9,23 Additionally, the differences can be explained by modulation of the pathway at different levels, which ranges from manipulation of extracellular signals, cytoplasmic proteins, to nuclear factors.
Here, we aim to clarify the role of the β-catenin-TCF/LEF signaling pathway in hematopoiesis by inhibiting β-catenin-TCF/LEF-dependent transcription activation. We generated a murine model that prevents binding of β-catenin to TCF/LEF and consequently abolishes β-catenin-TCF/LEF-dependent transcription. Importantly, this strategy preserves the β-catenin cytoplasmic and TCF/LEF-independent functions, allowing us to specifically investigate the role of β-catenin-TCF/LEF transcription machinery in HSPC maintenance and fate. We demonstrate that the β-catenin-TCF/LEF signaling axis is crucial for proper differentiation of myeloid progenitors into granulocytes in steady-state and emergency granulopoiesis. Mechanistically, we showed this complex controls expression of genes involved in myelopoiesis, and directly enhances expression of the granulocyte colony-stimulating factor receptor (G-CSF-R), a crucial molecule for proper development of granulocytes. Altogether, we propose a central role for β-catenin-TCF/LEF during granulopoiesis, providing the basis for clinical interventions aiming at a reduction or expansion of the granulocytic pool.
Methods
For more detailed protocols, see supplemental Methods (available on the Blood Web site).
Dominant negative (dn)TCF4 mouse model
Rosa26dnTCF4 mice were generated as previously described24 (supplemental Figure 1A-B). This line was crossed to Vav-iCre transgenic mice25 to induce deletion of the tdTomato labeled transcription blocker and allow expression of EGFP-dnTCF4 protein in the hematopoietic system from early stages of hematopoietic development. Three types of progeny were used: Rosa26wtVav-iCre+, Rosa26dnTCF4Vav-iCre−, and Rosa26dnTCF4Vav-iCre+. Rosa26wtVav-iCre+ (lacking the dnTCF4 transgene cassette) and Rosa26dnTCF4Vav-iCre− (in which dnTCF4 is not expressed because of the floxed transcriptional blocker) were used as wild-type (WT) controls and referred as WT and WTT, respectively. In Rosa26dnTCF4Vav-iCre+ mice (referred to as dn or dnTCF4), where the transcriptional blocker was excised, dnTCF4 is expressed. Mice were maintained in the animal facility of the Institute of Molecular Genetics of the Czech Academy of Sciences. All experiments were approved by the ethical committee of the institute.
RNA sequencing and analysis
Short-term HSCs (ST-HSCs), defined as Lin− c-Kit+ Sca-1+ CD48+ CD150−, from 3 WT and 3 dnTCF4 (12-week-old mice) were sorted using Influx instrument (BD Biosciences, San Jose, CA). Samples were processed independently and sequenced as biological triplicates. Briefly, cells were lysed with Tri Reagent RT (Molecular Research Center, Cincinnati, OH), and RNA was extracted with RNEasy MinElute Cleanup Kit (Qiagen, Venlo, Netherlands). PolyA selection and complementary DNA synthesis was performed using SMART-Seq v4 Ultra Low Input RNA Kit (Takara Bio Inc, Mountain View, CA) and sequencing libraries were prepared with Nextera XT DNA Library Prep Kit (Illumina, San Diego, CA). Libraries were sequenced on NextSeq 500 instrument (Illumina). Sequences were aligned to murine GRCm38/mm10 reference genome by STAR algorithm and analyzed by DESeq2.
G-CSF-R expression assay
Bone marrow (BM) cells were isolated from WT and dnTCF4 mice, washed, and kept in PSA buffer (phosphate-buffered saline [PBS] supplemented with 1% fetal bovine serum and 0.02% sodium azide). A total of 1 × 10⁶ cells per sample were labeled either with biotinylated G-CSF (40 ng/mL), unlabeled G-CSF (40 ng/mL), or a combination of both in 1:10 ratio for 1 hour on ice. Additionally, cells were stained with streptavidin-phycoerythrin conjugate and measured on FACS Symphony instrument (BD Biosciences).
LPS treatment in vivo
For induction of emergency granulopoiesis, mice were treated as previously shown.26,27 Mice received 2 intraperitoneal injections with 35 µg of ultrapure lipopolysaccharide (LPS) from Escherichia coli 0127:B8 (Sigma-Aldrich, St. Louis, MO) 48 hours apart, and were analyzed 24 hours after second injection.
5-FU treatment
Mice were repeatedly intraperitoneally injected with 150 mg/kg of 5-fluorouracil (5-FU) (Sigma-Aldrich) dissolved in PBS every 14 days. Blood counts and weight were assessed every 7 days. Mice were monitored daily and moribund animals were euthanized.
Statistical analysis
Long-term HSC (LT-HSC) frequencies were calculated with L-Calc software (StemCell Technologies, Vancouver, Canada) using Poisson statistics and the method of maximum likelihood to the proportion of negative recipients in a limiting dilution setting. Survival analysis was performed using the Kaplan-Meier method; Mantle-Cox test was used to assess statistical significance of survival difference between experimental groups. Differences between survival distributions were analyzed using the log-rank (Mantle-Cox) test. Otherwise, statistical significance for indicated data sets was determined using unpaired 2-tailed Student t test. P values < .05 were considered statistically significant. Scatter dot plots depict mean with error bars representing standard deviation (SD).
Results
Generation of transgenic mice with conditional inactivation of the β-catenin-TCF/LEF complex in hematopoietic cells
To investigate the role of the β-catenin-TCF/LEF signaling pathway in hematopoiesis, we used a transgenic mouse model expressing a truncated form of the human TCF4 transcription factor (dnTCF4)24 crossed to Vav-iCre transgenic mice. In hematopoietic cells, expression of the dnTCF4 protein was activated from the Rosa26 locus by tissue-specific expression of Cre recombinase (supplemental Figure 1A). dnTCF4 protein, lacking the β-catenin-binding domain, abrogates activation of Wnt target genes, even when β-catenin is stabilized and translocated into the nucleus (supplemental Figure 1B).24 dnTCF4 RNA and protein expression was detected in murine BM cells isolated from 12-week-old dnTCF4 mice (Figure 1A-B). Because our targeting construct contained dnTCF4 fused to EGFP, dnTCF4 production was also detected by flow cytometric analysis upon cre-mediated excision (supplemental Figure 1C). dnTCF4 and TCF/LEF expression were stable as animals aged (supplemental Figure 1D-E). Importantly, β-catenin target genes, such as Nkd1 and Axin2, were not upregulated in dnTCF4 expressing c-Kit+ cells upon treatment with the β-catenin pathway activator CHIR99021, whereas in WTT cells Nkd1 and Axin2 mRNA levels were increased (Figure 1C). These experiments validated our model and demonstrated (1) expression of dnTCF4 in hematopoietic cells and (2) attenuation of the β-catenin-TCF/LEF transcription activity in dnTCF4-expressing cells.
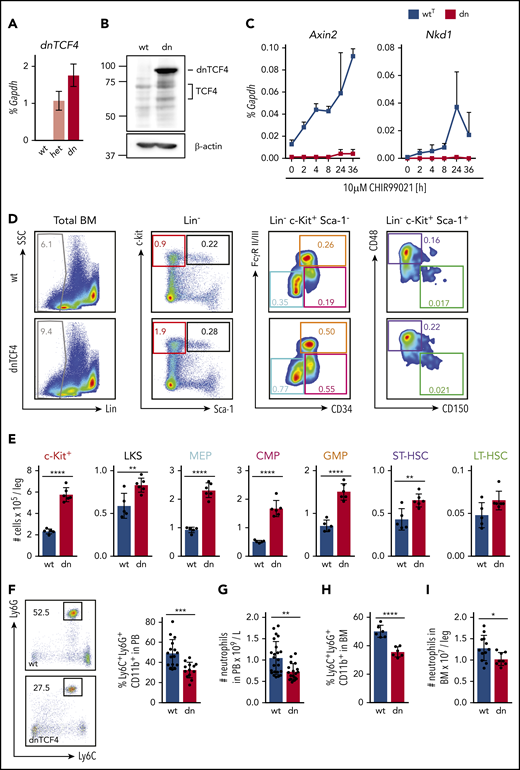
Disruption of the β-catenin-TCF/LEF transcription-mediating complex expands HSPCs and diminishes neutrophilic production. (A) Quantitative RT-PCR of whole BM from WT (wt), heterozygous (het), and homozygous (dn) dnTCF4 mice. The y-axis represents relative dnTCF4 expression compared with Gapdh control. Graph shows representative experiment out of 2 independent experiments (n = 5). (B) Western blot analysis for TCF4 and dnTCF4 expression in WT (wt) and dnTCF4 (dn) mouse BM. Membrane was stained with antihuman TCF4 antibody to detect TCF4 and dnTCF4 protein. β-actin expression was used as a loading control. Positions of molecular weight standards are indicated (kDa). (C) Quantitative RT-PCR in BM c-Kit+ cells isolated from WTT (wtT) and dnTCF4 (dn) mice. The y-axes represent Axin2 and Nkd1 expression relative to Gapdh upon treatment with 10 μM CHIR99021 (a GSK3β inhibitor that prevents β-catenin phosphorylation and favors its translocation to the nucleus, inducing transactivation of β-catenin target genes). The x-axis indicates hours after stimulation (h); n = 3 mice per time point per group. (D) Representative flow cytometry plots from 1 WT (upper plots) and 1 dnTCF4 (lower plots) mouse. Plots illustrate gating strategy. Color boxes indicate the following populations: Lin− cells (gray), Lin− c-Kit+ myeloid progenitors (red), LKS (black), megakaryocyte-erythroid progenitors (blue), common myeloid progenitors (pink), GMPs (orange), ST-HSC (violet), and LT-HSC (green). Numbers represent average percentage of the distinct populations in BM of analyzed animals. See supplemental Figure 2A for complete quantification. (E) Number of cells in the distinct BM populations. At least 5 animals were included in each group. Graph shows 1 representative biological experiment of 3. (F) Representative flow cytometry plots from WT and dnTCF4 PB and their quantification. Left panel illustrates Ly6G (y-axes) and Ly6C (x-axes) expression in CD11b+ cells. Black boxes and numbers indicate the percentage of Ly6G+ Ly6C+ cells in CD11b+ population. Right graph indicates the percentage of Ly6C+ Ly6G+ in CD11b+ cells in PB of WT and dnTCF4 mice. At least 14 mice were included in each group. (G) Number of neutrophils per liter (L) in PB based on auto hematology analyzer. At least 18 mice were included in each group. (H) Percentage of neutrophils in BM in WT and dnTCF4 mice. Y-axis indicates the percentage of CD11b+ Ly6G+ Ly6C+ cells in BM; n = 6. (I) Number of CD11b+ Ly6G+ Ly6C+ cells in WT and dnTCF4 BM. Y-axis indicates the number of cells per leg. At least 8 mice were included per group. All animals included in Figure 1 were 12 to 15 weeks old, each represented by a dot symbol in panels E-I. Data indicate mean ± SD, and 2-tailed Student t test was used to assess statistical significance (*P < .05, **P < .01, ***P < .001, and ****P < .0001).
Disruption of the β-catenin-TCF/LEF transcription-mediating complex expands HSPCs and diminishes neutrophilic production. (A) Quantitative RT-PCR of whole BM from WT (wt), heterozygous (het), and homozygous (dn) dnTCF4 mice. The y-axis represents relative dnTCF4 expression compared with Gapdh control. Graph shows representative experiment out of 2 independent experiments (n = 5). (B) Western blot analysis for TCF4 and dnTCF4 expression in WT (wt) and dnTCF4 (dn) mouse BM. Membrane was stained with antihuman TCF4 antibody to detect TCF4 and dnTCF4 protein. β-actin expression was used as a loading control. Positions of molecular weight standards are indicated (kDa). (C) Quantitative RT-PCR in BM c-Kit+ cells isolated from WTT (wtT) and dnTCF4 (dn) mice. The y-axes represent Axin2 and Nkd1 expression relative to Gapdh upon treatment with 10 μM CHIR99021 (a GSK3β inhibitor that prevents β-catenin phosphorylation and favors its translocation to the nucleus, inducing transactivation of β-catenin target genes). The x-axis indicates hours after stimulation (h); n = 3 mice per time point per group. (D) Representative flow cytometry plots from 1 WT (upper plots) and 1 dnTCF4 (lower plots) mouse. Plots illustrate gating strategy. Color boxes indicate the following populations: Lin− cells (gray), Lin− c-Kit+ myeloid progenitors (red), LKS (black), megakaryocyte-erythroid progenitors (blue), common myeloid progenitors (pink), GMPs (orange), ST-HSC (violet), and LT-HSC (green). Numbers represent average percentage of the distinct populations in BM of analyzed animals. See supplemental Figure 2A for complete quantification. (E) Number of cells in the distinct BM populations. At least 5 animals were included in each group. Graph shows 1 representative biological experiment of 3. (F) Representative flow cytometry plots from WT and dnTCF4 PB and their quantification. Left panel illustrates Ly6G (y-axes) and Ly6C (x-axes) expression in CD11b+ cells. Black boxes and numbers indicate the percentage of Ly6G+ Ly6C+ cells in CD11b+ population. Right graph indicates the percentage of Ly6C+ Ly6G+ in CD11b+ cells in PB of WT and dnTCF4 mice. At least 14 mice were included in each group. (G) Number of neutrophils per liter (L) in PB based on auto hematology analyzer. At least 18 mice were included in each group. (H) Percentage of neutrophils in BM in WT and dnTCF4 mice. Y-axis indicates the percentage of CD11b+ Ly6G+ Ly6C+ cells in BM; n = 6. (I) Number of CD11b+ Ly6G+ Ly6C+ cells in WT and dnTCF4 BM. Y-axis indicates the number of cells per leg. At least 8 mice were included per group. All animals included in Figure 1 were 12 to 15 weeks old, each represented by a dot symbol in panels E-I. Data indicate mean ± SD, and 2-tailed Student t test was used to assess statistical significance (*P < .05, **P < .01, ***P < .001, and ****P < .0001).
Inactivation of β-catenin-TCF/LEF transcription results in accumulation of murine myeloid progenitors and reduced production of granulocytes
dnTCF4 mice were used to investigate the role of the β-catenin-TCF/LEF signaling pathway in hematopoietic development. Flow cytometric analysis using 15-week-old mice demonstrated that inactivation of the pathway resulted in accumulation of HSPCs in BM (Figure 1D-E; supplemental Figure 2A), although BM cellularity was not altered (supplemental Figure 2B). In particular, dnTCF4 mice exhibited increased number and percentage of ST-HSCs, Lin− c-Kit+ Sca-1+ cells (LKS), c-Kit+ myeloid progenitors, megakaryocyte-erythroid progenitors (MEPs), common myeloid progenitors (CMPs), and granulocyte-monocyte progenitors (GMPs). In addition, flow cytometric analysis of granulocytic development28 demonstrated an accumulation of myeloblasts/promyelocytes in dnTCF4 BM (supplemental Figure 2C-D), although these changes could not be appreciated in BM sections (supplemental Figure 2E). Remarkably, accumulation of myeloid progenitors was accompanied by a reduction of neutrophils in peripheral blood (PB) and BM of 15-week-old dnTCF4 mice (Figure 1F-I; supplemental Figure 2C-D). This reduction was stable as animals aged and no other populations were altered (supplemental Figure 2F-G). Altogether, these experiments demonstrate that the β-catenin-TCF/LEF signaling pathway promotes the production of mature neutrophils and prevents accumulation of myeloid progenitor populations.
β-catenin-TCF/LEF inactivation causes a block of neutrophilic differentiation rather than enhanced cell proliferation
Because dnTCF4 mice accumulated myeloid progenitors, we investigated the cause of this phenotype. First, we performed in vivo BrdU incorporation assays and observed similar BrdU labeling between WT and dnTCF4 cells (Figure 2A-B), suggesting no differences in their proliferation rate. Second, we determined the cell-cycle distribution based on Pyronin Y and Hoechst 33342 staining and observed no differences in the percentage of cells in G0, G1, or S/G2/M (Figure 2C-D). Next, we carried out BM replating assays to distinguish differentiated cells from cells retaining an immature phenotype. Although no differences were observed in the number of colonies in the first plating, dnTCF4 cultures exhibited increased colony numbers in the second and third plating in comparison with WT cultures (Figure 2E). Additionally, morphological analysis of dnTCF4 cultures demonstrated fewer neutrophils and elevated numbers of immature cells (Figure 2F-G). Accordingly, flow cytometric analysis showed reduced percentage of Gr1+ CD11b+ cells and increased percentage of c-Kit+ progenitors in dnTCF4 cultures (Figure 2H-I). Additionally, quantitative reverse transcription polymerase chain reaction (RT-PCR) demonstrated increased expression of myeloblast/promyelocyte markers such as Ela2 and Ctsg in dnTCF4 cells, whereas expression of mature neutrophilic markers such as Cebpe and Lft was reduced (Figure 2J). Altogether, these results indicate that disruption of the β-catenin-TCF/LEF interaction impairs neutrophilic differentiation rather than induces proliferation of HSPCs.
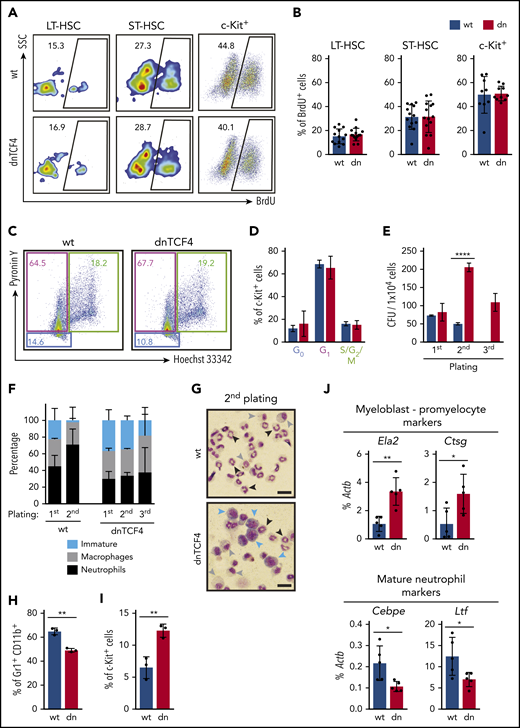
HSPCs accumulate in dnTCF4 BM because of differentiation arrest rather than to changes in proliferation. (A) Representative flow cytometry plots from 5-bromo-2′-deoxyuridine (BrdU) incorporation assay in WT and dnTCF4 mouse BM. Numbers indicate the percentage of BrdU+ cells in the indicated BM populations. (B) Quantification of panel A. At least 10 animals (12 weeks old) from 3 independent experiments were included in each group. (C) Representative flow cytometry plots of pyronin Y/Hoechst 33342 staining in WT and dnTCF4 mouse c-Kit+ BM cells. Color boxes indicate the percentage of cells in G0 (blue), in G1 (pink), and S/G2/M (green) phase. (D) Distribution of c-Kit+ cells in the indicated cell-cycle phases. Data are pooled from 2 independent experiments, n = 5. (E) Colony replating assays of WT and dnTCF4 BM cells using MethoCult GF M3434. A total of 1 × 10⁴ BM cells was plated per well (first plating) and 5 × 10³ cells were replated (second and third platings). Colonies were counted and replated on day 10. The y-axis indicates the number of colony-forming units (CFU) per 1 × 10⁴ cells. n = 3 in each group. (F) Differential counting was performed based on cell morphology. Cells in colony culture assays were cytospun and cell morphology assessed in 200 to 300 cells per cytospin. Y-axis indicates the percentage of immature cells (medium to large cells with big nucleus and scant and dark-blue cytoplasm; blue bars), macrophages (large and round cells with round nucleus and light-blue cytoplasm; gray bars), and neutrophils (smaller cells characterized by a ring shape or lobulated nucleus; black bars). Graph shows data from 2 independent cultures, n = 6. (G) Representative pictures of WT (top) and dnTCF4 (bottom) cells cytospun from semisolid cultures (second plating). Cytospins were stained with May-Grünwald Giemsa. Scale bar represents 50 μm. Blue arrows point at immature cells, gray arrows at macrophages, and black arrows at neutrophils (as defined in panel F). (H) Percentage of Gr1+ CD11b+ cells and (I) immature c-Kit+ cells in WT and dnTCF4 cells from semisolid cultures (second plating). The y-axes indicate the percentage of live cells. Graph shows data from 3 independent experiments, n = 5. (J) Quantitative RT-PCR from cells harvested from WT and dnTCF4 cultures (first plating). Expression of Ela2, Ctsg, Cebpe, and Lft is indicated. The y-axes represent relative expression compared with Actb control. Data in Figure 2 represent mean ± SD, 2-tailed Student t test was used to assess statistical significance (*P < .05, **P < .01, and ****P < .0001).
HSPCs accumulate in dnTCF4 BM because of differentiation arrest rather than to changes in proliferation. (A) Representative flow cytometry plots from 5-bromo-2′-deoxyuridine (BrdU) incorporation assay in WT and dnTCF4 mouse BM. Numbers indicate the percentage of BrdU+ cells in the indicated BM populations. (B) Quantification of panel A. At least 10 animals (12 weeks old) from 3 independent experiments were included in each group. (C) Representative flow cytometry plots of pyronin Y/Hoechst 33342 staining in WT and dnTCF4 mouse c-Kit+ BM cells. Color boxes indicate the percentage of cells in G0 (blue), in G1 (pink), and S/G2/M (green) phase. (D) Distribution of c-Kit+ cells in the indicated cell-cycle phases. Data are pooled from 2 independent experiments, n = 5. (E) Colony replating assays of WT and dnTCF4 BM cells using MethoCult GF M3434. A total of 1 × 10⁴ BM cells was plated per well (first plating) and 5 × 10³ cells were replated (second and third platings). Colonies were counted and replated on day 10. The y-axis indicates the number of colony-forming units (CFU) per 1 × 10⁴ cells. n = 3 in each group. (F) Differential counting was performed based on cell morphology. Cells in colony culture assays were cytospun and cell morphology assessed in 200 to 300 cells per cytospin. Y-axis indicates the percentage of immature cells (medium to large cells with big nucleus and scant and dark-blue cytoplasm; blue bars), macrophages (large and round cells with round nucleus and light-blue cytoplasm; gray bars), and neutrophils (smaller cells characterized by a ring shape or lobulated nucleus; black bars). Graph shows data from 2 independent cultures, n = 6. (G) Representative pictures of WT (top) and dnTCF4 (bottom) cells cytospun from semisolid cultures (second plating). Cytospins were stained with May-Grünwald Giemsa. Scale bar represents 50 μm. Blue arrows point at immature cells, gray arrows at macrophages, and black arrows at neutrophils (as defined in panel F). (H) Percentage of Gr1+ CD11b+ cells and (I) immature c-Kit+ cells in WT and dnTCF4 cells from semisolid cultures (second plating). The y-axes indicate the percentage of live cells. Graph shows data from 3 independent experiments, n = 5. (J) Quantitative RT-PCR from cells harvested from WT and dnTCF4 cultures (first plating). Expression of Ela2, Ctsg, Cebpe, and Lft is indicated. The y-axes represent relative expression compared with Actb control. Data in Figure 2 represent mean ± SD, 2-tailed Student t test was used to assess statistical significance (*P < .05, **P < .01, and ****P < .0001).
dnTCF4 expression enhances short-term BM reconstitution upon transplantation
Because dnTCF4 BM cells exhibited enhanced colony formation, we investigated whether the β-catenin-TCF/LEF signaling pathway is involved in HSPC function. Competitive BM transplantation assays were carried out with distinct doses of WT or dnTCF4 BM cells, and transplanted into lethally irradiated congenic mice (Figure 3A). Blood analysis of recipient mice 4 weeks after transplantation (assessing short-term hematopoietic reconstitution) showed that dnTCF4 BM cells engrafted better than WT cells (Figure 3B-C). On the contrary, analysis of recipient mice 16 weeks posttransplant showed no differences in the long-term repopulating abilities between WT and dnTCF4 BM cells (Figure 3B-C) and demonstrated no alterations in granulocytic differentiation (supplemental Figure 3A). Interestingly, we also observed an accumulation of dnTCF4 myeloid progenitors in the BM of recipient animals (Figure 3D). These results further support our finding that hematopoietic progenitors accumulate in the BM of dnTCF4 mice and their accumulation results in increased short-term engraftment, whereas long-term repopulating abilities, which reflect the number of functional HSC, were not altered. To confirm this hypothesis, LT-HSC29 were sorted and competitive limiting dilution repopulating assays were performed. Flow cytometric analysis of BM and PB of recipient mice revealed no significant differences in WT and dnTCF4 HSC function (Figure 3E). Contribution of donor cells to distinct hematopoietic lineages (myeloid, B, and T cells) was similar in all recipient mice (supplemental Figure 3B). These experiments indicate that the β-catenin-TCF/LEF signaling pathway controls hematopoietic progenitor cell abundance, but is dispensable for the HSC number and fitness.
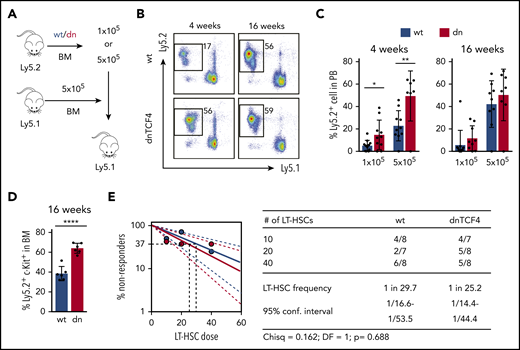
Enhanced short-term repopulation of dnTCF4 BM and maintenance of normal LT-HSC activity. (A) Graphical representation of whole BM transplantation. (B) Representative flow cytometry plots from recipient mice transplanted with 5 × 10⁵ WT or dnTCF4 BM cells. PB analysis was performed 4 and 16 weeks after transplantation. The y-axes indicate Ly5.2 expression and x-axes Ly5.1 expression. Numbers indicate percentage of donor-derived Ly5.2+ cells. (C) Quantification of panel B. The y-axes indicate percentage of WT and dnTCF4 donor-derived Ly5.2+ cells in PB. Engraftment 4 and 16 weeks after transplantation is shown. Number of donor cells is indicated in the x-axes. At least 10 animals were included in each group. All data represent mean ± SD from 3 independent experiments. Two-tailed Student t test was used to assess statistical significance (*P < .05, **P < .01). (D) Percentage of donor-derived (Ly5.2+) Lin− c-Kit+ cells in the BM of recipient (Ly5.1+) animals 16 weeks after transplantation. Recipients were transplanted with 5 × 10⁵ WT or dnTCF4 BM (Ly5.2+) cells along with 5 × 10⁵ competitive (Ly5.1+) BM cells. Data represent mean ± SD, n = 6. Two-tailed Student t test was used to assess statistical significance, ****P < .0001. (E) Frequency of functional LT-HSCs in WT and dnTCF4 mice measured by limiting dilution assay. (Left) Logarithmic plot showing the percentage of negative recipients transplanted with different cell doses of sorted WT or dnTCF4 LT-HSCs. Only recipients at 16 weeks with engraftment of ≥0.1% and contribution to 2 of 3 lineages (T, B, and myeloid cells) higher than 0.5% were considered responders. (Right) Number of responders and total number of recipients transplanted per each cell dose. Frequencies of LT-HSCs were calculated according to Poisson statistics using ELDA software (χ2 test = 0.162; P = .688).
Enhanced short-term repopulation of dnTCF4 BM and maintenance of normal LT-HSC activity. (A) Graphical representation of whole BM transplantation. (B) Representative flow cytometry plots from recipient mice transplanted with 5 × 10⁵ WT or dnTCF4 BM cells. PB analysis was performed 4 and 16 weeks after transplantation. The y-axes indicate Ly5.2 expression and x-axes Ly5.1 expression. Numbers indicate percentage of donor-derived Ly5.2+ cells. (C) Quantification of panel B. The y-axes indicate percentage of WT and dnTCF4 donor-derived Ly5.2+ cells in PB. Engraftment 4 and 16 weeks after transplantation is shown. Number of donor cells is indicated in the x-axes. At least 10 animals were included in each group. All data represent mean ± SD from 3 independent experiments. Two-tailed Student t test was used to assess statistical significance (*P < .05, **P < .01). (D) Percentage of donor-derived (Ly5.2+) Lin− c-Kit+ cells in the BM of recipient (Ly5.1+) animals 16 weeks after transplantation. Recipients were transplanted with 5 × 10⁵ WT or dnTCF4 BM (Ly5.2+) cells along with 5 × 10⁵ competitive (Ly5.1+) BM cells. Data represent mean ± SD, n = 6. Two-tailed Student t test was used to assess statistical significance, ****P < .0001. (E) Frequency of functional LT-HSCs in WT and dnTCF4 mice measured by limiting dilution assay. (Left) Logarithmic plot showing the percentage of negative recipients transplanted with different cell doses of sorted WT or dnTCF4 LT-HSCs. Only recipients at 16 weeks with engraftment of ≥0.1% and contribution to 2 of 3 lineages (T, B, and myeloid cells) higher than 0.5% were considered responders. (Right) Number of responders and total number of recipients transplanted per each cell dose. Frequencies of LT-HSCs were calculated according to Poisson statistics using ELDA software (χ2 test = 0.162; P = .688).
β-catenin-TCF/LEF signaling pathway promotes expression of genes involved in myeloid differentiation
To better understand the role of the β-catenin-TCF/LEF transcription-mediating complex in HSPCs, we performed gene expression profile analysis in WT and dnTCF4 ST-HSCs isolated from 12-week-old mice. ST-HSCs were selected because (1) they are the earliest population that accumulates in dnTCF4 mice and (2) they contribute to the short-term hematopoietic reconstitution of lethally irradiated mice, which is enhanced in recipients transplanted with dnTCF4 cells. Despite principal component analysis showing variability among samples (supplemental Figure 4A), unsupervised cluster analysis demonstrated that WT and dnTCF4 samples clustered to separate clades (supplemental Figure 4B). We identified 743 downregulated and 754 upregulated genes in dnTCF4 ST-HSCs compared with WT ST-HSCs (P < .05, log2 fold change >0.5) (Figure 4A; supplemental Table 1). Changes in gene expression were verified by RT-PCR (supplemental Figure 4C). Because dnTCF4 acts primarily as a transcriptional repressor, we focused on downregulated genes. Among them, we identified genes involved in myeloid development and differentiation, such as Irf4, Il1r1, Il18r1, and Csf3r. Interestingly, using gene set enrichment analysis,30 we observed that the list of downregulated targets was enriched for genes that were previously found to be deregulated in mice deficient for myeloid master regulators, such as Cebpa,31 Runx1,32,33 and Spi134,35 (Figure 4B). Particularly interesting was the downregulation of the Csf3r gene (Figure 4C), which encodes G-CSF-R, a major driver of granulocyte differentiation. Flow cytometric analysis demonstrated that G-CSF-R was indeed downregulated on the cell surface of dnTCF4 progenitors in comparison with WT (Figure 4D-E). Notably, the genomic region upstream of the CSF3R locus contains numerous copies of the extended TCF/LEF consensus binding sequence GCTTTG, suggesting that TCF/LEF factors might be directly involved in the regulation of CSF3R expression. Publicly available datasets from chromatin immunoprecipitation (ChIP)-sequencing experiments performed on various human cell lines consistently showed 2 TCF4 binding peaks in the putative regulatory regions of CSF3R gene (Figure 4F). A smaller peak was located in the transcription start site (TSS), whereas a more prominent peak was detected in a putative enhancer (defined by the presence of E-box, H3K4me3, H3K4me1, and H3K27ac histone marks) located ∼3.5 kb upstream of the CSF3R TSS. To validate whether TCF/LEF transcription factors occupy these regions in hematopoietic cells, we performed ChIP followed by quantitative PCR (qPCR) using anti-LEF1 antibody in K562 cells. We observed LEF1 enrichment in the TSS (R1) and the putative enhancer (R2, −3.3 kb) of CSF3R, but not in the negative control region (CR, −6.1 kb) (Figure 4G), suggesting that CSF3R expression is directly regulated by TCF/LEF. Altogether, these data indicate that the β-catenin-TCF/LEF transcription mediating complex promotes expression of genes involved in myeloid development and differentiation. In particular, our results indicate that activation of the β-catenin-TCF/LEF signaling pathway directly upregulates G-CSF-R levels in hematopoietic progenitor cells.
![Altered transcription profile in ST-HSCs upon dnTCF4 expression. (A) Volcano plot showing the differentially up- and downregulated genes in dnTCF4 ST-HSCs compared with WT ST-HSCs (n = 3 WT samples and n = 3 dnTCF4 samples, all isolated from 12-week-old mice). Numbers indicate the number of differentially expressed genes. (B) Transcription factor perturbations followed by expression analysis via online Enrichr tool. The list of downregulated genes in dnTCF4 ST-HSCs is enriched for genes that were deregulated in murine models with deletion (KO [knockout]) or overexpression (OE) of certain transcription factors. Gene Expression Omnibus accession numbers are indicated on the right. The x-axis indicates q values. (C) Quantitative RT-PCR in WT and dnTCF4 (dn) c-Kit+ cells. The y-axis represents Csf3r expression relative to the percentage of Gapdh. Data represent mean ± SD; n = 6 WT and n = 5 dnTCF4 samples. Two-tailed Student t test was used to assess statistical significance, **P < .01. (D) Flow cytometric analysis of G-CSF-R expression on the surface of WT and dnTCF4 LKS (left) and c-Kit+ cells (right). (E) Quantification of panel D. The y-axes indicate mean fluorescence intensity (MFI) for G-CSF-R levels. Data represent mean ± SD; n = 5 WT and n = 6 dnTCF4 samples. Two-tailed Student t test was used to assess statistical significance (**P < .01 and ***P < .001). (F) TCF4 binding profiles in the CSF3R gene locus in HEK293T, HepG2, MCF-7, PANC-1, and Hela S3 cells. The enhancer histone modification profiles (H3K4me2, H3K27ac, and H3K4me1) in the CSF3R gene locus in Hela S3 and HepG2 cells are also illustrated. Data were obtained from the ENCODE database. The arrow indicates direction of transcription; blue lines (bottom) depict positions of TCF/LEF consensus binding sequence GCTTTG; and boxes R1, R2, and CR describe the position of regions analyzed in the following ChIP-qPCR experiment. (G) ChIP-qPCR assay showing LEF1 binding to the TSS (R1), putative enhancer −3.3 kb from TSS (R2), and negative control region CR (−6.1 kb) of human CSF3R gene locus in cross-linked chromatin from K562 cells. The panel is a representative of 3 independent experiments, data represent mean ± SD.](https://ash.silverchair-cdn.com/ash/content_public/journal/blood/136/22/10.1182_blood.2019004664/1/m_bloodbld2019004664f4.png?Expires=1769320450&Signature=Ek0iTiFZqjU0fx58-cGr~Rym34P4w66JFPE9JN7gSFE6N8kjVSigByStCQwEWtAfXoUCahu3H-Oyczl-mgCS0-uMVqT0iK-ttQvIrWv3QNh15hQDxH9wuqeNgfWQVspgVzwQyjXAcxEpS7lwkeEdK3WVrV1VQ-T5o~F4yANYeXszLLh0S2c8P8ZNTSjmkY0uI~03QWa~9iYk1IIA9nmJbHS-cXzCGgtO5DdgIIPlaNwr~XXEd~yfa8TdaXNG9NF9BnGexuDfTQkoIK7j3Tztiz64Go2dBFgVlQtp39AmTM2fYasz-B7xcDiPvuBNfAD9Haw3Oc5rBj0-WrpBCVCykw__&Key-Pair-Id=APKAIE5G5CRDK6RD3PGA)
Altered transcription profile in ST-HSCs upon dnTCF4 expression. (A) Volcano plot showing the differentially up- and downregulated genes in dnTCF4 ST-HSCs compared with WT ST-HSCs (n = 3 WT samples and n = 3 dnTCF4 samples, all isolated from 12-week-old mice). Numbers indicate the number of differentially expressed genes. (B) Transcription factor perturbations followed by expression analysis via online Enrichr tool. The list of downregulated genes in dnTCF4 ST-HSCs is enriched for genes that were deregulated in murine models with deletion (KO [knockout]) or overexpression (OE) of certain transcription factors. Gene Expression Omnibus accession numbers are indicated on the right. The x-axis indicates q values. (C) Quantitative RT-PCR in WT and dnTCF4 (dn) c-Kit+ cells. The y-axis represents Csf3r expression relative to the percentage of Gapdh. Data represent mean ± SD; n = 6 WT and n = 5 dnTCF4 samples. Two-tailed Student t test was used to assess statistical significance, **P < .01. (D) Flow cytometric analysis of G-CSF-R expression on the surface of WT and dnTCF4 LKS (left) and c-Kit+ cells (right). (E) Quantification of panel D. The y-axes indicate mean fluorescence intensity (MFI) for G-CSF-R levels. Data represent mean ± SD; n = 5 WT and n = 6 dnTCF4 samples. Two-tailed Student t test was used to assess statistical significance (**P < .01 and ***P < .001). (F) TCF4 binding profiles in the CSF3R gene locus in HEK293T, HepG2, MCF-7, PANC-1, and Hela S3 cells. The enhancer histone modification profiles (H3K4me2, H3K27ac, and H3K4me1) in the CSF3R gene locus in Hela S3 and HepG2 cells are also illustrated. Data were obtained from the ENCODE database. The arrow indicates direction of transcription; blue lines (bottom) depict positions of TCF/LEF consensus binding sequence GCTTTG; and boxes R1, R2, and CR describe the position of regions analyzed in the following ChIP-qPCR experiment. (G) ChIP-qPCR assay showing LEF1 binding to the TSS (R1), putative enhancer −3.3 kb from TSS (R2), and negative control region CR (−6.1 kb) of human CSF3R gene locus in cross-linked chromatin from K562 cells. The panel is a representative of 3 independent experiments, data represent mean ± SD.
Altered transcription profile in ST-HSCs upon dnTCF4 expression. (A) Volcano plot showing the differentially up- and downregulated genes in dnTCF4 ST-HSCs compared with WT ST-HSCs (n = 3 WT samples and n = 3 dnTCF4 samples, all isolated from 12-week-old mice). Numbers indicate the number of differentially expressed genes. (B) Transcription factor perturbations followed by expression analysis via online Enrichr tool. The list of downregulated genes in dnTCF4 ST-HSCs is enriched for genes that were deregulated in murine models with deletion (KO [knockout]) or overexpression (OE) of certain transcription factors. Gene Expression Omnibus accession numbers are indicated on the right. The x-axis indicates q values. (C) Quantitative RT-PCR in WT and dnTCF4 (dn) c-Kit+ cells. The y-axis represents Csf3r expression relative to the percentage of Gapdh. Data represent mean ± SD; n = 6 WT and n = 5 dnTCF4 samples. Two-tailed Student t test was used to assess statistical significance, **P < .01. (D) Flow cytometric analysis of G-CSF-R expression on the surface of WT and dnTCF4 LKS (left) and c-Kit+ cells (right). (E) Quantification of panel D. The y-axes indicate mean fluorescence intensity (MFI) for G-CSF-R levels. Data represent mean ± SD; n = 5 WT and n = 6 dnTCF4 samples. Two-tailed Student t test was used to assess statistical significance (**P < .01 and ***P < .001). (F) TCF4 binding profiles in the CSF3R gene locus in HEK293T, HepG2, MCF-7, PANC-1, and Hela S3 cells. The enhancer histone modification profiles (H3K4me2, H3K27ac, and H3K4me1) in the CSF3R gene locus in Hela S3 and HepG2 cells are also illustrated. Data were obtained from the ENCODE database. The arrow indicates direction of transcription; blue lines (bottom) depict positions of TCF/LEF consensus binding sequence GCTTTG; and boxes R1, R2, and CR describe the position of regions analyzed in the following ChIP-qPCR experiment. (G) ChIP-qPCR assay showing LEF1 binding to the TSS (R1), putative enhancer −3.3 kb from TSS (R2), and negative control region CR (−6.1 kb) of human CSF3R gene locus in cross-linked chromatin from K562 cells. The panel is a representative of 3 independent experiments, data represent mean ± SD.
Suppression of the β-catenin-TCF/LEF transcription results in reduced response to G-CSF stimulation
Because we observed downregulation of G-CSF-R in dnTCF4 HSPCs, we next investigated whether cells with suppressed β-catenin-TCF/LEF-mediated transcription exhibited reduced response to G-CSF stimulation. BM cells were isolated from WT and dnTCF4 mice, treated with G-CSF, and the effect on JAK/STAT signaling pathway, a key pathway downstream of G-CSF-R, was assessed by flow cytometry. We observed reduced p-Stat3 in dnTCF4 HSPCs in comparison with WT cells (Figure 5A-B), whereas no differences in p-Stat5 levels and a marginal decrease in p-Jak2 were detected (supplemental Figure 5). Next, we determined the ability of WT and dnTCF4 BM cells to form colonies in semisolid cultures containing G-CSF and SCF. We observed that dnTCF4 cultures formed more colonies, which were smaller in size, and contained more immature (c-Kit+) cells in comparison with WT controls (Figure 5C-D). In addition, we demonstrated reduced percentage of mature neutrophils (Figure 5E) and reduced expression of CD11b, a marker of myeloid differentiation, in dnTCF4 cultures (Figure 5F-G). Altogether, these experiments demonstrate that the β-catenin-TCF/LEF transcription-mediating complex is required for proper response of HSPC to G-CSF stimulation.
![Reduced G-CSF-R signaling in dnTCF4 HSPCs. (A) Histogram plots indicate levels of Stat3 phosphorylation (p-Stat3) in WT and dnTCF4 cells (LKS on left; c-Kit+ cells on the right) upon G-CSF stimulation. Gray histogram represents background signal (fluorescence minus one control [FMO]). Analysis was performed at time point t = 0, t = 2, and t = 5 minutes. (B) Quantification of panel A; n = 4. (C) Colony-forming assay in MethoCult M3231 supplemented with G-CSF and SCF using WT and dnTCF4 BM cells. A total of 1 × 10⁴ BM cells was plated per well. The y-axis indicates total number of CFU per 1 × 10⁴ BM cells; n = 5 (D) Percentage of c-Kit+ immature cells in WT and dnTCF4 G-CSF/SCF semisolid cultures assessed by flow cytometric analysis; n = 3. (E) Flow cytometric analysis of Ly6C+ Ly6G+ (gated on CD11b+) in cells from WT and dnTCF4 G-CSF/SCF semisolid cultures. The y-axis indicates the percentage of mature neutrophils; n = 5. (F) Representative histogram plot. The x-axis shows CD11b expression in cells from WT and dnTCF4 G-CSF/SCF semisolid cultures. (G) Quantification of panel F; n = 3. Data represent mean ± SD; 2-tailed Student t test was used to assess statistical significance, *P < .05, **P < .01, ****P < .0001.](https://ash.silverchair-cdn.com/ash/content_public/journal/blood/136/22/10.1182_blood.2019004664/1/m_bloodbld2019004664f5.png?Expires=1769320450&Signature=fz2t5kNDFMbo~r4nGyi-EyAOkY0Fl~YD7Fp6N4KNfDveEwZOEuADJJDqeD~cX~M4knA3BWZ1RUA-mu9t3xtmoZwzLmBBjvnyiAhiYuZjEA-YPZTf2JV~SO57-SYDo11nrcq2ABBSwsFKyncyaNlk4G1t86r8Exe62zLbUy4502qYf1BPcELteKtSPGd6kbNjO~cT61PobUaXqC6inME3CRK26PJoP3ZUXVVPefzlC~pZDi7IRCa6AsbuGhDI6xvkcsJsRI1xD9PJhNo8lSUyU53iy5jyUQ2R~W7AZhrGxrKWIyzwyreJYYdIxXfj4ENUvNmOWMCAT7zcG3u-tcecXg__&Key-Pair-Id=APKAIE5G5CRDK6RD3PGA)
Reduced G-CSF-R signaling in dnTCF4 HSPCs. (A) Histogram plots indicate levels of Stat3 phosphorylation (p-Stat3) in WT and dnTCF4 cells (LKS on left; c-Kit+ cells on the right) upon G-CSF stimulation. Gray histogram represents background signal (fluorescence minus one control [FMO]). Analysis was performed at time point t = 0, t = 2, and t = 5 minutes. (B) Quantification of panel A; n = 4. (C) Colony-forming assay in MethoCult M3231 supplemented with G-CSF and SCF using WT and dnTCF4 BM cells. A total of 1 × 10⁴ BM cells was plated per well. The y-axis indicates total number of CFU per 1 × 10⁴ BM cells; n = 5 (D) Percentage of c-Kit+ immature cells in WT and dnTCF4 G-CSF/SCF semisolid cultures assessed by flow cytometric analysis; n = 3. (E) Flow cytometric analysis of Ly6C+ Ly6G+ (gated on CD11b+) in cells from WT and dnTCF4 G-CSF/SCF semisolid cultures. The y-axis indicates the percentage of mature neutrophils; n = 5. (F) Representative histogram plot. The x-axis shows CD11b expression in cells from WT and dnTCF4 G-CSF/SCF semisolid cultures. (G) Quantification of panel F; n = 3. Data represent mean ± SD; 2-tailed Student t test was used to assess statistical significance, *P < .05, **P < .01, ****P < .0001.
Reduced G-CSF-R signaling in dnTCF4 HSPCs. (A) Histogram plots indicate levels of Stat3 phosphorylation (p-Stat3) in WT and dnTCF4 cells (LKS on left; c-Kit+ cells on the right) upon G-CSF stimulation. Gray histogram represents background signal (fluorescence minus one control [FMO]). Analysis was performed at time point t = 0, t = 2, and t = 5 minutes. (B) Quantification of panel A; n = 4. (C) Colony-forming assay in MethoCult M3231 supplemented with G-CSF and SCF using WT and dnTCF4 BM cells. A total of 1 × 10⁴ BM cells was plated per well. The y-axis indicates total number of CFU per 1 × 10⁴ BM cells; n = 5 (D) Percentage of c-Kit+ immature cells in WT and dnTCF4 G-CSF/SCF semisolid cultures assessed by flow cytometric analysis; n = 3. (E) Flow cytometric analysis of Ly6C+ Ly6G+ (gated on CD11b+) in cells from WT and dnTCF4 G-CSF/SCF semisolid cultures. The y-axis indicates the percentage of mature neutrophils; n = 5. (F) Representative histogram plot. The x-axis shows CD11b expression in cells from WT and dnTCF4 G-CSF/SCF semisolid cultures. (G) Quantification of panel F; n = 3. Data represent mean ± SD; 2-tailed Student t test was used to assess statistical significance, *P < .05, **P < .01, ****P < .0001.
Inhibition of the β-catenin-TCF/LEF transcription-mediating complex compromises emergency granulopoiesis in vivo
Given the crucial role of the G-CSF-R in emergency granulopoiesis,36 we determined how dnTCF4 mice respond to infection. First, we challenged WT and dnTCF4 mice with high doses of LPS to mimic a severe systemic infection26,27 (Figure 6A). We observed that the percentage of mature neutrophils (CD11b+ Ly6Ghi) in blood was drastically increased in WT mice upon LPS administration, whereas in dnTCF4 mice, this increase was less profound (Figure 6B; supplemental Figure 6A). Accordingly, similar tendencies were observed in absolute blood neutrophil counts (Figure 6C). Egress of mature neutrophils from the BM to blood appeared to be equally efficient in WT and dnTCF4 mice upon LPS treatment, as reflected by the percentage of leftover mature neutrophils in BM (Figure 6D; supplemental Figure 6B). Interestingly, dnTCF4 mice showed insufficient production of immature granulocytes (CD11b+ Ly6Glo) in BM (Figure 6E; supplemental Figure 6B), and significantly reduced frequency of myeloid progenitors (Figure 6F). In particular, skewing of myeloid progenitors toward GMPs, a critical step for the continuation of emergency granulopoiesis,1 was absent in dnTCF4 mice (Figure 6G). Following this poor response of dnTCF4 mice to LPS administration, we observed that dnTCF4 mice were more susceptible to Candida albicans than WTT control mice, and exhibit reduced survival in comparison with control animals (Figure 6H). Importantly, the levels of G-CSF before and upon LPS injection were comparable in WT and dnTCF4 mice, thus not accounting for the poor response (supplemental Figure 6C). Further, superoxide production, migration, and phagocytosis of WT and dnTCF4 neutrophils were similar (supplemental Figure 6D-H), thus probably not contributing to the increased sensitivity of dnTCF4 mice to infection. Next, we determined whether the lack of myeloid progenitor activity and failure to replenish BM neutrophils would contribute to the increased susceptibility of dnTCF4 mice to stress. To this aim, WT and dnTCF4 mice were injected with 5-FU, a pyrimidine analog commonly used to cell-deplete murine BM, and the effects on blood composition and regeneration were assessed (Figure 6I). We observed that after 1 dose of 5-FU the number of neutrophils in blood was similarly reduced in WT and dnTCF4 mice (Figure 6J). However, although blood neutrophils in WT mice recovered to exceed steady-state levels at day 14 as previously reported,37 dnTCF4 mice failed to exhibit this enhanced regeneration (Figure 6J). In addition, upon several doses of 5-FU, dnTCF4 mice demonstrated significant weight loss (Figure 6K) and succumbed to the stress (Figure 6L). Altogether, these experiments indicate that the β-catenin-TCF/LEF signaling pathway is necessary to enter the second phase of emergency granulopoiesis, and thus is required for the proper immune response during microbial infection.
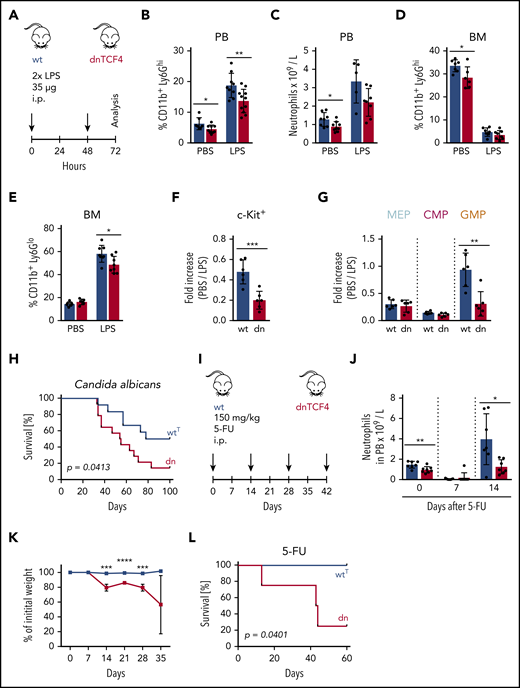
Impaired response of dnTCF4 mice to emergency granulopoiesis. (A) Schematic representation of the experimental setup. WT and dnTCF4 mice were injected intraperitoneally (i.p.) with 35 μg of LPS at t = 0 and t = 48 hours. Analysis was performed 24 hours after last injection. (B) Percentage of CD11b+ Ly6Ghi cells in PB of WT and dnTCF4 mice treated with PBS or LPS. Each group contained at least 8 animals from 2 independent experiments. (C) Number of neutrophils per liter (L) in PB based on an auto hematology analyzer. WT and dnTCF4 mice were treated with PBS or LPS as indicated. At least 5 mice were included in each group. (D) Percentage of CD11b+ Ly6Ghi cells in BM of WT and dnTCF4 mice treated with PBS or LPS. Each group contained at least 6 animals from 2 independent experiments. (E) Percentage of immature granulocytes (CD11b+ Ly6Glo) in BM of WT and dnTCF4 mice treated with PBS or LPS. Each group contained at least 6 animals from 2 independent experiments. Quantification of (F) c-Kit+ cells and (G) myeloid progenitors in BM from WT and dnTCF4 mice. The y-axes indicate the fold increase from PBS to LPS treatment; n = 5-6 animals from 2 independent experiments. (H) Kaplan-Meier survival analysis of WTT (n = 12) and dnTCF4 (n = 14) mice that were intravenously injected with 2 consecutive doses of Candida albicans (5 × 10⁵ CFU at experimental days 0 and 25). Mantle-Cox test was used to assess statistical significance of obtained results (P = .0413). (I) Schematic representation of the experimental setup. WT and dnTCF4 mice were injected intraperitoneally (i.p.) with 150 mg/kg 5-FU as indicated (black arrows). The y-axis indicates duration of the experiment in days. (J) Number of neutrophils per liter (L) in PB based on auto hematology analyzer. WT and dnTCF4 mice were treated with 1 injection of 5-FU. Y-axis indicates days of analysis; n = 7. (K) WT and dnTCF4 relative weight upon 5-FU treatment as indicated in panel I. The y-axis indicates the percentage of initial weight (day 0). The x-axis shows days of treatment as indicated in panel I. (L) Kaplan-Meier survival analysis of WTT (n = 4) and dnTCF4 (n = 4) mice intravenously injected with 5-FU as indicated in panel I. Mantle-Cox test was used to assess statistical significance of obtained results (P = .0401). Data in Figure 6 represent mean ± SD, and unless otherwise indicated, 2-tailed Student t test was used to assess statistical significance (*P < .05, **P < .01, ***P < .001, and ****P < .0001). In panels B-G and J, each black dot symbol represents 1 animal.
Impaired response of dnTCF4 mice to emergency granulopoiesis. (A) Schematic representation of the experimental setup. WT and dnTCF4 mice were injected intraperitoneally (i.p.) with 35 μg of LPS at t = 0 and t = 48 hours. Analysis was performed 24 hours after last injection. (B) Percentage of CD11b+ Ly6Ghi cells in PB of WT and dnTCF4 mice treated with PBS or LPS. Each group contained at least 8 animals from 2 independent experiments. (C) Number of neutrophils per liter (L) in PB based on an auto hematology analyzer. WT and dnTCF4 mice were treated with PBS or LPS as indicated. At least 5 mice were included in each group. (D) Percentage of CD11b+ Ly6Ghi cells in BM of WT and dnTCF4 mice treated with PBS or LPS. Each group contained at least 6 animals from 2 independent experiments. (E) Percentage of immature granulocytes (CD11b+ Ly6Glo) in BM of WT and dnTCF4 mice treated with PBS or LPS. Each group contained at least 6 animals from 2 independent experiments. Quantification of (F) c-Kit+ cells and (G) myeloid progenitors in BM from WT and dnTCF4 mice. The y-axes indicate the fold increase from PBS to LPS treatment; n = 5-6 animals from 2 independent experiments. (H) Kaplan-Meier survival analysis of WTT (n = 12) and dnTCF4 (n = 14) mice that were intravenously injected with 2 consecutive doses of Candida albicans (5 × 10⁵ CFU at experimental days 0 and 25). Mantle-Cox test was used to assess statistical significance of obtained results (P = .0413). (I) Schematic representation of the experimental setup. WT and dnTCF4 mice were injected intraperitoneally (i.p.) with 150 mg/kg 5-FU as indicated (black arrows). The y-axis indicates duration of the experiment in days. (J) Number of neutrophils per liter (L) in PB based on auto hematology analyzer. WT and dnTCF4 mice were treated with 1 injection of 5-FU. Y-axis indicates days of analysis; n = 7. (K) WT and dnTCF4 relative weight upon 5-FU treatment as indicated in panel I. The y-axis indicates the percentage of initial weight (day 0). The x-axis shows days of treatment as indicated in panel I. (L) Kaplan-Meier survival analysis of WTT (n = 4) and dnTCF4 (n = 4) mice intravenously injected with 5-FU as indicated in panel I. Mantle-Cox test was used to assess statistical significance of obtained results (P = .0401). Data in Figure 6 represent mean ± SD, and unless otherwise indicated, 2-tailed Student t test was used to assess statistical significance (*P < .05, **P < .01, ***P < .001, and ****P < .0001). In panels B-G and J, each black dot symbol represents 1 animal.
Inhibition of the β-catenin-TCF/LEF signaling pathway reduces granulopoiesis, whereas its activation promotes neutrophilic differentiation of human primary CD34+ HSPCs
Because our data indicated that dnTCF4 expression restricts myeloid differentiation of murine cells, we next determined whether modulation of the β-catenin-TCF/LEF signaling pathway would affect human neutrophilic differentiation. First, dnTCF4 was introduced into primary human CD34+ cells isolated from cord blood (Figure 7A). We observed that dnTCF4-expressing cells exhibited reduced neutrophilic differentiation in comparison with empty vector-infected cells, as assessed by expression of mature neutrophil markers (Figure 7B). Second, we assessed whether this effect driven by genetic manipulation of the β-catenin-TCF/LEF transcriptional activity could be reproduced by chemical inhibition of the pathway. CD34+ cells were cultured in the presence or absence of Cercosporin, a small chemical compound previously reported to inhibit the interaction of β-catenin with TCF/LEF38-40 (Figure 7C). We observed that human cells cultured with 1 μM Cercosporin demonstrated significantly diminished neutrophilic differentiation in comparison with DMSO control (Figure 7D). Because our results indicate that genetic and chemical disruption of the β-catenin-TCF/LEF complex impair neutrophilic differentiation, we next investigated whether activation of the Wnt pathway in human primary HSPCs would promote myeloid differentiation. CD34+ cells were cultured in semisolid medium in the presence or absence of small molecule compounds that specifically activate β-catenin signaling (BIO and CHIR99021). We observed that the number of colonies was similar in all conditions (Figure 7E); however, flow cytometric analysis revealed that cells stimulated with BIO and CHIR99021 exhibited increased expression of the myeloid differentiation marker CD11b (Figure 7F-H). Altogether, our results indicate that manipulation of the canonical Wnt signaling pathway modulates myeloid differentiation of human CD34+ cells. In particular, we demonstrate that inhibition of the Wnt/β-catenin signaling pathway blocks neutrophilic differentiation, whereas its activation leads to enhanced myeloid differentiation of human HSPCs.
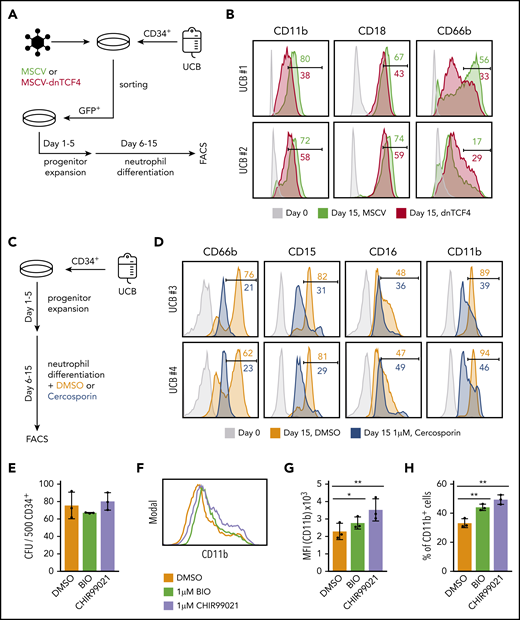
The β-catenin-TCF/LEF signaling pathway regulates myeloid differentiation of human CD34+ cells. (A) Schematic representation of the experimental procedure. CD34+ cells were isolated from human umbilical cord blood (UCB) and infected with empty vector (MSCV) or dnTCF4 (MSCV-dnTCF4) expressing retroviral particles. Three days after infection, GFP+ cells were sorted, cultured in progenitor expansion medium for 5 days (days 1-5), and then cultured in neutrophil differentiation medium for 10 days (days 6-15). (B) Flow cytometry analysis of 2 human samples (UCB #1 and UCB #2). Expression of CD11b, CD18, and CD66b was determined before infection (day 0) and at the end of differentiation (day 15). MSCV histograms are shown in green and dnTCF4 are shown in red. Numbers indicate percentage of positive cells. (C) Schematic representation of the experimental procedure. CD34+ cells were isolated from human UCB. Culture conditions and days of culture are indicated. DMSO or Cercosporin (a β-catenin-TCF/LEF interaction inhibitor) were added to the neutrophil differentiation medium. (D) Flow cytometry analysis of 2 human samples (UCB #3 and UCB #4). Expression of CD66b, CD15, CD16, and CD11b was determined at day 0 (before treatment, light gray histogram) or after 10 days of culture in differentiation medium without (orange histogram) or with 1 μM Cercosporin (blue histogram). Numbers indicate percentage of positive cells. (E) Quantification of CFU in semisolid cultures (day 10). Human CD34+ cells isolated from cord blood were plated in the presence of DMSO control (0.01%) or the GSK3β inhibitors BIO (1 μM) and CHIR99021 (1 μM) (of note, GSK3β inhibitors cause β-catenin stabilization). The y-axis indicates the number of colonies per 500 input cells. (F) Representative histogram plot of cells harvested on day 10 from semisolid cultures. The x-axis indicates CD11b expression. (G) Quantification of panel F. (H) Percentage of CD11b+ cells in DMSO, BIO, and CHIR99021 containing semisolid cultures assessed by flow cytometry after 10 days of culture. Data in Figure 7E,G-H represent mean ± SD, n = 3 per group, 2-tailed Student t tests were used to assess statistical significance, *P < .05 **P < .01. Each black dot symbol represents 1 human sample.
The β-catenin-TCF/LEF signaling pathway regulates myeloid differentiation of human CD34+ cells. (A) Schematic representation of the experimental procedure. CD34+ cells were isolated from human umbilical cord blood (UCB) and infected with empty vector (MSCV) or dnTCF4 (MSCV-dnTCF4) expressing retroviral particles. Three days after infection, GFP+ cells were sorted, cultured in progenitor expansion medium for 5 days (days 1-5), and then cultured in neutrophil differentiation medium for 10 days (days 6-15). (B) Flow cytometry analysis of 2 human samples (UCB #1 and UCB #2). Expression of CD11b, CD18, and CD66b was determined before infection (day 0) and at the end of differentiation (day 15). MSCV histograms are shown in green and dnTCF4 are shown in red. Numbers indicate percentage of positive cells. (C) Schematic representation of the experimental procedure. CD34+ cells were isolated from human UCB. Culture conditions and days of culture are indicated. DMSO or Cercosporin (a β-catenin-TCF/LEF interaction inhibitor) were added to the neutrophil differentiation medium. (D) Flow cytometry analysis of 2 human samples (UCB #3 and UCB #4). Expression of CD66b, CD15, CD16, and CD11b was determined at day 0 (before treatment, light gray histogram) or after 10 days of culture in differentiation medium without (orange histogram) or with 1 μM Cercosporin (blue histogram). Numbers indicate percentage of positive cells. (E) Quantification of CFU in semisolid cultures (day 10). Human CD34+ cells isolated from cord blood were plated in the presence of DMSO control (0.01%) or the GSK3β inhibitors BIO (1 μM) and CHIR99021 (1 μM) (of note, GSK3β inhibitors cause β-catenin stabilization). The y-axis indicates the number of colonies per 500 input cells. (F) Representative histogram plot of cells harvested on day 10 from semisolid cultures. The x-axis indicates CD11b expression. (G) Quantification of panel F. (H) Percentage of CD11b+ cells in DMSO, BIO, and CHIR99021 containing semisolid cultures assessed by flow cytometry after 10 days of culture. Data in Figure 7E,G-H represent mean ± SD, n = 3 per group, 2-tailed Student t tests were used to assess statistical significance, *P < .05 **P < .01. Each black dot symbol represents 1 human sample.
Discussion
The Wnt/β-catenin signaling pathway is essential during embryonic development and controls stem and progenitor maintenance and fate in several adult tissues including the gut, the skin, the bone, and the hematopoietic system.41,42 However, its role in hematopoiesis has been largely controversial and dependent on the experimental systems used. In fact, the Wnt/β-catenin signaling pathway has been shown to be beneficial,10-12,15,17 detrimental,18,19 or neutral20-22 to adult HSPCs. Here, we show that the β-catenin-TCF/LEF transcription-mediating complex is crucial for proper differentiation of myeloid progenitors into granulocytes in steady-state and emergency granulopoiesis. It was previously reported that this pathway is critical for T-cell development43,44 and B-cell proliferation45,46 ; however, to our knowledge, this is the first report providing evidence for the role of Wnt/β-catenin signaling in steady-state and emergency granulopoiesis.
To resolve the inconsistent results regarding the role of the Wnt/β-catenin signaling pathway in hematopoiesis and interpret the data properly, it is important to take into account at what level the pathway was perturbed. In the present study, we used a murine model that suppresses the β-catenin-TCF/LEF transcription activity. Introduction of an N-terminally truncated form of human TCF4 (dnTCF4) was chosen because it was previously shown to preserve the ability to interact with promoters of Wnt-target genes while preventing binding of β-catenin and thus inhibiting β-catenin-TCF/LEF-mediated transcription.47,48 Additionally, the used TCF4 variant contains the C-clamp motif that represents an additional DNA-interacting domain.49,50 This domain targets the GC-rich “helper” sequence in the promoter of some Wnt-target genes, and consequently dnTCF4 binds and blocks the whole spectrum of β-catenin-TCF/LEF-regulated genes.51,52 In this context, the noncanonical Wnt signaling pathway and the β-catenin cytoplasmic functions are preserved in our experimental system, allowing us to study the specific role of the β-catenin-TCF/LEF transcription-mediating complex. Additionally, in this setup, the β-catenin independent activity of TCF/LEF transcription factors, which seems to be crucial for example during T-cell development,12,20,21 is preserved, explaining the absence of phenotype on T-cell development in our mouse model. Importantly, as shown by our RNA sequencing data, introduction of dnTCF4 in hematopoietic cells did not affect expression of other components of the Wnt signaling, including endogenous TCF/LEF proteins and β-catenin. Overall, our observations are in line with previous publications demonstrating a critical role of the Wnt/β-catenin signaling pathway in HSPCs,10-13,15,17 and in addition, elucidated a novel role of the β-catenin-TCF/LEF transcription-mediating complex in neutrophilic differentiation.
Adjusting the production of granulocytes according to specific needs is critical for the health and survival of an individual. We showed that β-catenin-TCF/LEF transcription regulation contributes to steady-state and emergency granulopoiesis; however, the degree of involvement in these processes is different. Although β-catenin-TCF/LEF activity fine tunes differentiation of HSPCs toward mature granulocytes during steady-state granulopoiesis, it is critical during the emergency response. However, we cannot exclude that the relatively mild phenotype in basal granulopoiesis is a direct consequence of housing the mice in specific-pathogen-free conditions. We hypothesize that this artificial and “sterile” surrounding might cover up a more profound effect that could be visible in a natural environment.
In humans, however, the involvement of canonical Wnt signaling pathway in steady-state granulopoiesis might be more profound. Our data demonstrate that genetic and chemical modulation of the canonical Wnt signaling pathway affects granulocytic differentiation of human HSPCs. In particular, we observed that inhibition or activation of β-catenin-TCF/LEF activity results in impaired or enhanced granulocytic differentiation of human CD34+ cells, respectively. Skokowa and colleagues demonstrated that myeloid progenitors from patients suffering from congenital neutropenia, a hematological disorder characterized by impaired maturation of neutrophils, present reduced levels of LEF1.53,54 They showed that neutrophilic differentiation could be rescued by preventing the degradation of LEF-1 in CD34+ cells isolated from congenital neutropenia patients.55 These observations can be now supported by our present study and the proposed role of β-catenin-TCF/LEF-mediated transcription in granulopoiesis. They suggested that this phenomenon is mediated by activation of the myeloid master regulator CEBPA by LEF-1. In our setup, although we observed a significant similarity in gene expression profile between our dnTCF4 mouse model and Cebpa KO mice, we did not observe that the β-catenin-TCF/LEF complex would directly regulate Cebpa expression. Together, these studies indicate that CEBPA levels are modulated by TCF/LEF factors in a β-catenin independent fashion.
Most of the patients suffering from congenital neutropenia, similarly to our dnTCF4 mice, exhibit poor response to G-CSF and altered G-CSF signaling.56-59 The JAK/STAT signaling pathway is downstream of G-CSF-R; although activation of STAT3 has been implicated in G-CSF-mediated differentiation, STAT5 mediates G-CSF-mediated proliferation and survival. Accordingly, dnTCF4 mice exhibit reduced p-Stat3 levels upon G-CSF stimulation, whereas p-Stat5 expression is not affected, consistent with our results showing no effect of dnTCF4 on cell cycle and proliferation of HSPCs. Further, although expression of other receptors upstream of JAK/STAT (such as FLT3-R, TPO-R, GM-CSF-R, interleukin-3-R, interleukin-6-R, and EPO-R) were not altered in dnTCF4 mice in comparison with WT, we cannot exclude that additional proteins might interfere with Stat3 phosphorylation in dnTCF4 mice. Further studies should deepen on the molecular mechanisms by which these transcription factors, either in a β-catenin dependent or independent fashion, modulate production of neutrophils in health and disease.
Emergency granulopoiesis consist of 4 phases: (1) rapid release of granulocytes from the BM; (2) expansion of myeloid progenitors; (3) accelerated differentiation; and (4) termination of the response and reestablishment of steady-state granulopoiesis.36,60 Our data indicate dnTCF4-expressing mice have a normal response to LPS during the first step of emergency granulopoiesis, as shown by the efflux of granulocytes from BM to blood. However, the number of granulocytes in blood after LPS is reduced because the starting number of granulocytes in dnTCF4 BM is lower than in WT BM. Additionally, granulocytes from dnTCF4 appear to be as functional as WT granulocytes, as determined by their ability to migrate, phagocytose bacteria, and produce ROS. Remarkably, we observed that the β-catenin-TCF/LEF complex formation is required during the second phase of emergency granulopoiesis, which requires enhanced progenitor activity. In fact, amplification of myeloid progenitors was completely abolished in dnTCF4 mice, suggesting that the β-catenin-TCF/LEF transcription-mediating complex is essential to mediate emergency granulopoiesis. Remarkably, after 5-FU treatment, we observed insufficient myeloid recovery in dnTCF4 mice, followed by significant weight loss and increased mortality. Interestingly, Herault and colleagues observed accumulation of nuclear β-catenin in myeloid progenitors during early phase of hematopoietic recovery after 5-FU treatment.37 Thus, together with our study, these experiments demonstrate that the β-catenin-TCF/LEF transcription-mediating complex is critical for BM and granulocytic recovery upon stress conditions. Further, our data allow us to speculate that these recoveries are mediated by direct upregulation of the G-CSF-R by the β-catenin-TCF/LEF complex. Nevertheless, future studies should further investigate the contribution of the Wnt/β-catenin signaling pathway in emergency granulopoiesis and dissect additional molecular mechanisms regulating this process.
The data reported in this article have been deposited in the Gene Expression Omnibus (accession number GSE139668).
The online version of this article contains a data supplement.
The publication costs of this article were defrayed in part by page charge payment. Therefore, and solely to indicate this fact, this article is hereby marked “advertisement” in accordance with 18 USC section 1734.
Acknowledgments
The flow cytometry data presented in this paper were produced at the Flow Cytometry Core Facility, Institute of Molecular Genetics (IMG) of the Czech Academy of Sciences, Prague, Czech Republic. The authors thank the Phenotyping Module of Czech Centre for Phenogenomics, Vestec, Czech Republic, funded by projects LM2015040 and LM2018126 from MEYS and project OP RDI CZ.1.05/2.1.00/19.0395 from MEYS and ERDF, for help with assessing whole blood and differential cell counts. The authors also thank Ivo Touw and Ono Roovers for providing us with biotinylated G-CSF and Petr Bartunek for providing us with human CD34+ cells, Marina Mallol Ballester for technical assistance, and Danielle Tenen for technical advice during sequencing sample preparation.
The study was supported by GACR (Czech Science Foundation) grant 17-02177S and by institutional funding from the IMG (RVO 68378050) (M.A.-J.), a GA UK fellowship (project no. 1278217) from Charles University in Prague, an EHA Short-Term Collaboration Award (P.D.), the Singapore Ministry of Health's National Medical Research Council under its Singapore Translational Research (STaR) Investigator Award, the National Research Foundation Singapore and the Singapore Ministry of Education under its Research Centres of Excellence initiative, and National Institutes of Health, National Cancer Institute grants R35CA197697 and CA66996 and National Heart, Lung, and Blood Institute grant HL131477 (D.G.T.). R.T.-M. was supported by a doctoral scholarship from the Cancer Science Institute of Singapore.
Authorship
Contribution: M.A.-J. conceived and designed the study; P.D., M.K., E.K., Q.Z., K.V., M.F., C.L.-A., and L.J. carried out experiments; S.R. and R.P. collected, stored, and provided human cord blood; P.D., M.K., T. Benoukraf, R.T.-M., V.K., T. Brdicka, M.B., D.G.T., and M.A.-J. performed data analysis and interpretation; P.D. and M.A.-J. wrote the manuscript; and all authors revised the final manuscript.
Conflict-of-interest disclosure: The authors declare no competing financial interests.
Correspondence: Meritxell Alberich-Jorda, Institute of Molecular Genetics of the CAS, Department of Hemato-oncology, Videnska 1083, 142 20 Prague 4, Czech Republic; e-mail: alberich@img.cas.cz.

This feature is available to Subscribers Only
Sign In or Create an Account Close Modal