

Key Points
TMT-SPS-MS3 proteomics methods quantify >3000 significant phosphorylation events initiating and progressing platelet GPVI signaling.
Causal analysis infers and organizes >300 signaling relations among established and more novel effectors in platelet GPVI/ITAM responses.

Abstract
Platelets engage cues of pending vascular injury through coordinated adhesion, secretion, and aggregation responses. These rapid, progressive changes in platelet form and function are orchestrated downstream of specific receptors on the platelet surface and through intracellular signaling mechanisms that remain systematically undefined. This study brings together cell physiological and phosphoproteomics methods to profile signaling mechanisms downstream of the immunotyrosine activation motif (ITAM) platelet collagen receptor GPVI. Peptide tandem mass tag (TMT) labeling, sample multiplexing, synchronous precursor selection (SPS), and triple stage tandem mass spectrometry (MS3) detected >3000 significant (false discovery rate < 0.05) phosphorylation events on >1300 proteins over conditions initiating and progressing GPVI-mediated platelet activation. With literature-guided causal inference tools, >300 site-specific signaling relations were mapped from phosphoproteomics data among key and emerging GPVI effectors (ie, FcRγ, Syk, PLCγ2, PKCδ, DAPP1). Through signaling validation studies and functional screening, other less-characterized targets were also considered within the context of GPVI/ITAM pathways, including Ras/MAPK axis proteins (ie, KSR1, SOS1, STAT1, Hsp27). Highly regulated GPVI/ITAM targets out of context of curated knowledge were also illuminated, including a system of >40 Rab GTPases and associated regulatory proteins, where GPVI-mediated Rab7 S72 phosphorylation and endolysosomal maturation were blocked by TAK1 inhibition. In addition to serving as a model for generating and testing hypotheses from omics datasets, this study puts forth a means to identify hemostatic effectors, biomarkers, and therapeutic targets relevant to thrombosis, vascular inflammation, and other platelet-associated disease states.
Introduction
Platelets undergo orchestrated transitions in phenotype essential to hemostasis as well as to support inflammatory, immunological, developmental, and other physiological responses.1 Platelet hemostatic, inflammatory, and other programs are typically initiated by glycoprotein receptor complexes (ie, GPIb-V-IX, GPVI-FcγR) that anchor and activate platelets at damaged or dysfunctional endothelium2,3 ; there, local extracellular cues from platelets and other surrounding cells act on platelet G protein-coupled and other receptors to progress intracellular signaling events and specific cell-level outputs in physiological context.4-6 Despite knowledge of numerous molecular mediators critical to platelet function, it remains unclear how signals from multiple platelet receptors coordinate platelet responses. Furthermore, it is unknown how these same intracellular systems regulate procoagulant and inflammatory processes in chronic disease states, where immunoreceptor tyrosine-based activation motif (ITAM)-containing receptors including GPVI play key roles in thrombo-inflammatory as well as hemostatic and other responses.7
Upon encountering subendothelial collagen or other cues at dysfunctional endothelial surfaces,8 intracellular signals downstream of GPVI trigger a near instantaneous platelet shape change through ITAM, Src family kinase (SFK), and second messenger signaling systems, all largely driven by reversible protein phosphorylation, to mediate platelet aggregation and hemostatic plug formation.1 Despite central roles in vascular health and disease states,9,10 platelet GPVI signaling systems have not yet been comprehensively characterized with high-resolution liquid chromatography tandem mass spectrometry and phosphoproteomics methods. Recent advances in instrumentation and methodology have synergistically improved the accuracy and depth of phosphoproteomics experiments.11 In particular, tandem mass tag (TMT) peptide labeling,12 sample multiplexing and simultaneous analysis of multiple phosphopeptide reporter ion fragments through synchronous precursor selection (SPS) and triple stage tandem mass spectrometry (MS3) scans offers a powerful means to quantify differences among multiple biological replicates.13-17 Accordingly, TMT labeling and SPS-MS3 tools are well suited to measure global changes in protein phosphorylation downstream of receptor systems such as GPVI, and quantitatively define phenotypic transitions of platelets and other biologically relevant cell types at a molecular level.18-22
Here, we profile and map GPVI-mediated platelet signaling mechanisms through a combination of physiological, TMT-SPS-MS3 (phospho)proteomics, and computational methods. Using experimental conditions that initiate and progress platelet GPVI responses, we measure >3000 significantly altered phosphorylation events in platelets associated with GPVI/ITAM-mediated progression of platelet adhesion, secretion, and aggregation responses. With algorithms that infer cause-effect relationships from pathway knowledge in curated literature,23,24 we map >300 relations among significantly modified proteins to provide testable explanations of, and validate how, signaling events are placed into GPVI-mediated pathways. In addition to advancing integrated models of signaling events in platelet activation, this work establishes methods to generate and test hypotheses from omics data to profile phenotypes of platelets and other cells for mechanistic and translational studies.
Methods
See supplemental Information on the Blood Web site for methods and data availability.
Results
Delineating GPVI-mediated platelet responses
To specify how platelet responses progress following activation of the ITAM-coupled collagen receptor GPVI (supplemental Figures 1 and 2), we first conducted platelet physiological studies. Purified human platelets readily aggregated following stimulation with the GPVI-specific agonist, crosslinked collagen-related peptide25 (CRP-XL) (Figure 1A). Platelet aggregation in response to 10 μg/mL CRP-XL was abrogated by a combination of apyrase, indomethacin and Integrilin (“+all”). These antiplatelet agents each inhibit feedback potentiation of platelet activation by ADP release, thromboxane generation, and integrin αIIbβ3 activation, respectively (supplemental Figures 1 and 2).26,27 Integrilin alone inhibited CRP-XL-induced platelet aggregation by 69.4% (P = .0008), whereas apyrase reduced aggregation to a less significant extent (35.8% reduction; P < .05). Flow cytometry analyses determined that 83.9% (P < .0001) of CRP-XL stimulated platelets were positive for integrin αIIbβ3 activation in a manner abolished by Integrilin and significantly reduced by apyrase treatment (64.4% reduction; P < .0001) (Figure 1B). Platelet F-actin content also increased 2.6-fold following CRP-XL stimulation in a manner significantly decreased by apyrase treatment (Figure 1C).
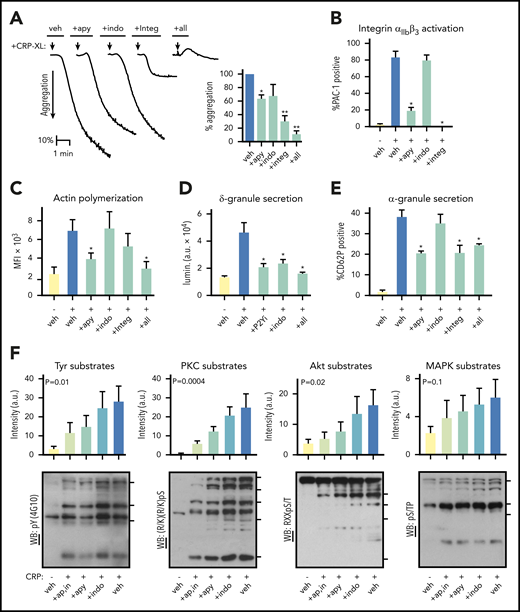
Progression of GPVI-mediated platelet responses. (A) Replicate samples (n = 3) of washed human platelets (2 × 10⁸/mL) were incubated with apyrase (2 U/mL), indomethacin (10 μM), Integrilin (20 μg/mL), and a combination thereof (“+all”) or vehicle alone (“veh”). Following the addition of the GPVI-specific agonist crosslinked collagen-related peptide (CRP-XL, 10 μg/mL) at t = 0 (arrow), platelet suspensions were monitored by Born light transmission aggregometry under stirring conditions at 37°C. Representative aggregation traces are shown (left) and quantified for percent aggregation relative to control (right, *P < .01). (B) Replicate samples (n = 3) of washed human platelets (2 × 10⁸/mL) were incubated with apyrase, indomethacin, Integrilin, or vehicle alone before stimulation with 10 μg/mL CRP-XL in the presence of fluorescently labeled antisera against the active conformation of human integrin αIIbβ3 (FITC-PAC-1). After 30 minutes, samples were analyzed by flow cytometry. The percentage of FITC-PAC-1+, platelet-gated events per condition is shown (**P < .001; *P < .05; for indomethacin, P = .0850). (C) Platelets as prepared above were fixed in paraformaldehyde, permeabilized, and stained for filamentous actin with TRITC-phalloidin before flow cytometry analysis. Mean fluorescence intensity (MFI) for TRITC-phalloidin stained platelet-gated events are shown. (*P < .001). (D) Replicate samples (n = 3) of washed human platelets (2×10⁸/mL) were incubated with P2Y1 and P2Y12 inhibitors (“+P2Yi”; 10 μM MRS 2179 and 10 μM AR-C 66096), indomethacin, or a combination thereof (“+all”) or vehicle alone. Following the addition of Chrono-Lume reagent and CRP-XL, ATP-dependent luciferase luminescence (lumin.) was measured as an indicator of platelet ADP release and δ-granule secretion (*P < .0001). a.u., arbitrary units. (E) Platelets were prepared as previously, before stimulation with 10 μg/mL CRP-XL in the presence of anti-CD62P-APC. After 30 minutes, samples were analyzed by flow cytometry. The percentage of CD62P+ platelet-gated events per condition quantifies platelet α-granule secretion (*P < .01). (F) Replicate samples of washed human platelets (5 × 10⁸/mL) were prepared as described before stimulation with CRP-XL. After 5 minutes, platelets were collected into Laemmli sample buffer, separated by sodium dodecyl sulfate-polyacrylamide gel electrophoresis, transferred to nitrocellulose, and analyzed for phosphorylation of consensus tyrosine kinase, PKC, Akt, and MAPK substrates motifs by western blot. Blot lane pixel intensities as measured in Image J are graphed above respective lanes as fold change relative to control. Significance (P) of intensity measurements are shown for analysis of variance test for trend. Tick marks on right side of each blot panel show positions of molecular weight (MW) markers for 4G10 (top to bottom: 150, 75, 60 kD), PKC substrates (180, 130, 100, 75, 50 kD), Akt substrates (75, 63, 45, 35 kD), and MAPK substrates (150, 100, 80 kD). Additional experiments also supported roles for ADP release, thromboxane generation, and integrin activation in GPVI-mediated platelet adhesion (supplemental Figure 3). Although platelet thromboxane generation was eliminated by indomethacin, neither apyrase nor Integrilin significantly affected platelet TxB2 levels following 10 μg/mL CRP-XL treatment, as determined by enzyme-linked immunosorbent assay (supplemental Figure 4).
Progression of GPVI-mediated platelet responses. (A) Replicate samples (n = 3) of washed human platelets (2 × 10⁸/mL) were incubated with apyrase (2 U/mL), indomethacin (10 μM), Integrilin (20 μg/mL), and a combination thereof (“+all”) or vehicle alone (“veh”). Following the addition of the GPVI-specific agonist crosslinked collagen-related peptide (CRP-XL, 10 μg/mL) at t = 0 (arrow), platelet suspensions were monitored by Born light transmission aggregometry under stirring conditions at 37°C. Representative aggregation traces are shown (left) and quantified for percent aggregation relative to control (right, *P < .01). (B) Replicate samples (n = 3) of washed human platelets (2 × 10⁸/mL) were incubated with apyrase, indomethacin, Integrilin, or vehicle alone before stimulation with 10 μg/mL CRP-XL in the presence of fluorescently labeled antisera against the active conformation of human integrin αIIbβ3 (FITC-PAC-1). After 30 minutes, samples were analyzed by flow cytometry. The percentage of FITC-PAC-1+, platelet-gated events per condition is shown (**P < .001; *P < .05; for indomethacin, P = .0850). (C) Platelets as prepared above were fixed in paraformaldehyde, permeabilized, and stained for filamentous actin with TRITC-phalloidin before flow cytometry analysis. Mean fluorescence intensity (MFI) for TRITC-phalloidin stained platelet-gated events are shown. (*P < .001). (D) Replicate samples (n = 3) of washed human platelets (2×10⁸/mL) were incubated with P2Y1 and P2Y12 inhibitors (“+P2Yi”; 10 μM MRS 2179 and 10 μM AR-C 66096), indomethacin, or a combination thereof (“+all”) or vehicle alone. Following the addition of Chrono-Lume reagent and CRP-XL, ATP-dependent luciferase luminescence (lumin.) was measured as an indicator of platelet ADP release and δ-granule secretion (*P < .0001). a.u., arbitrary units. (E) Platelets were prepared as previously, before stimulation with 10 μg/mL CRP-XL in the presence of anti-CD62P-APC. After 30 minutes, samples were analyzed by flow cytometry. The percentage of CD62P+ platelet-gated events per condition quantifies platelet α-granule secretion (*P < .01). (F) Replicate samples of washed human platelets (5 × 10⁸/mL) were prepared as described before stimulation with CRP-XL. After 5 minutes, platelets were collected into Laemmli sample buffer, separated by sodium dodecyl sulfate-polyacrylamide gel electrophoresis, transferred to nitrocellulose, and analyzed for phosphorylation of consensus tyrosine kinase, PKC, Akt, and MAPK substrates motifs by western blot. Blot lane pixel intensities as measured in Image J are graphed above respective lanes as fold change relative to control. Significance (P) of intensity measurements are shown for analysis of variance test for trend. Tick marks on right side of each blot panel show positions of molecular weight (MW) markers for 4G10 (top to bottom: 150, 75, 60 kD), PKC substrates (180, 130, 100, 75, 50 kD), Akt substrates (75, 63, 45, 35 kD), and MAPK substrates (150, 100, 80 kD). Additional experiments also supported roles for ADP release, thromboxane generation, and integrin activation in GPVI-mediated platelet adhesion (supplemental Figure 3). Although platelet thromboxane generation was eliminated by indomethacin, neither apyrase nor Integrilin significantly affected platelet TxB2 levels following 10 μg/mL CRP-XL treatment, as determined by enzyme-linked immunosorbent assay (supplemental Figure 4).
To elucidate the role of feedback from platelet ADP secretion in GPVI-mediated responses, we assessed platelet δ-granule release in response to CRP-XL (Figure 1D). Inhibition of purinergic receptor activation and thromboxane synthesis significantly reduced δ-granule release in response to CRP-XL by 54.5% and 49.3%, respectively (P < .0001). Similarly, apyrase as well as Integrilin reduced platelet α-granule secretion in response to CRP-XL by 17.8% (P = .009) and 17.5% (P = .01), respectively (Figure 1E). To gain insight into intracellular signaling events associated with the progression of these GPVI-mediated responses, lysates were prepared from platelet samples for western blot analyses with antisera against generalized phosphorylated protein kinase substrate consensus motifs. As seen in Figure 1F, tyrosine kinase, PKC, Akt, and MAPK mediated phosphoprotein immunoreactivity increased in lysates from CRP-XL-stimulated platelets in a manner significantly limited by apyrase, indomethacin, and Integrilin treatments. Together, these results show that GPVI activation solicits progressive platelet phenotypic responses associated with changes in the phosphorylation of numerous protein kinase substrates.
Quantitation of GPVI-initiated platelet protein phosphorylation
To characterize specific protein phosphorylation events associated with GPVI-mediated platelet activation, we developed a workflow incorporating multiplexed TMT labeling and SPS-MS3 analysis tools (Figure 2A).12-14,16,17 First, to measure protein phosphorylation events largely restricted to GPVI activation alone, platelets were stimulated with CRP-XL in the presence of inhibitors limiting feedback from ADP release, thromboxane generation, and integrin activation (condition 1). As outlined in Figure 2A, whole blood was drawn into citrate from (n = 5) healthy human donors to prepare washed platelets. Purified platelet suspensions (>99.9 CD41+ by flow cytometry; supplemental Figure 5) from each subject were then equally divided to prepare resting and CRP-XL-stimulated platelet samples. Following lysis and proteolytic digestion, tryptic peptides were first passed over P-Tyr-1000 resin to enrich relatively low stoichiometry phosphotyrosine (pTyr) peptides.16,28 Flow through material was subsequently enriched for other predominantly pSer and pThr peptides with TiO2 chromatography. Following elution, pTyr and TiO2 enriched phosphopeptide samples were labeled with TMT reagents and combined to prepare separate pTyr and TiO2 multiplexes. These 2 10-plex samples were separately analyzed on an Orbitrap Fusion Tribrid mass spectrometer using the default SPS MS3 acquisition method. Examples of representative ion fragmentation and MS2 and MS3 spectra for PLCγ2 Y759 phosphorylation are shown in Figure 2B.
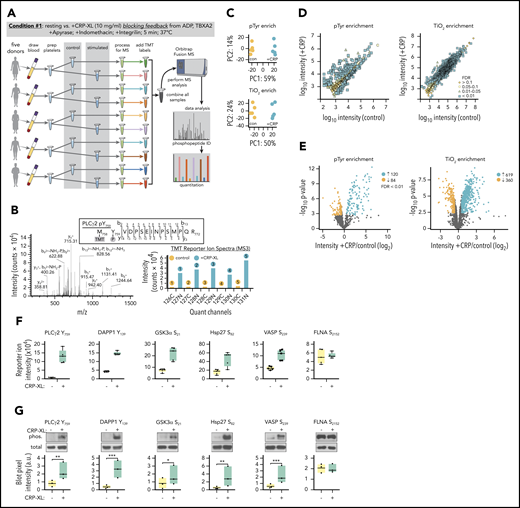
Identification of protein phosphorylation events initiating GPVI platelet activation. (A) Workflow summary for multiplexed, quantitative phosphoproteomics analysis of resting vs CRP-XL-activated platelets. Blood was drawn from n = 5 healthy human donors to prepare washed platelets (>99.9% CD41+ by flow cytometry). Platelets were incubated with apyrase, indomethacin, and Integrilin to inhibit feedback processes that potentiate platelet activation downstream of GPVI (condition 1). Platelet samples were each equally divided into control vs stimulated (+10 μg/mL CRP-XL) samples for 5 minutes, as a range of GPVI-mediated intracellular signaling events associated with platelet function are known to be detectable at this time point under these conditions.82-84 After 5 minutes, platelet samples were separately lysed, digested, and alkylated before phosphopeptide enrichment on anti-pTyr resin and TiO2 beads and addition of 10-plex tandem mass tag (TMT) labels. Ten pTyr- and 10 TiO2-enriched samples were each separately combined for 2 10-plex analyses of phosphopeptides on an Orbitrap Fusion MS. (B) Example MS2 spectra of tryptic peptide and ion fragmentation identifying phosphorylation of PLCγ2 Y759 and MS3 quantitation of phosphopeptide reporter ion intensities from (n = 5) control (gray) vs +CRP-XL (black) platelet samples. (C) Principal component analyses of all identified phosphopeptides from control (orange) and +CRP-XL (blue) samples following pTyr (top) and TiO2 enrichment (bottom) and multiplex MS analysis. (D) Scatter plots of measured mean phosphopeptide reporter ion intensities from control vs +CRP-XL samples following pTyr (left) and TiO2 enrichment (right). Significant changes colored by Benjamini–Hochberg false discovery rate (FDR), as indicated. (E) Volcano plots of phosphopeptide reporter ion intensity ratios (−log2 +CRP-XL/control) vs P values. Phosphopeptides with highly significant differential intensities (FDR < 0.01) shaded by FDR, as indicated. A total of 204 (120 increasing, 84 decreasing) and 979 (619 increasing, 360 decreasing) significantly differential phosphopeptides were identified in control vs +CRP-XL samples following pTyr and TiO2 enrichment, respectively. (F) Reporter ion intensity measurements of representative phosphopeptides corresponding to specific protein phosphorylation sites for n = 5 control (yellow) and +CRP-XL (green) samples. (G) Lysates of control and +CRP-XL platelet samples above were separated by sodium dodecyl sulfate-polyacrylamide gel electrophoresis, transferred to nitrocellulose, and examined by western blot with phosphorylation site-specific antisera (phos.) against PLCγ2 Y759, DAPP1 Y139, GSK3α S21, Hsp27 S82, VASP S239, and FLNA S2152. Blot pixel intensity measurements (a.u.) are shown for n = 3 samples. Western blot for α-tubulin serves as a control for total protein levels. Significance (*P < .1, **P < .05, ***P < .01) determined by paired Student t test. Note: Interactive and searchable versions of the phosphoproteomics data and graphs above are available at: https://kcvi.shinyapps.io/STARTapp_359-pTyr/ and https://kcvi.shinyapps.io/STARTapp_359-TiO2/.
Identification of protein phosphorylation events initiating GPVI platelet activation. (A) Workflow summary for multiplexed, quantitative phosphoproteomics analysis of resting vs CRP-XL-activated platelets. Blood was drawn from n = 5 healthy human donors to prepare washed platelets (>99.9% CD41+ by flow cytometry). Platelets were incubated with apyrase, indomethacin, and Integrilin to inhibit feedback processes that potentiate platelet activation downstream of GPVI (condition 1). Platelet samples were each equally divided into control vs stimulated (+10 μg/mL CRP-XL) samples for 5 minutes, as a range of GPVI-mediated intracellular signaling events associated with platelet function are known to be detectable at this time point under these conditions.82-84 After 5 minutes, platelet samples were separately lysed, digested, and alkylated before phosphopeptide enrichment on anti-pTyr resin and TiO2 beads and addition of 10-plex tandem mass tag (TMT) labels. Ten pTyr- and 10 TiO2-enriched samples were each separately combined for 2 10-plex analyses of phosphopeptides on an Orbitrap Fusion MS. (B) Example MS2 spectra of tryptic peptide and ion fragmentation identifying phosphorylation of PLCγ2 Y759 and MS3 quantitation of phosphopeptide reporter ion intensities from (n = 5) control (gray) vs +CRP-XL (black) platelet samples. (C) Principal component analyses of all identified phosphopeptides from control (orange) and +CRP-XL (blue) samples following pTyr (top) and TiO2 enrichment (bottom) and multiplex MS analysis. (D) Scatter plots of measured mean phosphopeptide reporter ion intensities from control vs +CRP-XL samples following pTyr (left) and TiO2 enrichment (right). Significant changes colored by Benjamini–Hochberg false discovery rate (FDR), as indicated. (E) Volcano plots of phosphopeptide reporter ion intensity ratios (−log2 +CRP-XL/control) vs P values. Phosphopeptides with highly significant differential intensities (FDR < 0.01) shaded by FDR, as indicated. A total of 204 (120 increasing, 84 decreasing) and 979 (619 increasing, 360 decreasing) significantly differential phosphopeptides were identified in control vs +CRP-XL samples following pTyr and TiO2 enrichment, respectively. (F) Reporter ion intensity measurements of representative phosphopeptides corresponding to specific protein phosphorylation sites for n = 5 control (yellow) and +CRP-XL (green) samples. (G) Lysates of control and +CRP-XL platelet samples above were separated by sodium dodecyl sulfate-polyacrylamide gel electrophoresis, transferred to nitrocellulose, and examined by western blot with phosphorylation site-specific antisera (phos.) against PLCγ2 Y759, DAPP1 Y139, GSK3α S21, Hsp27 S82, VASP S239, and FLNA S2152. Blot pixel intensity measurements (a.u.) are shown for n = 3 samples. Western blot for α-tubulin serves as a control for total protein levels. Significance (*P < .1, **P < .05, ***P < .01) determined by paired Student t test. Note: Interactive and searchable versions of the phosphoproteomics data and graphs above are available at: https://kcvi.shinyapps.io/STARTapp_359-pTyr/ and https://kcvi.shinyapps.io/STARTapp_359-TiO2/.
Principal component analysis (PCA) demonstrated similarities between all 5 resting and all 5 +CRP-XL condition 1 samples, as well as separation of control and experimental groups for both anti-pTyr- (upper) and TiO2-enriched (lower) multiplexes (Figure 2C). Scatter plots of measured phosphopeptide reporter ion intensities (Figure 2D) and volcano plots comparing fold-change (log2 +CRP-XL/control) mean reporter intensity values with statistical significance (-log10P value) and shaded by false discovery rate (FDR) further note 120 significantly increasing and 94 decreasing ion intensities for pTyr-enriched peptides (FDR < 0.01), and 619 increasing and 360 decreasing ion intensities for TiO2 enriched phosphopeptides (Figure 2E). Parallel analysis of total protein levels found minor, although statistically significant changes for a small number of proteins (18 of 3234) in resting vs +CRP-XL platelet lysates, confirming that protein expression is not significantly altered following 5 minutes of GPVI activation (supplemental Table 1; supplemental Figure 6). Several phosphopeptides with significantly differential intensities mapped to specific protein phosphorylation sites previously characterized in platelets and other cells, including PLCγ2 Y759 and DAPP1 Y139 (Figure 2F).29-31 Platelet lysates from proteomics experiments described were examined for changes in phosphorylation on these and other sites of interest by western blot. As seen in Figure 2G, site-specific protein phosphorylation blot pixel densities were in agreement with results from phosphopeptide reporter ion intensity measurements under resting and +CRP-XL conditions.
Contribution of feedback to platelet GPVI signaling
To determine how feedback from ADP secretion and thromboxane generation effect the progression of signaling events in response to GPVI activation, we carried out quantitative proteomics studies in the absence of apyrase and indomethacin (Figure 3A; condition 2). Multiplexed analysis of CRP-XL-stimulated platelets allowing for feedback from ADP and thromboxane measured reporter ion intensities for 616 and 2795 unique pTyr- and TiO2-enriched phosphopeptides, respectively (Figure 3B; supplemental Table 1). Of these, 314 pTyr- and 1974 TiO2-enriched phosphopeptides were significantly altered by CRP-XL treatment (FDR < 0.1). These represented 2550 phosphorylation sites on 1026 proteins, several of which were shared with condition 1, whereas many were more significant for and unique to condition 2 (Figure 3D). Proteins with significant differential modifications for both conditions 1 and 2 were strongly associated with gene ontology terms for essential molecular functions, including 118 and 25 targets with protein kinase and phosphatase activities, respectively.32 Gene ontology term analysis also noted biological processes associated with conditions 1 and 2, including vesicle-mediated transport and cytoskeleton organization (Figure 3E; supplemental Table 2).32 Differentially phosphorylated proteins also significantly associated with several Reactome pathways relevant to platelet function,33 including FcRγ and ITAM-mediated SFK signaling downstream of BCR and GPVI (Figure 3F; supplemental Table 2). These pathways largely follow from the significant phosphorylation of several SFK substrate sites identified in proteomics data on target proteins including FcRγ (FCER1G; Y58, Y65, Y69), cortactin (Y334, Y446), Syk (Y323, Y348, Y352), LAT (Y220), and DAPP1 (Y139).
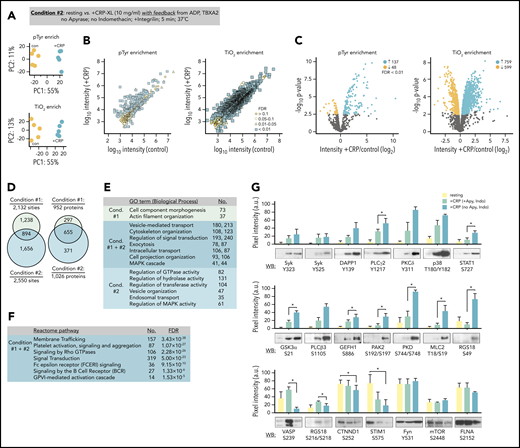
Quantitation of GPVI signaling with feedback from purinergic and thromboxane receptors. (A) Platelets were prepared from n = 5 donors. To analyze phosphopeptides downstream of GPVI with feedback from purinergic and thromboxane receptors, platelets from each donor were incubated Integrilin in the absence of apyrase and indomethacin (condition 2). Principal component analysis of quantified phosphopeptides from pTyr (top) and TiO2 enrichment (below) reveal distinct groupings following CRP-XL stimulation. (B) Scatter plot of measured mean phosphopeptide reporter ion intensities for control vs +CRP-XL samples. (C) Volcano plots of phosphopeptide reporter ion intensity ratios (+CRP-XL/ control) vs P values, colored by FDR find 185 pTyr-enriched phosphopeptides and 1358 TiO2 phosphopeptides significantly increase (FDR < 0.01) in +CRP-XL samples. (D) Phosphopeptides from conditions 1 and 2 represented 893 and 4571 potential phosphorylation events, respectively (2132 regulated phosphorylation sites specific to condition 1; 2550 specific to condition 2; 894 shared). Phosphorylation events occurred on 952 and 1026 proteins, respectively. (E) Summary of significant (FDR < 1×10⁻¹⁵) gene ontology term (Biological Process) enrichment and number (No.) of high confidence (FDR < 0.01) candidate proteins conditions 1 and 2. (F) Summary of No. of proteins modified in conditions 1 and 2 significantly associated with Reactome pathways (supplemental Table 2). (G) Western blot analysis and quantitation of site-specific protein phosphorylation from resting (yellow) and +CRP-XL stimulated platelets (n = 3) in the presence of apyrase and indomethacin (green) or Integrilin alone (blue). Blot pixel intensities quantified with Image J (a.u.). Significance of blot intensities for +CRP-XL conditions were determined by ratio paired Student t test (*P < .1). Note: Interactive and searchable versions of the phosphoproteomics data and graphs above are available at: https://kcvi.shinyapps.io/STARTapp_515_pTyr/ and https://kcvi.shinyapps.io/STARTapp_515_TiO2/.
Quantitation of GPVI signaling with feedback from purinergic and thromboxane receptors. (A) Platelets were prepared from n = 5 donors. To analyze phosphopeptides downstream of GPVI with feedback from purinergic and thromboxane receptors, platelets from each donor were incubated Integrilin in the absence of apyrase and indomethacin (condition 2). Principal component analysis of quantified phosphopeptides from pTyr (top) and TiO2 enrichment (below) reveal distinct groupings following CRP-XL stimulation. (B) Scatter plot of measured mean phosphopeptide reporter ion intensities for control vs +CRP-XL samples. (C) Volcano plots of phosphopeptide reporter ion intensity ratios (+CRP-XL/ control) vs P values, colored by FDR find 185 pTyr-enriched phosphopeptides and 1358 TiO2 phosphopeptides significantly increase (FDR < 0.01) in +CRP-XL samples. (D) Phosphopeptides from conditions 1 and 2 represented 893 and 4571 potential phosphorylation events, respectively (2132 regulated phosphorylation sites specific to condition 1; 2550 specific to condition 2; 894 shared). Phosphorylation events occurred on 952 and 1026 proteins, respectively. (E) Summary of significant (FDR < 1×10⁻¹⁵) gene ontology term (Biological Process) enrichment and number (No.) of high confidence (FDR < 0.01) candidate proteins conditions 1 and 2. (F) Summary of No. of proteins modified in conditions 1 and 2 significantly associated with Reactome pathways (supplemental Table 2). (G) Western blot analysis and quantitation of site-specific protein phosphorylation from resting (yellow) and +CRP-XL stimulated platelets (n = 3) in the presence of apyrase and indomethacin (green) or Integrilin alone (blue). Blot pixel intensities quantified with Image J (a.u.). Significance of blot intensities for +CRP-XL conditions were determined by ratio paired Student t test (*P < .1). Note: Interactive and searchable versions of the phosphoproteomics data and graphs above are available at: https://kcvi.shinyapps.io/STARTapp_515_pTyr/ and https://kcvi.shinyapps.io/STARTapp_515_TiO2/.
To validate and better understand how signaling events measured in conditions 1 and 2 relate, we carried out western blot analyses with phosphorylation site-specific antisera. As seen in Figure 3G, protein modifications associated with increasing MS reporter ion intensities showed increased reactivity to antisera against specific protein phosphorylation modifications following CRP-XL stimulation. These included Syk Y323, p38 T180Y182, and STAT1 S727. Differential modifications identified only in condition 2 data, such as phosphorylation of myosin light chain T18S19, PAK2 S192S197, and RGS18 S49, were detected by western blot only when feedback was permitted. Other sites (ie, VASP S239, RGS18 S218) known to be regulated by cyclic nucleotide-dependent protein kinases (ie, PKA, PKG)34 had significantly increased reporter ion intensities only for condition 1 as well as increased blot immunoreactivity under conditions that included apyrase, but not when feedback from ADP and thromboxane was present. Differential intensities associated with dephosphorylation, including phosphopeptides representing CTNND1 S252 and STIM1 S575, had significantly decreasing MS intensities and western blot signals. Phosphorylation sites that typically remain static in platelets had no significant changes in reporter ion intensities for conditions 1 and 2 (ie, Fyn Y531, mTOR S2448, FLNA S2152) and were not significantly variable by western blot following CRP-XL stimulation (Figure 3F, bottom). Together, these results demonstrate that TMT-SPS-MS3 methods measure several platelet protein modifications that are commonly followed by western blot, as well as numerous other phosphorylation events in a manner that may elucidate mechanisms initiating and progressing platelet GPVI signaling responses.
Causal relations in platelet GPVI signaling
We next analyzed differential platelet protein modifications measured with CausalPath.23,35 CausalPath computationally identifies pairs of protein phosphorylation changes with likely cause-effect relations using pathway information accumulated in Pathway Commons24 and other databases. To do this, CausalPath evaluates graph patterns represented with BioPAX,36,37 and identifies potential causal relations (“causal priors”) between site-specific phosphorylations (ie, “change in phosphorylation of protein X at site A causes change in phosphorylation of protein Y at site B”). CausalPath then identifies parts of proteomic datasets explainable with causal priors (Figure 4A). For example, as the phosphoproteomics experiments measure increases in p38 (MAPK14) Y182 (activating site) and STAT1 S727 (p38 substrate site) phosphorylation, CausalPath infers that activated p38 phosphorylated STAT1 S727 (Figure 4A). More details on CausalPath are described in supplemental Figure 7. From 1887 and 2077 significantly increasing and decreasing phosphorylation events measured over conditions 1 and 2, CausalPath mapped 290 significant phosphorylation changes through 319 inferred relations among 148 proteins (Figure 4B; supplemental Figures 8 and 9).
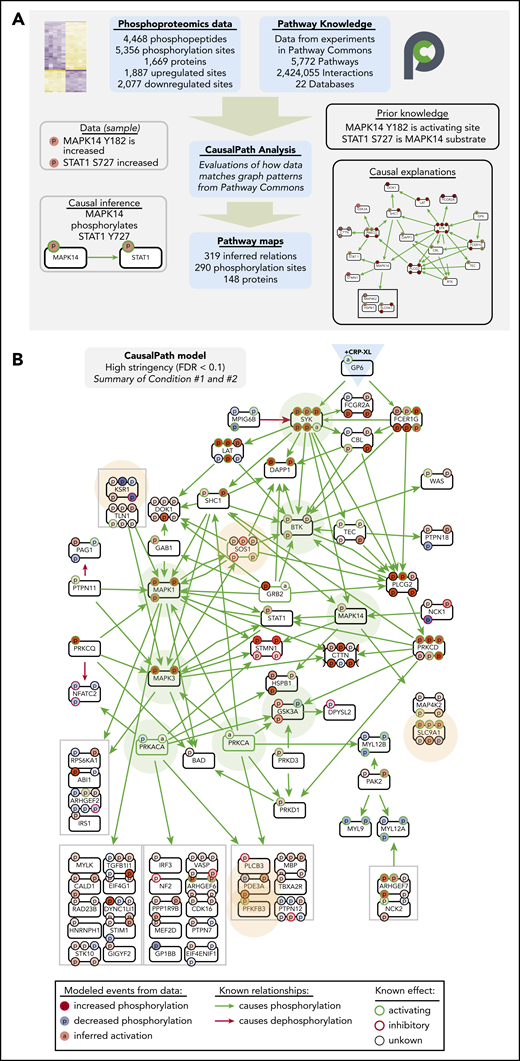
CausalPath places differentially phosphorylated proteins into context of GPVI signaling. (A) Overview of CausalPath analysis of quantitative phosphoproteomics data. Additional details regarding CausalPath notation and functionality are found in supplemental Figure 7. (B) Merged summary of CausalPath models from conditions 1 and 2. Nodes (conventionally labeled with gene names) represent significantly modified phosphoproteins. Edges represent causal phosphorylation (green arrow) or dephosphorylation (red arrow) processes. Protein phosphorylation sites are shown with smaller “p” circles, where a green border indicates an activating site and red border indicates inactivating site. The background color of phosphorylation sites indicates their differential measurement from data, red indicating an increase and blue indicating a decrease. Nodes highlighted with light green background represent well established nodes in platelet signaling, further examined later. Nodes highlighted with light orange background represent new targets of interest in GPVI signaling, as detailed. In general, more kinases than phosphatases place directly into CausalPath models because kinase-substrate relations are more completely detailed in literature, and phosphorylation site-specific mechanisms of phosphatase regulation are less prevalent. Nonetheless, many phosphatase-associated mechanisms are apparent in CausalPath models (ie, SHP-2/PTPN11 dephosphorylation of PAG1; PKA phosphorylation of spinophilin/PPP1R9B85 ); several phosphatase-associated proteins are also modified in an unspecified manner (ie, MYPT1/PPP1R12A; supplemental Figures 12 and 13).
CausalPath places differentially phosphorylated proteins into context of GPVI signaling. (A) Overview of CausalPath analysis of quantitative phosphoproteomics data. Additional details regarding CausalPath notation and functionality are found in supplemental Figure 7. (B) Merged summary of CausalPath models from conditions 1 and 2. Nodes (conventionally labeled with gene names) represent significantly modified phosphoproteins. Edges represent causal phosphorylation (green arrow) or dephosphorylation (red arrow) processes. Protein phosphorylation sites are shown with smaller “p” circles, where a green border indicates an activating site and red border indicates inactivating site. The background color of phosphorylation sites indicates their differential measurement from data, red indicating an increase and blue indicating a decrease. Nodes highlighted with light green background represent well established nodes in platelet signaling, further examined later. Nodes highlighted with light orange background represent new targets of interest in GPVI signaling, as detailed. In general, more kinases than phosphatases place directly into CausalPath models because kinase-substrate relations are more completely detailed in literature, and phosphorylation site-specific mechanisms of phosphatase regulation are less prevalent. Nonetheless, many phosphatase-associated mechanisms are apparent in CausalPath models (ie, SHP-2/PTPN11 dephosphorylation of PAG1; PKA phosphorylation of spinophilin/PPP1R9B85 ); several phosphatase-associated proteins are also modified in an unspecified manner (ie, MYPT1/PPP1R12A; supplemental Figures 12 and 13).
As summarized in Figure 4B, CausalPath identified and mapped many causally related phosphorylation events on established platelet GPVI (GP6) effectors, including SFK-mediated phosphorylation of FcRγ (FCER1G), and, subsequently Syk, BTK, PLCγ2 (PLCG2), PKCδ (PRKCD), and p38 (MAPK14). CausalPath also inferred the activation of PKCα (PRKCA) and PKA (PRKACA) from substrate phosphorylation patterns. Other targets not yet characterized for roles in platelet function had notable changes in activating phosphorylation sites and fit into CausalPath models, including many components of Ras/MAPK signaling (ie, KSR1, SOS1). CausalPath also noted conflicting relations in datasets, where the activation status of kinases did not match associated changes in substrate phosphorylation, including dephosphorylation of several PKA and MAPK substrates (supplemental Figures 10 and 11). Although many significantly differentially phosphorylated proteins fit into causal contexts, the majority had no associated causal priors in Pathway Commons, including heavily modified targets such as MYCT1, DENND2C and BIN2 (supplemental Figures 12 and 13).
Validation and survey of inferred GPVI signaling relations
To examine pathway relations inferred by CausalPath, platelets were preincubated with a panel of kinase inhibitors (detailed in supplemental Table 3) before CRP-XL stimulation and western blot analysis with antisera against phosphorylation sites of interest. As seen in Figure 5A-B, stimulation of platelets with CRP-XL upregulated the phosphorylation of Syk Y525, DAPP1 Y139, PLCγ2 Y1217, PLCβ3 S1105, Hsp27 S82, and other sites in a manner consistent with phosphoproteomics data. Pretreatment of platelets with inhibitors against Syk, BTK, and other key nodes (highlighted in green background in Figure 4B) before stimulation with CRP-XL significantly limited the phosphorylation of several target phosphorylation sites in the CausalPath model. Syk (entospletinib) and BTK (acalabrutinib) inhibitors abrogated CRP-XL evoked phosphorylation of PLCγ2 Y1217, which occurs downstream of Syk→BTK activation. In the presence of the p38 MAPK inhibitor SB202190, CRP-XL treatment increased the phosphorylation of several nodes downstream of GPVI in the CausalPath model, whereas phosphorylation of MAPK targets STAT1 S727 and Hsp27 S82 were significantly diminished. Other, more complex, relationships were also apparent, including an upregulation of CRP-XL stimulated DAPP1 Y139 phosphorylation in the presence of the PKC inhibitor Ro 31-8220. Likewise, several inhibitors limited CRP-XL evoked phosphorylation of PDE3A S428, suggesting a complex regulation of this site which may be phosphorylated by PKC as well as PKA.
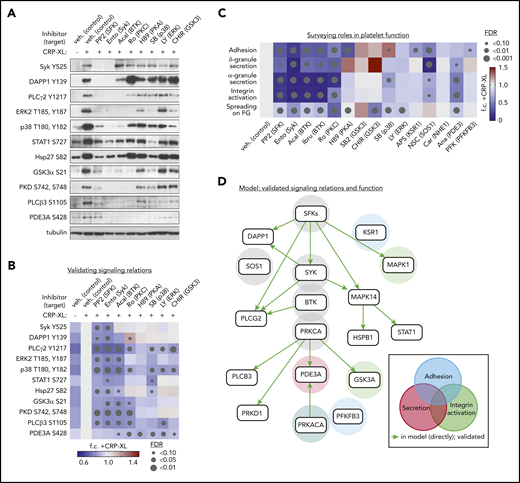
Validation of platelet GPVI signaling relations and functional responses. (A) Replicate samples (n = 3) of washed human platelets (5 × 10⁸/mL) were incubated with inhibitors (10 μM, unless noted) against Src family kinases SFKs (PP2), Syk (entospletinib), BTK (acalabrutinib), PKCα (Ro 31-8220), PKA (H89), p38 (SB202190, 2 μM), ERK1/2 (LY3214996), and GSK3 (CHIR 99021). After stimulation with CRP-XL (10 μg/mL, 37°C, 5 minutes), lysates were examined by western blot for phosphorylation of sites of interest (see supplemental Table 3 for additional details regarding inhibitor specificities). (B) Quantitative summary of effects of inhibitors on site-specific phosphorylation as determined by western blot above. Color legend indicates fold-change (f.c.) relative to +CRP-XL condition. Gray dots indicate false discovery rate (FDR) by size relative to +CRP-XL condition. (C) Summary of effects of pathway node and effector inhibition on GPVI-mediated platelet adhesion, ADP secretion, α-granule secretion, and integrin activation, as well as platelet spreading on fibrinogen (supplemental Figure 14). (D) Summary of validated platelet GPVI signaling relations in platelet function following from biochemical and physiological experiments previous. From all combinations of inhibitor-antibody pairs, 16 of 22 inferred relations were directly validated (green arrows). Other validated pairs can also be explained by a multistep path in the inferred model (supplemental Figure 15). Shaded circles indicate supporting experimental evidence for specific pathway nodes in GPVI-mediated platelet adhesion (blue), secretion (red), and integrin activation (green), and combinations thereof, colored according to function (gray = associated with all functions tested).
Validation of platelet GPVI signaling relations and functional responses. (A) Replicate samples (n = 3) of washed human platelets (5 × 10⁸/mL) were incubated with inhibitors (10 μM, unless noted) against Src family kinases SFKs (PP2), Syk (entospletinib), BTK (acalabrutinib), PKCα (Ro 31-8220), PKA (H89), p38 (SB202190, 2 μM), ERK1/2 (LY3214996), and GSK3 (CHIR 99021). After stimulation with CRP-XL (10 μg/mL, 37°C, 5 minutes), lysates were examined by western blot for phosphorylation of sites of interest (see supplemental Table 3 for additional details regarding inhibitor specificities). (B) Quantitative summary of effects of inhibitors on site-specific phosphorylation as determined by western blot above. Color legend indicates fold-change (f.c.) relative to +CRP-XL condition. Gray dots indicate false discovery rate (FDR) by size relative to +CRP-XL condition. (C) Summary of effects of pathway node and effector inhibition on GPVI-mediated platelet adhesion, ADP secretion, α-granule secretion, and integrin activation, as well as platelet spreading on fibrinogen (supplemental Figure 14). (D) Summary of validated platelet GPVI signaling relations in platelet function following from biochemical and physiological experiments previous. From all combinations of inhibitor-antibody pairs, 16 of 22 inferred relations were directly validated (green arrows). Other validated pairs can also be explained by a multistep path in the inferred model (supplemental Figure 15). Shaded circles indicate supporting experimental evidence for specific pathway nodes in GPVI-mediated platelet adhesion (blue), secretion (red), and integrin activation (green), and combinations thereof, colored according to function (gray = associated with all functions tested).
We next screened effects of inhibiting key nodes in CausalPath models (ie, Syk, BTK, p38) as well as more specialized targets (ie, KSR1, SOS1, and PFKFB3, highlighted in orange; Figure 4B) over essential platelet function responses. As seen in supplemental Figure 14 and summarized in Figure 5C, pretreatment of platelets with inhibitors targeting critical GPVI effectors altered the ability of platelets to adhere to a surface of immobilized CRP-XL. Inhibitors of KSR1 (APS-2-79),38 SOS1 (NSC-658497),39 and PFKFB3 (AZ PFKFB3 67)40 also significantly limited platelet adhesion to CRP-XL-coated cover glass. SOS1 inhibition also significantly inhibited platelet dense granule secretion in response to CRP-XL stimulation (supplemental Figure 14). Platelet α-granule secretion was significantly inhibited by the PDE3A inhibitor anagrelide,41 which also limited platelet integrin activation (supplemental Figure 14). As summarized in Figure 5D and supplemental Figure 15, experiments tested 22 directed pairs of inferred signaling relations, validating 16 direct relations (green arrows), and providing evidence for an additional 19 relations in a multistep manner (supplemental Figure 15), where inhibition of kinases and other nodes had significant effects on platelet adhesion, secretion and integrin activation. Together, these modeling and pharmacological experiments validate signaling relations and begin to place established and putative GPVI effectors together into models of platelet function. However, it is critical to note that small molecule inhibitors used for these studies have a range of target specificities (supplemental Table 3). Nonetheless, validated relations were not readily explainable by known off-target effects of inhibitors (supplemental Table 3).
GPVI effectors outside of curated causal contexts
We next aimed to better understand how less-established phosphorylation events (supplemental Figures 12 and 13) may participate in GPVI-mediated platelet function. We generated an interactome of the complete human platelet proteome from experiment-based relations in STRING (Figure 6A), and grouped to highlight Reactome pathways around secretion, signal transduction, and metabolism. Most of the 1234 differentially phosphorylated proteins that did not fit into causal models above (yellow diamonds) mapped around Reactome pathways associated with platelet function, including signal transduction and secretion, whereas some orphan nodes remained outside of interactive relations (not shown). Reactome pathway analysis of the 1234 out of context targets also support their roles in Rho GTPase signaling and membrane trafficking (Figure 6B).

Analysis of out-of-context targets reveals Rab GTPases as systematic targets in GPVI mediated platelet function. (A) STRING-derived interactome of 3723 platelet proteins in supplemental Table 1, grouped by Reactome pathways, including protein expression, secretion, metabolism, signaling, and others. Yellow diamonds represent proteins with significant phosphorylation changes that did not place into CausalPath models previously discussed. (B) Reactome pathway analysis of 1234 out-of-context targets reveals significant enrichment in signaling by Rho GTPases (Reactome Pathway identifier R-HSA-194315), Membrane trafficking (R-HSA-199991), Rab regulation of trafficking (R-HSA-9007101), and other pathways. (C) Rab system proteins with significant phosphorylation modifications identified in conditions 1 and 2 experiments (selected). (D) Rab7A S72 phosphorylation reporter ion intensity for condition 2 experiments (n = 5). (E) Replicate samples (n = 3) of washed human platelets (5 × 10⁸/mL) were incubated with inhibitors against PKCα (Ro 31-8220), PKA (H89), LRRK2 (MLi-2, 1 μM), TAK1 ((5Z)-7-oxozeaenol, 10 μM), or vehicle alone (0.1% dimethyl sulfoxide) before stimulation with CRP-XL (10 minutes, 37°C) and lysis in Laemmli sample buffer. Lysates were separated by Phos-tag sodium dodecyl sulfate polyacrylamide gel electrophoresis (SDS-PAGE) and analyzed by western blot (WB) for Rab7 phosphorylation. Empty circle indicates migration position of phosphorylated Rab7. Filled circle indicates migration position of nonphosphorylated Rab7. Results representative of n = 3 experiments. (F) Superresolution structured illumination microscopy of Rab7 (green) localization in resting vs activated platelets. Wide field scale bar = 10 μm. Magnified scale bar = 2 μm.
Analysis of out-of-context targets reveals Rab GTPases as systematic targets in GPVI mediated platelet function. (A) STRING-derived interactome of 3723 platelet proteins in supplemental Table 1, grouped by Reactome pathways, including protein expression, secretion, metabolism, signaling, and others. Yellow diamonds represent proteins with significant phosphorylation changes that did not place into CausalPath models previously discussed. (B) Reactome pathway analysis of 1234 out-of-context targets reveals significant enrichment in signaling by Rho GTPases (Reactome Pathway identifier R-HSA-194315), Membrane trafficking (R-HSA-199991), Rab regulation of trafficking (R-HSA-9007101), and other pathways. (C) Rab system proteins with significant phosphorylation modifications identified in conditions 1 and 2 experiments (selected). (D) Rab7A S72 phosphorylation reporter ion intensity for condition 2 experiments (n = 5). (E) Replicate samples (n = 3) of washed human platelets (5 × 10⁸/mL) were incubated with inhibitors against PKCα (Ro 31-8220), PKA (H89), LRRK2 (MLi-2, 1 μM), TAK1 ((5Z)-7-oxozeaenol, 10 μM), or vehicle alone (0.1% dimethyl sulfoxide) before stimulation with CRP-XL (10 minutes, 37°C) and lysis in Laemmli sample buffer. Lysates were separated by Phos-tag sodium dodecyl sulfate polyacrylamide gel electrophoresis (SDS-PAGE) and analyzed by western blot (WB) for Rab7 phosphorylation. Empty circle indicates migration position of phosphorylated Rab7. Filled circle indicates migration position of nonphosphorylated Rab7. Results representative of n = 3 experiments. (F) Superresolution structured illumination microscopy of Rab7 (green) localization in resting vs activated platelets. Wide field scale bar = 10 μm. Magnified scale bar = 2 μm.
Other regulated systems not yet connected to platelet function included >40 unmapped proteins associated with Rab GTPases (Figure 6C). These included a significant 3.5-fold increase in Rab7A S72 phosphorylation (Figure 6D), a modification associated with endolysosomal maturation and vesicular traffic regulation via immunomodulatory kinases (ie, LRRK2, TAK1).42 Proteomics experiments did not detect any LRRK2 (or LRRK1) in platelets43,44 ; however, the putative Rab7A S72 kinase TAK1 (MAP3K7)45,46 was present (supplemental Table 1). We examined how inhibition of TAK1 and other kinases effect Rab7 phosphorylation and platelet function. As seen in Figure 6E, following Phos-tag gel electrophoresis,47 a slower migrating Rab7-positive band indicative of S72 phosphorylation42 was present in CRP-XL-stimulated platelet lysates. Pretreatment of platelets with the TAK1 inhibitor (5Z)-7-oxozeaenol48 abrogated CRP-XL induced Rab7 phosphorylation, whereas the LRRK2 inhibitor MLi-249 had no effect. Rab7-positive granules were abundant throughout resting platelets, as determined by superresolution structured illumination microscopy (Figure 6F). Following stimulation with CRP-XL, platelets underwent characteristic shape change, actin nucleation, and dense granule secretion (CD63 externalization), where Rab7-staining vesicles fused in a manner consistent with endosome-lysosome maturation (Figure 6F). Pretreatment of platelets with (5Z)-7-oxozeaenol (but not MLi-2) inhibited GPVI-mediated fusion of Rab7 vesicles (Figure 6F) and platelet function (supplemental Figure 16).
Discussion
In this study, we implemented a quantitative proteomics and pathway inference strategy to determine how protein phosphorylation systematically advances GPVI/ITAM-mediated platelet activation.7,9,10,50 Current models of platelet function posit that ITAM-coupled signals downstream of GPVI initiate, progress, and maintain platelet activation states in contexts of hemostasis (ie, vessel repair), thrombosis, and vascular inflammation.7,8,51 Here, by measuring and mapping known protein phosphorylation events already associated with platelet activation together with numerous lesser characterized phosphoprotein modifications, we offer a means to expand models of platelet GPVI/ITAM signaling over the complete platelet phosphoproteome in an experimentally testable manner through iterative hypothesis generation and validation efforts. Among other examples, we illuminate pathways around platelet GPVI signaling substrates, placing classic and emerging ITAM and SFK effectors such as FcRγ, BTK, and DAPP1,29 as well as less characterized targets such as KSR1 and SOS1, into the context of signaling systems regulating platelet function.
Historically, proteomics technologies have pioneered discoveries of mechanisms regulating platelet function in physiology and disease.52-54 Here, we develop a workflow that brings together advances in phosphopeptide enrichment, multiplex TMT labeling and SPS-MS3 tools to quantify intersubject dynamics of the platelet phosphoproteome at unprecedented depth and resolution. Under conditions initiating as well as progressing GPVI-mediated platelet activation, we altogether measured the levels of >4500 unique phosphopeptides. Together, these phosphopeptides represented 5311 phosphorylation sites on 1657 of the 3723 proteins that were found here to be present in all human platelet samples examined. We found that up to 3788 (71%) phosphorylation sites on 1323 proteins were differentially regulated in the initiating and progressive responses of platelets to the GPVI-specific agonist CRP-XL (FDR < 0.1). At higher stringency (FDR < 0.01), up to 2471 (47%) phosphorylation sites were significantly regulated. These numbers are above but within the range of other recent studies, including a label-free MS quantitation of 334/853 (39%) modified phosphorylation sites in thrombin-stimulated platelets55 ; similarly, another recent TMT 10-plex study measured significant changes on 4217/7330 (57.5%) phosphorylation sites in interleukin-3-stimulated eosinophils.18 In addition to several novel targets, our analyses measured many well-known modifications associated with GPVI/ITAM platelet activation that are commonly followed with phosphospecific antisera, but that have eluded earlier platelet MS studies (ie, SFK substrates, Syk Y525, PLCγ2 Y1217).55,56 Numerous dephosphorylation events, mediated by undetermined phosphatase activities, were also apparent on sites such as ADAM17 S791 (a putative PP2A substrate),57 RAPGAP2 S612, and CTNND1 S252 (supplemental Table 1).
We used CausalPath to map site-specific changes in protein phosphorylation in our data to known, causal relations curated through Pathway Commons.24 We recently developed CausalPath to mimic how a scientist might search literature sources to understand changes in protein phosphorylation within a quantitative dataset, but, on the scale of hundreds of thousands of events, and, with the computational capacity to logically infer how thousands of phosphorylation changes may have occurred. CausalPath analysis of 1887 and 2077 differential phosphorylation events in conditions 1 and 2 (supplemental Figures 8 and 9), respectively, placed a total of 290 differentially regulated phosphorylation sites on 148 proteins into 319 site-specific relations, a subset of which are summarized in Figure 4B. By comparison, CausalPath analysis of recent iTRAQ data of ∼600 regulated phosphorylation sites in ADP-stimulated platelets finds important, although more limited (∼20) site-specific relations.23,54 Many of these and other described modifications were also in data from CRP-XL-stimulated platelets and placed into CausalPath models (VASP S239, RASGRP2 S587); however, previously identified sites predicted as kinase substrates based on consensus motifs (ie, CLDN5 T207, MYO9B S1354) are not considered by CausalPath because of a lack of experimental evidence.23,35
Overall, we found that several relations inferred by CausalPath were readily testable to validate and clarify how more complex phosphorylation patterns fit into GPVI signaling and platelet function. For instance, although CausalPath modeled STAT1 S727 phosphorylation downstream of either ERK or p38 activation (Figure 4B), only p38 inhibition significantly altered STAT1 phosphorylation in CRP-XL-stimulated platelets (Figure 5). Importantly, we note that small molecule inhibitors used for signaling and functional studies here have varying specificities (supplemental Table 3), and that more extensive validation efforts are required to advance such models, especially as off-target effects of compounds on platelets are not clear. Along these lines, TMT-SPS-MS3 tools detailed here provide an ideal approach for future efforts to define off-target effects of mechanistic as well as clinically relevant small molecules, such as the BTK inhibitor ibrutinib, which inhibits platelet activities and hemostasis in vivo through secondary mechanisms that remain unclear.58
We suspected that, like established GPVI effectors (ie, Syk, PLCγ2), other less well-described nodes that integrated into CausalPath models may also regulate platelet function. Although many Ras superfamily GTPases (ie, Rac1, Rap1) have roles in platelet function,59,60 flagship Ras GTPases (ie, HRAS, NRAS, KRAS) and associated proteins remain understudied in platelets.61,62 Early ITAM studies noted Ras/SOS1 regulation in platelets63 and mast cell degranulation.64 Alterations in SOS1 and other Ras/MAPK system proteins such as SHP-2 (PTPN11) are associated with platelet dysfunction in Noonan syndrome.65,66 Recently, a number of small molecule tools have emerged to study Ras and SOS1 function.39,67,68 We found that NSC-658497, an inhibitor of SOS1 GEF activity, significantly inhibited GPVI-mediated platelet adhesion, dense granule secretion, and integrin activation ex vivo (Figure 5; supplemental Figure 14). In addition to SOS1, phosphorylation of other Ras/Raf/MAPK system proteins also mapped to pathways downstream of GPVI, including SHP-2, Grb2, and the kinase suppressor of Ras, KSR1. Like SOS1, KSR1 has emerged as a target in RASopathy diseases, where agents such as APS-2-79 can stabilize KSR1 to alter Raf/MAPK signaling38 in a manner that may regulate GPVI-mediated platelet adhesion.
Secondarily, CausalPath organizes data that do not fit models established in literature, highlighting areas for exploration (supplemental Figures 12 and 13). Consequently, we noted that >40 proteins associated with Rab GTPase regulation are modified in platelets in an unspecified manner following GPVI activation. Specifically, GPVI/ITAM-driven Rab7 S72 phosphorylation69 was associated with the maturation of Rab7-positive vesicles in activating platelets (Figure 6). Other Rab proteins and effectors were also significantly phosphorylated, including RABEP1 S407, a protein kinase D substrate regulating integrins.70 Many less well-studied proteins were also highly regulated, including DENND2C, a Rab GEF preferentially expressed in platelets.44 Although DENND2C remains functionally uncharacterized, genomewide association study analyses associate several platelet traits with loci of DENND2C as well as RABEP1, RAB8A, and other putative GPVI effectors.71,72 Given the complexity of vesicle traffic in megakaryocyte73 and platelet74 physiology, and, the extensive modifiability of Rab systems found here in platelets that is increasingly associated with immune functions of other cell types,75-78 we foresee Rab proteins as important regulators of platelet homeostasis for future study.
In summary, we provide an extensive dataset resource and MS workflow and analysis pipeline to profile and better understand how changes in protein phosphorylation regulate platelet function. Although our work here focuses on GPVI/ITAM signaling, we provide a viable approach to characterize mechanisms of platelet activation in other ex vivo contexts, such as procoagulant platelet activation, or, determining how pharmacologic agents affect platelet signaling and function through on- and off-target effects. Similar workflows may likewise offer a means to characterize phenotypes of disease-associated platelet populations in vivo,79 which differ qualitatively in the clinic, but remain poorly defined in molecular terms.80 Overall, we envision strong potential for quantitative SPS-MS3 proteomics methods and causal analysis tools in defining platelet activation mechanisms and specifying how phenotypes of platelets and other cell types associate with wellness and disease.
Mass spectrometry data, including data files and Jupyter notebook files detailing analyses, are deposited in the ProteomeXchange Consortium PRIDE partner repository81 with the dataset identifier PXD017167.
The online version of this article contains a data supplement.
The publication costs of this article were defrayed in part by page charge payment. Therefore, and solely to indicate this fact, this article is hereby marked “advertisement” in accordance with 18 USC section 1734.
Acknowledgments
Graphic Abstract and workflow summary were prepared by Inky Mouse Studios.
This work was supported by the Medical Research Foundation of Oregon, the American Heart Association (17SDG33350075 to J.E.A.), a Scholar Award from the American Society of Hematology (to J.E.A.), and the National Institutes of Health (NIH), National Heart, Lung, and Blood Institute (R01HL146549 [J.E.A.]; R01HL101972 [O.J.T.M.]). Mass spectrometric analysis was partially supported by core grants from the NIH, National Eye Institute (P30 EY010572) and NIH, National Cancer Institute (P30 CA069533) and a shared instrument grant from the Office of the Director (S10OD-012246).
Authorship
Contribution: Ö.B., J.M.C., J.K., A.P.R., P.A.W., L.L.D., and J.E.A. conceived and designed the study; Ö.B., J.M.C., J.K., J.M., P.A.W., L.L.D., and J.E.A. developed methodology; Ö.B., A.R.M., J.M.C., J.P., A.-L.I.S., S.T.Y., T.Z., A.P.R., P.A.W., L.L.D., and J.E.A. acquired data; Ö.B., A.R.M., J.M.C., J.K., S.T.Y., T.Z., I.P.-I., J.M., A.P.R., P.A.W., L.L.D., and J.E.A. undertook analysis and interpretation of data; Ö.B., J.M.C., P.A.W., and J.E.A. wrote the manuscript; Ö.B., A.R.M., J.Z.-R., J.M., O.J.T.M., E.D., P.A.W., L.L.D., and J.E.A. provided administrative, technical, or material support; and L.L.D. and J.E.A. supervised the study.
Conflict-of-interest disclosure: The authors declare no competing financial interests.
Correspondence: Joseph E. Aslan, Knight Cardiovascular Institute, Oregon Health & Science University, 3303 SW Bond Ave, Mail code CH13B, Portland, OR 97239; e-mail: aslanj@ohsu.edu.
