

Key Points
Allele-specific methylation of the ASNS gene is associated with in vitro asparaginase sensitivity and ASNS expression level in BCP-ALL.
ASNS gene methylation in BCP-ALL is associated with an aberrant methylation of the imprinted gene cluster at 7q21 and karyotypes.

Abstract
Karyotype is an important prognostic factor in childhood B-cell precursor acute lymphoblastic leukemia (BCP-ALL), but the underlying pharmacogenomics remain unknown. Asparaginase is an integral component in current chemotherapy for childhood BCP-ALL. Asparaginase therapy depletes serum asparagine. Normal hematopoietic cells can produce asparagine by asparagine synthetase (ASNS) activity, but ALL cells are unable to synthesize adequate amounts of asparagine. The ASNS gene has a typical CpG island in its promoter. Thus, methylation of the ASNS CpG island could be one of the epigenetic mechanisms for ASNS gene silencing in BCP-ALL. To gain deep insights into the pharmacogenomics of asparaginase therapy, we investigated the association of ASNS methylation status with asparaginase sensitivity. The ASNS CpG island is largely unmethylated in normal hematopoietic cells, but it is allele-specifically methylated in BCP-ALL cells. The ASNS gene is located at 7q21, an evolutionally conserved imprinted gene cluster. ASNS methylation in childhood BCP-ALL is associated with an aberrant methylation of the imprinted gene cluster at 7q21. Aberrant methylation of mouse Asns and a syntenic imprinted gene cluster is also confirmed in leukemic spleen samples from ETV6-RUNX1 knockin mice. In 3 childhood BCP-ALL cohorts, ASNS is highly methylated in BCP-ALL patients with favorable karyotypes but is mostly unmethylated in BCP-ALL patients with poor prognostic karyotypes. Higher ASNS methylation is associated with higher L-asparaginase sensitivity in BCP-ALL through lower ASNS gene and protein expression levels. These observations demonstrate that silencing of the ASNS gene as a result of aberrant imprinting is a pharmacogenetic mechanism for the leukemia-specific activity of asparaginase therapy in BCP-ALL.
Introduction
B-cell precursor acute lymphoblastic leukemia (BCP-ALL) is the most common childhood tumor. In BCP-ALL, chromosomal abnormalities are highly associated with chemotherapeutic outcome.1-5 Although karyotype is an important clinical risk factor for the stratification of current treatment,3-5 the pharmacogenomics behind the association between karyotype and chemotherapy sensitivity in BCP-ALL remains largely unknown. Asparaginase is an integral component in current chemotherapy for childhood BCP-ALL. The introduction of asparaginase therapy dramatically improved therapeutic outcome in childhood ALL.6,7 Prolonged courses of high-dose intensity therapy with asparaginase have further improved outcomes.8-12 The importance of asparaginase therapy in current treatment is shown by recent findings that the patients who could not tolerate asparaginase therapy because of adverse events had a poorer outcome.13-15 A higher in vitro asparaginase sensitivity is associated with favorable prognostic factors such as hyperdiploidy8 and ETV6-RUNX1,16 and a lower sensitivity is associated with poor prognostic factors such as relapse,17 infant onset,18 BCR-ABL1,19 and BCR-ABL1-like features.20 Asparaginase therapy depletes serum asparagine by deaminating asparagine into aspartic acid.14,21 Normal hematopoietic cells can produce asparagine from aspartic acid by asparagine synthetase (ASNS) activity, but ALL cells are unable to synthesize adequate amounts of asparagine (Figure 1A). Thus, ALL cells depend on an extracellular source of asparagine to survive. As a result, asparaginase therapy specifically induces death of ALL cells. Thus, silencing of the ASNS gene in ALL cells is critical for cells to be completely starved of asparagine.22,23
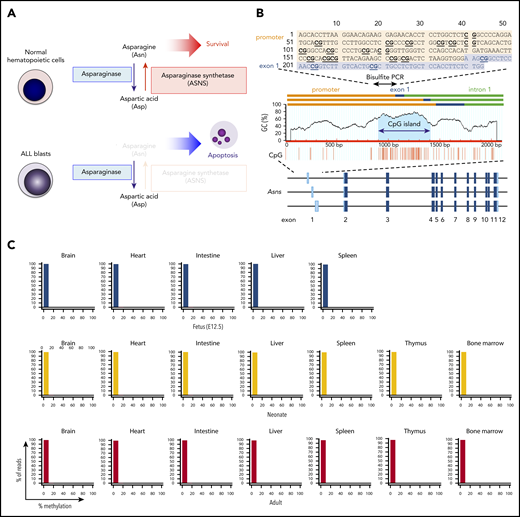

Methylation of ASNS in normal hematopoietic cells. (A) Antileukemic activity of L-asparaginase. (B) Schematic representation of a CpG island in the mouse asparagine synthetase (Asns) gene. A CpG island is located at the boundary of the promoter and 3 initial exons. Bisulfite PCR of a 243-bp region (top panel) was performed, and the methylation status of 19 CG dinucleotides was evaluated with NGS. (C) Asns gene methylation in normal organs of fetal (E12.5), neonatal, and adult mice. Histograms of Asns methylation are indicated. (D) Schematic representation of a CpG island in the human ASNS gene. Bisulfite PCR of a 228-bp region (located at the boundary of the promoter and exon 1a) was performed, and the methylation status of 23 CG dinucleotides was evaluated. (E) ASNS methylation in normal B-cell precursors. The top panel shows a heat map of the methylation status in each CG dinucleotide. The bottom panel indicates histograms of mean percent methylation in each read.
Methylation of ASNS in normal hematopoietic cells. (A) Antileukemic activity of L-asparaginase. (B) Schematic representation of a CpG island in the mouse asparagine synthetase (Asns) gene. A CpG island is located at the boundary of the promoter and 3 initial exons. Bisulfite PCR of a 243-bp region (top panel) was performed, and the methylation status of 19 CG dinucleotides was evaluated with NGS. (C) Asns gene methylation in normal organs of fetal (E12.5), neonatal, and adult mice. Histograms of Asns methylation are indicated. (D) Schematic representation of a CpG island in the human ASNS gene. Bisulfite PCR of a 228-bp region (located at the boundary of the promoter and exon 1a) was performed, and the methylation status of 23 CG dinucleotides was evaluated. (E) ASNS methylation in normal B-cell precursors. The top panel shows a heat map of the methylation status in each CG dinucleotide. The bottom panel indicates histograms of mean percent methylation in each read.
Considering that the ASNS gene has a typical CpG island in its promoter, methylation of the ASNS CpG island could be one of the epigenetic mechanisms for ASNS gene silencing in BCP-ALL.24,25 However, association of ASNS methylation with its gene expression and asparaginase sensitivity in childhood BCP-ALL has not been fully confirmed yet. In this study, we focused on these issues in detail using a large series of BCP-ALL cell lines and patients’ samples. We verified that allele-specific methylation of ASNS owing to aberrant imprinting is associated with suppression of the ASNS gene and the higher asparaginase sensitivity in BCP-ALL.
Materials and methods
Mouse samples
Normal fetal (12.5 embryonic days), neonatal, and adult (3-month-old) tissues were harvested from C57BL/6N mice by following institutional guidelines at the University of Hiroshima. Frozen leukemic spleen samples were obtained from previously established mouse leukemia models: knockin mice with ETV6-RUNX126 and TCF3-PBX127 and transgenic mice with BCR-ABL1.28 Genomic DNA was extracted from each sample using a PureLink Genomic DNA kit (Invitrogen, Carlsbad, CA).
Human samples and cell lines
The analysis of cord blood cells was approved by the ethics committee at the RIKEN Center for Integrative Medical Sciences. CD34+/CD19– and CD34+/CD19+ populations were sorted by flow cytometry (FACS Vantage; Becton, Dickinson and Company, Sparks, MD) using a CD34+ population separated with MACS Micro Beads (Miltenyi Biotec, Bergisch Gladbach, Germany). A CD34–/CD19+ population was directly separated with MACS MicroBeads. RNA was extracted by using an RNeasy mini kit (QIAGEN, Hilden, Germany). Eighty-three BCP-ALL cell lines (supplemental Table 1, available on the Blood Web site) were maintained in RPMI 1640 medium supplemented with 10% fetal calf serum in a humidified atmosphere of 5% CO2 at 37°C. The analysis of human leukemic cell lines and primary samples was approved by the ethics committee at the University of Yamanashi.
Methylation analysis by bisulfite sequencing
Sodium bisulfite modification was performed with an EZ DNA Methylation Lightning kit (Zymo Research, Irvine, CA). Polymerase chain reaction (PCR) primers (supplemental Table 2) were designed using MethPrimer (http://www.urogene.org/methprimer/). Amplification was performed with FastStart Taq DNA Polymerase (Roche, Basel, Switzerland) using 1 cycle of 95°C for 4 minutes, 40 cycles of 95°C for 30 seconds, 55°C for 30 seconds, 72°C for 1 minute, and a final cycle of 72°C for 7 minutes. Amplicon libraries were generated by using an Ion Plus Fragment Library Kit (Thermo Fisher Scientific, Waltham, MA) and Ion Xpress Barcode Adaptors Kit (Thermo Fisher Scientific). After Agencourt AMPure XP purification (Beckman Coulter, Brea, CA), individual libraries were amplified. The libraries were then processed with an Ion Chef System using an Ion PG Hi-Q Chef Kit (Thermo Fisher Scientific). Next-generation sequencing (NGS) was performed by using an Ion PGM Hi-Q Sequencing Kit (Thermo Fisher Scientific) and 850 flows on an Ion 318 Chip Kit v2 (Thermo Fisher Scientific). After sequencing, single processing and base calling were performed using Torrent Suite 5.0.2 (Thermo Fisher Scientific). Methylation analysis was performed using a Methylation Analysis Amplicon plug-in v1.3 (Thermo Fisher Scientific).
Allele-specific methylation
Allele-specific methylation of the ASNS gene CpG island in intermediately methylated cell lines was investigated with PCR performed by sense (5′-accctgacctgcttacg-3′) and antisense (5′-atcctccaccccttccttc-3′) primers using genomic DNA incubated with or without Aor13HI for 1 hour at 55°C as a template. Amplification was performed with an AmpliTaq Gold 360 Master Mix (Thermo Fisher Scientific) using 30 cycles of 94°C for 30 seconds, 55°C for 30 seconds, and 72°C for 30 seconds.
Asparaginase sensitivity
An alamarBlue cell viability assay (Bio-Rad Laboratories, Hercules, CA) was performed to determine the 50% inhibitory concentration (IC50). Then, 1 to 4 × 10⁵ cells per 100 μL were plated into a 96-well plate, and assays were performed in triplicate in the presence or absence of 7 concentrations (from 0.0097 to 40 IU/mL) of L-asparaginase. The cells were cultured for 68 hours, and then 20 μL per well of alamarBlue was added. After a 6-hour additional incubation with alamarBlue, absorbances at 570 nm were monitored by a microplate spectrophotometer using 600 nm as a reference wavelength. Cell survival was calculated by expressing the ratio of the optical density of treated wells to that of untreated wells as a percentage. The median of 3 independent assays was determined as the IC50 for each cell line. To determine the percent viabilities of primary samples of childhood ALL, a Cell Counting Kit-8 (CCK-8; Dojindo Laboratories, Kumamoto, Japan) assay was performed in triplicate in the presence or absence of 0.01 IU/mL of L-asparaginase. CCK-8 solution was then added to each well after a 72-hour incubation. After an additional 2-hour incubation, sample absorbance at 450 nm was measured.
Real-time PCR analysis of ASNS
Total RNA was extracted using the Trizol reagent (Invitrogen, Carlsbad, CA), reverse transcription was performed using random hexamer (Amersham Bioscience, Buckinghamshire, United Kingdom) by Superscript II reverse transcriptase (Invitrogen), and then incubated with RNase (Invitrogen). Triplicated samples were amplified according to the manufacturer’s protocol. As an internal control, quantitative real-time PCR for ACTB was performed.
Western blot analysis of ASNS
Cells were solubilized in NP40 lysis buffer. The cell lysates were separated on a sodium dodecyl sulfate-polyacrylamide gel and transferred to a nitrocellulose membrane. The membrane was incubated with anti-ASNS (HPA029318, Atlas Antibodies, Stockholm, Sweden), and anti-ACTB (MBL, Nagoya, Japan) antibodies. Subsequently, the membrane was incubated with horseradish peroxidase–labeled anti-rabbit immunoglobulin G (MBL) and was developed using an enhanced chemiluminescence detection kit (GE Healthcare, Little Chalfont, United Kingdom).
Gene methylation analysis in uniparental origin tissues and childhood BCP-ALL cohorts
The percent methylation of 2 CpG sites located in the CpG island of PEG10, DLX5, and ASNS genes was investigated using a public methylation database of sperm (GSE26974) and a mature cystic ovarian teratoma (MCT) (GSM549171). Gene methylation of childhood BCP-ALL clinical samples was investigated using a database from the Nordic Society of Pediatric Hematology and Oncology (NOPHO)29 (GSE49031) and the California Childhood Cancer Study (CCCS) group30 (GSE56599). Gene methylation of childhood BCP-ALL clinical samples in the Tokyo Children’s Cancer Study Group (TCCSG)31 was analyzed using an Illumina Human Methylation450 BeadChip (GPL13534; Illumina Inc., San Diego, CA). The percent methylation of each gene was evaluated by the methylation level of CG dinucleotides that are annotated as 0 to 200 bases upstream of the both the transcriptional start site (TSS200) and the CpG island.
Statistics
Mann-Whitney U test, Fisher’s exact test, χ2 test, and Spearman’s rank correlation analysis were performed using R version 3.5.2.
Results
Allele-specific methylation of ASNS in BCP-ALL cell lines
The mouse Asns gene has a CpG island at the boundary of the promoter and initial exons (Figure 1B). We investigated methylation status by sequencing 19 CG dinucleotides of bisulfite PCR products using NGS technology.32,33 Histograms of the mean percent methylation in each read of NGS revealed an unmethylated pattern in mouse fetal, neonatal, and adult tissues (Figure 1C). We next investigated the methylation status of the human ASNS gene. We performed bisulfite PCR of a 228-bp region that is located at the boundary of the promoter and exon 1a (Figure 1D) and evaluated the methylation status of 23 CG dinucleotides. Histograms of 3 cord blood fractions (CD34+/CD19–, CD34+/CD19+, and CD34–/CD19+) and peripheral blood lymphocytes from healthy donors revealed a large peak of unmethylated reads with a tiny peak of full methylation (Figure 1E).
We also investigated the methylation status of ASNS in 83 BCP-ALL cell lines (Figure 2A). The mean methylation levels were largely distributed into 3 clusters: 17, 38, and 28 cell lines showed highly (>66.7%), intermediately (33.3%-66.7%), and weakly methylated or unmethylated (<33.3%) patterns, respectively. In the majority of intermediately methylated cell lines, histograms revealed 2 peaks of fully methylated and unmethylated reads (Figure 2B; supplemental Figure 1). A tandem repeat polymorphism of 14 nucleotides (rs3832526)34 and a methylation-specific restriction enzyme site for Aor13HI exist in the middle of the CpG island (supplemental Figure 2). We performed PCR of genomic DNA incubated with or without Aor13HI in the cell line samples with a heterozygous genotype of rs3832526 (Figure 2C). Two products derived from 2 (2R) and 3 (3R) tandem repeat alleles were observed in the PCR product using untreated DNA as a template. In contrast, a single product derived from either a 2R or 3R allele was predominantly observed in the PCR product using Aor13HI-treated DNA as a template in the majority of samples, indicating that the Aor13HI site in 1 allele is methylated whereas that in the other allele is unmethylated. Furthermore, in the PCR using Aor13HI-treated DNA as a template, neither 2R nor 3R allele-derived product was observed in weakly methylated cell lines, whereas both 2R and 3R allele-derived products were observed in highly methylated cell lines (supplemental Figure 3). The ASNS gene is located at 7q21. Allelic loss of the ASNS gene or uniparental disomy of partial or whole chromosome 7 might affect the ASNS methylation status in BCP-ALL cell lines. Eighteen highly or weakly methylated cell lines showed the heterozygous genotype of rs383252 (data not shown). In addition, a further 11 highly or weakly methylated cell lines revealed a heterozygous genotype at least in 1 of 8 single nucleotide polymorphisms located in introns 2 (rs7790127, rs4727378, rs11771498, and rs6465630) and 4 (rs41278833 and rs7797354), and in exon 5 (rs141969298 and rs1049674) of ASNS by Sanger sequencing of 3 genomic PCR products (Figure 2D). These observations indicate that loss of heterozygosity in the ASNS gene is unlikely in the majority of highly or weakly methylated cell lines. We further evaluated loss of the 7q21 region in 72 BCP-ALL cell lines based on a single nucleotide polymorphisms array analysis. Neither partial loss of 7q21 nor whole loss of chromosome 7 was observed in 72 cell lines (data not shown). In contrast, partial 7q21 gain was observed in 8 of 72 cell lines (supplemental Figure 4). These observations demonstrate a stepwise allele-specific methylation of the ASNS gene in BCP-ALL cell lines.
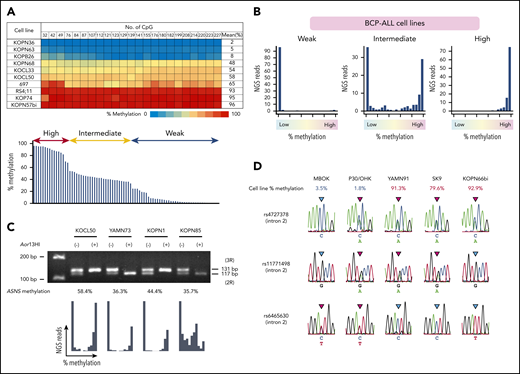
Allele-specific methylation of ASNS in BCP-ALL cell lines. (A) ASNS methylation in BCP-ALL cell lines. The top panel shows a heat map of 10 representative cell lines. The bottom panel indicates distribution of the mean percent methylation in 83 BCP-ALL cell lines. (B) Typical histograms of the mean percent methylation in weakly, intermediately, and highly methylated cell lines. Vertical axes indicate the frequency of NGS reads, and the horizontal axes indicate the level of methylation. (C) PCR using genomic DNA after incubation with or without Aor13HI as a template in intermediately methylated cell lines with a heterozygous genotype of a tandem repeat polymorphism. The bottom panel shows histograms of ASNS methylation. (D) Sequences of 3 single nucleotide polymorphisms (SNPs) located in intron 2 of the ASNS gene in weakly and highly methylated cell lines.
Allele-specific methylation of ASNS in BCP-ALL cell lines. (A) ASNS methylation in BCP-ALL cell lines. The top panel shows a heat map of 10 representative cell lines. The bottom panel indicates distribution of the mean percent methylation in 83 BCP-ALL cell lines. (B) Typical histograms of the mean percent methylation in weakly, intermediately, and highly methylated cell lines. Vertical axes indicate the frequency of NGS reads, and the horizontal axes indicate the level of methylation. (C) PCR using genomic DNA after incubation with or without Aor13HI as a template in intermediately methylated cell lines with a heterozygous genotype of a tandem repeat polymorphism. The bottom panel shows histograms of ASNS methylation. (D) Sequences of 3 single nucleotide polymorphisms (SNPs) located in intron 2 of the ASNS gene in weakly and highly methylated cell lines.
Aberrant methylation of imprinted gene cluster at 7q21 in BCP-ALL
Allele-specific methylation is a hallmark of genomic imprinting. The ASNS gene is located at 7q21, an evolutionally conserved imprinted gene cluster.35,36 PEG10, a paternally expressed gene at 7q21,37 is expressed at a high level in the placenta24 and is conserved in eutherians and marsupials but not in monotremes.37 Peg10 knockout mice showed early embryonic lethality owing to defects in the placenta,38 suggesting that PEG10 is evolutionally acquired in association with the acquisition of a functional placenta. ASNS and PEG10 are separated from each other by approximately 3.2 Mb. To investigate whether ASNS is or is not an imprinted gene, we first evaluated the methylation status of ASNS in uniparental origin tissues (Figure 3A). DLX5, a maternally expressed gene at 7q21,39,40 was largely methylated in sperm,41 while PEG10 was largely methylated in maternally derived MCT.42 ASNS genes were unmethylated in both sperm and MCT, indicating that ASNS is not a typical imprinted gene. We next investigated the methylation status of the CpG island of the 7q21 cluster in both normal hematopoietic cells and 3 BCP-ALL cell lines that had different ASNS methylation status (Figure 3B). In normal hematopoietic cells, PEG10 was fully methylated in approximately half the bisulfate PCR products whereas SGCE,43 DLX5, and TAC1 were unmethylated. In contrast, in 3 BCP-ALL cell lines, PEG10, SGCE, DLX5, and TAC1 were largely methylated.
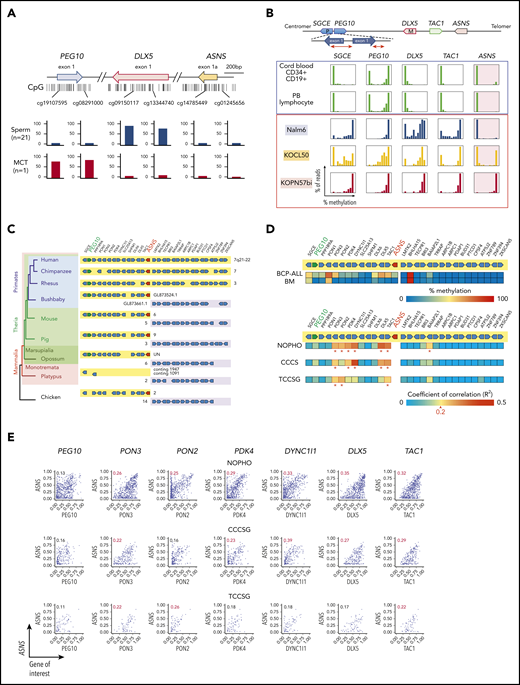
Aberrant methylation of imprinted gene cluster at 7q21 in BCP-ALL. (A) Methylation of CpG islands in the PEG10, DLX5, and ASNS genes in sperm and maternally derived MCT. The position of CG dinucleotides is indicated in the top panel. (B) Methylation of PEG10, DLX5, and ASNS in normal hematopoietic cells and 3 BCP-ALL cell lines that have highly (KOPN57bi), intermediately (KOCL50), and weakly (Nalm6) methylated ASNS. The top panel is a schematic representation of gene configuration at 7q21. P indicates paternally expressed genes and M indicates maternally expressed genes. Histograms indicate the mean percent methylation of each gene. (C) An evolutionary tree of mammals with the alignment of genes located at 7q21-22 in humans. Numbers indicate the chromosome. (D) Methylation of the imprinted gene cluster at 7q21 in BCP-ALL cases of NOPHO, CCCS, and TCCSG cohorts. In the top panel, heat maps indicate methylation status in BCP-ALL and bone marrow (BM) samples at complete remission in the NOPHO cohort. In the bottom panel, heat maps indicate the coefficient of correlation between the percent methylation of each gene and that of ASNS. Asterisks indicate significant correlation (R2 > 0.2). (E) Correlation between ASNS methylation and methylation of representative genes in BCP-ALL cases of 3 cohorts. Vertical and horizontal axes indicate the mean percent methylation of ASNS and that of each gene, respectively. The coefficient of correlation is indicated in each panel.
Aberrant methylation of imprinted gene cluster at 7q21 in BCP-ALL. (A) Methylation of CpG islands in the PEG10, DLX5, and ASNS genes in sperm and maternally derived MCT. The position of CG dinucleotides is indicated in the top panel. (B) Methylation of PEG10, DLX5, and ASNS in normal hematopoietic cells and 3 BCP-ALL cell lines that have highly (KOPN57bi), intermediately (KOCL50), and weakly (Nalm6) methylated ASNS. The top panel is a schematic representation of gene configuration at 7q21. P indicates paternally expressed genes and M indicates maternally expressed genes. Histograms indicate the mean percent methylation of each gene. (C) An evolutionary tree of mammals with the alignment of genes located at 7q21-22 in humans. Numbers indicate the chromosome. (D) Methylation of the imprinted gene cluster at 7q21 in BCP-ALL cases of NOPHO, CCCS, and TCCSG cohorts. In the top panel, heat maps indicate methylation status in BCP-ALL and bone marrow (BM) samples at complete remission in the NOPHO cohort. In the bottom panel, heat maps indicate the coefficient of correlation between the percent methylation of each gene and that of ASNS. Asterisks indicate significant correlation (R2 > 0.2). (E) Correlation between ASNS methylation and methylation of representative genes in BCP-ALL cases of 3 cohorts. Vertical and horizontal axes indicate the mean percent methylation of ASNS and that of each gene, respectively. The coefficient of correlation is indicated in each panel.
The evolutionary tree of mammals reveals that gene alignment of the region between PEG10 and ASNS is widely conserved (Figure 3C). In contrast, gene alignment on the telomeric side of ASNS is totally different between primates and other mammals, suggesting that the telomeric side of ASNS may be evolutionally translocated into 7q21-22 after the divergence of primates during evolution. We evaluated the genome-wide methylation data of 30 genes located at 7q21-22, which have a typical CpG island in the TSS200 region, in childhood BCP-ALL samples of NOPHO,29 CCCS,30 and TCCSG31 cohorts. The majority of the genes aligned between PEG10 and ASNS were partially methylated in the BCP-ALL samples but were basically unmethylated in the bone marrow samples at complete remission in the NOPHO cohort (Figure 3D). In contrast, the majority of the genes located on the telomeric side of ASNS were unmethylated in both BCP-ALL and bone marrow samples at remission. The methylation level of ASNS was significantly correlated with that of each gene (PON3, PON2, PDK4, DYNC1I1, DLX5, and TAC1) that aligned between PEG10 and ASNS (Figure 3E). These observations demonstrate that ASNS methylation in childhood BCP-ALL is associated with an aberrant methylation of the imprinted gene cluster at 7q21.
Association of ASNS methylation with L-asparaginase sensitivity in BCP-ALL
We analyzed the L-asparaginase sensitivity of 83 BCP-ALL cell lines by using the alamarBlue assay (Figure 4A). Cell viabilities at each of the 7 concentrations of L-asparaginase tested in highly methylated cell lines were significantly lower than those in intermediately and weakly methylated cell lines (Figure 4B). Cell viabilities at lower concentrations of L-asparaginase (0.0098, 0.039, and 0.156 IU/mL) in intermediately methylated cell lines were significantly lower than those in weakly methylated cell lines (supplemental Figure 5). The log IC50 values showed a significant negative correlation (R2 = 0.26) with ASNS methylation levels (Figure 4C). The IC50 values in highly methylated cell lines were significantly lower than those in intermediately or weakly methylated cell lines. The median IC50 value in highly methylated cell lines (0.005 IU/mL) was approximately 100 times lower than that in intermediately (0.43 IU/mL) and weakly (0.795 IU/mL) methylated cell lines.
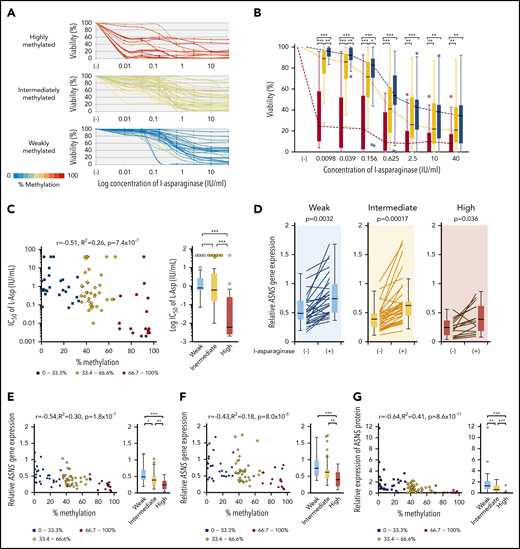
Association of ASNS methylation with L-asparaginase sensitivity in BCP-ALL cell lines. (A) Dose-response curves of L-asparaginase in 83 BCP-ALL cell lines. The color of the curve represents the percent methylation of ASNS in each cell line. (B) Median dose-response curves of L-asparaginase. Box plots indicate cell viabilities in highly (red), intermediately (yellow), and weakly (blue) methylated cell lines at each concentration. Each P value in a Mann-Whitney U test is indicated at the top of each panel. (C) Association between log IC50 value and ASNS gene methylation. Red circles, yellow rhomboids, and blue squares demonstrate highly, intermediately, and weakly methylated cell lines, respectively. (D) Induction of ASNS gene expression by L-asparaginase (1 IU/mL) 12-hour treatment in highly, intermediately, and weakly methylated cell lines. P values in a Student t test are indicated. (E-F) Association between ASNS methylation and ASNS expression in BCP-ALL cell lines cultured in the (E) absence or (F) presence of 1 IU/mL of L-asparaginase for 12 hours. (G) Association between ASNS methylation and basal ASNS protein expression in BCP-ALL cell lines. In panels B-G, asterisks indicate significance in a Mann-Whitney U test. In C, E, F, and G, correlation coefficients and P values are shown at the top of each panel. ***P < .001; **P < .01; *P < .05.
Association of ASNS methylation with L-asparaginase sensitivity in BCP-ALL cell lines. (A) Dose-response curves of L-asparaginase in 83 BCP-ALL cell lines. The color of the curve represents the percent methylation of ASNS in each cell line. (B) Median dose-response curves of L-asparaginase. Box plots indicate cell viabilities in highly (red), intermediately (yellow), and weakly (blue) methylated cell lines at each concentration. Each P value in a Mann-Whitney U test is indicated at the top of each panel. (C) Association between log IC50 value and ASNS gene methylation. Red circles, yellow rhomboids, and blue squares demonstrate highly, intermediately, and weakly methylated cell lines, respectively. (D) Induction of ASNS gene expression by L-asparaginase (1 IU/mL) 12-hour treatment in highly, intermediately, and weakly methylated cell lines. P values in a Student t test are indicated. (E-F) Association between ASNS methylation and ASNS expression in BCP-ALL cell lines cultured in the (E) absence or (F) presence of 1 IU/mL of L-asparaginase for 12 hours. (G) Association between ASNS methylation and basal ASNS protein expression in BCP-ALL cell lines. In panels B-G, asterisks indicate significance in a Mann-Whitney U test. In C, E, F, and G, correlation coefficients and P values are shown at the top of each panel. ***P < .001; **P < .01; *P < .05.
We quantified the ASNS expression level in 83 cell lines cultured in the absence or presence of 1 IU/mL of L-asparaginase for 12 hours. ASNS expression was significantly upregulated by L-asparaginase treatment regardless of methylation status (Figure 4D). Basal and L-asparaginase–induced ASNS expression levels were significantly (R2 = 0.30) and marginally (R2 = 0.18) correlated with ASNS methylation levels, respectively (Figure 4E-F). Highly methylated cell lines showed significantly lower basal and L-asparaginase–induced ASNS expression levels than intermediately and weakly methylated cell lines. Although L-asparaginase sensitivity was not significantly correlated with basal (R2 = 0.042) and L-asparaginase–induced (R2 = 0.067) ASNS expression levels (supplemental Figure 6A), 9 highly sensitive cell lines (IC50 <0.01 IU/mL) revealed significantly lower basal and L-asparaginase–induced ASNS expression levels than the other cell lines (supplemental Figure 6B).
We semiquantified basal ASNS protein expression level by western blotting (supplemental Figure 7A). Basal ASNS protein expression levels were significantly (R2 = 0.41) correlated with ASNS methylation levels (Figure 4G). Differences among 3 groups of cell lines were significant. In contrast, correlation of basal ASNS protein expression level with either basal ASNS gene expression level (R2 = 0.058) or IC50 values of L-asparaginase (R2 = 0.09) were less significant (supplemental Figures 7B-C). However, cell lines with a lower ASNS protein expression were significantly more sensitive to L-asparaginase. These observations indicate that higher ASNS methylation is associated with higher L-asparaginase sensitivity in BCP-ALL cell lines through lower ASNS gene and protein expression levels.
We next analyzed in vitro asparaginase sensitivity in 29 primary samples of childhood BCP-ALL at diagnosis. Because IC50 values of cell lines showed a significant positive correlation with cell viabilities at 0.0098 IU/mL of L-asparaginase (R2 = 0.46; supplemental Figure 8), cell viabilities of clinical samples were tested after treatment with 0.01 IU/mL of L-asparaginase. Cell viabilities showed a significant negative correlation with ASNS methylation levels (R2 = 0.29; Figure 5A). In contrast, the cell viabilities of 22 samples at relapse did not significantly correlate with their ASNS methylation levels (R2 = 0.13; Figure 5B). Highly methylated samples at relapse (median percent viability, 58%) tended to be more resistant than those at diagnosis (median percent viability, 10%). The level of ASNS methylation was almost similar between 39 samples at diagnosis and 22 samples at relapse (Figure 5C). In 4 paired samples obtained at diagnosis and at relapse of identical patients, the pattern of methylation was largely unchanged. These observations demonstrate that the methylation status of ASNS is stable and is associated with the in vitro L-asparaginase sensitivity of BCP-ALL samples at diagnosis but not that of samples at relapse.
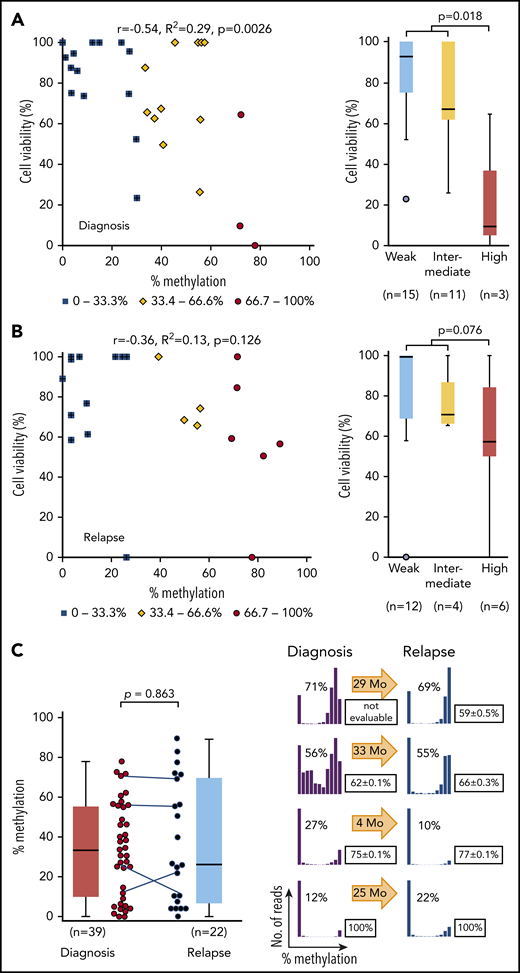
Association between L-asparaginase sensitivity and ASNS methylation in primary BCP-ALL samples. (A-B) Association between percent cell viabilities at 0.01 IU/mL of L-asparaginase and ASNS methylation in BCP-ALL samples at (A) diagnosis and at (B) relapse. Red circles, yellow rhomboids, and blue squares demonstrate highly, intermediately, and weakly methylated samples, respectively. P values in a Mann-Whitney U test are indicated. (C) ASNS methylation in BCP-ALL samples. The left panel indicates ASNS methylation in the samples at diagnosis (left) and relapse (right). The P value in a Mann-Whitney U test is indicated. Solid lines indicate paired samples at diagnosis and relapse of 4 patients. In the right panel, histograms indicate ASNS methylation in 4 paired samples. Boxes indicate mean cell viability with 0.01 IU/mL of L-asparaginase in a triplicated assay with standard deviation. Arrows indicate months before relapse. Correlation coefficients and P values are shown at the top of the panels.
Association between L-asparaginase sensitivity and ASNS methylation in primary BCP-ALL samples. (A-B) Association between percent cell viabilities at 0.01 IU/mL of L-asparaginase and ASNS methylation in BCP-ALL samples at (A) diagnosis and at (B) relapse. Red circles, yellow rhomboids, and blue squares demonstrate highly, intermediately, and weakly methylated samples, respectively. P values in a Mann-Whitney U test are indicated. (C) ASNS methylation in BCP-ALL samples. The left panel indicates ASNS methylation in the samples at diagnosis (left) and relapse (right). The P value in a Mann-Whitney U test is indicated. Solid lines indicate paired samples at diagnosis and relapse of 4 patients. In the right panel, histograms indicate ASNS methylation in 4 paired samples. Boxes indicate mean cell viability with 0.01 IU/mL of L-asparaginase in a triplicated assay with standard deviation. Arrows indicate months before relapse. Correlation coefficients and P values are shown at the top of the panels.
Association of ASNS methylation with chromosomal abnormalities in childhood BCP-ALL
We investigated the association of chromosomal abnormalities with ASNS methylation in childhood BCP-ALL samples of 3 cohorts by evaluating the mean percent methylation of 6 CG dinucleotides located in the CpG island of ASNS (supplemental Figure 9A). We classified chromosomal abnormalities into 3 prognostic groups: a good-risk group included ETV6-RUNX1 and high hyperdiploidy; an intermediate-risk group included intrachromosomal amplification of chromosome 21 (iAMP21),44 dic(9;20),45 and TCF3-PBX1; and a high-risk group included MLL (KMT2A)-rearrangement (MLLr), BCR-ABL1, near triploidy, and hypodiploidy. Nonrecurrent and undetermined karyotypes were classified as part of the intermediate-risk group. In the NOPHO cohort,29 the good-risk group showed a significantly higher ASNS methylation level than intermediate-risk and high-risk groups (Figure 6A). Highly methylated (>66.7%) cases were the most common in the good-risk group, whereas weakly methylated (<33.3%) cases were the most common in the high-risk group (Figure 6B). Among major chromosomal abnormalities, ETV6-RUNX1 (median, 53%) and iAMP21 (46%) represented higher methylation. High hyperdiploidy (28%) represented moderate methylation. TCF3-PBX1 (2.7%), MLLr (17%), and BCR-ABL1 (12%) represented lower methylation (Figure 6C). An identical pattern was validated in CCCS30 and TCCSG31 cohort samples (Figure 6D). In the microarray data of 69 BCP-ALL samples in the NOPHO cohort,29 weak methylation was significantly associated with a higher ASNS gene expression level (supplemental Figure 9B); ASNS gene expression levels were significantly lower in samples with weak methylation than the samples with intermediate methylation and high methylation. In high hyperdiploid cases, the simultaneous trisomy of chromosomes 4, 10, and 17 (triple trisomies) is particularly associated with a good prognosis.46,47 Thus, we verified an association between triple trisomies and ASNS methylation in high hyperdiploid cases of the NOPHO and CCCS cohorts using computer-based analysis of high-density DNA methylation arrays (supplemental Figure 10A-B).48 Of note, the cases with triple trisomies showed the highest level of ASNS methylation among high hyperdiploid cases in both cohorts (Figure 6E).
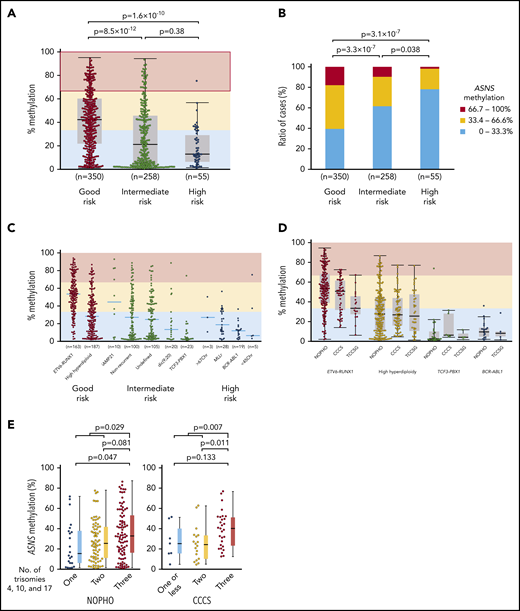
Association between ASNS methylation and chromosomal abnormalities in BCP-ALL samples. (A-B) Association between ASNS methylation and karyotypes in BCP-ALL cases of the NOPHO cohort. P values in (A) a Mann-Whitney U test or (B) χ2 test are indicated. (C-D) Association of ASNS methylation with representative chromosomal abnormalities in BCP-ALL cases of the (C) NOPHO cohort and (D) 3 cohorts. (E) Association of triple trisomies with ASNS methylation in NOPHO (left panel) and CCCS (right panel) cohorts. P values in a Mann-Whitney U test are indicated.
Association between ASNS methylation and chromosomal abnormalities in BCP-ALL samples. (A-B) Association between ASNS methylation and karyotypes in BCP-ALL cases of the NOPHO cohort. P values in (A) a Mann-Whitney U test or (B) χ2 test are indicated. (C-D) Association of ASNS methylation with representative chromosomal abnormalities in BCP-ALL cases of the (C) NOPHO cohort and (D) 3 cohorts. (E) Association of triple trisomies with ASNS methylation in NOPHO (left panel) and CCCS (right panel) cohorts. P values in a Mann-Whitney U test are indicated.
We investigated the Asns methylation status in mouse ALL models. We analyzed knockin mice with ETV6-RUNX126 and TCF3-PBX127 and transgenic mice with BCR-ABL1.28 In human BCP-ALL, ETV6-RUNX1 was associated with higher methylation of ASNS, whereas TCF3-PBX1 and BCR-ABL1 were associated with weak methylation (Figure 6C-D). A similar trend was observed in the Asns gene of the mouse leukemia models (Figure 7A). Among 13 leukemic spleen samples from ETV6-RUNX1 mice, Asns was moderately and weakly methylated in 1 and 2 samples, respectively. In contrast, Asns was completely unmethylated in 15 of 16 TCF3-PBX1 and 4 of 4 BCR-ABL1 samples. We further investigated the methylation status of Peg10, Pon3, Pdk4, Dync1i1, Dlx5, and Tac1 that are located in mouse 6qA1 (Figure 3C), a syntenic region of human 7q21,49 in leukemic spleen samples from ETV6-RUNX1 mice (Figure 7B). In four Asns unmethylated ETV6/RUNX1 samples (eg, No. 129532), all genes were unmethylated except for the monoallelic methylation of Peg10. In six Asns unmethylated ETV6/RUNX1 samples (eg, No. 129753 and 153768), Pdk4, Dlx5, and Tac1 were partially methylated. In three Asns methylated ETV6/RUNX1 samples (eg, Nos. 153767, 129553, and 129758), Peg10 was fully methylated, and Pdk4, Dync1i1, Dlx5, and Tac1 were partially methylated. As a whole, the methylation status of Asns was correlated with that of 6 genes (Figure 7C), suggesting that Asns is methylated in the mouse ETV6/RUNX1 leukemia model in association with the aberrant methylation of a syntenic imprinted gene cluster of human 7q21.
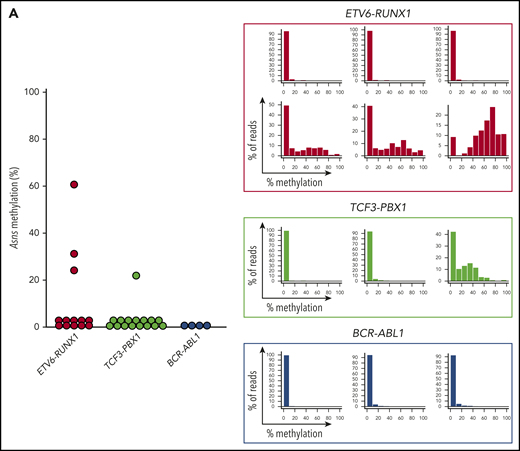
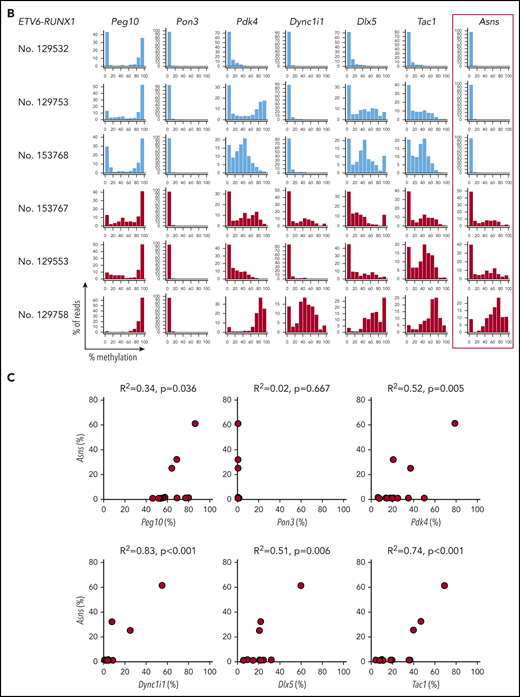
Asns methylation in mouse BCP-ALL models. (A) Asns methylation in leukemic spleen samples from knockin mice with ETV6-RUNX1 (red) and TCF3-PBX1 (green) and transgenic mice with BCR-ABL1 (blue). Right panels demonstrate representative histograms. (B) Methylation status of 6 genes in mouse 6qA1, a syntenic region of human 7q21, in representative leukemic spleen samples from knockin mice of ETV6-RUNX1. (C) Correlation between Asns methylation (vertical axis) and methylation level of 6 genes (horizontal axes) in leukemic spleen samples from knockin mice of ETV6-RUNX1. Correlation coefficients and P values are shown at the top of the panels.
Asns methylation in mouse BCP-ALL models. (A) Asns methylation in leukemic spleen samples from knockin mice with ETV6-RUNX1 (red) and TCF3-PBX1 (green) and transgenic mice with BCR-ABL1 (blue). Right panels demonstrate representative histograms. (B) Methylation status of 6 genes in mouse 6qA1, a syntenic region of human 7q21, in representative leukemic spleen samples from knockin mice of ETV6-RUNX1. (C) Correlation between Asns methylation (vertical axis) and methylation level of 6 genes (horizontal axes) in leukemic spleen samples from knockin mice of ETV6-RUNX1. Correlation coefficients and P values are shown at the top of the panels.
Discussion
By using a large series of BCP-ALL cell lines, we clearly demonstrated that higher ASNS methylation is significantly associated with a lower ASNS gene and protein expression levels and higher asparaginase sensitivity. Allele-specific methylation of ASNS was clearly associated with basal gene and protein expression levels of ASNS in a stepwise manner. However, an impact of monoallelic methylation in asparaginase sensitivity was less significant than that of biallelic methylation. The association of ASNS methylation status with the in vitro asparaginase sensitivity was also confirmed in clinical samples at diagnosis of disease but not in samples at relapse. Because the ASNS methylation status in samples at relapse showed a pattern similar to that in samples at diagnosis, the ASNS methylation status is stable in BCP-ALL cells probably because of aberrant imprinting. A previous report17 indicated that samples at relapse were significantly more resistant to asparaginase in vitro than samples at diagnosis. Furthermore, we confirmed that highly methylated samples at relapse tended to be more resistant than those at diagnosis. In this regard, the gene expression profile of relapsed BCP-ALL samples in a public database revealed significantly higher antiapoptotic BCL2 and lower proapoptotic BAX, CASP8, and CASP9 expression in comparison with the samples at diagnosis (supplemental Figure 11). Thus, mechanisms other than demethylation of ASNS or the selection of a clone with lower ASNS methylation may be involved in the asparaginase resistance of relapsed cases.
The most striking finding in this study is the association of ASNS methylation status with karyotypes in BCP-ALL. Of the samples with favorable karyotypes, ETV6-RUNX1–positive cases showed a significantly higher methylation level than high hyperdiploid cases. Furthermore, this study demonstrates that high hyperdiploid cases with triple trisomies show a higher ASNS methylation level. Because hyperdiploid was reported to be associated with higher in vitro sensitivities to asparaginase as well as antimetabolites,8 a higher ASNS methylation level may be one of the underlying mechanisms for excellent prognosis in high hyperdiploid cases, in particular with triple trisomies. Among intermediate-risk karyotypes, ASNS methylation levels in iAMP21 cases were almost as high as those in ETV6-RUNX1 cases. Of note, the 5-year event-free survival of iAMP21 patients in the United Kingdom was dramatically improved from 29% in the Medical Research Council (MRC) ALL97/99 trial to 78% in the UKALL2003 trial.50 In comparison with the MRC ALL97/99 trial, an asparaginase regimen for iAMP21 patients was markedly intensified in the UKALL2003 trial with 8 additional doses of pegylated asparaginase.50 Moreover, the prognosis of iAMP21 patients was poor in the BFM2000 study, which did not include pegylated asparaginase,51 but it was not inferior in the COG trials, which included a pegylated asparaginase regimen.52 Our observations yield pharmacogenetic evidence for the utility of intensified asparaginase therapy in iAMP21 patients. In contrast, there were several discrepancies between previous reports and our observations. For example, although dic(9;20) samples were reported to show a higher in vitro asparaginase sensitivity,53 our analysis revealed that the majority of dic(9;20) samples showed a weak ASNS methylation (Figure 6D).
The limitation of our study is that the molecular mechanism for association between ASNS methylation and karyotypes remains unclear. Thus, we analyzed gene expression levels of 10 of 11 translocation enzymes and DNA methyltransferases in BCP-ALL cell lines (supplemental Figures 12-15). No association was observed in gene expression levels of TET1, TET2, DNMT1, and DNMT3A, whereas those of TET3 and DNMT3B, in particular isoforms 3, 7, and 8, which lack a portion of methyltransferase catalytic domain,54-56 were significantly higher in weakly methylated cell lines than in intermediately and highly methylated cell lines. We next analyzed those gene expression levels in childhood ALL samples by using a public database (supplemental Figure 16). However, no clear association that can explain a link between karyotypes and ASNS methylation status was observed. Thus, gene expression levels of translocation enzymes and DNA methyltransferases are unlikely to be a direct molecular mechanism for association of ASNS methylation with karyotypes.
ASNS is methylated in BCP-ALL cell lines in an allele-specific manner. However, ASNS itself is not a typical imprinted gene because it was not methylated in either sperm or MCT. The mammalian evolutionary tree reveals that gene alignment of the region between the 7q21 imprinted cluster and ASNS is widely conserved. Indeed, the methylation status of ASNS in BCP-ALL was correlated with that of typical imprinted genes at 7q21-22. A similar trend was confirmed in Asns gene methylation of a mouse ETV6-RUNX1 leukemia model. These observations indicate that ASNS is methylated in BCP-ALL in an allele-specific manner as a result of the aberrant methylation of a 7q21 imprinted cluster. In this study, fully methylated reads of ASNS were observed in a minor portion of the CD34+/CD19+ fraction of human cord blood. These observations suggest that ASNS is normally methylated in a tiny fraction of fetal and neonatal B-cell precursors. Under these circumstances, it might be possible to predict that some BCP-ALL with ASNS methylation may develop from B-cell precursors in which ASNS is normally methylated. In this scenario, association between karyotype and ASNS methylation status may be a result of methylation status in targeted B-cell precursors for each karyotype. Another possible mechanism for frequent ASNS methylation in BCP-ALL is that an allele-specific methylation of ASNS may be induced during leukemogenesis as a result of the aberrant methylation of a 7q21 imprinted cluster.
In conclusion, silencing of the ASNS gene because of aberrant imprinting is a pharmacogenetic mechanism for the leukemia-specific activity of asparaginase therapy in BCP-ALL. The ASNS methylation status of BCP-ALL is highly associated with not only karyotypes but also with therapeutic outcome. Considering the severe complications of asparaginase therapy, particularly in adolescents and adults,23,57 stratifying prospective asparaginase therapy by ASNS gene methylation status may be beneficial for safer and more effective precision medicine for patients with BCP-ALL, particularly in adolescents and adults. Because cancer cells show divergent methylation status,58,59 single-cell methylation analysis may provide further understanding of significance of ASNS methylation in asparaginase sensitivity.
For original data, please contact tinukai@yamanashi.ac.jp.
The online version of this article contains a data supplement.
The publication costs of this article were defrayed in part by page charge payment. Therefore, and solely to indicate this fact, this article is hereby marked “advertisement” in accordance with 18 USC section 1734.
Acknowledgments
The authors thank Y. Maeda (SU-Ph2, Kinki University), Y. Sato (TCCY, The Japanese Red Cross College of Nursing), T. Look (HALO1, Dana-Farber Cancer Institute), S. Okabe (SK9, Tokyo Medical University), and M. Endo (Endo-kun, Iwate Medical University) for providing cell lines; the members of the TCCSG for collecting samples and clinical information; and T. Nakano (Osaka University) and F. Ishino (Tokyo Medical and Dental University) for helpful discussion.
This work was supported by Grants-in-Aid for Scientific Research from Japan Society for the Promotion of Science (JSPS KAKENHI; JP15K09645 and JP17K17774) and by AMED (JP19ck0106253).
We dedicate this article to the memory of Shinpei Nakazawa, University of Yamanashi.
Authorship
Contribution: A.W., K.M., and T. Inukai designed the study and helped write the manuscript; A.W., K.M., H.G., K. Sakaguchi, T.S., K.K., M.A., K.A., K.G., and T. Inukai performed experiments; A.W., K.M., K.K., M.A., and T. Inukai interpreted the results; T. Inaba, J.T., H.G., M.M., S.I., and K. Sugita provided leukemic cell lines; N.K., A.O., J.T., H.G., and K. Sakaguchi provided clinical samples; L.v.d.W., N.Y., H.H., A.N., and T. Inaba provided mouse samples; T. Ikawa provided human cord blood samples; A.W., J.N., K.Y.U., K.M., S.K., Y.K., J.T., and T. Inukai performed statistical and bioinformatics analyses; A.-C.S. and K. Sugita supervising the study; and all authors critically reviewed the manuscript.
Conflict-of-interest disclosure: The authors declare no competing financial interests.
Correspondence: Takeshi Inukai, Department of Pediatrics, School of Medicine, University of Yamanashi, 1110 Shimokato, Chuo-city, Yamanashi, 409-3898, Japan; e-mail: tinukai@yamanashi.ac.jp.

This feature is available to Subscribers Only
Sign In or Create an Account Close Modal