

Key Points
Immune abnormalities are overrepresented in GPS, including autoimmune diseases, positive autoantibodies, and reduced leukocyte counts.
In GPS, multiple types of blood cells are deficient in granule proteins, and the plasma proteome has a proinflammatory profile.

Abstract
Gray platelet syndrome (GPS) is a rare recessive disorder caused by biallelic variants in NBEAL2 and characterized by bleeding symptoms, the absence of platelet α-granules, splenomegaly, and bone marrow (BM) fibrosis. Due to the rarity of GPS, it has been difficult to fully understand the pathogenic processes that lead to these clinical sequelae. To discern the spectrum of pathologic features, we performed a detailed clinical genotypic and phenotypic study of 47 patients with GPS and identified 32 new etiologic variants in NBEAL2. The GPS patient cohort exhibited known phenotypes, including macrothrombocytopenia, BM fibrosis, megakaryocyte emperipolesis of neutrophils, splenomegaly, and elevated serum vitamin B12 levels. Novel clinical phenotypes were also observed, including reduced leukocyte counts and increased presence of autoimmune disease and positive autoantibodies. There were widespread differences in the transcriptome and proteome of GPS platelets, neutrophils, monocytes, and CD4 lymphocytes. Proteins less abundant in these cells were enriched for constituents of granules, supporting a role for Nbeal2 in the function of these organelles across a wide range of blood cells. Proteomic analysis of GPS plasma showed increased levels of proteins associated with inflammation and immune response. One-quarter of plasma proteins increased in GPS are known to be synthesized outside of hematopoietic cells, predominantly in the liver. In summary, our data show that, in addition to the well-described platelet defects in GPS, there are immune defects. The abnormal immune cells may be the drivers of systemic abnormalities such as autoimmune disease.
Introduction
The discovery that biallelic variants in NBEAL2 cause gray platelet syndrome (GPS) has been a key advance in hematology1-3 and has improved our understanding of platelet and granule biology.4,5 The Nbeal2−/− mouse phenocopies the features of GPS, including bleeding, thrombocytopenia, absence of platelet alpha (α)-granules, splenomegaly, and bone marrow (BM) fibrosis.6-8 In addition to the known defects of the megakaryocyte–platelet axis, we and others have reported the susceptibility of Nbeal2−/− mice to bacterial and viral infection, which is implicated in increased organ damage, lower survival rates, and longer time to recovery upon infection.9,10 These observations have been attributed to defects of secretory granules in natural killer cells and neutrophils. It has also been shown that mast cells of Nbeal2−/− mice are deficient in storage vesicles11 and that monocytes have reduced granularity.9 Together with our observation that Nbeal2−/− megakaryocytes (MKs) have a proinflammatory profile,7 these findings highlight that Nbeal2 is important for normal granule function in MKs, platelets, and a variety of myeloid and lymphoid cells in mice. However, it has been unclear whether the immune cell defects seen in the murine model are relevant to the pathophysiology of GPS. Small series of patients with GPS have reported recurrent infection12-14 and atypical presentations of autoimmune lymphoproliferative syndrome.15,16 Neutrophil ultrastructure has been evaluated in several patients with GPS, with conflicting results: some reports have shown that neutrophil granules are preserved,17,18 whereas others have noted their absence.12,13
Given the paucity of published studies on patients with GPS with confirmed etiologic variants in NBEAL2, we established an international collaboration to systematically evaluate clinical and laboratory phenotypes in a large collection of patients. We focused on features related to immunity and followed this up with a detailed molecular characterization of plasma, platelets, and 3 different leukocyte populations in a subset of the patients using both protein mass spectrometry (MS) and RNA sequencing (RNA-seq).
Methods
This section contains a short description of the methods we have used. The supplemental Methods (available on the Blood Web site) provide further details.
Enrollment
All study participants provided written informed consent. The majority of participants enrolled into UK or French studies, all of which were approved by research ethics committees (UK: REC 13/EE/0325, REC 10/H0304/65, REC 10/H0304/66; France: INSERM RBM-014). The remaining participants consented using ethics procedures approved at the recruiting center.
Sequencing and variant interpretation
DNA was extracted and sequenced by using the ThromboGenomics next-generation sequencing platform, long-range PCR, or whole-genome sequencing.1,19-21 Pathogenicity classification of variants was determined in multidisciplinary meetings according to international guidelines22-25 and using computational tools.26-31 Only patients with etiologic variants in NBEAL2, defined as pathogenic (PV), likely pathogenic (LPV), and uncertain significance variants with at least 3 supporting or 1 moderate and 1 supporting piece of evidence (supplemental Table 1), were included.
Phenotyping of patients
Clinical information and the results of laboratory investigations, including the complete blood counts (CBCs), of the patients were obtained by the enrolling physicians. This information was used to record Human Phenotype Ontology (HPO) terms for each participant.32
BM biopsies
BM biopsies were performed on 23 patients with GPS. BM fibrosis was defined by a reticulin grade ≥2.33 Quantification of emperipolesis, the presence of intact neutrophils in the cytoplasm of MKs, was performed by manual counting on 3 samples.
Enhanced cellular phenotyping and plasma proteomics
Five patients with GPS and 5 healthy control participants attended a central center for a more complete evaluation under standardized conditions. A CBC was performed on a Sysmex XN-1000 analyzer. Additional measured blood cell parameters, not normally included in CBC reports, including forward scatter (FSC) and side scatter (SSC), were analyzed. In addition, platelets, neutrophils, monocytes, and CD4 lymphocytes were isolated from citrate anticoagulated blood.34 For each cell type, RNA was extracted and sequenced, and the lysate was analyzed by using protein MS. Plasma was obtained from EDTA anticoagulated blood of 11 patients with GPS and 13 healthy control participants and analyzed by using Sequential Window Acquisition of All Theoretical Mass Spectra–Mass Spectrometry. All control subjects were selected from a group of volunteers without comorbidities and were matched on age and sex as closely as possible to the patients with GPS (supplemental Tables 2 and 3).
Statistical analysis
The Fisher’s exact test was used for analyses unless stated otherwise.
Results
A wide spectrum of NBEAL2 variants cause GPS
Forty-seven patients from 38 genetically independent pedigrees were enrolled at 21 hospitals in 11 countries. We identified a total of 70 etiologic variants in NBEAL2, 32 of which were novel (Figure 1A; supplemental Table 1). Forty-three percent of variants were inherited in homozygosity and 57% in compound heterozygosity. Fifty-six variants were unique, 64% of which were classified as PV or LPV (Figure 1B). Of those unique variants, 38 were absent from the genotyping results of 162 100 individuals in the Genome Aggregation Database and the 100 000 Genomes Project; the minor allele frequencies of the remaining 18 were <0.00004.35,36
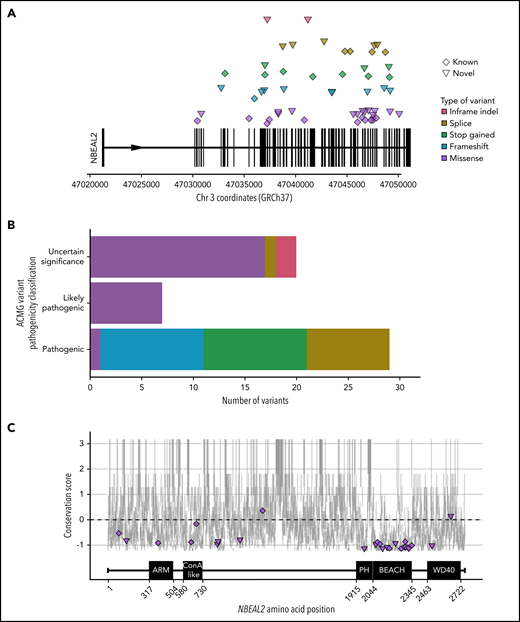
NBEAL2 variants identified in patients with GPS participating in this study. (A) Position of the 56 unique variants relative to NBEAL2 on chromosome 3 (Chr 3) using Genome Reference Consortium human genome build 37 (GRCh37). Vertical black bars represent exons. The color and shape used to represent variants in the legend apply throughout the figure. Inframe indel refers to variants which are inframe small insertions and/or deletions ≤50 base pairs. (B) The frequency of unique variants classified by pathogenicity, according to the American College of Medical Genetics and Genomics (ACMG) guidelines.22 (C) The location of missense variants compared with the amino acid sequence of Nbeal2 and known functional domains (on the x-axis). The y-axis position of the variant is the estimated evolutionary conservation score of the affected residue calculated by using ConSurf.37 A positive score corresponds to lower conservation, and a negative score represents higher conservation. Vertical gray lines represent the range of conservation scores of the 50% confidence interval: the bottom and top of the bar are the 25th and 75th percentile, respectively, of the inferred evolutionary rate distribution.
NBEAL2 variants identified in patients with GPS participating in this study. (A) Position of the 56 unique variants relative to NBEAL2 on chromosome 3 (Chr 3) using Genome Reference Consortium human genome build 37 (GRCh37). Vertical black bars represent exons. The color and shape used to represent variants in the legend apply throughout the figure. Inframe indel refers to variants which are inframe small insertions and/or deletions ≤50 base pairs. (B) The frequency of unique variants classified by pathogenicity, according to the American College of Medical Genetics and Genomics (ACMG) guidelines.22 (C) The location of missense variants compared with the amino acid sequence of Nbeal2 and known functional domains (on the x-axis). The y-axis position of the variant is the estimated evolutionary conservation score of the affected residue calculated by using ConSurf.37 A positive score corresponds to lower conservation, and a negative score represents higher conservation. Vertical gray lines represent the range of conservation scores of the 50% confidence interval: the bottom and top of the bar are the 25th and 75th percentile, respectively, of the inferred evolutionary rate distribution.
Missense variants accounted for 49% of all etiologic variants identified, with the remaining ones categorized (in descending order of frequency) as frameshift, stop gained, splice, and short insertion/deletion (indel) variants. We mapped the position of the missense variants onto the 5 known domains of Nbeal2 and determined the evolutionary conservation score of the affected residues37 (Figure 1C). Missense variants were enriched (P = 4.91 × 10⁻⁵) in the highly conserved BEACH domain, consistent with a suggested key role of this domain in the function of Nbeal2.5,38
We then mapped the 13 BEACH missense variants to the crystal structure of another BEACH domain–containing protein (BDCP), Nbea.39 Five variants occurred in the hydrophobic core of BEACH, a portion of which interacts with neighboring PH, a 129-residue domain with a neutral conservation score.37 However, we identified a novel missense variant, R1979W, in a portion of PH that is highly conserved; the position of this variant corresponds to Nbea R2208, shown to be functionally relevant for the PH–BEACH interface.40 To our knowledge, this is the first etiologic variant to be described in PH.
Bleeding and platelet phenotypes in GPS
Patients recruited into the study were between the ages of 6 and 70 years (median, 35 years). The median age at presentation was 11.5 years but this varied between 2 months and 67 years. All patients were thrombocytopenic, and α-granule deficiency was noted in the platelets of all cases assessed by electron or light microscopy (Figure 2A; supplemental Figure 2.1; supplemental Table 2). Consistent with previous reports,17,40,41 a wide spectrum of bleeding symptoms was reported, ranging from subcutaneous to intracranial hemorrhage. Five patients were notable for their lack of a bleeding diathesis.
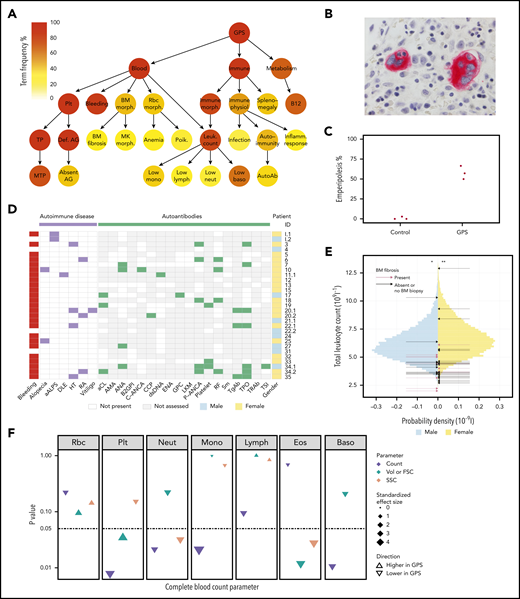
Novel clinical phenotypes. (A) Summary HPO tree, showing the 3 most frequent HPO organ systems represented in the 47 patients with GPS: Blood (“Abnormality of blood and blood-forming tissues”), Immune (“Abnormality of the immune system”), and Metabolism (“Abnormality of metabolism/homeostasis”). HPO terms affecting ≥8 patients are shown except terms associated with “Bleeding,” which are displayed in supplemental Figure 2.1. HPO term labels: Plt, “Abnormal thrombocyte morphology”; Bleeding, “Abnormal bleeding”; BM morph., “Abnormality of bone marrow cell morphology”; Rbc morph., “Abnormal erythrocyte morphology”; Immune morph., “Abnormal immune system morphology”; Immune physiol., “Abnormality of immune system physiology”; Splenomegaly, “Splenomegaly”; B12, “Abnormal vitamin B12 level”; TP, “Thrombocytopenia”; Def. AG, “Abnormal number of alpha granules”; BM fibrosis, “Myelofibrosis”; MK morph., “Abnormal megakaryocyte morphology”; Anemia, “Anemia”; Poik., “Poikilocytosis”; Leuk. count, “Abnormal leukocyte count”; Infection, “Recurrent infections”; Autoimmunity, “Autoimmunity”; Inflamm. response, “Increased inflammatory response”; MTP, “Macrothrombocytopenia”; Absent AG, “Absence of alpha granules”; Low mono, “Monocytopenia”; Low lymph, “Lymphopenia”; Low neut, “Neutropenia”; Low baso, “Decreased basophil count”; AutoAb, “Autoimmune antibody positivity.” (B) BM trephine image with CD61 stain (1000×) of patient ID 20.3, which shows neutrophil emperipolesis by 2 MKs. (C) Dot plot showing percentage of MKs with neutrophil emperipolesis in 3 patients with GPS (patient IDs 18, 33, and 34.1) (supplemental Figure 2.2 presents representative BM trephine images) and 3 control subjects. (D) Representation of autoimmune disease, results of autoantibody tests, and presence of bleeding symptoms in 29 patients with GPS (labeled according to patient ID) in whom autoantibody tests were performed. Autoantibodies tested in at least 3 patients are included (listed per order in graphic): aALPS, atypical autoimmune lymphoproliferative syndrome; DLE, discoid lupus erythematosus; HT, Hashimoto’s thyroiditis; RA, rheumatoid arthritis; and autoantibodies against: aCL, cardiolipin; AMA, mitochondria; ANA, nuclear; B2GPI, beta2-glycoprotein I; C-ANCA, neutrophil cytoplasmic; CCP, cyclic citrullinated peptide; dsDNA, double-stranded DNA; ENA, extractable nuclear antigen; GPC, gastric parietal cell; LKM, liver–kidney microsome; P-ANCA, neutrophil perinuclear; RF, rheumatoid factor; Sm, spliceosomal; TgAb, thyroglobulin; TPO, thyroperoxidase; TRAb, thyroid-stimulating hormone receptor; TSI, thyroid stimulating immunoglobulin. (E) Histogram showing the total leukocyte count of 45 032 blood donors in the INTERVAL study43 stratified according to sex, upon which the results of the patients with GPS are represented by arrows. The median total leukocyte count of both male and female patients with GPS was significantly (P = 3 × 10⁻³ and 4 × 10⁻⁴, respectively) lower than INTERVAL participants using a one-sample Wilcoxon signed-rank test, as represented by * and **. (F) CBC results for 5 patients with GPS vs 5 control subjects. The data point for each cell type and CBC parameter shows the absolute standardized effect size and directionality. On the y-axis (log10 scale), the P value (Mann-Whitney U test) is shown; the horizontal dotted line represents P < .05. Volume (Vol) or forward scatter (FSC) refers to the following measurements: mean cell volume (MCV) for red blood cells (Rbc), platelet mean frequent volume (P-MFV) for platelets (Plt); FSC for neutrophils (Neut), monocytes (Mono), lymphocytes (Lymph), eosinophils (Eos), and basophils (Baso). SSC was available for all parameters except basophils and reflects the complexity of cellular contents, including granularity.
Novel clinical phenotypes. (A) Summary HPO tree, showing the 3 most frequent HPO organ systems represented in the 47 patients with GPS: Blood (“Abnormality of blood and blood-forming tissues”), Immune (“Abnormality of the immune system”), and Metabolism (“Abnormality of metabolism/homeostasis”). HPO terms affecting ≥8 patients are shown except terms associated with “Bleeding,” which are displayed in supplemental Figure 2.1. HPO term labels: Plt, “Abnormal thrombocyte morphology”; Bleeding, “Abnormal bleeding”; BM morph., “Abnormality of bone marrow cell morphology”; Rbc morph., “Abnormal erythrocyte morphology”; Immune morph., “Abnormal immune system morphology”; Immune physiol., “Abnormality of immune system physiology”; Splenomegaly, “Splenomegaly”; B12, “Abnormal vitamin B12 level”; TP, “Thrombocytopenia”; Def. AG, “Abnormal number of alpha granules”; BM fibrosis, “Myelofibrosis”; MK morph., “Abnormal megakaryocyte morphology”; Anemia, “Anemia”; Poik., “Poikilocytosis”; Leuk. count, “Abnormal leukocyte count”; Infection, “Recurrent infections”; Autoimmunity, “Autoimmunity”; Inflamm. response, “Increased inflammatory response”; MTP, “Macrothrombocytopenia”; Absent AG, “Absence of alpha granules”; Low mono, “Monocytopenia”; Low lymph, “Lymphopenia”; Low neut, “Neutropenia”; Low baso, “Decreased basophil count”; AutoAb, “Autoimmune antibody positivity.” (B) BM trephine image with CD61 stain (1000×) of patient ID 20.3, which shows neutrophil emperipolesis by 2 MKs. (C) Dot plot showing percentage of MKs with neutrophil emperipolesis in 3 patients with GPS (patient IDs 18, 33, and 34.1) (supplemental Figure 2.2 presents representative BM trephine images) and 3 control subjects. (D) Representation of autoimmune disease, results of autoantibody tests, and presence of bleeding symptoms in 29 patients with GPS (labeled according to patient ID) in whom autoantibody tests were performed. Autoantibodies tested in at least 3 patients are included (listed per order in graphic): aALPS, atypical autoimmune lymphoproliferative syndrome; DLE, discoid lupus erythematosus; HT, Hashimoto’s thyroiditis; RA, rheumatoid arthritis; and autoantibodies against: aCL, cardiolipin; AMA, mitochondria; ANA, nuclear; B2GPI, beta2-glycoprotein I; C-ANCA, neutrophil cytoplasmic; CCP, cyclic citrullinated peptide; dsDNA, double-stranded DNA; ENA, extractable nuclear antigen; GPC, gastric parietal cell; LKM, liver–kidney microsome; P-ANCA, neutrophil perinuclear; RF, rheumatoid factor; Sm, spliceosomal; TgAb, thyroglobulin; TPO, thyroperoxidase; TRAb, thyroid-stimulating hormone receptor; TSI, thyroid stimulating immunoglobulin. (E) Histogram showing the total leukocyte count of 45 032 blood donors in the INTERVAL study43 stratified according to sex, upon which the results of the patients with GPS are represented by arrows. The median total leukocyte count of both male and female patients with GPS was significantly (P = 3 × 10⁻³ and 4 × 10⁻⁴, respectively) lower than INTERVAL participants using a one-sample Wilcoxon signed-rank test, as represented by * and **. (F) CBC results for 5 patients with GPS vs 5 control subjects. The data point for each cell type and CBC parameter shows the absolute standardized effect size and directionality. On the y-axis (log10 scale), the P value (Mann-Whitney U test) is shown; the horizontal dotted line represents P < .05. Volume (Vol) or forward scatter (FSC) refers to the following measurements: mean cell volume (MCV) for red blood cells (Rbc), platelet mean frequent volume (P-MFV) for platelets (Plt); FSC for neutrophils (Neut), monocytes (Mono), lymphocytes (Lymph), eosinophils (Eos), and basophils (Baso). SSC was available for all parameters except basophils and reflects the complexity of cellular contents, including granularity.
Raised vitamin B12 levels and stable BM fibrosis
Raised serum vitamin B12 levels (B12) were recorded for 31 of 34 patients, expanding the previous observations made in a smaller GPS collection.17 B12 was increased by at least 1.5 times the upper limit of the local reference range in two-thirds of patients (supplemental Figure 2.1; supplemental Table 2).
BM biopsies were performed in 23 patients, and 13 (57%) patients were diagnosed with BM fibrosis. Morphologic examination of 5 centrally reviewed trephine samples showed preservation of trilineage hematopoiesis (supplemental Figure 2.2). BM fibrosis was diagnosed at a median age of 28.5 years (range, 10-52 years), with a median of 16 years since this diagnosis to the present time. Patient 20.3 received an allogeneic stem cell transplant at age 32 years,42 but the rest of the patients have not required treatment of BM fibrosis. Neutrophil emperipolesis was observed in a mean of 58% MKs in 3 GPS BM trephines compared with only 1% in 3 trephines from control subjects (Figure 2B-C).
Patients with GPS have abnormalities of the immune system, including autoimmune disease affecting multiple organ systems
Coding of clinical and laboratory information by using HPO terms identified phenotypes associated with “Abnormality of the immune system” in 91% of patients (Figure 2A; supplemental Table 2). “Splenomegaly” (determined clinically or by ultrasound) was observed in 40% of patients and did not significantly overlap with BM fibrosis (χ2test, P = .26) (supplemental Figure 2.2). “Abnormal immune system morphology” (81%) was largely due to cytopenia of at least one leukocyte type (77%). “Abnormal immune system physiology” (51%) included “Recurrent infections” (17%), most commonly respiratory tract infections and otitis media, and “Autoimmunity” (43%), which consisted of autoimmune disease and positive autoantibodies. Twelve patients (26%) were diagnosed with an autoimmune disease with a wide spectrum of organ systems affected. These included the endocrine (Hashimoto’s thyroiditis), skeletal (rheumatoid arthritis), integumentary (alopecia, discoid lupus erythematosus, and vitiligo), and immune (atypical autoimmune lymphoproliferative syndrome) systems (Figure 2D). Twenty-nine patients had autoantibody tests performed and, of these, 17 (59%) had at least 1 positive test result. The 4 most frequent positive test results (in descending order of frequency) were anti-thyroperoxidase, perinuclear anti-neutrophil cytoplasmic antibodies, rheumatoid factor, and antinuclear antibodies.
Altered blood cell parameters of multiple cell lineages in patients with GPS
We compared the complete and differential leukocyte counts of all 47 patients with GPS against those of 45 032 healthy blood donors from the INTERVAL (Efficiency and Safety of Varying the Frequency of Whole Blood Donation) study.43 The median total leukocyte count of both male and female patients with GPS was significantly lower than for the INTERVAL participants (one-sample Wilcoxon signed-rank test, P = 3 × 10⁻³ and 4 × 10⁻⁴, respectively) (Figure 2E). All median differential leukocyte counts (neutrophil, monocyte, lymphocyte, eosinophil, and basophil counts), as well as platelet counts and hemoglobin concentrations, were significantly lower than the corresponding INTERVAL values (supplemental Figures 2.1 and 2.3; supplemental Table 2). Although we found no association between total leukocyte, granulocyte, or monocyte counts and BM fibrosis (logistic regression, P > .05), platelet and lymphocyte counts were inversely associated with the latter (logistic regression, P < .05). Furthermore, there was no association between total or any of the differential leukocyte counts and splenomegaly (logistic regression, P > .05).
In addition, 5 patients with GPS and 5 control subjects participated in a single-center follow-up study in which CBC measurements were conducted that included additional parameters (eg, FSC, SSC). This analysis confirmed that the neutrophil, monocyte, and basophil counts were significantly reduced in patients with GPS (Mann-Whitney U test, P < .05) (Figure 2F; supplemental Table 2). Moreover, the FSC and SSC measurements exhibited a significant reduction in GPS eosinophil size and granularity, the latter also holding true for neutrophils (Mann-Whitney U test, P < .05).
Genotype–phenotype analysis
We compared subgroups of the patients according to the type, position, and pathogenicity classification of their etiologic variant(s). The goal was to determine whether there were phenotypic differences as reported for other inherited disorders caused by pathogenic variants in BDCPs.44
First, patients were grouped into those with biallelic loss-of-function variants (frameshift, stop gained, and splice) and those with biallelic variants causing a change in the amino acid sequence but without truncation (hereafter called “protein-altering variants” [ie, missense and in-frame indels]), excluding patients with compound heterozygosity for one loss-of-function variant and one protein-altering variant. There were 23 patients in the loss-of-function group and 18 patients in the protein-altering group. There were no significant differences in age (current and at presentation), spleen size, or CBC parameters between the groups and no significant overrepresentation of BM fibrosis, recurrent infection, or autoimmune diseases in one group compared with the other (Welch two-sample t-test and Wilcoxon rank sum test, P > .05) (supplemental Table 2).
We then performed two additional comparisons repeating the aforementioned analysis using the same variables and statistical tests: patients with biallelic BEACH missense variants (n = 7) vs those with missense variants outside of BEACH (n = 5); and patients with biallelic variants of uncertain significance (n = 10) vs those with biallelic LPVs or PVs (n = 28). Although the statistical power was limited because of small group sizes, no significant genotype–phenotype associations were observed.
Platelets and leukocytes have altered transcriptome and proteome profiles in GPS
Prompted by the propensity to autoimmune diseases and the altered CBC parameters, we set out to obtain a more comprehensive understanding of the differences in cellular phenotypes of the same 5 patients with GPS who had additional CBC parameters measured. Platelets, neutrophils, monocytes, and CD4 lymphocytes were analyzed by using RNA-seq and protein MS, and the results were compared with those obtained for 5 control subjects. Principal component analysis of these data clearly delineated GPS and control samples, except for platelet RNA-seq (supplemental Figure 3.1). Across each of the 4 blood cell types, the number of differentially expressed genes ranged from 95 to 255 and differentially abundant proteins from 63 to 123 (Figure 3A; supplemental Table 3). Of the 123, 65, and 63 differentially abundant proteins in platelets, neutrophils, and monocytes, 89%, 86%, and 62% were reduced in patients with GPS, respectively. These reduced proteins were enriched in gene ontology (GO) terms pertaining to cell granules and their lumens. Nine proteins, including Nbeal2, were significantly reduced in patients with GPS in at least 3 of the blood cell types, and all are known to localize to blood cell granules (Figure 3B).
![The transcriptome and proteome of platelets, neutrophils, monocytes, and CD4 lymphocytes. For all panels, log2 fold change (log2 fold change [logFC]) for gene expression (by RNA-seq) and protein abundance (by MS) was determined by log2-transforming the ratio of the means of individual normalized values of the 5 patients with GPS and 5 control subjects. Negative values represent genes/proteins that are reduced in GPS and vice versa. The threshold for differential abundance/expression was determined by each experimental method and the corresponding analysis used (supplemental Methods). (A) Bar chart showing differentially expressed genes by RNA-seq (left) and differentially abundant proteins by MS (right). The y-axis represents the absolute number of genes or proteins determined by each method, and negative numbers represent significant reduction in GPS cells and vice versa. The most significant GO cellular component terms for the differentially less abundant proteins of each of the cell types is illustrated in the “Proteins” panel. (B) For each individual, the protein abundance was calculated for each of the 9 proteins that are differentially less abundant in at least 3 types of cells and averaged across all of the cells. The results were scaled from −1 to 1 and plotted as a dendrogram with heatmap, such that positive (dark blue) and negative (yellow) values represent higher and lower protein abundance, respectively. Hierarchical clustering was applied by using the complete linkage method, and dissimilarity between rows and columns was based on the Euclidean distance. Each column represents an individual GPS patient or control subject. (C) The comparison of gene expression and protein abundance of platelets (GPS vs control) highlights the high proportion of “alpha-granules” and “releasate” proteins (in red and orange, respectively), which are significantly diminished in GPS platelets at the protein level (P < 2.2 × 10⁻¹⁶), and also shows that proteins normally resident in neutrophil granules (blue) are increased in GPS platelets. (D) The comparison of gene expression and protein abundance of neutrophils (GPS vs control) separated vertically by subcellular localization shows a significantly lower abundance of specific and gelatinase granule proteins in GPS neutrophils (P < 1.3 × 10⁻⁸ and < 2.2 × 10⁻¹⁶, respectively).](https://ash.silverchair-cdn.com/ash/content_public/journal/blood/136/17/10.1182_blood.2019004776/1/m_bloodbld2019004776f3.png?Expires=1768772977&Signature=A826OgtJ3O0BRRMvpT~O-Aa61bF7XvjpslSXB~HsEpm-h8EOtQE8zWezZQ2Y3b3ZoOrOSZIAXd3w6PFMq9HEX3pJ7fLtwR3hNqsPEU4XAtyxdqnzY4EyRiA50Sx6Kq6rfdkujkaKGdut1BfNOuX4vbj5p8u4JdzLAmWvTNUhvSZCrJIcHyJHjInt-AGMjOYriEVGsU9Fm0zZitnXqKmvHVLavAP~14HH9iEm23oxZFvPCriXTPX8Qgscn7-JHsRNxG5bsDJHGpCswio74-AuMnnazVY5T3WQbR3fNfnaMhCj03Zp59HnvNN5tImN4nncAfsBWB4PpQY1IEVxVfamVQ__&Key-Pair-Id=APKAIE5G5CRDK6RD3PGA)
The transcriptome and proteome of platelets, neutrophils, monocytes, and CD4 lymphocytes. For all panels, log2 fold change (log2 fold change [logFC]) for gene expression (by RNA-seq) and protein abundance (by MS) was determined by log2-transforming the ratio of the means of individual normalized values of the 5 patients with GPS and 5 control subjects. Negative values represent genes/proteins that are reduced in GPS and vice versa. The threshold for differential abundance/expression was determined by each experimental method and the corresponding analysis used (supplemental Methods). (A) Bar chart showing differentially expressed genes by RNA-seq (left) and differentially abundant proteins by MS (right). The y-axis represents the absolute number of genes or proteins determined by each method, and negative numbers represent significant reduction in GPS cells and vice versa. The most significant GO cellular component terms for the differentially less abundant proteins of each of the cell types is illustrated in the “Proteins” panel. (B) For each individual, the protein abundance was calculated for each of the 9 proteins that are differentially less abundant in at least 3 types of cells and averaged across all of the cells. The results were scaled from −1 to 1 and plotted as a dendrogram with heatmap, such that positive (dark blue) and negative (yellow) values represent higher and lower protein abundance, respectively. Hierarchical clustering was applied by using the complete linkage method, and dissimilarity between rows and columns was based on the Euclidean distance. Each column represents an individual GPS patient or control subject. (C) The comparison of gene expression and protein abundance of platelets (GPS vs control) highlights the high proportion of “alpha-granules” and “releasate” proteins (in red and orange, respectively), which are significantly diminished in GPS platelets at the protein level (P < 2.2 × 10⁻¹⁶), and also shows that proteins normally resident in neutrophil granules (blue) are increased in GPS platelets. (D) The comparison of gene expression and protein abundance of neutrophils (GPS vs control) separated vertically by subcellular localization shows a significantly lower abundance of specific and gelatinase granule proteins in GPS neutrophils (P < 1.3 × 10⁻⁸ and < 2.2 × 10⁻¹⁶, respectively).
The transcriptome and proteome of platelets, neutrophils, monocytes, and CD4 lymphocytes. For all panels, log2 fold change (log2 fold change [logFC]) for gene expression (by RNA-seq) and protein abundance (by MS) was determined by log2-transforming the ratio of the means of individual normalized values of the 5 patients with GPS and 5 control subjects. Negative values represent genes/proteins that are reduced in GPS and vice versa. The threshold for differential abundance/expression was determined by each experimental method and the corresponding analysis used (supplemental Methods). (A) Bar chart showing differentially expressed genes by RNA-seq (left) and differentially abundant proteins by MS (right). The y-axis represents the absolute number of genes or proteins determined by each method, and negative numbers represent significant reduction in GPS cells and vice versa. The most significant GO cellular component terms for the differentially less abundant proteins of each of the cell types is illustrated in the “Proteins” panel. (B) For each individual, the protein abundance was calculated for each of the 9 proteins that are differentially less abundant in at least 3 types of cells and averaged across all of the cells. The results were scaled from −1 to 1 and plotted as a dendrogram with heatmap, such that positive (dark blue) and negative (yellow) values represent higher and lower protein abundance, respectively. Hierarchical clustering was applied by using the complete linkage method, and dissimilarity between rows and columns was based on the Euclidean distance. Each column represents an individual GPS patient or control subject. (C) The comparison of gene expression and protein abundance of platelets (GPS vs control) highlights the high proportion of “alpha-granules” and “releasate” proteins (in red and orange, respectively), which are significantly diminished in GPS platelets at the protein level (P < 2.2 × 10⁻¹⁶), and also shows that proteins normally resident in neutrophil granules (blue) are increased in GPS platelets. (D) The comparison of gene expression and protein abundance of neutrophils (GPS vs control) separated vertically by subcellular localization shows a significantly lower abundance of specific and gelatinase granule proteins in GPS neutrophils (P < 1.3 × 10⁻⁸ and < 2.2 × 10⁻¹⁶, respectively).
GPS platelets are diminished in α-granule cargo but contain neutrophil granule proteins
Of the proteins differentially less abundant in GPS platelets, there was a significant overrepresentation of proteins known to be present in α-granules and/or the platelet releasate (73 of 110, P < 2.2 × 10⁻¹⁶) (Figure 3C; the supplemental Methods provide classification of protein localization). None of these proteins was differentially expressed in the RNA-seq analysis, suggesting that a loss of function of Nbeal2 does not affect the transcriptional output of α-granule–associated genes in platelets. We then inspected the 13 proteins differentially more abundant in GPS platelets. Five of these, including elastase (Elane) and myeloperoxidase (Mpo), are known to localize to neutrophil granules45 (supplemental Figure 3.2). Furthermore, when analyzing the platelet proteomics data using a less stringent cutoff (log2 fold change >0.5) than that used to determine differential protein abundance (log2 fold change ≥2), we identified 54 proteins more abundant in GPS platelets at this threshold. Fourteen of these proteins are normally localized in neutrophil granules, which indicated a significant overrepresentation of neutrophil granule proteins in GPS platelets (P = 6.6 × 10⁻⁴). Importantly, none of these 14 proteins is known to localize to platelet granules,46-48 only 5 of these 14 have been detected previously in the platelet proteome,49 and only 3 of the 14 were differentially expressed genes in the GPS platelet transcriptome.
GPS neutrophils and monocytes are deficient in granule proteins
To explore the GPS neutrophil proteome, we annotated the differentially abundant proteins according to their presence or absence in granules. For known granule proteins, these were further annotated according to granule subtype (supplemental Methods). Of the 56 differentially abundant proteins that were reduced in GPS neutrophils (Figure 3A), 36 (65%) could be assigned to different granule subtypes (Figure 3D; supplemental Figure 3.3; supplemental Table 3) and there was a significant overrepresentation of proteins that normally localize to the gelatinase and specific granules (P < 1.3 × 10⁻⁸ and < 2.2 × 10⁻¹⁶, respectively). Given the reduced counts of monocytes in our patients with GPS, we hypothesized that a lack of functional Nbeal2 could also influence the granularity of these cells. Because there is no authoritative publication on the monocyte granule proteome, we annotated the differentially abundant proteins as granule proteins if they overlapped with proteins detected in platelet releasate, α-granules, or neutrophil granules. Of the 39 proteins reduced in GPS monocytes, 29 had a granular localization (supplemental Figure 3.4). Similar to GPS platelets and neutrophils, the genes encoding these 29 proteins were not differentially expressed in our RNA-seq analysis.
GPS CD4 lymphocytes upregulate markers of immune responses
Given the associations between CD4 lymphocytes and autoimmune disorders,50 we also included these cells for evaluation by using RNA-seq and protein MS. In contrast to the other 3 cell types analyzed, the majority of differentially abundant proteins in GPS CD4 lymphocytes (57 of 71) were increased (Figure 3A; supplemental Table 3), and there was a correlation with gene expression (supplemental Figure 3.4). Among these proteins/genes differentially more abundant and more highly expressed, there was an overrepresentation of proteins involved in immunomodulatory functions; for example, Bruton tyrosine kinase (Btk) and the α-chain of the receptor for the Fc domain of IgE (Fcer1a).
The GPS plasma proteome has a proinflammatory and hepatic signature
We postulated that the granular abnormalities in the blood cells evaluated might lead to systemic changes in the blood circulation. To this end, we analyzed the plasma of 11 GPS patients and 13 control subjects using Sequential Window Acquisition of All Theoretical Mass Spectra-Mass Spectrometry. First, an unsupervised random forest analysis of the normalized concentration of plasma proteins segregated patient and control samples and determined 51 discriminatory proteins (Figure 4A; supplemental Table 3). The analysis showed that 11 and 40 discriminatory proteins had higher and lower concentrations, respectively, in patients. GO enrichment analysis highlighted the presence of terms associated with inflammation and immune response, particularly in the top-ranked GO terms for the 11 proteins more abundant in GPS plasma (Figure 4B). We then overlapped the discriminatory plasma proteins with the proteome of the 4 cell types analyzed. Fourteen of the discriminatory plasma proteins were differentially abundant in the proteome of at least 1 cell type, but the pattern of directionality differed according to protein (Figure 4C). Interestingly, proteins that were less abundant in the GPS platelet proteome were also less abundant in GPS plasma, including proteins localized to α-granules. In contrast, all of the 4 overlapping proteins with higher levels in plasma are known to be present in neutrophil granules. Of these, cathelicidin antimicrobial peptide (Camp), cysteine-rich secretory protein 3 (Crisp3), and neutrophil gelatinase-associated lipocalin (Lcn2) were all differentially less abundant in GPS neutrophils, and all localize to the neutrophil-specific granules.45
![The GPS plasma proteome. (A) A heatmap of normalized protein abundance of the 51 discriminatory proteins detected in plasma from 11 patients with GPS and 13 control subjects, which showed segregation by unsupervised clustering. Each column represents an individual GPS patient or control subjects. (B) Classification of the 51 discriminatory proteins of the plasma proteome by directionality in GPS plasma, cellular origin (hematopoietic or nonhematopoietic), and subcellular localization (platelet α or neutrophil granules). Proteins involved in inflammatory or immune responses are highlighted in yellow. (C) A dot plot representing the 14 discriminatory plasma proteins that are also differentially abundant proteins in at least one of the cell types evaluated by using Sequential Window Acquisition of All Theoretical Mass Spectra-Mass Spectrometry (platelets [Plt], neutrophils [Neut], monocytes [Mono], and CD4 lymphocytes [CD4]). Each data point represents a protein and is color-coded according to its directionality in the respective proteome. Absence of a protein in an explicit cell-specific proteome denotes a protein that was determined not to be differentially abundant. Proteins are annotated by granule localization (AG = platelet α granule, NG = neutrophil granule) or, for proteins not localized in granules, gene expression in hematopoietic cells (HC) or non-hematopoietic cells (N-HC) in the BLUEPRINT consortium atlas.51 (D) A heatmap showing the gene expression of the 14 discriminatory plasma proteins of nonhematopoietic origin in the Genotype-Tissue Expression Project.52,53 Scaled gene expression represents log2 transformation of transcripts per million base pairs mapped.](https://ash.silverchair-cdn.com/ash/content_public/journal/blood/136/17/10.1182_blood.2019004776/1/m_bloodbld2019004776f4.png?Expires=1768772977&Signature=UohR-s75F0gJruUF2TSDjbUW5QLU3aiTQtrHd3VG2ehMMNomhUJ960xrS5QzlppFyKLPJ6zQYnNzka6gaiKBAGlVwRM3mwNd3DLYnE7x63o8I5fVh8Yqoam-HHbZs8A9SKvDxdo0wYfaJ1VDd4L9xKKt3GJfZZNxoJooRNDIxf0SfjUoD5gayc3ImvRpo2492wF-C7z-SUv~NkLkJjpsc1OfPEy-VSm~LqmP7NkPem-NnDlH3pOCR3r~ArkomWLzZJoS2FgF9sCMghi7~GWMv7PS0O~ckcKNsYejK9qY-jlmpgFv0oPkbruJFcS~IOFPX~vFmocTnnnSFgOwKRwKFw__&Key-Pair-Id=APKAIE5G5CRDK6RD3PGA)
The GPS plasma proteome. (A) A heatmap of normalized protein abundance of the 51 discriminatory proteins detected in plasma from 11 patients with GPS and 13 control subjects, which showed segregation by unsupervised clustering. Each column represents an individual GPS patient or control subjects. (B) Classification of the 51 discriminatory proteins of the plasma proteome by directionality in GPS plasma, cellular origin (hematopoietic or nonhematopoietic), and subcellular localization (platelet α or neutrophil granules). Proteins involved in inflammatory or immune responses are highlighted in yellow. (C) A dot plot representing the 14 discriminatory plasma proteins that are also differentially abundant proteins in at least one of the cell types evaluated by using Sequential Window Acquisition of All Theoretical Mass Spectra-Mass Spectrometry (platelets [Plt], neutrophils [Neut], monocytes [Mono], and CD4 lymphocytes [CD4]). Each data point represents a protein and is color-coded according to its directionality in the respective proteome. Absence of a protein in an explicit cell-specific proteome denotes a protein that was determined not to be differentially abundant. Proteins are annotated by granule localization (AG = platelet α granule, NG = neutrophil granule) or, for proteins not localized in granules, gene expression in hematopoietic cells (HC) or non-hematopoietic cells (N-HC) in the BLUEPRINT consortium atlas.51 (D) A heatmap showing the gene expression of the 14 discriminatory plasma proteins of nonhematopoietic origin in the Genotype-Tissue Expression Project.52,53 Scaled gene expression represents log2 transformation of transcripts per million base pairs mapped.
The GPS plasma proteome. (A) A heatmap of normalized protein abundance of the 51 discriminatory proteins detected in plasma from 11 patients with GPS and 13 control subjects, which showed segregation by unsupervised clustering. Each column represents an individual GPS patient or control subjects. (B) Classification of the 51 discriminatory proteins of the plasma proteome by directionality in GPS plasma, cellular origin (hematopoietic or nonhematopoietic), and subcellular localization (platelet α or neutrophil granules). Proteins involved in inflammatory or immune responses are highlighted in yellow. (C) A dot plot representing the 14 discriminatory plasma proteins that are also differentially abundant proteins in at least one of the cell types evaluated by using Sequential Window Acquisition of All Theoretical Mass Spectra-Mass Spectrometry (platelets [Plt], neutrophils [Neut], monocytes [Mono], and CD4 lymphocytes [CD4]). Each data point represents a protein and is color-coded according to its directionality in the respective proteome. Absence of a protein in an explicit cell-specific proteome denotes a protein that was determined not to be differentially abundant. Proteins are annotated by granule localization (AG = platelet α granule, NG = neutrophil granule) or, for proteins not localized in granules, gene expression in hematopoietic cells (HC) or non-hematopoietic cells (N-HC) in the BLUEPRINT consortium atlas.51 (D) A heatmap showing the gene expression of the 14 discriminatory plasma proteins of nonhematopoietic origin in the Genotype-Tissue Expression Project.52,53 Scaled gene expression represents log2 transformation of transcripts per million base pairs mapped.
Cross-referencing the discriminatory plasma proteins with the BLUEPRINT consortium gene expression data51 revealed that 14 of the discriminatory plasma proteins are not known to be expressed in hematopoietic cells (Figure 4B; supplemental Figure 4). We then analyzed the gene expression of these 14 proteins in the Genotype-Tissue Expression database,52,53 which showed that 9 of these nonhematopoietic proteins are predominantly synthesized by liver-residing cells. These include known acute-phase reactants such as C-reactive protein and lipopolysaccharide-binding protein (Figure 4D), both of which had increased levels in the plasma of patients with GPS.
Discussion
Through our international collaboration, we brought together the largest collection, to date, of patients with GPS. We report on 56 unique etiologic NBEAL2 variants. Thirty-two variants were newly identified, including 1 in the PH domain. By comprehensively re-assessing established phenotypes of GPS in 47 patients, we confirm that there is marked heterogeneity of bleeding symptoms, a near-universal increase in B12, and BM neutrophil emperipolesis.17,40,54 Our data further suggest that splenomegaly and BM fibrosis each occur in one-half of patients but without significant overlap. Importantly, in the majority of patients, BM fibrosis seems to be nonprogressive and is likely to be a reactive phenomenon that does not generally require intervention. We show that the median count for all leukocyte types is reduced in GPS and reveal that neutrophil granularity, as assessed by SSC, is reduced. We also show, for the first time, that eosinophil SSC is diminished, suggesting a potential role for Nbeal2 in the granule biology of these cells.
Immune dysregulation in patients was common, with more than one-half having detectable autoantibodies and one-quarter clinically manifesting autoimmune disease. Comparison with HPO terms in a control collection of 428 patients with suspected inherited thrombocytopenia21 revealed autoimmunity only in 3%, suggesting an overrepresentation of this phenotype in GPS. We observed a wide spectrum of immune pathologies, including newly described associations with rheumatoid arthritis, alopecia, and skin-related autoimmune disorders. In addition, we extend a previous single case report of Hashimoto’s thyroiditis12 in GPS to 4 patients. Almost 20% of the patients had recurrent infections corroborating our observations in Nbeal2−/− mice.10 The wide spectra of autoimmune diseases and immunodeficiency in the context of granule defects are also the consequence of Mendelian disorders of other BDCP genes, such as LYST,38 and highlight the disruptive effect of etiologic variants in NBEAL2 on a variety of immune cells. This was shown in the RNA-seq and protein MS analysis of GPS platelets, neutrophils, monocytes, and CD4 lymphocytes, in which there were widespread differences in the transcriptome and proteome of all cells evaluated. This finding is in stark contrast to the isolated platelet defect seen in our recent description of IKZF5-related thrombocytopenia, a disorder also accompanied by reduced α-granularity.34
GPS platelets were markedly diminished in proteins known to localize to α-granules, but unexpectedly, we observed that proteins which were differentially more abundant in GPS platelets were enriched with neutrophil granule constituents. Given the lack of a concordant increase in expression of the genes corresponding to these proteins in our RNA-seq analysis, 2 potential mechanisms to explain this are endocytosis by circulating platelets or emperipolesis by MKs. Although we cannot discard the former, we reason that emperipolesis is likely to have consequences in the platelet progeny produced by MKs that have engulfed neutrophils. The transfer of membrane between MKs and neutrophils during emperipolesis has been reported,55 and a recent functional genomic study reported an association of Mpo, known to localize to neutrophil-specific granules, with mean platelet volume highlighting the cross-talk between neutrophils and platelets.56 Hence, the release of neutrophil granule proteins inside MKs during emperipolesis would provide a plausible explanation for the higher level of these proteins in GPS platelets.
Our proteomic data set strongly supports the reduction of specific granule proteins in GPS neutrophils, an observation that has previously been contested,12,13,18 and shows for the first time that gelatinase granule constituents are also depleted. Our results also show a significant depletion of granule proteins from the monocytes of patients with GPS, supporting findings in Nbeal2−/− mice.9
The majority of CD4 lymphocytes do not contain secretory granules, which may provide an explanation for the underrepresentation of granule proteins in the differential transcriptome and proteome of these cells in patients with GPS. However, GPS CD4 lymphocytes showed the strongest correlation between the transcriptome and the proteome with a significant upregulation of multiple transcripts and their corresponding proteins. This upregulation is enriched in GO terms related to immune responses. For instance, BTK, whose protein is critical for B-cell development, was both more highly expressed and its protein differentially more abundant in GPS CD4 lymphocytes compared with those in control subjects. The role of Btk in the regulation of T cells may be relevant to the autoimmune disorders seen in our patients with GPS and warrants exploration in further research studies.57,58
Although we observed a depletion of granule proteins in GPS neutrophils and monocytes, some granule proteins such as Camp, which has a function in innate immunity, as well as other proteins related to the acute phase response were increased in the patient plasma. Furthermore, more than one-quarter of the discriminatory plasma proteins are not known to be synthesized by blood cells, the majority of which are produced in liver-residing cells. Possible mechanisms to explain this observation in patients with GPS include the systemic activation of the liver by proinflammatory myeloid granule proteins and/or the abnormal infiltration of atypical blood cells into the liver.
In conclusion, our study identifies novel features of GPS, including reduced leukocyte counts, autoimmune diatheses, hypogranularity of myeloid cells, and a proinflammatory plasma proteome. By evaluating GPS patient phenotypes at both the clinical and cellular level, our study provides further evidence for the role of Nbeal2 in the granule and cell biology of platelets and immune cells and highlights the prevalence of immune dysregulation not previously associated with this rare bleeding disorder.
All newly identified NBEAL2 variants have been deposited in ClinVar (NIHR_Bioresource_Rare_Diseases_GPS). RNA-seq data have been deposited in the European Genome-phenome Archive (EGAD00001005950). Cell type–specific and plasma proteomics data have been deposited in the Proteomics Identifications Database, PRIDE (PXD016366 and PXD017227, respectively).
The online version of this article contains a data supplement.
The publication costs of this article were defrayed in part by page charge payment. Therefore, and solely to indicate this fact, this article is hereby marked “advertisement” in accordance with 18 USC section 1734.
Acknowledgments
The authors thank Rachel Linger (National Institute for Health Research BioResource [NIHR-BR]) for assistance with recruitment of patients and healthy donors, Amy Frary and Carly Kempster (Department of Haematology, National Health Service Blood and Transplant [NHSBT]) for phlebotomy and sample collection/processing, Joana Batista (Department of Haematology, NHSBT) for assistance with patient visits to Cambridge and sample processing, Daniel Duarte (NIHR-BR) for DNA sample preparation of ThromboGenomics samples, Lisa Skeates and Luis Campos (Hematopathology and Oncology Diagnostic Service, Cambridge University Hospitals NHS Trust) for preparation of BM trephine specimens, Pedro Martin-Cabrera for providing control BM trephine specimens (Hematopathology and Oncology Diagnostic Service, Cambridge University Hospitals NHS Trust), Daniel Cutler (University College London) for review of electron microscopy images, James Thaventhiran (University of Cambridge) for evaluation of CD4 lymphocyte data, Parsa Akbari (University of Cambridge) for information provided about FSC and SSC measurements in INTERVAL participants, Paul Sims for editorial review of the manuscript, and Jo Westmoreland for production of the visual abstract. The authors also thank NIHR-BR volunteers for their participation and gratefully acknowledge NIHR-BR centers, NHS Trusts, and staff for their contribution. They also thank the NIHR and NHSBT.
M.C.S and J.H.C. are supported by Medical Research Council Clinical Research Training Fellowships (MR/R002363/1 and MR/P02002X/1). L.M. is supported by a studentship grant from the Rosetrees Trust. T.K.B. was supported by the NHSBT and the British Society for Haematology. D.S. was in part funded by an Isaac Newton Trust/Wellcome Trust Institutional Strategic Support Fund fellowship to M.F. L.K. and A.S. acknowledge support by the Ministerium für Kultur und Wissenschaft des Landes Nordrhein-Westfalen, the Regierende Bürgermeister von Berlin-inkl. Wissenschaft und Forschung, and the Bundesministerium für Bildung und Forschung and A.S. is supported by the Deutsche Forschungsgemeinschaft (DFG, SFB 1116 and TR 240). L.B. was supported by a fellowship from Fondazione Umberto Veronesi. P.G. was supported by a Telethon Foundation Grant (GGP15063). K.F. is supported by the Research Council of the KULeuven (C14/19/096) and by unrestricted grants of the Swedish Orphan Biovitrum AB, Bayer, and CSL Behring. M.F. is supported by the British Heart Foundation (FS/18/53/33863). This work was performed by using resources provided by the Cambridge Service for Data Driven Discovery operated by the University of Cambridge Research Computing Service, provided by Dell EMC and Intel using Tier-2 funding from the Engineering and Physical Sciences Research Council (EP/P020259/1), and DiRAC funding from the Science and Technology Facilities Council.
The views expressed are those of the authors and not necessarily those of the National Health Service, the NIHR, or the Department of Health and Social Care in England. This research was made possible through access to the data and findings generated by the 100 000 Genomes Project. The 100 000 Genomes Project is managed by Genomics England Limited (a wholly owned company of the Department of Health and Social Care). The 100 000 Genomes Project is funded by the NIHR and NHS England. The Wellcome Trust, Cancer Research UK, and the Medical Research Council have also funded research infrastructure. The 100 000 Genomes Project uses data provided by patients and collected by the National Health Service as part of their care and support.
Authorship
Contribution: M.C.S., L.M., J.H.C., W.H.O., and J.A.G. wrote the manuscript; M.C.S., L.M., J.H.C., T.K.B., K.M., C.L.-B., M.-C.A., W.F.B., L.B., E.C., E.D.C., K.G., A.G., P.G., D.H., M.-F.H., A.M.K., R.K., S.L.Q., T.L., E.B.L., A.D.M., S.M., D.N., S.P., S.J.P., J.P., G.M.P., M.-C.P., M.S., H.S., S.S., O.S.-S., R.C.T., J.K.M.W., B.Z., K.F., P.N., and R.F. recruited participants into the study and collected phenotype data; M.C.S., L.M., J.H.C., T.K.B., L.K., F.S.B., S.F., R.D.S., R.M., H.M., R.R., J.C.S., W.N.E., and J.A.G. handled and processed samples and performed experiments; M.C.S., L.M., J.H.C., K.M., D.S., L.K., F.S.B., D.G., D.L., A.R.-R., W.J.A., S.V.V.D., L.G., E.T., T.W.K., K.D., W.N.E., and J.A.G. analyzed data; E.T., A.D.W., A.S., K.D., W.N.E., M.F., W.H.O., and R.F. provided oversight of recruitment processes and analysis pipelines; and W.H.O. and J.A.G. supervised the project.
Conflict-of-interest disclosure: The authors declare no competing financial interests.
A complete list of the members of the NIHR BioResource is provided in supplemental Table 4.
Correspondence: Janine H. Collins, Department of Haematology, University of Cambridge, NHS Blood and Transplant Building, Long Road, Cambridge CB2 0PT, United Kingdom; e-mail: jc2018@medschl.cam.ac.uk; and Jose A. Guerrero, Department of Haematology, University of Cambridge, NHS Blood and Transplant Building, Long Road, Cambridge CB2 0PT, United Kingdom; e-mail: jg652@medschl.cam.ac.uk.
