

Key Points
High-resolution proteomics identifies characteristic targetable pathways active in functionally validated LSCs compared to healthy HSPCs.
Metabolic pathway changes are primarily evident at the protein, not transcript, level, highlighting the strength of proteomic analyses.

Abstract
Acute myeloid leukemia is characterized by the accumulation of clonal myeloid blast cells unable to differentiate into mature leukocytes. Chemotherapy induces remission in the majority of patients, but relapse rates are high and lead to poor clinical outcomes. Because this is primarily caused by chemotherapy-resistant leukemic stem cells (LSCs), it is essential to eradicate LSCs to improve patient survival. LSCs have predominantly been studied at the transcript level, thus information about posttranscriptionally regulated genes and associated networks is lacking. Here, we extend our previous report on LSC proteomes to healthy age-matched hematopoietic stem and progenitor cells (HSPCs) and correlate the proteomes to the corresponding transcriptomes. By comparing LSCs to leukemic blasts and healthy HSPCs, we validate candidate LSC markers and highlight novel and potentially targetable proteins that are absent or only lowly expressed in HSPCs. In addition, our data provide strong evidence that LSCs harbor a characteristic energy metabolism, adhesion molecule composition, as well as RNA-processing properties. Furthermore, correlating proteome and transcript data of the same individual samples highlights the strength of proteome analyses, which are particularly potent in detecting alterations in metabolic pathways. In summary, our study provides a comprehensive proteomic and transcriptomic characterization of functionally validated LSCs, blasts, and healthy HSPCs, representing a valuable resource helping to design LSC-directed therapies.
Introduction
Acute myeloid leukemia (AML) is a rapidly progressing hematologic malignancy characterized by the accumulation of clonal myeloid progenitor cells arrested in their ability to differentiate into mature blood cells.1 Although classic chemotherapy regimens lead to remission in the majority of patients, relapse rates are high. Relapse and therapy refractoriness are caused by the hierarchical organization of AML with a minor fraction of chemotherapy-resistant leukemic stem cells (LSCs) at the apex generating leukemic progeny, which make up the majority of leukemic cells.2-5 From a clinical perspective, the cancer stem cell model implies that, in order to achieve long-term remissions, treatment courses must eliminate the LSC population.6 This view is also supported by the fact that patients with AMLs expressing LSC signatures have a significantly worse prognosis.7-9 In recent years, there has been an intensive effort to identify surface markers preferentially expressed on LSCs that would facilitate the prospective isolation of LSCs.10 Nonetheless, functional characterization of the cell’s capacity to reinitiate the leukemia after xenotransplantation into immunocompromised mice remains the gold standard for the detection of LSCs.9 Molecular properties of LSCs and their discrimination from healthy hematopoietic stem and progenitor cells (HSPCs) have predominantly been studied at the transcript level.8,9,11 However, whether transcriptome characteristics are also translated to the protein level remains to be verified. We have recently reported an in-depth characterization of functionally validated human AML stem cell populations.12 In the study presented here, we expand our approach to bone marrow–derived and age-matched healthy HSPCs and scrutinize the full proteomic data set, allowing us to identify robust LSC-specific proteins and pathways. Furthermore, we map the proteomic data to corresponding RNA-sequencing (RNA-Seq) analyses from the same LSC, blast, and HSPC populations to directly correlate the proteome and transcriptome. Our results provide strong evidence that LSCs harbor a specific energy and amino acid metabolism as well as characteristic RNA-processing properties compared with blasts and HSPCs. We highlight novel LSC-specific proteins and discuss their biological role. By correlating proteome to transcript data, we show that proteomic analyses offer a substantial advantage over RNA-based technologies, particularly in the detection of metabolic pathways active in LSCs, suggesting that these processes are regulated by posttranscriptional mechanisms. Based on our results, we discuss potential targeted therapeutic interventions to improve clinical outcomes of patients with AML.
Materials and methods
AML and healthy bone marrow
AML samples were collected from diagnostic bone marrow aspirations at the university hospitals in Heidelberg, Dresden, and Berlin, Germany, after obtaining informed written consent. Cytogenetic and limited mutational analyses were performed during clinical routines. In addition, targeted sequencing was performed as described.13 Healthy bone marrow samples of age-matched controls were obtained during hip-replacement surgeries from patients without hematologic conditions at the BG Trauma Center Ludwigshafen, Ludwigshafen am Rhein, Germany, after obtaining informed written consent. Bone marrow mononuclear cells (MNCs) were isolated by density gradient centrifugation and stored in liquid nitrogen until further use.
All experiments involving human samples were conducted in compliance with the Declaration of Helsinki, and all relevant ethical regulations and were approved by local ethics committees. Patient characteristics are summarized in supplemental Table 1 (available on the Blood Web site).
Mouse experiments
NOD.Prkdcscid.Il2rgnull (NSG) mice were bred and housed under specific pathogen-free conditions at the central animal facility of the German Cancer Research Center (DKFZ). Animal experiments were conducted in compliance with all relevant ethical regulations and were approved by the Regierungspräsidium Karlsruhe under Tierversuchsantrag G108/12 and G243/16.
Determination of in vivo leukemia-initiating potential, flow cytometry, and cell sorting
Xenotransplantation experiments and cell sorting were performed as described.12 For fluorescence-activated cell sorting (FACS) validation experiments in a larger cohort of AML samples, we stained MNCs with anti-human CD4–peridinin-chlorophyll protein (PerCP) (RPA-T4), anti-human CD8-PerCP (RPA-T8), anti-human CD19-PerCP (HIB19), anti-human CD20-PerCP (2H7), anti-human CD11a-allophycocyanin (APC) (HI111), anti-human CD18-phycoerythrin (PE) (CBR LFA-1/2), anti-human CD123-BV510 (6H6), anti-human CD321–fluorescein isothiocyanate (FITC) (OV-5B8), anti-human GPR56-PE-Cy7 (CG4, all obtained from BioLegend), anti-human CD26-PE (2A6), anti-human CD34-APC-eF780 (4H11), anti-human CD38-AF700 (HIT2, all obtained from eBioscience), anti-human CD11b-APC (ICRF44) and anti-human CD36-FITC (CB38, both obtained from BD Biosciences). Phenotypic LSCs were defined as Lin−CD34+CD38− or Lin−GPR56+ (in CD34− AML cases); blasts were defined as Lin−CD34−CD38+ or Lin−GPR56−.
Proteome analysis
Proteome analysis of AML populations has been described before.12 Healthy HSPC populations from 9 pooled donors were processed identically. For a detailed description, see supplemental Methods. For each patient, we derived 3 comparisons (supplemental Figure 2B): (1) “AML_Engrafting vs AML_non-Engrafting #1” (CD34+CD38− LSC vs CD34−CD38+ blasts for all patients); (2) “AML_Engrafting vs AML_non-Engrafting #2” (CD34+CD38+ LSC vs CD34−CD38+ blasts for DD06, DD08, B06; CD34+CD38− LSC vs CD34+CD38+ blasts for DD13 and HD48; and CD34−CD38− LSC vs CD34−CD38+ blasts for HD20); and (3) “AML_Engrafting vs HSPC” (CD34+CD38− LSC vs CD34+CD38− HSPC for all patients). Pearson correlation coefficients for ratios were calculated in Excel (Microsoft). Proteins with an adjusted value of P < .01 and log2 fold-change >1 or <−1 were considered to be differentially expressed.
To find proteins characteristic for LSCs, we defined 2 analyses (supplemental Figure 2C): (1) LSC vs blast and (2) LSC vs HSPC: (1) was based on “AML_Engrafting vs AML_non-Engrafting #1” comparisons excluding all hits that showed a significant regulation in the opposite direction in the “AML_Engrafting vs AML_non-Engrafting #2” comparisons; (2) was based on “AML_Engrafting vs HSPC” restricted to proteins defined in (1) with consistent direction of regulation in (1) and (2).
The data from the individual patient samples were grouped according to their mutational profiles into FLT3–internal tandem duplication (FLT3-ITD)/nucleophosmin 1 (NPM1)–mutated (mut) and FLT3–wild type (WT)/NPM1-WT. Hits quantified in at least 2 of the 3 replicates were used. Significant hits were defined as the adjusted P value (padj) <.01 and log2 fold-change >1 or <−1.
RNA-Seq, correlation to proteome, and determination of alternative splicing
RNA-Seq was performed as described.14 For LSC vs blast comparison, engrafting fractions were compared with nonengrafting fractions; for LSC vs HSPC comparison, engrafting fractions were compared with HSPCs per AML subtype including the individual patient as cofactor. These lists were used for gene-set enrichment analysis (GSEA) using standard parameters. To correlate RNA and protein data on individual hits, differential expression on protein level from the LSC vs blast comparison was mapped to the corresponding differential transcript expression of “AML_Engrafting vs AML_non-Engrafting #1,” thus applying identical analytic strategies for both levels. Alternative splicing was determined using the “Whippet” tool with standard parameters.15
Cloning, lentivirus production, and CFU assays
Short hairpin RNA (shRNA) against CRIP2 and MBOAT7 messenger RNAs (mRNAs) were purchased from Sigma-Aldrich with the AgeI/EcoRI overhangs and cloned into the pLKO-Tet-On vector. Lentivirus production and selection of transduced MOLM-13 AML cells were performed as described.12 Puromycin-resistant cells were induced with doxycycline (1 µg/mL) leading to knockdown efficiencies of >50% as determined by quantitative polymerase chain reaction (qPCR). Colony-forming unit (CFU) assays were performed as described.12
Data analysis, visualization and availability
For data analysis and visualization, we used Microsoft Excel, Prism 8 (GraphPad), Morpheus (https://software.broadinstitute.org/morpheus), the Database for Annotation, Visualization and Integrated Discovery (DAVID) Bioinformatics Resources v.6.8,16 and Adobe Illustrator CS6. Differential gene expression was assessed by DESeq217 with R v.3.3.1 in R Studio (v.0.99.903) (R Project for Statistical Computing).
Raw mass spectrometry proteome data and search results have been deposited to the ProteomeXchange Consortium (http://proteomecentral.proteomexchange.org) via the Proteomics Identifications Database (PRIDE) partner repository18 with the data set identifier PXD008307. Sequencing data were deposited in the European Genome-phenome Archive (EGA) under accession code EGAS00001004402.
Results
For 6 AML patients of 2 different AML subtypes (FLT3-ITD/NPM1-mut and FLT3-WT/NPM1-WT), we previously analyzed proteomic data of LSC and blast populations (Figure 1A, top right).12 Here, we extend the study to in-depth quantitative multiplex proteomic characterization of FACS-sorted bone marrow–derived and age-matched human HSPCs (Figure 1A, top left; Figure 1C). We have interrogated the combined data sets to find LSC-specific proteins absent or only lowly expressed in HSPCs. Furthermore, we have generated transcriptome data of 27 LSC and blast populations including those that had been subjected to proteome analysis (Figure 1A, bottom right) as well as HSPCs (Figure 1A, bottom left) enabling the direct proteome-transcriptome correlation.

Experimental setup and functional validation of LSC populations. (A) Integration of proteomic (top row) and transcriptomic (bottom row) data sets of healthy HSPC (left column), LSC and non-LSC populations (right column). Proteome of AML samples (top right) was published earlier.12 (B) Leukemic engraftment potential of sorted populations per patient. Mustard shading indicates populations used for proteomics and transcriptomics; light mustard shading, populations used for additional transcriptomics. (C) Flow cytometric analysis of CD34 and CD38 expression of pooled healthy samples used for proteome. Live, lineage-negative cells are shown, and numbers represent gated events of phenotypic HSPCs. NK, normal karyotype.
Experimental setup and functional validation of LSC populations. (A) Integration of proteomic (top row) and transcriptomic (bottom row) data sets of healthy HSPC (left column), LSC and non-LSC populations (right column). Proteome of AML samples (top right) was published earlier.12 (B) Leukemic engraftment potential of sorted populations per patient. Mustard shading indicates populations used for proteomics and transcriptomics; light mustard shading, populations used for additional transcriptomics. (C) Flow cytometric analysis of CD34 and CD38 expression of pooled healthy samples used for proteome. Live, lineage-negative cells are shown, and numbers represent gated events of phenotypic HSPCs. NK, normal karyotype.
In total, we fractionated bone marrow aspirates from 14 patients into 4 populations (CD34+CD38−, CD34+CD38+, CD34−CD38+, CD34−CD38−), which were tested for their functional capacity to initiate the leukemia by intrafemoral injection into NSG mice. LSC activity was detected mainly, but not exclusively, in CD34+CD38− populations (Figure 1B; supplemental Figure 1). These results are consistent with previous reports, highlighting the necessity of functional studies to detect LSCs and confirm the enrichment of LSCs in CD34+ populations.8,9
Three FACS-sorted HSPC samples (Figure 1C) pooled from 9 age-matched healthy individuals who underwent hip-replacement surgery were incorporated in the proteome analysis (Figure 2A; supplemental Figure 2A; supplemental Table 1). For each patient, we performed 3 comparisons (supplemental Figure 2B): (1) “AML_Engrafting vs AML_non-Engrafting #1”; (2) “AML_Engrafting vs AML_non-Engrafting #2”; and (3) “AML_Engrafting vs HSPC”. Between 3708 and 5145 proteins were robustly quantified for each patient (Figure 2B; supplemental Table 2A). Correlation coefficients between independent replicate comparisons were on average r = 0.85 (±0.11), indicating high reproducibility of the workflow (Figure 2C). Comparison of CD34+CD38− to CD34−CD38+ AML fractions consistently showed higher protein expression levels of CD34 and lower expression levels of CD38, validating the robustness of the data set (Figure 2D). Next, we performed principal component analysis (PCA) for all 3 comparisons and, as expected, AML samples were separated according to their molecular subtype (Figure 2E). Although in the FLT3-ITD/NPM1-mut group all samples clustered closely together, within the FLT3-WT/NPM1-WT group, we found 1 outlier sample (B06). Mutational analysis of other known drivers of leukemogenesis revealed that a RUNX1 mutation was present in both other samples of the FLT3-WT/NPM1-WT group. Although the separation along AML subtypes was most apparent in “AML_Engrafting vs AML_non-Engrafting #1” and “AML_Engrafting vs HSPC” comparisons, the “AML_Engrafting vs AML_non-Engrafting #2” comparison was also partly driven by the surface expression of CD34 and CD38 of the populations compared.
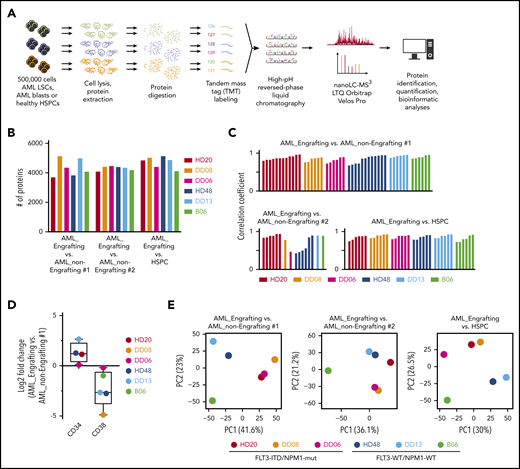
Proteomic workflow and data quality. (A) Proteomic workflow. (B) Number of proteins quantified in at least 2 replicate comparisons within each comparison for each patient. (C) Pearson correlation coefficient for replicate comparisons (ratio values) for each patient. (D) Log2 fold-change of CD34 and CD38 protein expression comparing the “AML_engrafting vs AML_non-Engrafting #1” population. (E) PCA for indicated comparison using all quantified proteins.
Proteomic workflow and data quality. (A) Proteomic workflow. (B) Number of proteins quantified in at least 2 replicate comparisons within each comparison for each patient. (C) Pearson correlation coefficient for replicate comparisons (ratio values) for each patient. (D) Log2 fold-change of CD34 and CD38 protein expression comparing the “AML_engrafting vs AML_non-Engrafting #1” population. (E) PCA for indicated comparison using all quantified proteins.
To find proteins characteristic for LSCs, we integrated the functional data from the xenotransplantation experiments (Figure 1B) and defined 2 main analyses: (1) LSC vs blast and (2) LSC vs HSPC (supplemental Figure 2C). This led to the identification of 3328 to 5013 proteins for LSC vs blast comparisons and between 2695 and 3397 proteins for LSC vs HSPC comparisons (supplemental Table 2B). These proteins were used for downstream analyses. First, we examined whether genes described to be differentially expressed in LSCs at the transcript level were regulated in the same direction also at the protein level. Indeed, if detected, members of the previously reported LSC100 signature9 were consistently regulated along described RNA-expression levels (Figure 3A). Second, we investigated protein-expression levels of suggested LSC markers10 (Figure 3B) and reliable quantification was achieved for IL3RA, CLEC12A, CD33, CD44, CD99, IL1RAP, and CD97. IL3RA, CD44, CD99 and IL1RAP, despite broad heterogeneity, showed enrichment in LSCs compared with blasts. In addition, IL3RA and CD99 protein expression was also higher when LSCs were compared with HSPCs. Thus, our data set confirms IL3RA and CD99 to be candidates for the selective targeting of LSCs and both are currently evaluated in preclinical and clinical trials with promising results.19,20 Third, we calculated differentially expressed proteins of each individual sample. We found between 275 and 1044 differentially expressed proteins in the LSC vs blast comparisons (supplemental Figure 3A; supplemental Table 2B) and between 338 and 593 differentially expressed proteins in the LSC vs HSPC comparisons (supplemental Figure 3B; supplemental Table 2B).
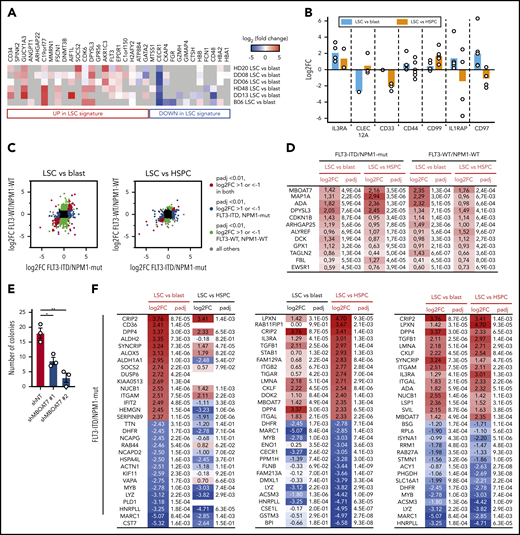

Differentially expressed proteins in LSC vs blast and LSC vs HSPC comparisons. (A) Heat map representation of protein expression of members of the LSC100 AML stem cell signature.9 (B) Log2 fold protein expression of proposed LSC markers in the indicated comparison. Each dot represents an individual AML sample. (C) Log2 fold-change (FC) in indicated comparison in FLT3-ITD/NPM1-mut AML (x-axis) vs FLT3-WT/NPM1-WT AML samples (y-axis). (D) Proteins significantly (padj < .01) overexpressed in both LSC vs blast and LSC vs HSPC comparisons in both AML subgroups. (E) CFU assay using MOLM13 cells after induced knockdown of MBOAT7 with 2 different hairpins (shMBOAT7 #1 and #2) and a nontargeting control (shNT). Each dot represents 1 culture, 2-sided Student t test. (F-G) Top 15 and bottom 15 proteins for LSC vs blast (left), LSC vs HSPC (middle), and combined (right) comparisons. (F) FLT3-ITD/NPM1-mut AML samples. (G) FLT3-WT/NPM1-WT cases. (H) Validation of selected LSC surface proteins by flow cytometry in n = 15 AML samples (n = 7 FLT3-ITD/NPM1-mut and n = 8 FLT3-WT/NPM1-WT cases) and n = 5 HSPC samples. (I) CFU assay using MOLM13 cells after induced knockdown of CRIP2 with 2 different hairpins (shCRIP2 #1 and #2) and a nontargeting control (shNT). Each dot represents 1 culture, 2-sided Student t test.
Differentially expressed proteins in LSC vs blast and LSC vs HSPC comparisons. (A) Heat map representation of protein expression of members of the LSC100 AML stem cell signature.9 (B) Log2 fold protein expression of proposed LSC markers in the indicated comparison. Each dot represents an individual AML sample. (C) Log2 fold-change (FC) in indicated comparison in FLT3-ITD/NPM1-mut AML (x-axis) vs FLT3-WT/NPM1-WT AML samples (y-axis). (D) Proteins significantly (padj < .01) overexpressed in both LSC vs blast and LSC vs HSPC comparisons in both AML subgroups. (E) CFU assay using MOLM13 cells after induced knockdown of MBOAT7 with 2 different hairpins (shMBOAT7 #1 and #2) and a nontargeting control (shNT). Each dot represents 1 culture, 2-sided Student t test. (F-G) Top 15 and bottom 15 proteins for LSC vs blast (left), LSC vs HSPC (middle), and combined (right) comparisons. (F) FLT3-ITD/NPM1-mut AML samples. (G) FLT3-WT/NPM1-WT cases. (H) Validation of selected LSC surface proteins by flow cytometry in n = 15 AML samples (n = 7 FLT3-ITD/NPM1-mut and n = 8 FLT3-WT/NPM1-WT cases) and n = 5 HSPC samples. (I) CFU assay using MOLM13 cells after induced knockdown of CRIP2 with 2 different hairpins (shCRIP2 #1 and #2) and a nontargeting control (shNT). Each dot represents 1 culture, 2-sided Student t test.
To derive conclusions beyond individual samples, we grouped AML cases according to their mutational profiles into FLT3-ITD/NPM1-mut and FLT3-WT/NPM1-WT. On aggregated level, between 126 and 617 differentially expressed proteins were detected when comparing LSC vs blast and LSC vs HSPC, respectively (supplemental Figure 3C-D; supplemental Table 2C).
As expected from the separations in the PCA analyses (Figure 2E), the overlap of significant LSC proteins across AML subtypes was limited (Figure 3C). However, we found several LSC proteins common to all comparisons and subtypes (Figure 3D) that likely contribute to AML stem cell function: MBOAT7 (also known as LPIAT1) is a membrane-bound phospholipid-remodeling enzyme that transfers arachidonic acid to lysophosphatidylinositol. Recently, intracellular phospholipid levels have been described to participate in the regulation of AML stemness.21 Knockdown of MBOAT7 using MOLM-13 as an exemplary AML cell line led to a significant decrease in CFU potential using 2 different hairpins (Figure 3E; supplemental Figure 3E). Adenosine deaminase modulates signaling by controlling extracellular adenosine, and its binding to dipeptidyl-peptidase IV (DPP4) regulates cell adhesion.22 ARHGAP25 is a GTPase-activating protein that regulates HSPC mobilization by enhancing CXCL12 signaling.23 ALYREF is a nuclear export protein and this protein group may represent a therapeutic target in AML.24 The ribosomal RNA (rRNA) 2′-O-methyltransferase fibrillarin is a component of nucleolar small nuclear ribonucleoproteins participating in rRNA processing, highlighting a putative role of this pathway in LSCs beyond AML cases with AML-ETO1 translocations.25
In the FLT3-ITD/NPM1-mut group (Figure 3F), we found several cell surface proteins to be overexpressed in LSCs when compared with blasts and HSPCs, including cell adhesion molecules (ITGAM, ITGAL, LPXN) and receptors (IL3RA, DPP4). Leupaxin (LPXN) is a recurrent fusion partner in translocations identified in AML that promotes proliferation, adhesion, and invasion.26 DPP4 (CD26) has been described to be aberrantly expressed in stem cells of chronic myeloid leukemia, but not AML, disrupting LSC-niche interactions by degrading SDF-1.27 The most highly overexpressed protein in LSCs was the LIM domain transcription factor CRIP2. CRIP2 is associated with chemotherapy resistance in T-ALL as well as AML and is upregulated in response to EZH2 inactivation.28,29 Within a miR-365-HOXA9-HIF-1α regulatory axis, CRIP2 promotes oxidative phosphorylation (OXPHOS) and represses glycolysis,30 thus stabilizing metabolic features characteristic for AML stem cells. Also CD36, which was among the top hits when comparing LSC vs blast, but not quantified in the LSC vs HSPC comparison, contributes to chemotherapy resistance by enhancing OXPHOS31 and by localizing to adipose tissue as niche support.32 In the FLT3-WT/NPM1-WT group, G-protein γ subunit 11 (GNG11) and Sestrin-1 (SESN1) were most highly expressed in LSCs (Figure 3G). Although the function of GNG11 is largely unknown, the sestrin proteins serve as important regulators of metabolic homeostasis and its inactivation can lead to oxidative damage and mitochondrial dysfunction.33
To validate our findings in an extended set of primary AMLs and HSPCs, we FACS-quantified surface expression of CD36, CD26, and CD123 on phenotypically defined LSC and blast populations. As expected from the proteome data, surface expression was highest in LSCs, predominantly in the FLT3-ITD/NPM1-mut group (Figure 3H). Furthermore, knockdown of CRIP2 in MOLM-13 AML cells that carry a FLT3-ITD mutation led to a significant decrease in CFU potential using 2 different hairpins (Figure 3I; supplemental Figure 3F).
To explore pathways predominantly active in LSCs, we conducted GSEA using Kyoto Encyclopedia of Genes and Genomes (KEGG) and Hallmark gene sets on the proteome data for FLT3-ITD/NPM1-mut and FLT3-WT/NPM1-WT AMLs (Figure 4; supplemental Table 2D). Among the pathways that were significantly enriched in LSCs when compared with blasts and to HSPCs, we found interferon γ response, cell adhesion molecules, and oxidative phosphorylation in the FLT3-ITD/NPM1-mut subtype and spliceosome in FLT3-WT/NPM1-WT samples. Interestingly, although oxidative phosphorylation was enriched in LSCs in the FLT3-ITD/NPM1-mut subtype, the glycolytic pathway was significantly lower in LSCs of the FLT3-WT/NPM1-WT subtype, thus indicating that the predominant utilization of OXPHOS, and not glycolysis, as a general feature of LSCs may be achieved by the regulation of complementary metabolic pathways. Other examples of subtype-specific differences include interferon γ response, which was significantly enriched in LSCs of the FLT3-ITD/NPM1-mut subtype in contrast to FLT3-WT/NPM1-WT samples. As we reported previously, the most highly enriched process in LSCs when compared with blasts across both subtypes was the degradation of branched chain amino acids (valine, leucine, and isoleucine).12 In addition, we found several other metabolic pathways to be overrepresented in LSCs, for example, TCA cycle, PPAR signaling, fatty acid and glycerophospholipid metabolism, as well as propanoate and butanoate metabolism.
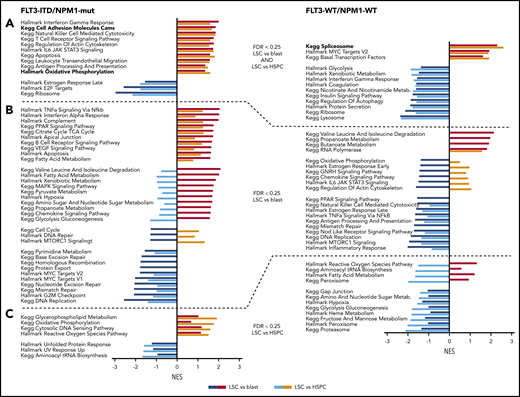
Pathways overrepresented in LSCs. GSEA of LSC vs blast and LSC vs HSPC comparisons using KEGG and HALLMARK gene sets. (A) Gene sets significant in both comparisons. (B) Gene sets significant in LSC vs blast. (C) Gene sets significant in LSC vs HSPC comparisons. Pathways in bold are further analyzed in Figure 5. NES, normalized enrichment score.
Pathways overrepresented in LSCs. GSEA of LSC vs blast and LSC vs HSPC comparisons using KEGG and HALLMARK gene sets. (A) Gene sets significant in both comparisons. (B) Gene sets significant in LSC vs blast. (C) Gene sets significant in LSC vs HSPC comparisons. Pathways in bold are further analyzed in Figure 5. NES, normalized enrichment score.
In agreement with a more proliferative state of blasts,34 DNA replication, cell cycle, ribosome, G2M checkpoint, and protein translation showed a significant enrichment in blasts populations.
Next, we analyzed selected LSC-enriched pathways in more detail (Figure 5). Cell adhesion pathways have been described to play critical roles within the bone marrow microenvironment contributing to self-renewal and differentiation of healthy and diseased hematopoietic stem cells.35 Among LSC-enriched cell adhesion molecules, we found members of the integrin (ITGAL, ITGB2, ITGAM) and immunoglobulin superfamilies (ICAM, PECAM, ALCAM, F11R) and, interesting, also HLA proteins of classes 1 and 2 (Figure 5A). Apart from its critical role in allogenic stem cell transplantation settings, these results indicate that HLA proteins also are involved in the maintenance of LSCs or may link to immune escape strategies. We confirmed the surface expression of several adhesion molecules in LSCs of FLT3-ITD/NPM1-mut cases by flow cytometry in a larger cohort (Figure 5B).
![Protein expression of members in LSC-specific selected pathways. Heat map representation of log2 fold-change protein expression of indicated comparisons showing members of the KEGG cell adhesion molecules (A), Hallmark oxidative phosphorylation (C), and KEGG spliceosome (D) pathways. (B) Validation of selected cell adhesion surface proteins by flow cytometry in n = 15 AML samples (n = 7 FLT3-ITD/NPM1-mut and n = 8 FLT3-WT/NPM1-WT cases) and n = 5 HSPC samples. (E) Number of significantly spliced exons (false discovery rate [FDR] <0.1, Δ-PSI >0.1) in LSC vs blast comparison of FLT3-ITD/NPM1-mut (HD20, DD06, DD07, DD08) and FLT3-WT/NPM1-WT (HD48, DD10, DD13, with or without outlier sample B06) groups. (F) Δ-PSI values of common and significantly sliced exons in both groups (left), quantified in violin plot representation (right). Paired Student t test. PSI, percent-spliced-in as determined by Whippet.15](https://ash.silverchair-cdn.com/ash/content_public/journal/blood/136/13/10.1182_blood.2019003654/1/m_bloodbld2019003654f5.png?Expires=1769092068&Signature=dXu~WdOOelq9PPQ3ObxLplr~Ewy8R6ywIoHvL5HbtuoE~3~iF9Mn20dm1Bgx3LriokrIQziCie7DOSwL83NXaF447n1EbudmnNdIqkei-p7EmQqlHapaBdxSty7s0e~Pr~oQjYlyCkjEEPkSaYmY8oroLhLtLTjvDr7rair1KST3ShLn7qNOOEV17wNt-wGUONjNPFvVq~Bpcud73ZJwKMKmqvFfjTQW3bVpS-1vpPNvLluYNaQT1rGPq2eGOhDQZ6H2MI6e7iqrRhIBjkeUFCjiJV1BqgGrXECqmNKwPYGpSeLvI7e7cG21Gp0ueysdbmBBWI8PH8AvGRE7iAaL0w__&Key-Pair-Id=APKAIE5G5CRDK6RD3PGA)
Protein expression of members in LSC-specific selected pathways. Heat map representation of log2 fold-change protein expression of indicated comparisons showing members of the KEGG cell adhesion molecules (A), Hallmark oxidative phosphorylation (C), and KEGG spliceosome (D) pathways. (B) Validation of selected cell adhesion surface proteins by flow cytometry in n = 15 AML samples (n = 7 FLT3-ITD/NPM1-mut and n = 8 FLT3-WT/NPM1-WT cases) and n = 5 HSPC samples. (E) Number of significantly spliced exons (false discovery rate [FDR] <0.1, Δ-PSI >0.1) in LSC vs blast comparison of FLT3-ITD/NPM1-mut (HD20, DD06, DD07, DD08) and FLT3-WT/NPM1-WT (HD48, DD10, DD13, with or without outlier sample B06) groups. (F) Δ-PSI values of common and significantly sliced exons in both groups (left), quantified in violin plot representation (right). Paired Student t test. PSI, percent-spliced-in as determined by Whippet.15
Protein expression of members in LSC-specific selected pathways. Heat map representation of log2 fold-change protein expression of indicated comparisons showing members of the KEGG cell adhesion molecules (A), Hallmark oxidative phosphorylation (C), and KEGG spliceosome (D) pathways. (B) Validation of selected cell adhesion surface proteins by flow cytometry in n = 15 AML samples (n = 7 FLT3-ITD/NPM1-mut and n = 8 FLT3-WT/NPM1-WT cases) and n = 5 HSPC samples. (E) Number of significantly spliced exons (false discovery rate [FDR] <0.1, Δ-PSI >0.1) in LSC vs blast comparison of FLT3-ITD/NPM1-mut (HD20, DD06, DD07, DD08) and FLT3-WT/NPM1-WT (HD48, DD10, DD13, with or without outlier sample B06) groups. (F) Δ-PSI values of common and significantly sliced exons in both groups (left), quantified in violin plot representation (right). Paired Student t test. PSI, percent-spliced-in as determined by Whippet.15
Oxidative phosphorylation has recently gained attention as a key metabolic pathway preferentially active in LSCs.36,37 When comparing LSCs to blasts and HSPCs, the top hits within this pathway were IDH3A, IDH3G, and IDH3B (Figure 5C). Although IDH1 and IDH2 are well characterized and frequently mutated in AML38,39 and brain tumors,40 IDH3 isoforms are understudied. In addition, several components of electron transport chain (ETC) complex V (ATP6V1H, ATP6V1E1, ATP6V1D, ATP5J, ATP5A1, ATP5I, ATP5L, ATP5F1, ATP5O, ATP5C1) and ETC complex I (NDUFS2, NDUFS6, NDUFA4, NDUFS3, NDUFV1, NDUFV2, NDUFS1) were overexpressed in LSCs.
In the FLT3-WT/NPM1-WT subgroup, the spliceosome pathway was most prominently enriched in LSCs. Mutations in splicing factors occur frequently in a variety of hematologic malignancies, including myelodysplastic syndromes41,42 and AML43 and nongenetic deregulation of splicing has been associated with aging of HSPCs and secondary AML.44 Our data show that virtually all components of the splicing machinery detected in the proteome analysis are overrepresented in LSCs, suggesting a relevant role also for de novo AMLs (Figure 5D). We validated this finding in our corresponding RNA-Seq data sets showing more alternative splicing (AS) events in LSCs compared with blasts and to HSPCs of the FLT3-WT/NPM1-WT group, especially pronounced when outlier sample B06 was excluded from the analysis (Figure 5E; supplemental Figure 4). Although we did not observe differences in particular types of AS events, spliced nodes quantified in both groups showed a significantly higher level of AS in the FLT3-WT/NPM1-WT group compared with FLT3-ITD/NPM1-mut AMLs (Figure 5F; supplemental Figure 4).
Molecular properties of LSC populations have predominantly been studied at the transcript level. However, as a large number of posttranscriptional mechanisms exist, the transcriptome and proteome can vary significantly in a cell type-specific manner.45 Therefore, whereas large transcriptomic data sets for leukemic cells and even LSCs do exist, they inherently lack information about posttranscriptional control of protein expression. To correlate the proteome with the transcriptome, we performed RNA sequencing of the same LSC and blast fractions as well as HSPCs for which proteome data had been generated. Furthermore, we analyzed LSC and blast fractions of additional 3 AML patients (supplemental Table 3A). AML stemness gene signatures,8,9 originally derived from transcriptome data, were even more prominently enriched in LSCs (supplemental Figure 5A). Of the quantified proteins in LSC vs blast comparisons, we were able to assign 97.1% (4271 of 4399, FLT3-ITD/NPM-mut) and 97.5% (3999 of 4101, FLT3-WT/NPM1-WT) to their corresponding transcripts (supplemental Table 3B). Hits significant at both levels (due to the different setup of proteome and transcript experiments we applied a significance level padj <.05 for transcriptomic data) were highly correlated (Figure 6A). To assess the additional value of proteome data, we focused on hits that were significant in the proteome data set and not significant in the transcriptome data set (blue in Figure 6A) and vice versa (green). At the protein level, metabolic pathways were particularly enriched in LSCs in both subtypes, including carbon metabolism, branched chain amino acid degradation, citrate cycle, glycolysis/gluconeogenesis, and propanoate metabolism (Figure 6B; supplemental Table 3C). Common processes enriched in blasts were ribosome, DNA replication and RNA transport. Information derived from hits significant at the RNA but not the protein level was limited. To exclude the possibility that these results were driven by technical differences and significance thresholds, we applied GSEA on RNA data (supplemental Figure 5B-C; supplemental Table 3D) and mapped the results to GSEA on the protein data (Figure 4; supplemental Table 2D). Enrichment of 172 (FLT3-ITD/NPM1-mut) and 169 (FLT3-WT/NPM1-WT) KEGG and Hallmark gene sets was calculated at both transcript and protein level. We found a substantial number of gene sets enriched in an anticorrelated direction between protein and RNA. Compared with gene sets with consistent regulation at protein and RNA level, metabolic pathways were more frequent in the anticorrelated subset, including fatty acid and glycerolipid metabolism, pyruvate metabolism, propanoate and butanoate metabolism or TCA cycle (Figure 6C-E; supplemental Table 3E). These results indicate that expression of metabolic proteins underlie a substantial degree of posttranscriptional regulation in AML. Furthermore, the comparison LSC vs HSPC at protein and RNA level also revealed many anticorrelated gene sets (Figure 6F; supplemental Table 3E). These data show that transcriptomic data cannot simply be extrapolated to the protein expression landscape and highlight the requirement for proteome analyses to fully catalog the protein repertoire of leukemic cells.
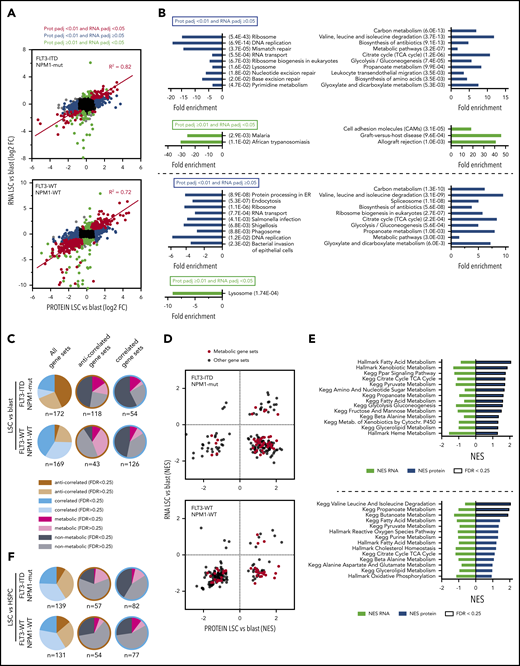
Correlation of proteome and transcriptome data sets. (A) Log2 fold-change at protein level (x-axis) vs RNA level (y-axis). Significant changes at RNA (padj <.05 in green), protein (padj <.01 in blue), and both levels (in red) are highlighted. Correlation coefficient R2 is shown for significant hits at both levels. (B) KEGG pathways overrepresented in hits significant at protein level and not significant at RNA level (blue) or vice versa (green). Fold enrichment and P value at protein level are shown. (C) Correlation of GSEA of KEGG and Hallmark gene sets on protein and RNA level in LSC vs blast comparisons. Correlated: unidirectional enrichment on both levels; anticorrelated: divergent enrichment on protein and RNA level, respectively. Relative distribution of metabolic and nonmetabolic gene sets per correlated or anticorrelated gene sets. (D) NES of KEGG and Hallmark gene sets at protein (x-axis) vs RNA level (y-axis). Metabolic gene sets are highlighted in red. (E) Selection of metabolic gene sets enriched in LSCs at protein level and not at RNA level. (F) Correlation of GSEA of KEGG and Hallmark gene sets on protein and RNA level in LSC vs HSPC comparisons. For legend, see panel C.
Correlation of proteome and transcriptome data sets. (A) Log2 fold-change at protein level (x-axis) vs RNA level (y-axis). Significant changes at RNA (padj <.05 in green), protein (padj <.01 in blue), and both levels (in red) are highlighted. Correlation coefficient R2 is shown for significant hits at both levels. (B) KEGG pathways overrepresented in hits significant at protein level and not significant at RNA level (blue) or vice versa (green). Fold enrichment and P value at protein level are shown. (C) Correlation of GSEA of KEGG and Hallmark gene sets on protein and RNA level in LSC vs blast comparisons. Correlated: unidirectional enrichment on both levels; anticorrelated: divergent enrichment on protein and RNA level, respectively. Relative distribution of metabolic and nonmetabolic gene sets per correlated or anticorrelated gene sets. (D) NES of KEGG and Hallmark gene sets at protein (x-axis) vs RNA level (y-axis). Metabolic gene sets are highlighted in red. (E) Selection of metabolic gene sets enriched in LSCs at protein level and not at RNA level. (F) Correlation of GSEA of KEGG and Hallmark gene sets on protein and RNA level in LSC vs HSPC comparisons. For legend, see panel C.
Discussion
In this study, we present quantitative proteomic and transcriptomic analyses of patient-derived and functionally validated AML stem cell populations and of healthy age-matched HSPCs. In line with the literature, we detected broad interpatient heterogeneity and found LSCs in most but not all populations separated by CD34 and CD38 surface expression, highlighting the necessity of functional assays. Our data confirm a number of suggested LSC markers on protein level such as IL3RA and CD99, whereas other markers were not LSC-specific in our data set or showed higher expression in HSPCs. Even though we analyzed a limited number of samples, our study underscores the difficulties in identifying reliable LSC markers that can be exploited for diagnostics or antibody-based therapies, such as antibody-drug conjugates, bispecific antibodies or chimeric antigen receptor T cells. Our work and recent literature suggest that LSCs use characteristic amino acid,12,46 energy,36,47,48 and lipid metabolism.32,49,50 Thus, strategies to modulate these very fundamental aspects of cell biology may represent a more comprehensive type of therapy that will be broadly effective despite interpatient and intrapatient heterogeneity and plasticity of LSC phenotypes. Along these lines, oxidative phosphorylation represents an important metabolic alteration specific for LSCs. We highlight novel potential targets including MBOAT7, CRIP2, several components of ETC complex I and V, and IDH3 isoforms. Although inhibition of ETC complex 1 showed selective toxicity against AMLs carrying NPM1, FLT3, and DNMT3A mutations,51 targeting additional components of the ETC may be synergistic and thus applicable for a broader range of leukemias. In addition, targeting glycerophospholipid metabolism may represent another angle of LSC-specific therapies.
Mutations in splicing factors occur frequently in a variety of hematologic malignancies, including myelodysplastic syndromes41,42 and AML.43 Nongenetic deregulation of splicing has been associated with aging of HSPCs and secondary AML.44 Our data suggest that in de novo AML, especially in the absence of mutations in FLT3 and NPM1, LSCs have an altered splicing machinery setup in place, potentially explaining why de novo AML also show reduced self-renewal capacity when treated with pharmacological spliceosome modulators.44
For mouse HSPCs, we have reported a strong overlap between transcriptome and proteome during homeostasis52 and considerable posttranscriptional regulation in response to acute inflammation.53 The data we have presented here indicate that, in homeostatic LSCs, substantial posttranscriptional regulation is in place as we observed major dissimilarities between RNA and protein. The proteome was particularly powerful in evaluating metabolic properties, which are underappreciated in transcriptomic data sets.
Cellular heterogeneity is a well-accepted driver of therapy resistance in cancer. Although single-cell RNA-Seq technologies have revolutionized our understanding of healthy and leukemic HSPCs,54-59 untargeted proteome analyses still require pooling of cells. Even though our data set is generated from functionally validated LSC populations, cellular heterogeneity within these populations cannot be resolved. Further technological advances60,61 will probably facilitate the extraction of single-cell proteomes in the future, which, in combination with genomic and functional data, will ultimately lead to a better understanding of the oncogenic transformation from healthy HSPCs to preleukemic HSCs and to disease-driving LSCs. Using current state-of-the-art technology, we provide a valuable and comprehensive proteomic resource helping to design LSC-directed therapies that may ultimately improve clinical outcomes of leukemia patients.
The data reported in this article have been deposited in the Proteomics Identifications Database (PRIDE) partner repository (identifier PXD008307) and in the European Genome-phenome Archive (EGA; accession code EGAS00001004402).
The online version of this article contains a data supplement.
The publication costs of this article were defrayed in part by page charge payment. Therefore, and solely to indicate this fact, this article is hereby marked “advertisement” in accordance with 18 USC section 1734.
Acknowledgments
The authors thank all members of HI-STEM for discussions, A. Ehninger for help with AML sample acquisition, the members of the Central Animal Laboratory at DKFZ for animal husbandry, the members of the DKFZ Flow Cytometry Core Facility for expertise and support, and the EMBL Proteomics Core Facility for assistance with mass spectrometry analysis.
This work was supported by the German Research Foundation (DFG; Emmy Noether Fellowship RA 3166/1-1 [S.R.], SFB873 [C.L., A.D.H., and A.T.], FOR 2033 [A.T.] and FOR 2674 [A.T.]); the LeukoSyStem Consortium, funded by the German Federal Ministry of Education and Health (FKZ 01ZX1911D) (S.R.); the SyTASC Consortium, funded by the Deutsche Krebshilfe (A.T., C.T., and L.B.); and the Dietmar Hopp Foundation (A.T.).
Authorship
Contribution: S.R. designed the study, performed xenotransplantation experiments, sorted cells for proteome and transcriptome, and analyzed the data; D.K. helped design the proteome-sampling strategy; M.F. and Z.G. analyzed RNA-Seq data; A.D. and A.P. conducted knockdown experiments; P.Z. helped with mouse experiments; C.L., C.T., A.F., J.W., G.E., A.D.H., and C.M.-T. provided AML samples; M.T. and O.B. provided healthy bone marrow samples; L.B. provided DNA-sequencing data; C.H. supervised transcriptome analysis and performed splicing analyses; J.K. and J.H. helped design the study and generated and analyzed the proteome data; A.T. designed, with S.R., the overall study and supervised it; and S.R. prepared figures and wrote the manuscript with J.K., J.H., and A.T.
Conflict-of-interest disclosure: The authors declare no competing financial interests.
Correspondence: Andreas Trumpp, German Cancer Research Center (DKFZ), Im Neuenheimer Feld 280, 69120 Heidelberg, Germany; e-mail: a.trumpp@dkfz-heidelberg.de; or Jenny Hansson, Division of Molecular Hematology, Department of Laboratory Medicine, Lund University, Sölvegatan 17, BMC B12, 22184 Lund, Sweden; e-mail: jenny.hansson@med.lu.se.

This feature is available to Subscribers Only
Sign In or Create an Account Close Modal